Embed Size (px)
Citation preview

City of Bellevue Project Lead Colin Walker
University Instructor: Andrew Ballard
Student Author: Laila Al-Zeer
CITY OF BELLEVUEIn Partnership with the
University of Washington
Spring 2019
Livable City Year 2018–2019in partnership with
City of Bellevue
RECOMMENDATIONS FOR A NEW BUSINESS INTELLIGENCE
TOOL FOR BELLEVUE PARKS AND COMMUNITY SERVICES

Livable City Year 2018–2019in partnership with
City of Bellevuewww.washington.edu/livable-city-year/
ACKNOWLEDGMENTS
We thank Colin Walker from the City of Bellevue’s Parks and Community Services Department for his partnership. Colin quickly answered our questions, provided us access to key data, connected us to others from his department, and provided timely feedback.
We also appreciate the four department employees who took the time to meet with us and offer their perspectives regarding the current data collection and analysis process: Program Manager Brad Bennett and Assistant Director Shelley Brittingham, who explained the improvements they would like to see; and South Bellevue Community Center Manager Jennifer Newton and South Bellevue Community Center Fitness Manager Joan Perugini, who met with us and gave us a tour of their facilities.
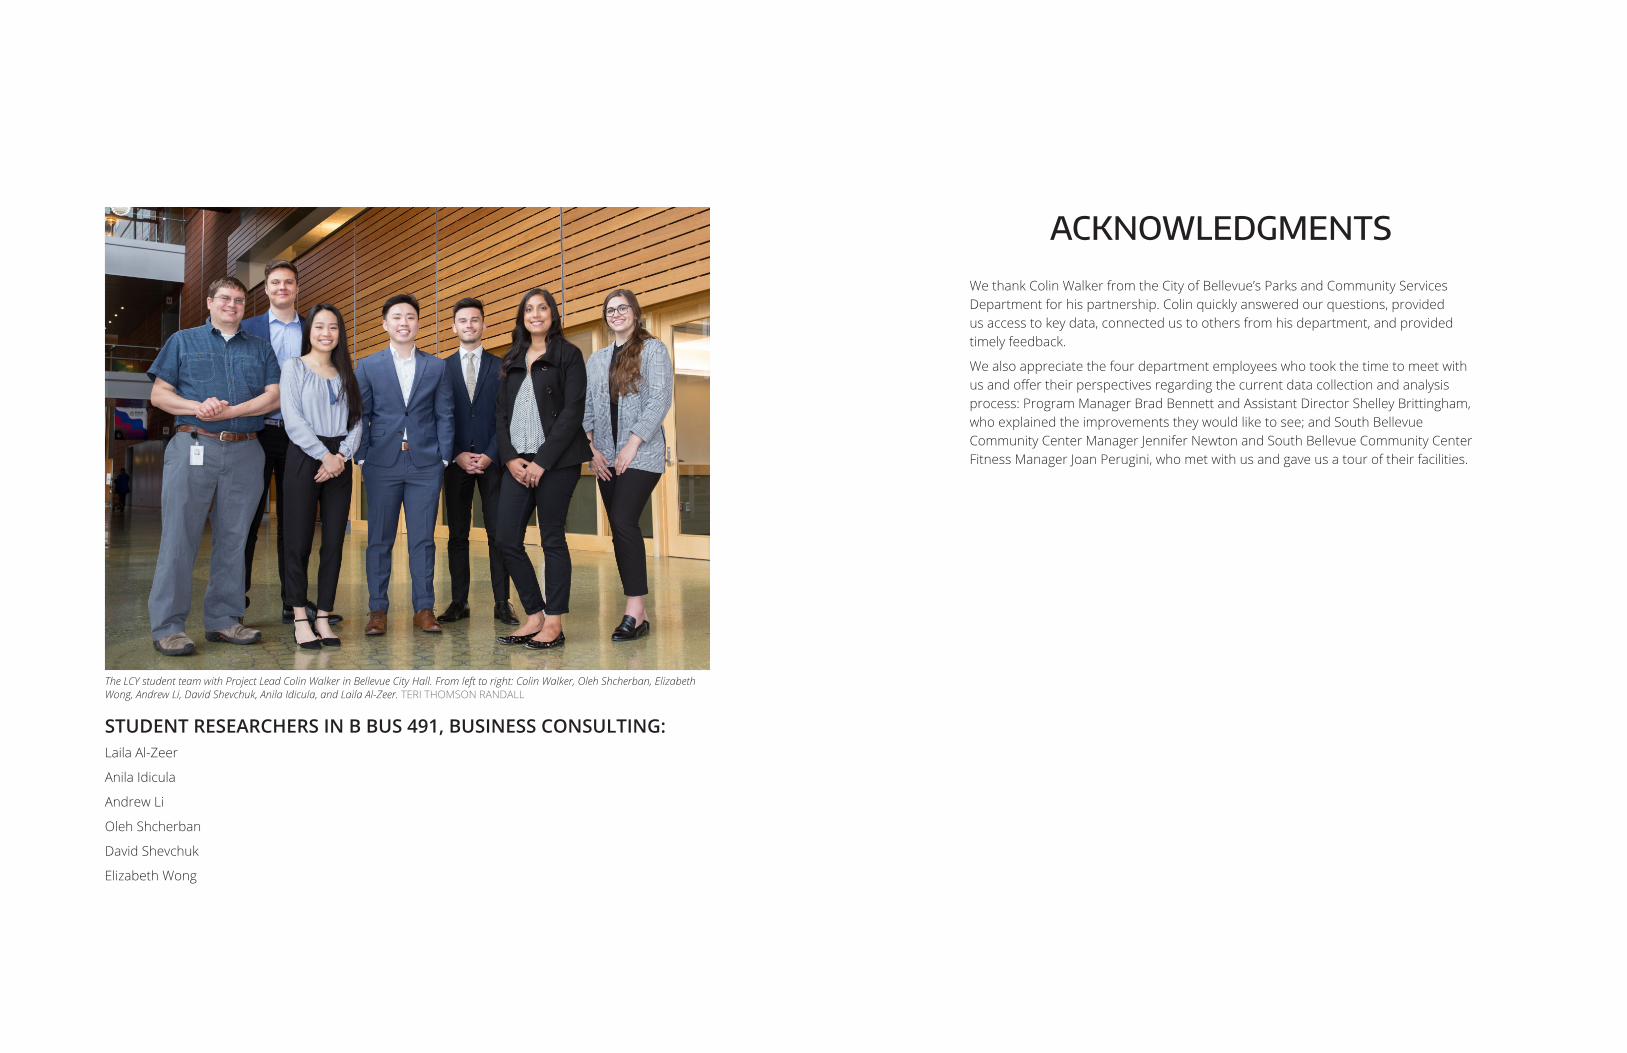
The LCY student team with Project Lead Colin Walker in Bellevue City Hall. From left to right: Colin Walker, Oleh Shcherban, Elizabeth Wong, Andrew Li, David Shevchuk, Anila Idicula, and Laila Al-Zeer. TERI THOMSON RANDALL
STUDENT RESEARCHERS IN B BUS 491, BUSINESS CONSULTING:Laila Al-Zeer
Anila Idicula
Andrew Li
Oleh Shcherban
David Shevchuk
Elizabeth Wong

TABLE OF CONTENTS
About Livable City Year i.
About Bellevue ii.
Bellevue 2035 iii.
Executive Summary 01
Introduction 03
Methods 07
Business Intelligence Tool 11
Implementation 15
Benefits 19
Conclusion 23
Permission to use: This report represents original student work and recommendations prepared by students in the University of Washington’s Livable City Year Program for the City of Bellevue. Text and images contained in this report may be used for not-for-profit purposes.
Recommended citation: Al-Zeer, Laila. Recommendations for a New Business Intelligence Tool for Bellevue Parks and Community Services. Bothell: University of Washington, Livable City Year. 2018–2019.
CREDITSFor this Report
City of Bellevue Project Lead: Colin Walker City Department: Parks and Community Services Instructor: Andrew Ballard University Department: School of Business, UW Bothell Course: B BUS 491 Business Consulting Student Author: Laila Al-Zeer
For the City of Bellevue
Mayor: John Chelminiak Deputy Mayor: Lynne Robinson Council Members Conrad Lee Jared Nieuwenhuis Jennifer Robertson John Stokes Janice Zahn City Manager: Brad Miyake Deputy City Managers Mary Kate Berens Nathan McCommon LCY Program Managers Nancy LaCombe Danielle Verwahren
For the University of Washington LCY Program
LCY Faculty Co-Directors Branden Born Jennifer Otten Program Manager: Teri Thomson Randall Program Assistant: Michelle Abunaja Editor: Liza Higbee-Robinson Graphic Designer: Kirsten Wong Communications: Daimon Eklund
Bellevue’s many parks provide safe spaces for children to ride bikes. CITY OF BELLEVUE
i | LIVABLE CITY YEAR PARKS BUSINESS INTELLIGENCE | ii
ABOUT LIVABLE CITY YEARThe University of Washington’s Livable City Year (LCY) initiative is a partnership between the university and one local government for one academic year. The program engages UW faculty and students across a broad range of disciplines to work on city-defined projects that promote local sustainability and livability goals. Each year hundreds of students work on high-priority projects, creating momentum on real-world challenges while serving and learning from communities. Partner cities benefit directly from bold and applied ideas that propel fresh thinking, improve livability for residents, and invigorate city staff. Focus areas include environmental sustainability; economic viability; population health; and social equity, inclusion and access. The program’s 2018–2019 partner is the City of Bellevue; this follows partnerships with the City of Tacoma (2017–2018) and the City of Auburn (2016–2017).
LCY is modeled after the University of Oregon’s Sustainable City Year Program, and is a member of the Educational Partnerships for Innovation in Communities Network (EPIC-N), an international network of institutions that have successfully adopted this new model for community innovation and change. For more information, contact the program at [email protected].
ABOUT CITY OF BELLEVUEBellevue is the fifth largest city in Washington, with a population of more than 140,000. It’s the high-tech and retail center of King County’s Eastside, with more than 150,000 jobs and a skyline of gleaming high-rises. While business booms downtown, much of Bellevue retains a small-town feel, with thriving, woodsy neighborhoods and a vast network of green spaces, miles and miles of nature trails, public parks, and swim beaches. The community is known for its beautiful parks, top schools, and a vibrant economy. Bellevue is routinely ranked among the best mid-sized cities in the country.
The city spans more than 33 square miles between Lake Washington and Lake Sammamish and is a short drive from the Cascade Mountains. Bellevue prides itself on its diversity. Thirty-seven percent of its residents were born outside of the US and more than 50 percent of residents are people of color, making the city one of the most diverse in Washington state.
Bellevue is an emerging global city, home to some of the world’s most innovative technology companies. It attracts top talent makers such as the University of Washington-Tsinghua University Global Innovation Exchange. Retail options abound in Bellevue and artists from around the country enter striking new works in the Bellwether arts festival. Bellevue’s agrarian traditions are celebrated at popular seasonal fairs at the Kelsey Creek Farm Park.
Bellevue 2035, the City Council’s 20-year vision for the city, outlines the city’s commitment to its vision: “Bellevue welcomes the world. Our diversity is our strength. We embrace the future while respecting our past.” Each project completed under the Livable City Year partnership ties to one of the plan’s strategic areas and many directly support the three-year priorities identified by the council in 2018.

PARKS BUSINESS INTELLIGENCE | iv
ECONOMIC DEVELOPMENTBellevue business is global and local.
TRANSPORTATION AND MOBILITYTransportation is both reliable and predictable. Mode choices are abundant and safe.
HIGH QUALITY BUILT AND NATURAL ENVIRONMENTFrom a livable high-rise urban environment to large wooded lots in an equestrian setting, people can find exactly where they want to live and work.
BELLEVUE: GREAT PLACES WHERE YOU WANT TO BEBellevue is a place to be inspired by culture, entertainment, and nature.
REGIONAL LEADERSHIP AND INFLUENCEBellevue will lead, catalyze, and partner with our neighbors throughout the region.
ACHIEVING HUMAN POTENTIALBellevue is a caring community where all residents enjoy a high quality life.
HIGH PERFORMANCE GOVERNMENTPeople are attracted to living here because they see that city government is well managed.
For more information please visit: https://bellevuewa.gov/city-government/city-council/council-vision
BELLEVUE 2035: THE CITY WHERE YOU WANT TO BE
Bellevue welcomes the world. Our diversity is our strength. We embrace the future while respecting our past.
The seven strategic target areas identified in the Bellevue City Council Vision Priorities are:
Bellevue is the place to be inspired by culture, entertainment, and nature. Learn, relax, shop, eat, cook, read, play, or marvel at our natural environment. Whatever your mood, there is a place for you in Bellevue.
From the sparkling waters of Meydenbauer Bay Park, you can walk or bike east, through Downtown, across the Grand Connection to the Wilburton West center for business and entertainment. Along the way you enjoy nature, culture, street entertainment, a world fusion of food, and people from all over the planet.
For many of us, Bellevue is home. For the rest of the region and the world, Bellevue is a destination unto itself.
The arts are celebrated. Bellevue’s Performing Arts Center is a success, attracting the best in onstage entertainment. Cultural arts organizations throughout the city are supported by private philanthropy and a cultural arts fund. Arts and cultural opportunities stimulate our creative class workers and residents, whether they are members of the audience or performers. The cultural arts attract Fortune 500 companies to our community, whether it is to locate their headquarters or visit for a convention.
The past is honored. Residents experience a sense of place through an understanding of our history.
Our community buildings, libraries, community centers, City Hall, and museums provide places where neighbors gather, connect with each other, and support our civic and business institutions.
Bellevue College, the Global Innovation Exchange (GIX), and our other institutes of higher learning are connected physically and digitally from Eastgate to Bel-Red, Downtown, and the University of Washington in Seattle. We’ve leveraged our commitment to higher education into some of the most successful new companies of the future.
From the constant beat of an urban center, you can quickly escape into nature in our parks, streams, trails, and lakes. You can kayak the slough, hike the lake-to-lake trail, and have the opportunity to enjoy the latest thrill sport.
BELLEVUE: GREAT PLACES WHERE YOU WANT TO BE
BELLEVUE 2035: THE CITY WHERE YOU WANT TO BE
Recommendations for a New Business Intelligence Tool for Bellevue Parks and Community Services supports the Bellevue: Great Places Where You Want To Be target area of the Bellevue City Council Vision Priorities and was sponsored by the Department of Parks and Community Services.
1 | LIVABLE CITY YEAR PARKS BUSINESS INTELLIGENCE | 2
The City of Bellevue’s Parks and Community Services department invited University of Washington, Bothell Business Consulting students to identify a business intelligence tool that would enable it to improve its data analytics approach and enable staff to move through decision-making processes in a more timely and effective manner. By partnering with the UW’s Livable City Year program, the department recruited students to research and assess the effectiveness of different tools and tailor a recommendation. The overarching goal is to make data retrieval more accessible to community center managers and program coordinators, so that they can base their decisions on public interest and need. The ability to interpret data quickly will enable managers to allocate resources where they are most needed, reduce total cost expenditures, and increase foot-traffic to community centers. Microsoft’s Power BI tool would meet the needs of the Parks and Community Services department by providing clear data visuals and user dashboards which are customizable and easy to access and interpret. These features will lend to the operational and decision making efficiencies the department seeks.
Meetings with Parks and Community Services staff provided students with valuable insights related to how data is collected and analyzed by each of the City’s four community centers, as well as how managers use the data to make decisions related to programming, staff scheduling and marketing. Due to time constraints, students knew meeting with managers from each of the City’s four community centers would not be feasible. Students limited their outreach to South Bellevue Community Center managers. Even so, the recommendation presented in this report is intended to be applied by the Parks and Community Services department for all four of Bellevue’s community centers.
BENEFITS• Time previously devoted to data analytics can be used to expand
business and marketing opportunities.• Marketing and communications can be directed intentionally to
populations not already making use of community centers.• Decision making processes will take less time because data will be
easier to access and interpret.• Use of electronic sign-in enables community centers to re-
trieve and make use of more information related to community center attendees.
EXECUTIVE SUMMARY
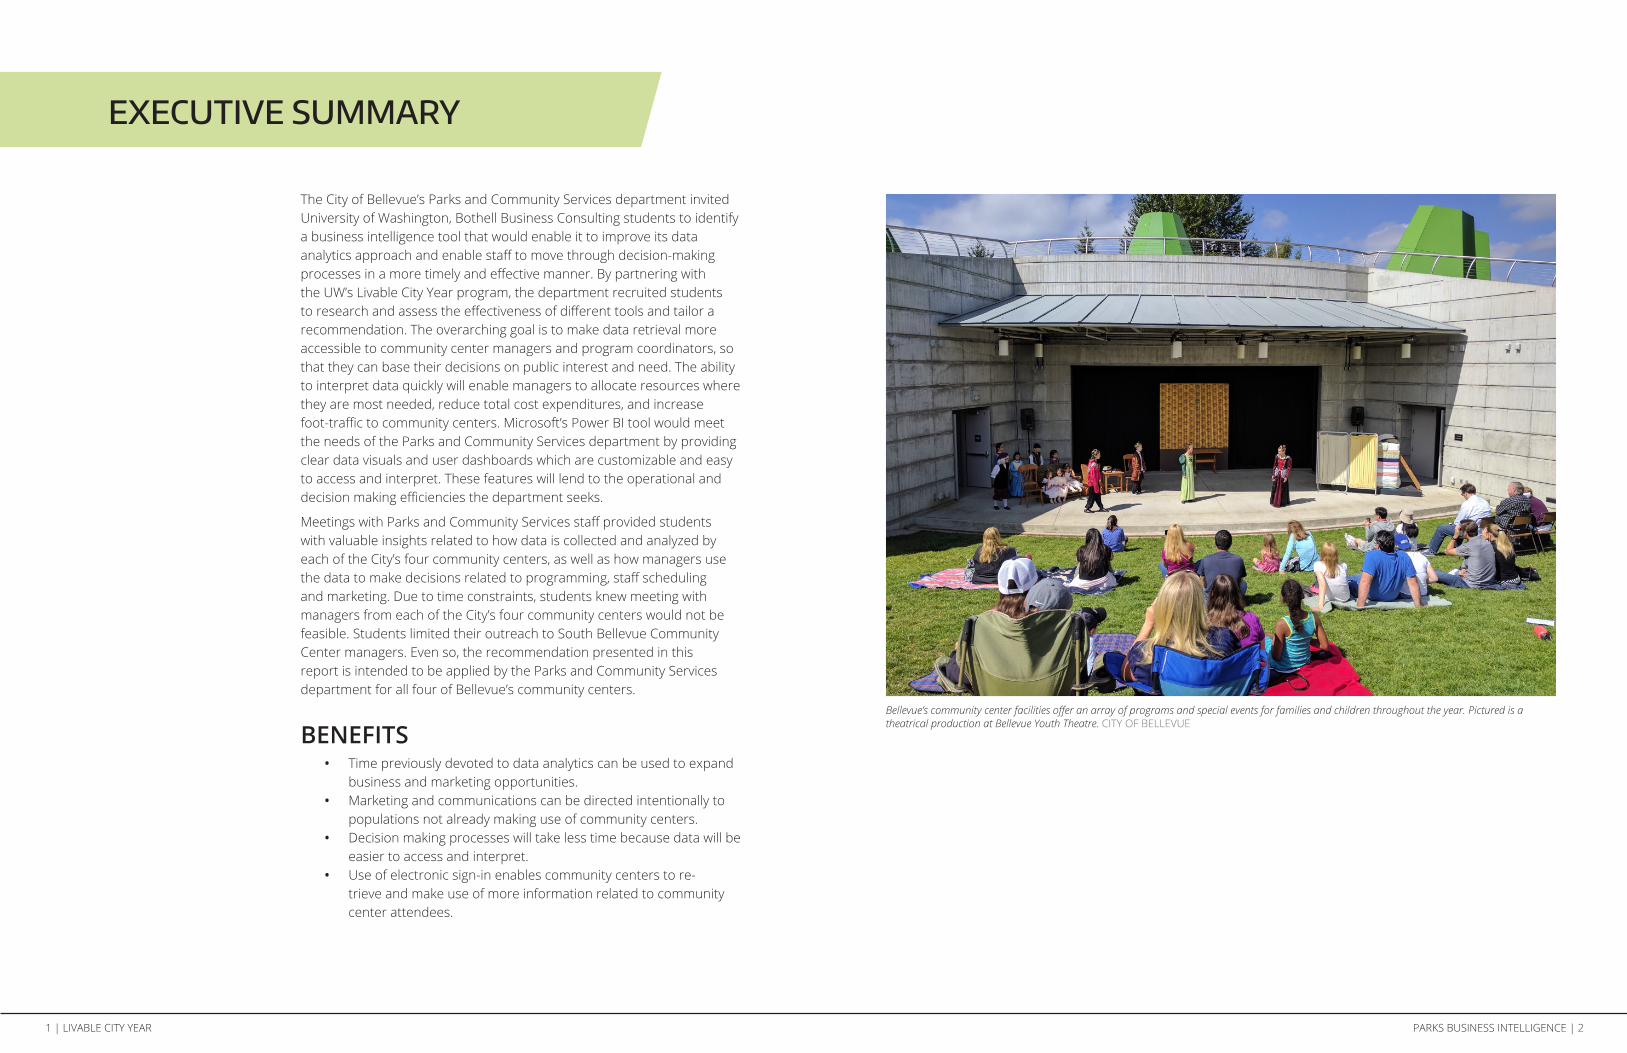
Bellevue’s community center facilities offer an array of programs and special events for families and children throughout the year. Pictured is a theatrical production at Bellevue Youth Theatre. CITY OF BELLEVUE

3 | LIVABLE CITY YEAR PARKS BUSINESS INTELLIGENCE | 4
This Livable City Year report captures a partnership formed between six undergraduate students enrolled in a Business Consulting class at the University of Washington, Bothell’s Business School and staff from the City of Bellevue’s Parks and Community Services department. The City of Bellevue invited students to find a business intelligence tool that would enhance the department’s data analytics system in specific ways. For example, the City would like to integrate a business intelligence tool with its current system so that it can retrieve and digest data in a timely manner.
Research, interviews, and market analysis completed by students led to their understanding of the Parks and Community Services department’s current data collection routines. Students were able to combine their interests and expertise in marketing, finance, supply chain operations, and management of information systems to address the City’s request for the integration of a business intelligence tool.
Marketing Administrator Colin Walker acted as the main point of contact between the Parks and Community Services department and students. From conversations with Colin Walker, students learned about the department’s need for an intuitive business intelligence tool, capable of organizing vast quantities of data collected by Parks & Community Services’ multiple lines of business. Students understood that the tool
would benefit community center managers in making decisions related to scheduling staff and determining new marketing strategies. Students reviewed data collections related to community center attendance, attendee demographics, program success, public response to various events, and time of registration for programs. Students met with staff from the Parks and Community Services department on five occasions to develop and refine their understandings of the department’s goals for using a business intelligence tool and how one could be integrated with the current data analytics system.
The primary reason for using a business intelligence tool is to improve decision making efficiency. Using one will allow Parks & Community Services to maximize the benefit of its limited resources, and enable the department to apply changes to programs and other operations more quickly. Students researched different types of business intelligence tools, looking for one that was both compatible with the City’s current system and financially feasible. They discovered that Microsoft’s Power BI tool would integrate well with the City’s current system, BlueRec. Data collected by BlueRec can be translated by Power BI in a timely manner and provide a customizable dashboard to the users in the department, with visual representations of data and reports that would help them make operational and programmatic decisions.
INTRODUCTION
Zip lining at South Bellevue Community Center CITY OF BELLEVUE
Students combined their expertise inmarketing,finance,supplychain
operations, and management of information systems to address the City’s request for a business
intelligence tool.
5 | LIVABLE CITY YEAR PARKS BUSINESS INTELLIGENCE | 6
THE ROLE OF COMMUNITY CENTERSBellevue’s community centers play an important data collecting role for the Parks and Community Services department, with each community center collecting data on the people who register for programs. Data reveal demographics information, the popularity of programs and classes, and the use of facility amenities. Community centers and department management would like to more effectively use their data to make timely decisions related to staffing needs and program scheduling. In addition, community centers would like to be able to determine marketing and communication strategies to increase foot traffic. To take a deeper dive into the data analytics needs of the Parks and Community Services department, students met with South Bellevue Community Center managers.
INTEGRATING A NEW BUSINESS INTELLIGENCE TOOLSELECTION PROCESSIn order to select a business intelligence tool well matched to the City’s existing system, students cast a wide net and eventually narrowed their field to three tools: Qlik Sense, Microsoft Power BI, and Tableau. Based on different factors, like compatibility with the existing system, user-friendliness, pricing, and interface features, students ultimately selected Microsoft’s Power BI. Power BI generates data reports immediately and enables users to customize their dashboards with the data visuals most useful to them. The tool comes with support from the Microsoft Business Team, who would work with the Parks and Community Services department to ensure optimal use of the tool. In addition, the City has already begun implementing advanced analytics and reporting using PowerBI throughout the enterprise.
IMPLEMENTATIONStudents considered how to integrate the Power BI tool with the department’s current data collection and analytics system. One student met with the Microsoft Business Team to think through successful integration of Power BI and BlueRec. Successful integration of the tool will entail a planning and training meeting with the Microsoft Business Team.
Then, the department will be able to connect the tool to the existing BlueRec system.
BUDGETStudents considered how the City’s Parks and Community Services department can budget for the integration of a new business intelligence tool. An implementation fee for Power BI can be determined during an initial meeting held between the Parks and Community Services department and the Microsoft Business Team. From there, monthly user fees would be based on the number of department staff who use Power BI.
The overarching goal is to make data retrieval more accessible to community center managers and program
coordinators so that they can base their decisions on public interest and need.
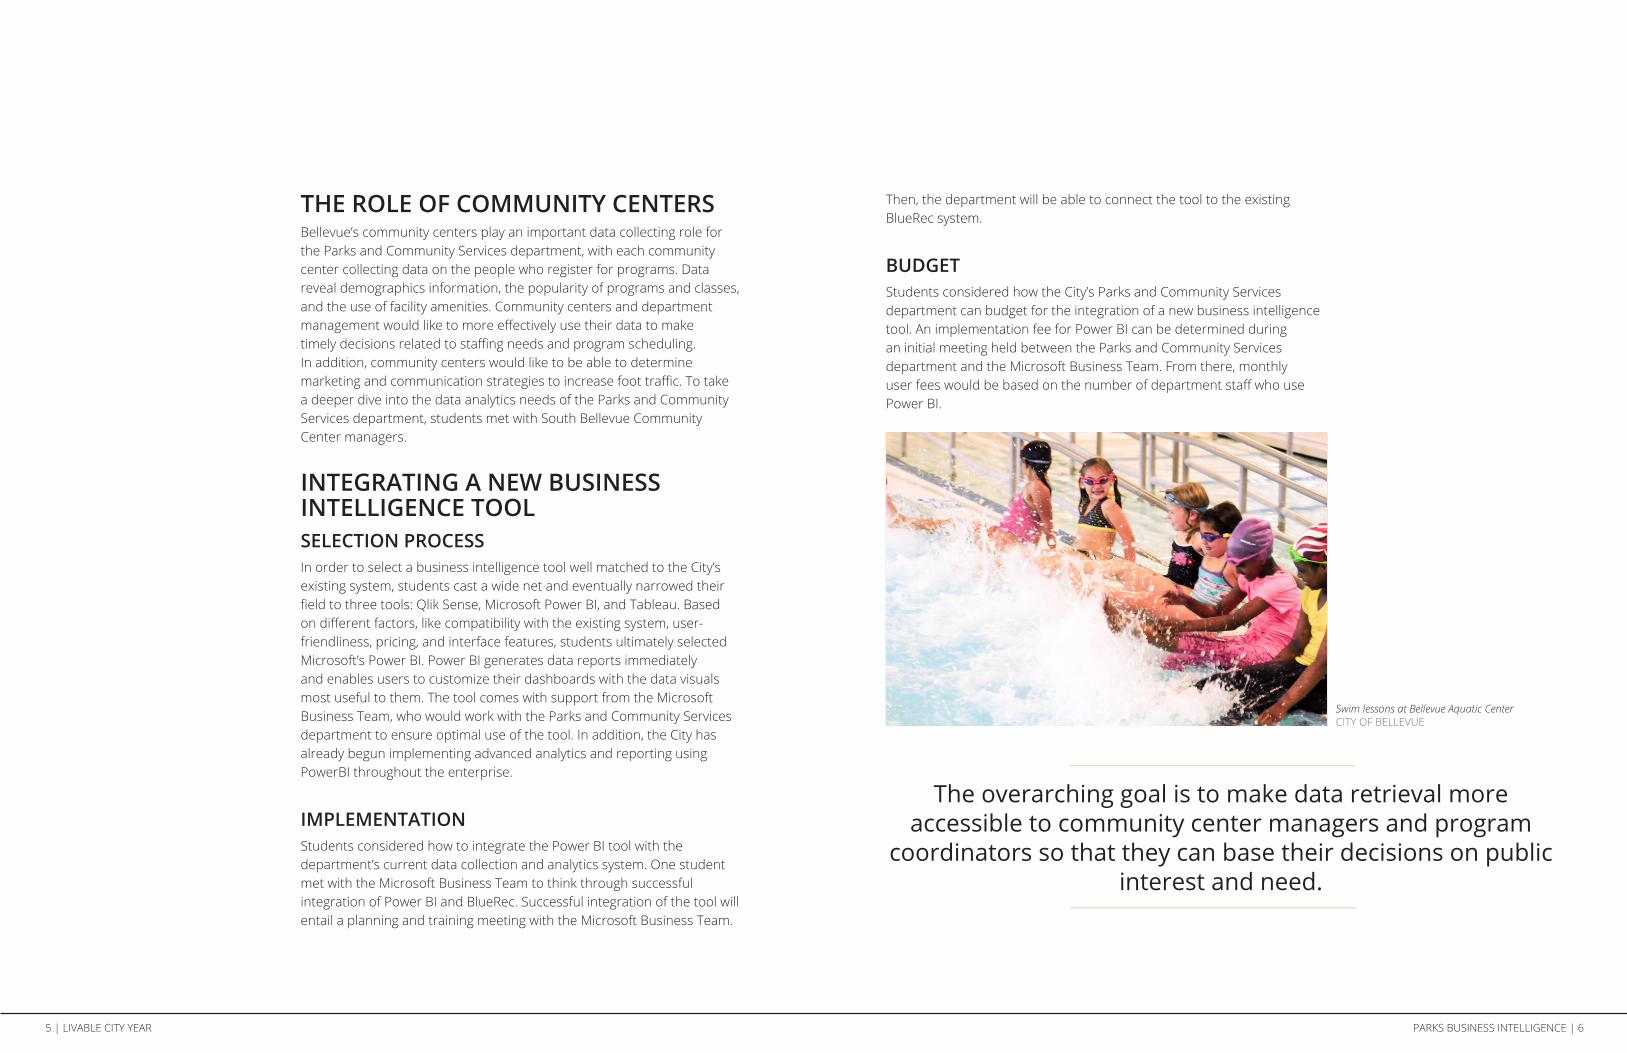
Swim lessons at Bellevue Aquatic CenterCITY OF BELLEVUE

7 | LIVABLE CITY YEAR PARKS BUSINESS INTELLIGENCE | 8
METHODS
Students conducted primary and secondary research in order to determine which business intelligence tool would suit the needs of the City of Bellevue’s Parks and Community Services department. They focused primary research methods on identifying the needs of the City’s Parks and Community Services department, learning from direct encounters with Marketing Administrator Colin Walker and other department staff. Students dedicated secondary research to reviewing and comparing the benefits of different business intelligence tools.
PRIMARY RESEARCHOur team’s primary data collection emerged out of short meetings with different members of the City’s Parks and Community Services department. We met with South Bellevue Community Center Manager Jennifer Newton, and South Bellevue Community Center Fitness Manager Joan Perugini. We also met with Program Manager Brad Bennett and Assistant Director Shelley Brittingham. Marketing Administrator Colin Walker helped us plan these meetings, which took place in the Parks and Community Services department office at Bellevue City Hall.
Students focused their primary data collection on sources from the South Bellevue
Community Center. CITY OF BELLEVUE
During our first meeting, we established the purpose of our project and outlined a realistic timeline for completing our work within ten weeks. Colin Walker showed us how the BlueRec system operates and discussed how a business intelligence tool could enhance the department’s approach to data analytics.
In a subsequent meeting we met with managers of the South Bellevue Community Center, selected as the case model for this project because of the variety of programs, amenities, and events it offers, and because of the sheer quantity of data it collects. Our goal was to learn about the challenges the managers contend with, the data points they rely upon, and the particular improvements they would like to target using a new tool. This meeting occurred at the South Bellevue Community Center, enabling students to walk away with a clear sense of the range of programs and services the facility offers as well as the qualities and capacities an ideal business intelligence tool would provide.
SECONDARY RESEARCHWe relied on secondary research to learn more about the essential functions of business intelligence tools, and to identify those on the market that would suit the needs of the Parks and Community Services department and integrate well with its current system, BlueRec. Before conducting market research on specific tools, we reviewed the basic capacities of business intelligence tools. Once we understood their general purpose and features, we focused our research on the following topics:
1. Features each tool offers2. User-friendliness of each tool3. Cost to set up and operate each tool4. Compatibility of each tool with BlueRec
We focused on three leading business intelligence tools: Tableau, Qlik Sense, and Microsoft Power BI. Tableau is known for its easy-to-interpret visuals and data manipulation. Qlik Sense is known for its range of features and customer satisfaction. Power BI is known for offering easy-to-understand reports for complex datasets and for offering competitive fees. After narrowing our field to these three tools, we continued to refine our research related to features, user-friendliness, cost, and compatibility.
9 | LIVABLE CITY YEAR PARKS BUSINESS INTELLIGENCE | 10
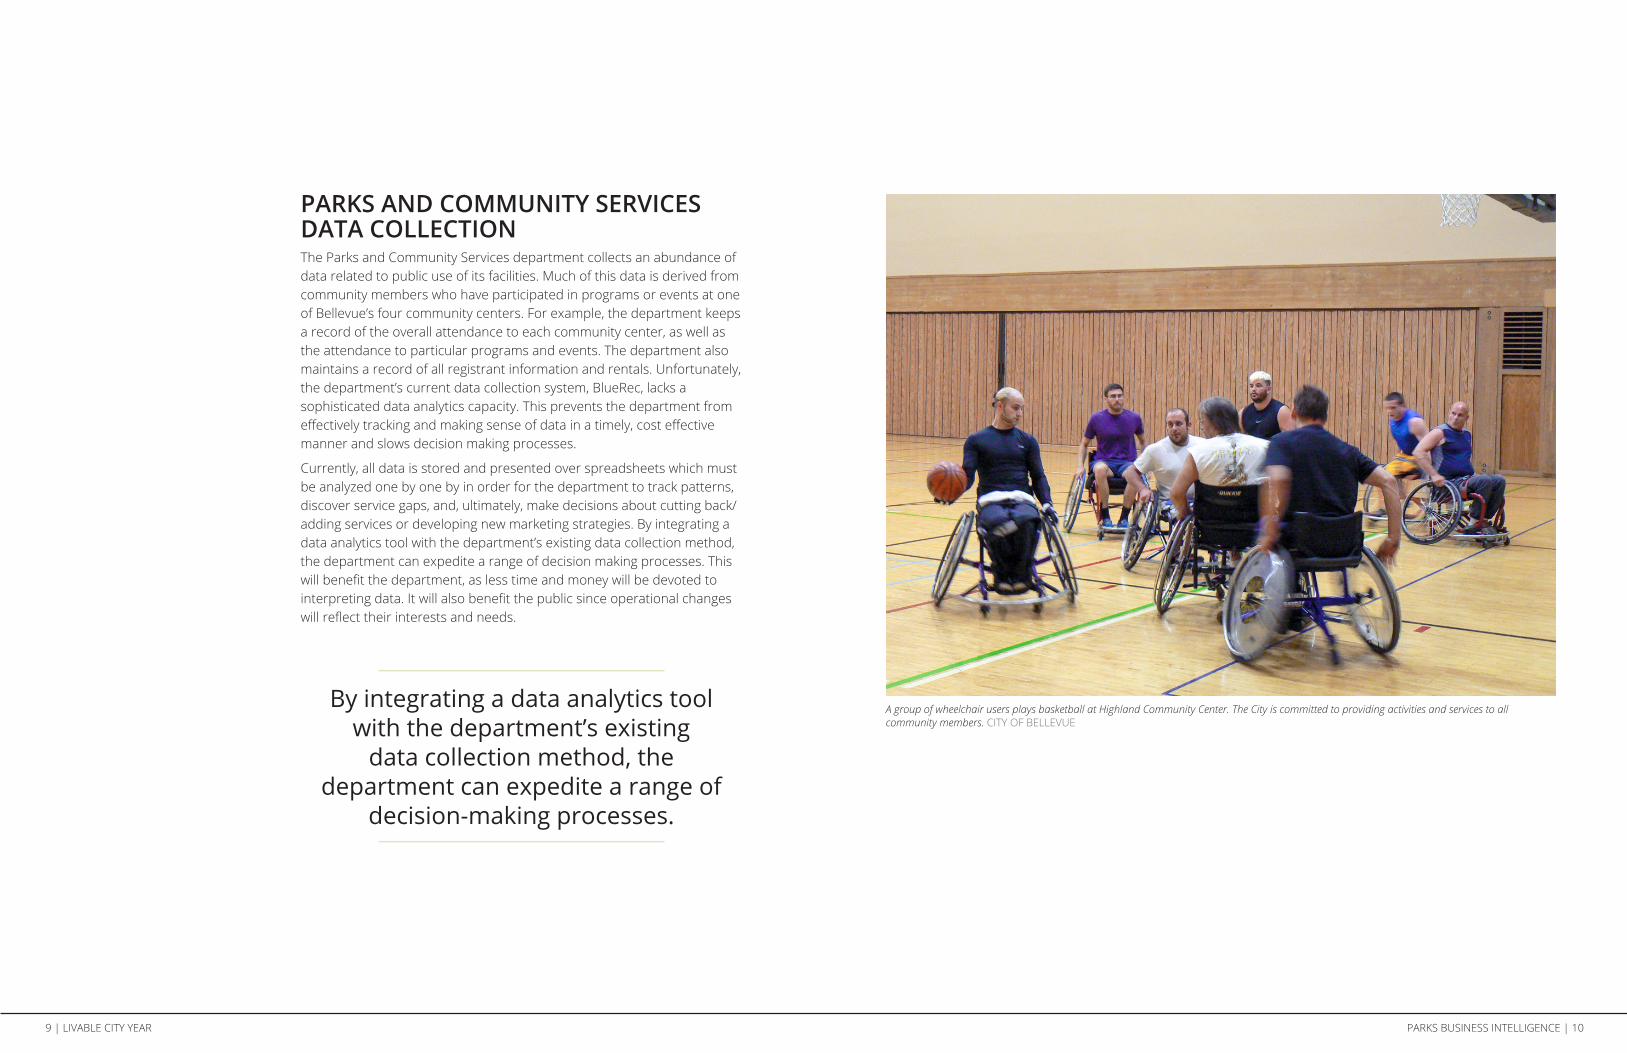
PARKS AND COMMUNITY SERVICES DATA COLLECTIONThe Parks and Community Services department collects an abundance of data related to public use of its facilities. Much of this data is derived from community members who have participated in programs or events at one of Bellevue’s four community centers. For example, the department keeps a record of the overall attendance to each community center, as well as the attendance to particular programs and events. The department also maintains a record of all registrant information and rentals. Unfortunately, the department’s current data collection system, BlueRec, lacks a sophisticated data analytics capacity. This prevents the department from effectively tracking and making sense of data in a timely, cost effective manner and slows decision making processes.
Currently, all data is stored and presented over spreadsheets which must be analyzed one by one by in order for the department to track patterns, discover service gaps, and, ultimately, make decisions about cutting back/adding services or developing new marketing strategies. By integrating a data analytics tool with the department’s existing data collection method, the department can expedite a range of decision making processes. This will benefit the department, as less time and money will be devoted to interpreting data. It will also benefit the public since operational changes will reflect their interests and needs.
By integrating a data analytics tool with the department’s existing
data collection method, the department can expedite a range of
decision-making processes.
A group of wheelchair users plays basketball at Highland Community Center. The City is committed to providing activities and services to all community members. CITY OF BELLEVUE

11 | LIVABLE CITY YEAR PARKS BUSINESS INTELLIGENCE | 12
BUSINESS INTELLIGENCE TOOL
A business intelligence tool is a software system that collects, processes and interprets large amount of data. It is capable of combining and organizing data derived from any source, including data that is imported from another system altogether, such as BlueRec. Business intelligence tools can be used to prepare data analyses and to support employees in creating dashboards, visualizations, and reports. Their capacity to manage large quantities of information is linked to increased operational efficiency and accelerated decision making processes. This is especially important to the day-to-day operations of complex organizations, like community centers, which must make determinations related to employee scheduling, programmatic and service offerings, and marketing. Ultimately, the use of a business intelligence tool enables department staff to make decisions that make best use of limited resources.
SELECTING POWER BIWe aimed to identify a business intelligence tool capable of translating all the data collected and stored in Bellevue’s BlueRec system. This includes data related to a wide array of programs and services offered out of the City’s four community centers. We wanted to select a tool that was not only capable of organizing, analyzing, and generating useful visuals on a dashboard, but also capable of importing data directly from BlueRec. Since Bellevue’s community centers offer so many different programs and services, we also determined that the business intelligence tool selected must be modifiable to suit the needs of specific programs and services.
We selected Microsoft’s Power BI because of its intuitive, user-friendly design and because of its data transfer and sorting capacities. Power BI allows each user or group of users to customize their dashboards to reflect data points that are most pertinent to their operations. For example, the dashboard for managers at South Bellevue Community Center could be set up to reflect data relevant to their community center. Power BI would also grant access to data for the entire department, enabling department-wide intelligence sharing.
There are a variety of business intelligence tools on the market, shown by the accompanying graph. Industry leaders are shown in the top right quadrant. We considered three of these leaders: Tableau, Qlik Sense, and Microsoft’s Power BI. Tableau is known for its easy-to-interpret visuals and ability to manipulate data. Qlik Sense is known for its range of features and customer satisfaction. Power BI is known for offering easy-to-understand reports for complex datasets and for offering competitive fees.
This quadrant graph shows which business intelligence tools lead in the market, based on the completeness of their vision and their ability to execute essential tasks. GARTNER
BUSINESS INTELLIGENCE TOOL MARKET
13 | LIVABLE CITY YEAR PARKS BUSINESS INTELLIGENCE | 14
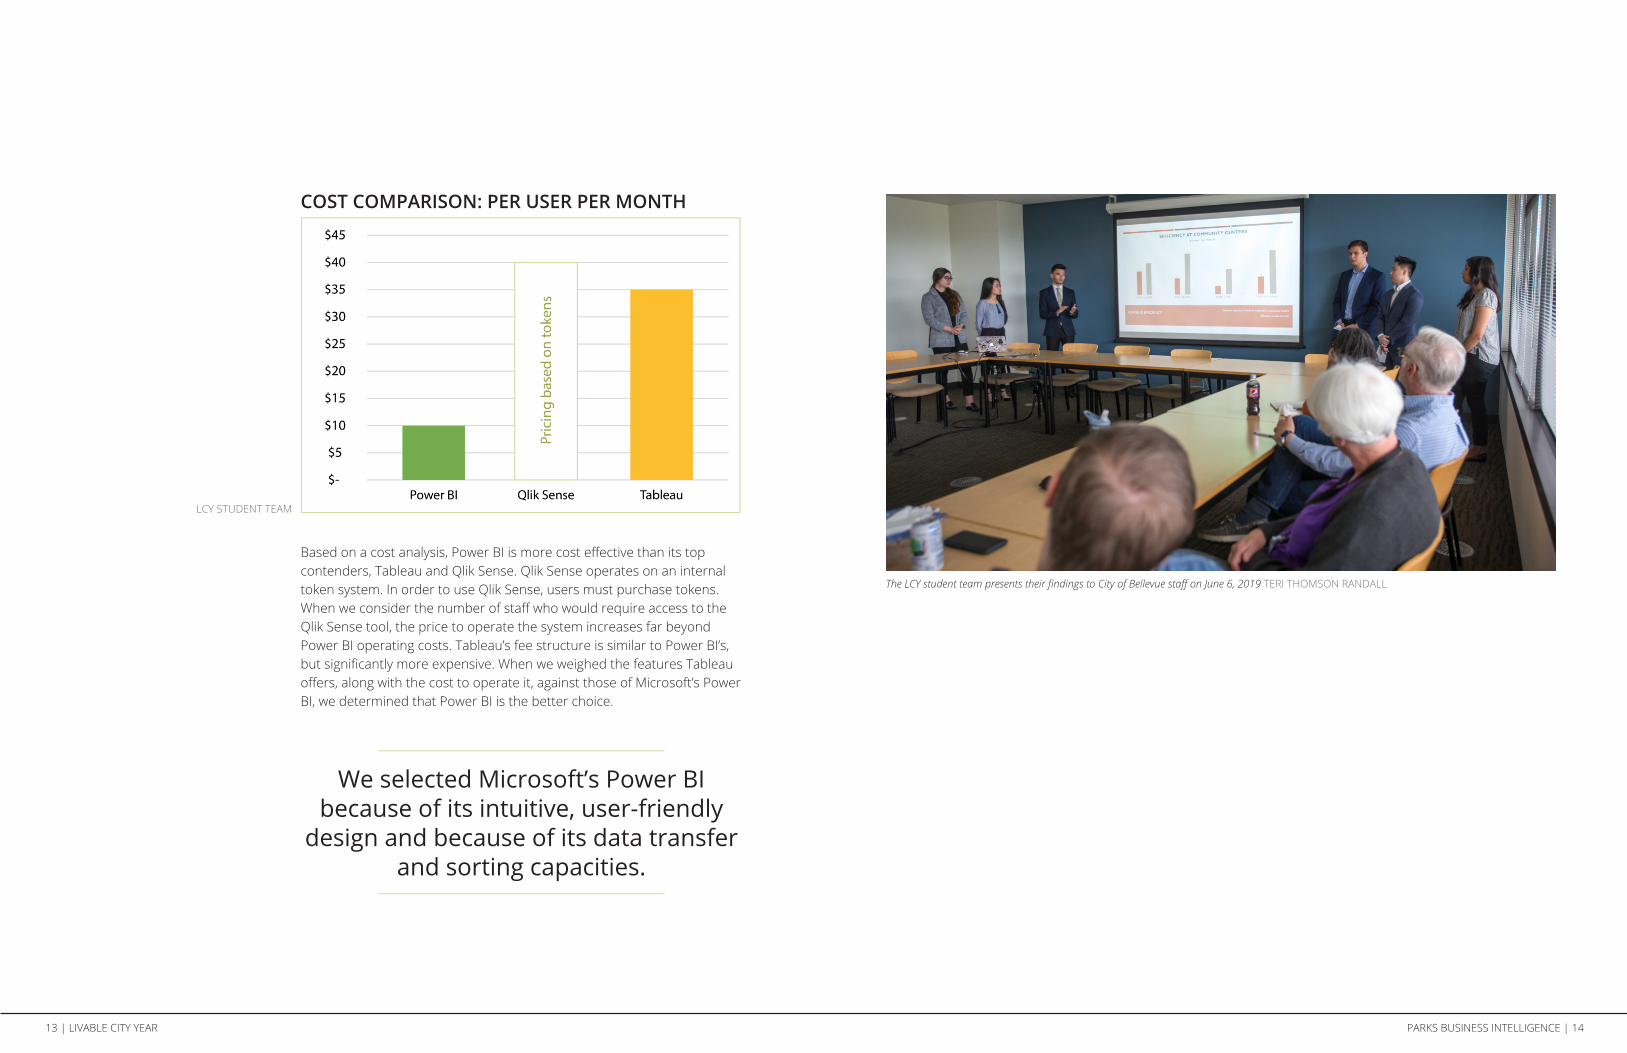
Based on a cost analysis, Power BI is more cost effective than its top contenders, Tableau and Qlik Sense. Qlik Sense operates on an internal token system. In order to use Qlik Sense, users must purchase tokens. When we consider the number of staff who would require access to the Qlik Sense tool, the price to operate the system increases far beyond Power BI operating costs. Tableau’s fee structure is similar to Power BI’s, but significantly more expensive. When we weighed the features Tableau offers, along with the cost to operate it, against those of Microsoft’s Power BI, we determined that Power BI is the better choice.
COST COMPARISON: PER USER PER MONTH
LCY STUDENT TEAM
The LCY student team presents their findings to City of Bellevue staff on June 6, 2019 TERI THOMSON RANDALL
We selected Microsoft’s Power BI because of its intuitive, user-friendly
design and because of its data transfer and sorting capacities.
15 | LIVABLE CITY YEAR PARKS BUSINESS INTELLIGENCE | 16
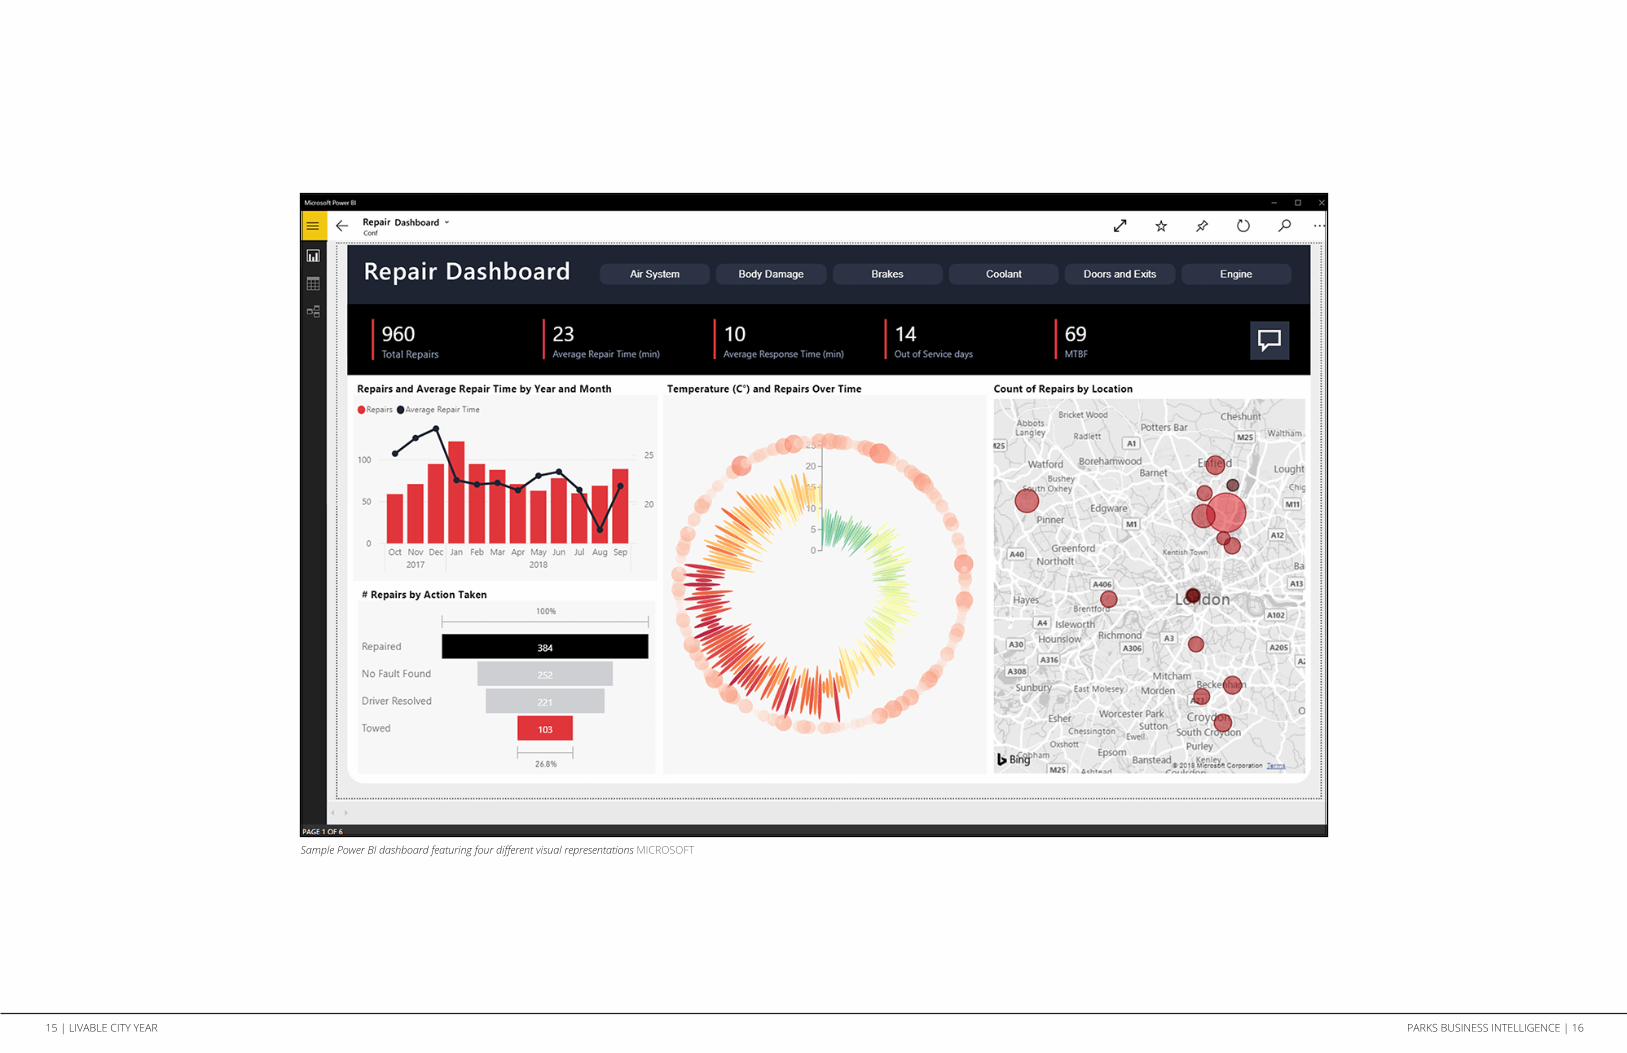
Sample Power BI dashboard featuring four different visual representations MICROSOFT

17 | LIVABLE CITY YEAR PARKS BUSINESS INTELLIGENCE | 18
IMPLEMENTATION
The first step to integrate Microsoft’s Power BI tool is to set up a meeting with the Microsoft Business Team. This meeting is essential for determining the level of compatibility between BlueRec and Power BI, as well as for determining how much full integration of Power BI will cost the City of Bellevue.
Once an implementation strategy is laid out and finances are accounted for, the Microsoft Business Team will train Parks and Community Service department employees on how to customize their own dashboards.
Example of a Power BI dashboard on different digital devices MICROSOFT
The department, as well as individual community centers, can set up their own dashboards tailored to their data analytics needs.
After learning how to tailor user dashboards, the third step in the implementation process is to introduce Power BI to other staff who require access.

19 | LIVABLE CITY YEAR PARKS BUSINESS INTELLIGENCE | 20
COSTSThe costs for Power BI are broken down into two parts, a one-time implementation fee and a monthly operation fee. The one-time implementation fee will be determined during the Parks and Community Services meeting with the Microsoft Business Team. The Microsoft Business Team will assess the level of compatibility between BlueRec and Power BI, and determine how much data must be transferred. The monthly fee to operate Power BI is $9.99 per user. We recommend that the department start by allowing access to 10-15 people with decision making responsibilities; more users can be granted access at a later time, as needed. The budget breakdown shown assumes there are either 10 or 15 people with access to Power BI. Costs will need to be further evaluated with the Information Technology Department.
At the end of the implementation process, Power BI will generate a live data analysis from the data stored in BlueRec. If BlueRec has application programming interface (API), this will facilitate the data integration process. However, if BlueRec lacks API capacity, then all data will need to be exported from BlueRec and imported into Power BI manually. This will require more time on the part of department staff. However, once data is imported into Power BI, whether automatically or manually, the tool will generate data analytics.
TIMELINE
The timeline for implementing Power BI would extend over one month, following the linear progression shown above. This timeline begins after an initial meeting with the Parks and Community Services department and the Microsoft Business Team, during which the compatibility of BlueRec and Power BI is established and implementation pricing is determined. On day one of the implementation process, Power BI will be introduced to the users who are granted access to the dashboard. On day two, the City of Bellevue would launch the integration process, syncing up the data it stores in BlueRec with Power BI. This would occur swiftly, taking no more than two days. After initial integration occurs, it could take one week for Power BI to analyze all data. By day 15, Power BI should be introduced to the community center managers. At this point, managers can begin familiarizing themselves with the new system and tracking data related to their programs and services. By day 30, users with access to Power BI should be able to fully understand how Power BI and BlueRec interface. From then on, the tool will facilitate a variety of decision making processes.
LCY STUDENT TEAMLCY STUDENT TEAM
Note: Monthly user cost = $9.99/user. An additional implementation fee is determined during an initial meeting with Microsoft Business Team.
POWER BI COSTS, BY NUMBER OF USERS
Since Bellevue’s community centers offersomanydifferentprogramsandservices, we also determined that the
business intelligence tool selected mustbemodifiabletosuittheneedsof
specificprogramsandservices.

21 | LIVABLE CITY YEAR PARKS BUSINESS INTELLIGENCE | 22
BENEFITS
We created a graph to contrast current efficiency levels for course activity, foot traffic, room usage, and staffing needs with predicted efficiency levels which reflect the integration of Power BI with BlueRec. These categories were identified by South Bellevue Community Center managers. We applied a five-point scale to each topic, with zero representing a low level of efficiency and five representing a high level of efficiency. We based our ratings on information we gleaned from South Bellevue Community Center managers during our meeting with them.
COURSE ACTIVITYThe data collected by the South Bellevue Community Center in relation to course activity is significant. However, managers lack the time required to analyze, organize, and make good use of the data. Power BI will enable managers to organize data by class type and popularity. Additionally, they can use visuals to represent popular class times and the specific demographics who are attending them. The ability to organize and represent data in these and other ways will allow program coordinators and managers to quickly adjust program schedules to reflect community interests.
FOOT TRAFFICFoot traffic refers to all who enter Bellevue community centers, whether to attend a class or to drop in to play basketball. The use of a business intelligence tool would allow staff to know the specific times each day when foot traffic is at its highest and lowest. This information will help managers make efficient use of staff schedules and could enable each community center to offer popular programs during off-peak times to increase overall foot traffic. Additionally, since Power BI can create demographics reports, managers will be able to see clearly which populations tend not to make regular use of the community centers. Equipped with this knowledge, marketing strategies can be developed to target those populations.
Each community center offers a different variety of classes tailored to people of all ages. CITY OF BELLEVUELCY STUDENT TEAM
23 | LIVABLE CITY YEAR PARKS BUSINESS INTELLIGENCE | 24
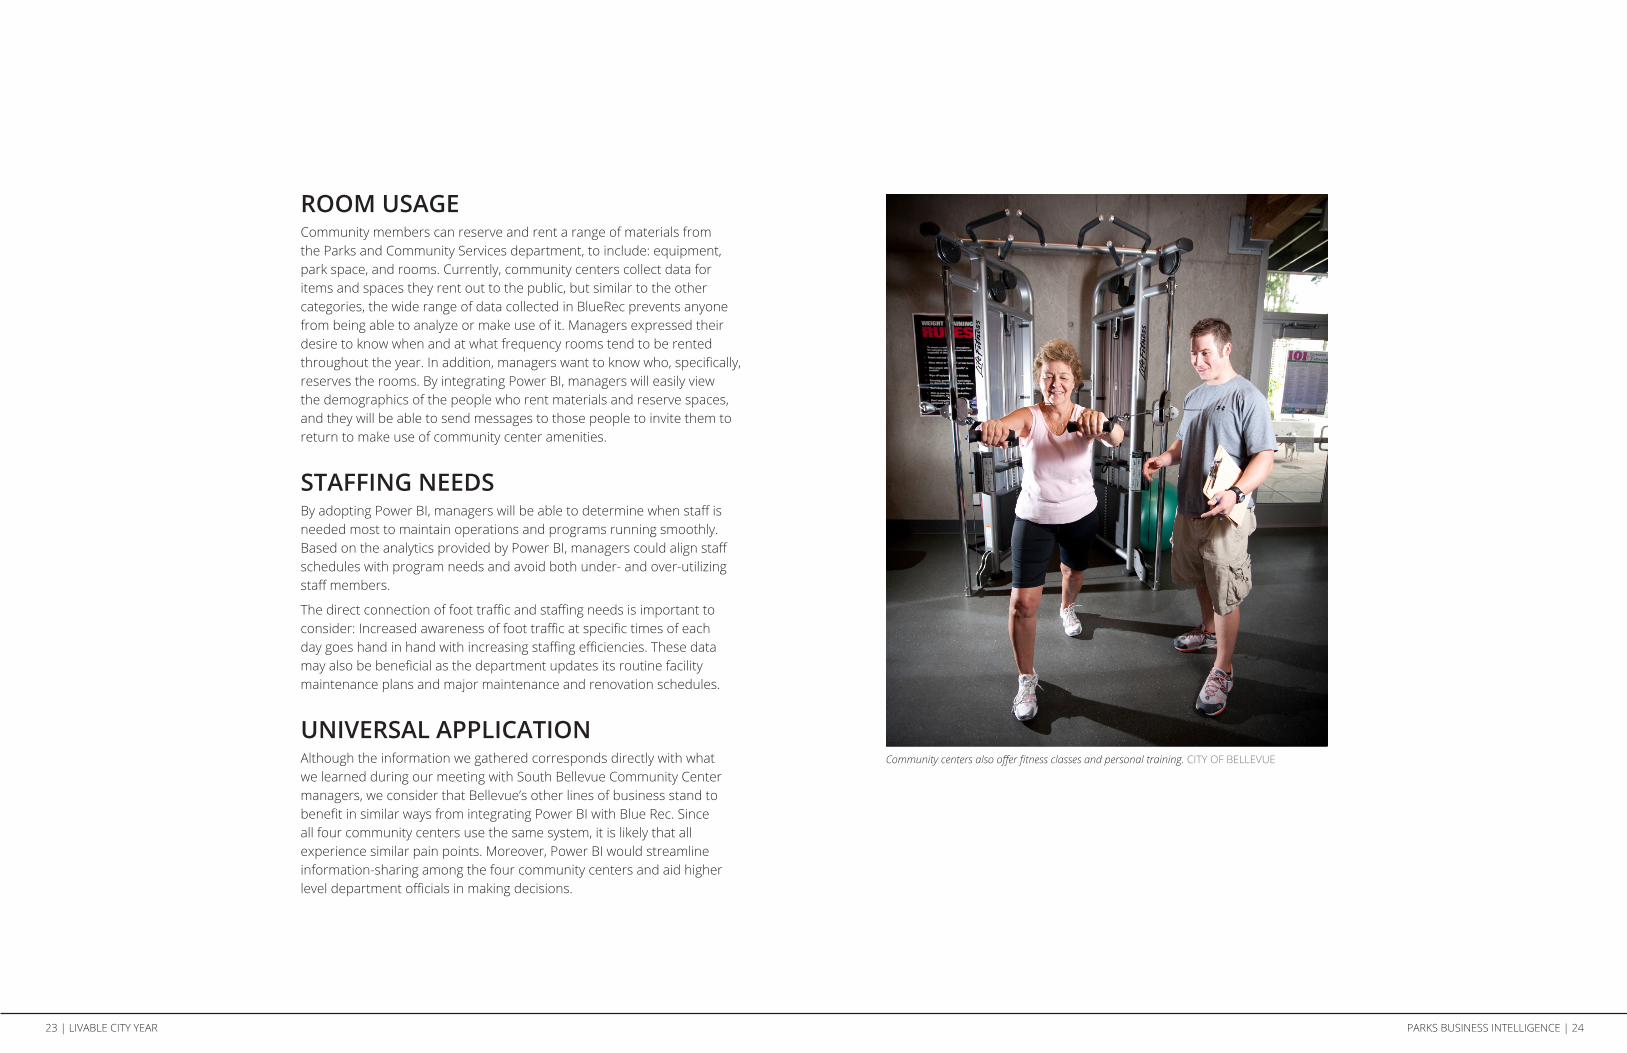
ROOM USAGECommunity members can reserve and rent a range of materials from the Parks and Community Services department, to include: equipment, park space, and rooms. Currently, community centers collect data for items and spaces they rent out to the public, but similar to the other categories, the wide range of data collected in BlueRec prevents anyone from being able to analyze or make use of it. Managers expressed their desire to know when and at what frequency rooms tend to be rented throughout the year. In addition, managers want to know who, specifically, reserves the rooms. By integrating Power BI, managers will easily view the demographics of the people who rent materials and reserve spaces, and they will be able to send messages to those people to invite them to return to make use of community center amenities.
STAFFING NEEDSBy adopting Power BI, managers will be able to determine when staff is needed most to maintain operations and programs running smoothly. Based on the analytics provided by Power BI, managers could align staff schedules with program needs and avoid both under- and over-utilizing staff members.
The direct connection of foot traffic and staffing needs is important to consider: Increased awareness of foot traffic at specific times of each day goes hand in hand with increasing staffing efficiencies. These data may also be beneficial as the department updates its routine facility maintenance plans and major maintenance and renovation schedules.
UNIVERSAL APPLICATIONAlthough the information we gathered corresponds directly with what we learned during our meeting with South Bellevue Community Center managers, we consider that Bellevue’s other lines of business stand to benefit in similar ways from integrating Power BI with Blue Rec. Since all four community centers use the same system, it is likely that all experience similar pain points. Moreover, Power BI would streamline information-sharing among the four community centers and aid higher level department officials in making decisions.
Community centers also offer fitness classes and personal training. CITY OF BELLEVUE

25 | LIVABLE CITY YEAR PARKS BUSINESS INTELLIGENCE | 26
CONCLUSION
The overall goal for this project has been to identify a business intelligence tool that will enable the City of Bellevue’s Parks and Community Services department to complete data analytics tasks more efficiently. Ultimately, this will allow Parks & Community Services to maximize the benefit of its limited resources, and enable the department to make decisions more quickly and effectively.
The City will derive the following benefits from adopting a business intelligence tool:
• Time previously devoted to data analytics can be used to expand business and marketing opportunities.
• Marketing and communications can be directed intentionally to populations not already making use of community centers.
• Decision making processes can occur more efficiently.
Through meetings with Marketing Administrator Colin Walker, other department staff, and South Bellevue Community Center managers, our team was able to understand priority concerns and focus our research and efforts to identify an ideal business intelligence tool. We sought to discover a tool that would make data more accessible and interpretable so that the department can move through decision making processes in a timely manner and respond to the needs and interests of the public.
We recommend Bellevue’s Parks and Community Services department integrate Microsoft’s Power BI, a tool that offers customizable user dashboards and generates visual representations and data reports which facilitate operational decision making. To move forward, the City can arrange a meeting the Microsoft Business Team to discuss a timeline and costs associated with integrating Power BI with the City’s existing system.
Integration of a business intelligence tool will save the Parks and Community
Services department money and enablestafftomakedecisionsmore
quicklyandeffectively.
Children enjoy playing soccer at Robinswood Park. CITY OF BELLEVUE