Embed Size (px)
Citation preview

City of Athens, Texas
FY 2018 Annual Budget

2
This budget will raise more revenue from property
taxes than last year’s budget by $231,510 and of that
amount, $26,753 is tax revenue to be raised from new
property added to the roll this year.
Record Vote on the Adoption of the Budget:
FOR: Mayor Monte Montgomery, Mayor Pro-Tem Tres Winn, Councilwoman Toni Clay,
Councilman Ed McCain, Councilman Joe Whatley
AGAINST: N/A
PRESENT and not voting: N/A
ABSENT: N/A
Property Tax Rate Comparisons:
Fiscal Year 2018 Fiscal Year 2017
Property Tax Rate $0.685221/100 $0.685221/100
Effective Tax Rate $0.654662/100 $0.650721/100
Effective Maintenance & Operations Tax Rate $0.580501/100 $0.586721/100
Rollback Tax Rate $0.691072/100 $0.691072/100
Debt Rate $0.104720/100 $0.098500/100
Total Debt Obligation for City of Athens secured by property taxes: $744,744

3
INTRODUCTION
Budget Transmittal Letter ................................................................................................................................. 5
Athens Strategic Map ...................................................................................................................................... 7
City Organization Chart.………………………………………………………………………………………. 10
City Officials ...................................................................................................................................................... 11
OVERVIEW ......................................................................................................................................................... 12
Budget Brief……………………………………………………………………………………………………13
Financial Policies ....................................................................................................................................... 17
Fund Structure ........................................................................................................................................... 20
Analysis of Property Valuations and Tax Rates ................................................................................... 22
Fund Balance………… ………………………………………………………………………………………25
Combined Summary of Revenues and Expenditures…….……………………………………….... 29
Major Revenue Sources .......................................................................................................................... 29
GENERAL FUND ................................................................................................................................................. 31
Revenue Summary………………………………………………………………………………………….32
Expenditure Summary……………………………………………………………………………………….32
Management ............................................................................................................................................ 33
Mayor and City Council ......................................................................................................................... 34
City Manager ........................................................................................................................................... 35
Legal …………………………………………………………………………………………………………36
City Secretary ........................................................................................................................................... 37
Finance ...................................................................................................................................................... 38
Human Resources..................................................................................................................................... 39
Non-Departmental…………………………………………………………………………………….....….40
Municipal Court………………………………………………………………………………………………41
Community Services .......................................................................................................................... 42
Facilities ..................................................................................................................................................... 44
Streets ......................................................................................................................................................... 45
Parks ............................................................................................................................................................ 46
Fleet Maintenance ................................................................................................................................... 47
Development Services………………………………………………………………………………………48
Code Enforcement .................................................................................................................................. 49
Planning & Development ....................................................................................................................... 50
Fire Services .............................................................................................................................................. 51
Fire & Disaster Services............................................................................................................................. 52

4
Police Services………………………………………………………………………………………….……53
Animal Control………………………………………………………………………………………….……54
Police Administration………………………………………………………………………………….…… 55
Police Investigations……………………………………………………….………………………….…… 56
Police Patrol………………………………………………………………………………………….……….57
Police Support Services……………………………………………………………………………….……58
UTILITY FUND ...................................................................................................................................................... 59
Revenue Summary………………………………………………………………………………………….60
Expenditure Summary……………………………………………………………………………………….60
Utility Administration ................................................................................................................................ 61
Water Utility ................................................................................................................................................ 62
Distribution & Collection .......................................................................................................................... 63
Wastewater Utility ..................................................................................................................................... 64
Utility Billing ................................................................................................................................................. 65
Non-Departmental ................................................................................................................................... 66
DEBT SERVICE FUND ......................................................................................................................................... 70
Debt Service Cash Flow .......................................................................................................................... 71
Schedule of Bond Payments .................................................................................................................. 72
CAPITAL PROJECTS FUND…………………………………………………………………………………………74
OTHER FUNDS ................................................................................................................................................... 76
Airport Funds .............................................................................................................................................. 77
Hotel Occupancy Fund………………………………………………………………………....................78
Equipment Replacement Fund .......................................................................................................... ...79
Capital Outlay……………………………………………………………………………………………….. 80
GENERAL INFORMATION…………………………………………………………………………………………81
Budget Glossary/Acronym Guide………………………………………………………………………..91
Budget Ordinance…………………………………………………………………………………………..92
Tax Rate Ordinance…………………………………………………………………………………………94
Schedule of Full Time Equivalents…………………………………………………………………………96
History of Athens, Texas……………………………………………………………………………………..98
Miscellaneous Statistics…………………………………………………………………………………….100
REVENUE MANUAL 2018…………………………………………………………………………………………101

5
Honorable Mayor, City Council Members and Residents of Athens:
It is an honor to present the FY 2018 Annual Operating Budget. The fiscal year 2018 budget is a balanced budget,
which includes the estimated current revenues and any available cash balance from FY 2017. In order for staff to
present a responsible budget, numerous requests from department managers were reduced or eliminated. That
does not mean these requests are unimportant, but rather the City is responding to limited resources. The budget
is a financial plan for the City, a policy tool for the City Council, an operation guide for staff and a communications
tool to the public.
In addition to maintaining the reserve fund requirement, the fiscal condition of the City continues to improve. We
received a bright note in FY 2017 when Standard & Poor upgraded the City’s bond rating to a A+. The City had not
had a rating since 1998. Our credit overview suggested that we were slightly weaker than the median rating for cities
nationwide. The key credit factors included, improvement to our financial position, a small debt burden, an inflated
pension liability, a modestly sized tax base, and somewhat low income/wealth levels. Generally speaking, Athens’
economy and tax base are satisfactory.
ECONOMIC OUTLOOK
A primary goal of the City Council is to bring business with favorable jobs to the City of Athens. In 1989 and revised
in 2005, voters elected to adopt the One-Half Cent Sales and Use Tax within the City of Athens for the promotion,
assistance, and enhancement of economic development with the City. The Athens Economic Development
Corporation (AEDC) was established in 1990 to carry out this purpose. For FY 2018 the Athens Economic
Development (AEDC) transfers are projected at $1,348,954 in sales tax receipts.
2018 BUDGET OVERVIEW
The 2018 Budget totals $29,714,612 in expenses and $33,484,335 in revenues including the remaining balance of
the $12M in certificates of obligations issued to fund renovations at the Cain Center, the Texan Theatre and other
needed capital projects. Unassigned fund balance from 2017 will carry over to FY 2018 and is estimated at this time
based on FY 2017 projections to be $15,311,977.
Our budget approach was priority based. The staff identified available
resources, identified our priorities, prepared decision units, allocated
resources and created accountability for results, efficiency, and
innovation.
General Fund Revenues are expected to total $11,083,888, an increase
of 3% from FY 2017 projected revenues and a 6% increase from the FY
17 adopted budget. Property taxes make up the bulk of the revenues
followed by sales tax. FY 2017 saw a 5.3% increase in assessed valuations, thus increasing property tax revenue.
Property tax revenue is expected to total $4,873,113, an increase of 3%, based on maintaining the same tax rate
of $.685221 per $100 of taxable value, producing an additional revenue of $174,733. Maintaining the rate at the
current level enables the City to fund increases in insurance benefits, new officers and equipment and keep
operating reserves in line with the budgetary policy.

6
Sales tax collections exceeded expectations in FY 2017 after increasing approximately 2% above collections in FY
2016. Sales tax revenues are budgeted at a conservative 2%
growth in FY 2018 as no major sales tax generators are
currently under construction. Sales tax growth is based on
current trends, economy, and growth.
Franchise fees include franchise payments for private
electric, gas, telephone, cable, internet, and Republic Services
waste collection that operate in the City’s rights-of-way.
Collections are expected to grow by 2% due growth.
Development related revenues are expected to increase slightly above the adopted FY 2017 budget as a result of
commercial growth. Development related revenues include building permits, inspections, and zoning related fees.
General Fund Expenses
General Fund expenses are budgeted to total $11,096,166 which is a decrease of 3% below the 2017 amended
budget. This is due mainly for capital equipment that is now budgeted in the Equipment Replacement Fund.
Utility Fund Revenues
Utility revenues total $5,980,360 which is 4% under the FY 2017 projected budget. The decrease is due to the
expected sales with minimum growth. The budget also includes a $.09 cent increase in the water rates effective
September 1, 2017 that was recommended in the City’s 2015 Utility Rate Study, and approved by ordinance. Each
year the rates will increase by .09 ending in 2019, according to the study.
Utility Fund Expenses
Utility fund expenses are the costs associated with the provision of water and wastewater services to the Athens
customers. The Utility Fund includes 29 full time employees. The Utility Fund Operating Budget totals $5,955,238,
including $542,150 as debt service expense.
Personnel Services. The slight increase is included for the step plan increase of 3% on the anniversary of each full-
time employee. The City health insurance increase by 8% and the retirement contribution rate through the Texas
Municipal Retirement System remains constant at 21%. The rate is based on the City contribution needed to
maintain the retirement fund.
CONCLUSION
This budget is submitted with the standards set forth by the City Council and the financial and budgetary policy set
by City Charter. Thank you for the opportunity to serve this community and work with the City staff and City Council
to present this FY 2018 budget.
Sincerely,
Gary Whittle Interim City Manager

7

8

9

10 | P a g e

11 | P a g e
r
Toni Clay Edward McCain Council Member, Place 1 Council Member
Joe Whatley Tres Winn
Council Member, Place 2 Mayor Pro-Tem, Place 4
Monte Montgomery
Mayor
Administrative Staff
Gary Whittle Bonnie Hambrick
Interim City Manager City Secretary
Assistant City Manager Thanasis Kombos
Managing Director of Planning & Development Barbara Holly, AICP
Managing Director of Public Services Ryan Adams
Managing, Director of Emergency Management John McQueary
Managing Director of Police Services Michael Hill
Director of Human Resources Jennifer Robertson, B.B.A, M.S. HRD
Director of Finance Marty Coursey, CGFO

12
OVERVIEW

`
13
BUDGET BRIEF
The City of Athens’ $18 million dollar operating budget encompasses the funding for the
upcoming year’s operations and the continued maintenance of utilities throughout the City. This
guide is to better understand the budget-development process and the resulting operating
budget. The budget is the Council’s primary policy making tool. This brief is also intended to
provide an understanding of the main financial issues facing the City and the major initiatives
that will be accomplished with the adopted budget. The Budget Brief provides a general
overview of the City’s adopted budget for Fiscal Year 2018. In addition, the brief highlights some
of the major initiatives of the City’s budget.
MAJOR INITIATIVES
• Due to the increase in property values, the Council unanamiously voted to keep the same
tax rate as FY 2017, it will remain at $0.685221 per $100 of valuation.
• Committed Fund Balance is also set aside as the “rainy day” reserve fund remains at
$1.8M, which is 60 days or 17% of operating expenditures.
• An Equipment Replacement Fund was created with a $264,000 transfer from General
Fund in FY 2017; this included the auction proceeds received in 2017. The Council
determined that $198,650 of new or replacement equipment would be purchased in
2018.
• The City will begin our role in assisting the Athens Independent School District through
the funding of the SRO (School Resource Officers) Program, which includes providing
officers and equipment for all public schools in the AISD boundaries.
• Continued step increases were approved for all full time employees on their anniversary
dates.
• The City has completed a large portion of the water storage tank improvements and we
will continue to address all issues brought to us by Texas Commission on Enviromental
Quality(TCEQ).
• This year’s budget has appropriated funds to be utilized for major maintenance programs,
such as streets, parks, public buildings and tank restorations. We believe this is a
continued step in ensuring for the future in Athens.
• Capital projects are discussed in the Capital Projects Fund and include both the Cain
Center and Texan Theatre renovations.

14
THE BUDGET DOCUMENT
The budget provides a complete financial plan of all City funds and activities and, except as
required by law or City Charter, in a format in the City Manager or the City Council requires. A
budget transmittal letter, submitted by the City Manager, explaining the budget both in fiscal
year terms of the work programs shall be submitted with the budget. The budget outlines the
proposed financial policies of the City for the ensuing fiscal year, describes the important features
of the budget, and indicates any major changes from the current year in financial policies,
expenditures and revenues, with reasons for such changes. It also summarizes the City’s debt
position and includes any materials the City Manager requires. The budget begins with a general
summary of its contents, indicating the proposed property tax levy, and all proposed
expenditures, including debt service, for the ensuing fiscal year. The proposed budget
expenditures shall not exceed the total of estimated income and unencumbered funds from the
previous year. The proposed budget for the General fund shall include a contingency of not less
than 3% of the proposed expenditures (Charter Required Upon receipt of the budget estimates,
the Council holds public hearings on the proposed budget and tax rate.) Information about the
budget detail and tax rate is published in the offical newpaper and can be found the City’s
website.
The City Council approves annual appropriations for operations and inter-fund transfers for all
operating and debt service funds. The City Manager has the authoriity to transfer unexpended
balances between departmental budgets within appropriated funds. The City Council, however,
must approve any increase in fund appropriations. The legal level of budgetary control is the
fund level. During the fiscal year, budgetary control is maintained by comparison of
departmental appropriation balances with purchase orders prior to release to vendors. Purchase
orders, which exceed appropriated balances, are not released until they have been fuirther
review and approved by the City Manager or his designee. Encumbrance outstanding at year end
may be reported as reservations of fund balance in the financial statements since they do not
constitute expenditures or liabilities and are added to the subsequent year’s adopted
appropriations.
All other departmental appropriations that
have not been expended or encumbered at the
end of the fiscal year will lapse. Therefore,
funds that were budgeted and not used by the
departments during the fiscal year are not
available for their use unless appropriated in
the ensuring fiscal year’s budget.

`
15
CITY’S FUNDS
The City of Athens, like other cities and governmental bodies, uses a fund basis of accounting.
Funds are normally established for each major type of revenue for specific functions. Each fund
is a self-balancing set of accounts, used to determine the sources and uses of a specific type of
revenue stream. The City of Athens fund types include the Governmental Fund types: General
Fund, Debt Service Fund, and Special Revenue Fund, and Proprietary Fund types: Enterprise
Fund( which is the Utility Fund.)
GENERAL FUND
The General Fund is the general operating fund for the City. It is used to account for all financial
resources except those requried to be accounted for in other funds. All general tax revenues and
other receipts that are not allocated by law or contractual agreement to other funds are
accounted for in this fund. The General Fund is the largest fund for the City with budgeted
expenditures of $11.M. The General fund accounts for the majority of City services, including
general management, community services, development services, public safety and public works.
Budgeted expenditures include salaries, supplies, maintenance and contractual services, and
capital outlay.
GENERAL FUND REVENUES
General Fund revenues are generated through property taxes, sales taxes, franchise taxes, fees
for services and court fines. Reimbursement from the Utility Fund is another significant source
for the General Fund.
GENERAL FUND EXPENDITURES
FY 2018 included budgeted expenditures of $11.8M in the General Fund. The General Fund has
five ( 5) service functions: Management, which includes the City Manager, Legal, Mayor and
Council, City Secretary, Finance,Municipal Court, Human Resources,and Non-Departmental;
Development Services, which includes Code Enforcement and Planning/Development;
Community Services, which includes Facilities, Streets, and Parks; Police Services; and
Fire/Disaster Services.
The budget can be reviewed by budget classification perspective, which reveals: Personnel,
Supplies, Contractual Services, Capital, Debt and Operating Transfers.

16
OTHER FUNDS
The Utility fund is the second largest fund. This fund is considered an Proprietary fund because
operations are financed and operated similar to business enterprises where costs of providing
services are financed through user charges. The Utility fund accounts for the maintenance and
operations of the City’s water and wastewater system, as provided through long term contracts
Total expenses for the Utility Fund are $5,955,238 of which $5,413,088 is for operations and
$542,150 is for debt payments.
The Debt Service Fund budget is $744,744. This fund is used to account for the accumulation of
financial resources, i.e. tax payments for the payment of principal, interest, and related costs for
general long-term debt paid primarily from taxes levied by the City . Debt was issued to provide
improvements in the quality of life.
Special Revenue Funds are used to account for specific revenues that are legally restricted to
expenditure for particular purposes. The combined budgeted expenditures for all Special
Revenue Funds total $382,058. The Airport Fund is $51,947; the Hotel Occupancy Tax Fund is
$330,111;
`
17
FINANCIAL POLICIES
ANNUAL BUDGET
The fiscal year of the City begins on October 1, and ends on Septermber 30 of the following year. On or before August 1 of each year, the City Manager files with the City Secretary a proprosed budget, along with the budget message, for the ensuing fiscal year. The budget provides a complete financial plan of all City funds and activities. The budget includes a clear, general summary of contents; consolidated statement of receipts and expenditures of all funds listed and itemized individually; an analysis and itemization of estimated income from all sources; tax levies; rates and collection for the preceding three years; pending and proposed capital projects; amount required for interest on the City’s debts, for sinking funds and maturing serial bonds; total amount of the City’s outstanding debts; a reserve/contingency fund not less than 3% of the such other information that is required by City Council, Charter, and City Manager. A public notice on the proposed budget should include time and place and where copies of the budget are available; at a regular meeting, the City Council may adopt the budget and the Council shall adopt the budget by ordinance. BASIS OF ACCOUNTING AND BUDGETING. The accounting policies of the City conform to accounting policies generally accepted in the United States of America for local governments as prescribed by the Government Account Standards Board (GASB). GASB is the accepted standard-setting body for establishing governmental accounting and financial reportilng principles. The City is organized and operates on the basis of funds and account groups. Each fund is a separate accounting enitity with a self-balancing set of accounts, which are segregated for the purpose of tcarrying on specific activiities or attaining certain objectives in accordance with special regulations restrictions, or limitations. Governmental fund types, i.e. General Fund, Debt Service, and Special Revenue use the flow of current financial resources measurement focus and the modified accrual basis of accounting, with revenues recorded when available and measuable, and expenditures budgeted in the period in which the liability is incurred. Revenues are considered to be available when they are collect within the current period. Expenditures are recognized when the liability is incurred, if measurable. However, debt service expenditures, as well as expenditures related to compensated absences, claims and judgements are recorded only when payment is due. Proprietary funds i.e. Utility Fund is accounted for using the economic resources measurement focus and the accrual basis of accounting, with revenues recordl when incurred.
18
The City of Athens Annual Budget is prepared on a basis consistent with generally accepted accounting principles for both governmental and proprietary funds. As with the accounting functions, General Government type funds are prepared on a modified accrual basis with obligations budgeted as expenditures and revenues recognized when the are measurable and available. With the Proprietary funds, expenses are on an accrual basis and revenues are recognized when earned. The basis of budgeting and the basis of accounting are essentially the same. The Annual Operating Budget presented is a balanced budget in which projected resources (current revenues plus fund balance) equal or exceed estimated expenditures.
BUDGET AMENDMENTS
According to the City Charter, the City Manager may transfer part or all of any unencumbered appropriation balance among departments of the City. Transfers between expenditure accounts within a department require approval from the City Manager. Total expenditures cannot exceed the final appropriation once the budget is adopted. Any revisions that alter the total expenditures must be done by adoption of the appropriate ordinance or budget amendment with City Council approval. CAPITAL PROJECT EXPENDITURES The City Charter requires that the City Manager shall submit a five year Capital Program as an attachment to the annual budget. DEBT SERVICE A formal debt service policy was included in the Financial policies approved by Council in August 2016. The purpose of the policy is to establish parameters and provide guidance governing the issuance, management, continuous evaluaton of and reporting on debt obligations issed by the City, The City shall not issue debt obligations or use debt proceeds to finance current operations or normal maintenance. Debt financing includes general obigation bonds, certificates of obligation, revenue bonds, lease/purchase agreements and other obligations permitted to be issued under Texas Law. The City will utilized debt obligations only for acquiesition ,construction, reconstruction, or renovation of capital improvements projects that cannot be funded from current revenue sources.

`
19
FINANCIAL REPORTING City Charter requires at the close of each fiscal year an independent audit be made of all accounts of the City by a certified public accountant. Following the close of the fiscal year, a Comprehensive Annual Financial Repot (CAFR) is prepared in accordance with generally accepted accounting and financial reporting principles established by the Governmental Accounting Standards Board (GASB). The CAFR shows the status of the City’s finances on the basis of Generally Accepted Accounting Principlles in the United States of America.(USGAAP) INVESTMENT POLICY The purpose of the Investment Policy is to set forth specific investment policy and strategy guidelines for the City in order to achieve the goals of safety, liquidity, yield, diversification and public trust for all investment activity. Safety-All investments shall be managed ina manner responsive to the public trust and consistent with state and local law. Safety is the primary objective of the City’s investment activity is the preservation of capital. Liquidity-The City’s portfolio shall be structured to meet all epected obligations ina timely manner. Yield- The benchmark for the City’s portfolio shall be the one-year U.S. Treasury, designated for its comparibility to the City’s expected average cash flow pattern. Diversification- The portfoliio shall be diversified by market sector and maturity in order to avoid market risk. Public Trust-All participants in the City’s investment process shall seek to act responsibly as custodians of the public trust.

20
FUND STRUCTURE

`
21
DETAIL OF FUND STRUCTURE

22
ANALYSIS OF PROPERTY VALUATIONS AND TAX RATES Property taxes provide one of the largest sources of revenue for the City, and determing the tax
rate is a major part of the annual budget process. Therefore, discussion of the General Fund can
not be separated from dissussion of the tax rate and associated income.
From 2008-2015, Athens experienced an increase growth in valuations. Throughout this time
period, the number of new commercial properties increased. The increase in new commercial
properties continues to rise slightly resulting in an increase in property value for 2018.
The Henderson County Appraisal District (HCAD) establishes and certifies the value of each
property within the City of Athens. The total certified taxable values for Fiscal Year 2018 (Tax Year
2017) is $711,173,951. This is a increase of $25,500,250 from the 2016 certified taxable value.
Once the property values have been certified, this begins the truth in taxation process by using
the certified values to establish an effective tax rate and a rollback tax rate. These rates are
published and the City uses them as a guide to help determine an acceptable tax rate for the
upcoming year.
TAX YEAR ASSESSED VALUATIONS TAX RATE M&O Debt Service TAXES ASSESSED
2006 545,379,300 0.443793 0.362853 0.080940 2,420,355
2007 585,422,923 0.443793 0.364969 0.078824 2,598,066
2008 616,884,246 0.481808 0.393078 0.088730 2,972,198
2009 633,521,417 0.518512 0.428578 0.089934 3,284,885
2010 632,433,077 0.552076 0.464044 0.088032 3,491,511
2011 634,745,864 0.600387 0.515045 0.085342 3,810,932
2012 641,165,486 0.600387 0.517172 0.083215 3,849,474
2013 651,226,345 0.645140 0.552823 0.092317 4,201,322
2014 669,991,990 0.645140 0.550946 0.094194 4,322,386
2015 692,001,796 0.645140 0.559220 0.085920 4,464,380
2016 685,673,701 0.685221 0.586721 0.098500 4,698,380
2017 711,173,951 0.685221 0.580501 0.104720 4,873,113

`
23
The effective tax rate enables the public to evaluate the relationship between taxes for the
preceding year and for the current year, based on a tax rate that would produce the same
amount of taxes if applied to the same properties taxed in both years. If a city proposes a tax rate
that exceeds this effective tax rate for the current year, then public hearings must be held to make
the public aware of the tax increase. The effective tax rate for Fiscal Year 2018 (Tax Year 2017) is
.654662.
The rollback rate separates the maintenance and operations (M&O) and the debt services (DS)
portions of the tax rate. The rollback tax rate is set in order to allow citizens to limit the governing
body’s ability to significantly increase the M&O rate. The debt service rate is a fixed rate set in
order to allow the city to collect exactly the amount required to make a single years debt
payments. The Fiscal Year 2018 (Tax Year 2017) rollback rate is $0.728606. The two portions of the
tax rate are discussed further over the next few paragraphs. The City’s debt is discussed further in
the Debt Service Fund section of the budget document.
Maintenance & Operations
The M&O portion of the tax rate provides funding for all general fund operations. The portion of
the tax rate is flexible and can be adjusted to a higher or lower rate based on the needs of City.
The M&O rate may generate funds for future capital expenses and allows the City to maintain
operating reserves.
Fiscal Year 2018’s M&O rate is set at .580501. This is a tax rate decrease from the Fiscal Year 2017
rate, but will provide additional tax revenues due to the increase in valuations. This rate will result
in $88,833 in general fund revenue from property taxes.
The Debt Service (DS) or Interest and Sinking( I & S) portion of the tax rate covers the City’s bond
payments. This portion of the tax rate is not flexible and is set by a calculation based on the
required fiscal year payments of the City’s debt. The DS tax rate provides the City with exact
funding to make the required debt payments for each fiscal year. Located in the Debt Service
Fund section of the budget book is a Debt Service Schedule that provides specific information
about what payments are required the bond loans, as well as a summary to provide citizens a
look at specific information on how much is owed by the City.

24
Fiscal Year 2018’s proposed Debt Service tax rate is 0.104720. This is an increase of $0.008220 over
Fiscal Year 2017 to be used for debt service payments. This increase is to fund the increase of the
repayment of 2017 Bonds for the construction of projects detailed in Capital Project Programs.

`
25
Fund Balance GASB 54
Overview. This is the criteria for classifying fund balances into specifically defined classifications,
define the authority to express intended uses that result in amounts being assigned to one of the
classifictions and the formal action required to be taken to establish,modify, and rescind an
amount in a classification. It will also define the governmental fund types.
The definition of each classification is as follows:
Non-spendable – Amounts not in a spendable form, long-term loans and notes receivable,
inventory, and amounts that must be maintained intact legally or contractually. Amount are
classified as non-spendable by their form, and are not constrained by any authority’s action.
These include inventories, and prepaid expenditures.
Restricted – Amounts constrained for a specific purpose by external parties, constitutional
provision or enabling legislation. Constraints placed on the use of resources by external parties
such as:
• Creditors, i.e. debt covenants
• Grantors
• Contributions
• Laws or regulations of other governments
Committed – Amounts constrained for a specific purpose by adoption of an ordiannce from the
government using its highest level of decision-making authority. Constraints placed by the City
Council by the adoption of an ordinance or resolution.
Assigned – For the General Fund, amounts constrained for the intent to be used for a specific
purpose by a governing body or official( City Manager) that has been delegated authority to
assign amounts. For all governmental funds other than the General Fund, any remaining positive
amounts not classified as non-spendable, restricted, or committed. The City Council or the City
Manager are authorized to assign amounts.
Unassigned – For the General Fund, amounts not classified as non-spendable, restricted or
assigned. For all other governmental funds other than the General Fund,only as a deficit as a
result of amounts expended in excess of resources that are non-spendable, restricted, committed,
or assigned.

26
Governmental 2009 2010 2011 2012 2013 2014 2015 2016
Unspendable 1,040,955 1,048,089 1,093,286 1,163,211 1,038,044 1,395,865 1,477,043 1,324,579
Receivables 1,003,110 1,040,704 1,085,175 1,154,914 1,023,937 1,390,219 1,469,206 1,313,120
Inventories 30,194 4,385 5,111 5,297 5,294 2,646 4,837 8,459
Prepaids 7,651 3,000 3,000 3,000 8,813 3,000 3,000 3,000
Restricted 11,637 12,255 11,603 11,354 11,727 9,038 10,126 3,364
Court Funds 11,637 12,255 11,603 11,354 11,727 9,038 10,126 3,364
Committed-Council 1,000,000 1,000,000 1,000,000 1,000,000 1,000,000 1,000,000 1,000,000 1,833,735
Emergency Reserve 800,000 800,000 800,000 800,000 800,000 800,000 800,000 1,833,735
Capital Improvements 200,000 200,000 200,000 200,000 200,000 200,000 200,000
Assigned-City Manager 38,790 178,304 15,679 145,004 480,060 277,311 210,285 -
Unassigned/Spendable 1,219,558 1,445,609 1,741,460 2,104,349 2,105,945 2,590,926 3,092,022 1,775,560
Total Fund Balance 3,072,150 3,305,953 3,646,349 4,078,914 3,955,716 4,795,829 5,379,191 4,937,238

`
27
ESTIMATED FUND BALANCES
**Estimated cash flows are based on FY 2016 year’s actual unassigned fund balance along with
the projected year end at 9/30/2017Only those funds that are included in the budget ordinances
are included.
General
Fund
Utilities
Fund
Airport
Fund
Hotel
Occupancy
Debt
Service
Fund
Equipment
Replacement
Capital
Projects Fund Total
Available Unassigned 10/1/2017 1,594,788 1,192,830 195,630 726,974 - 264,000 11,337,755 15,311,977
Revenues
Total Revenues 11,083,888 5,983,360 49,740 310,626 744,744 - 1,097,023 19,269,381
Expenditures10-CITY MANAGER 357,810
Total Expenditures 11,096,167 5,955,238 51,947 330,111 744,744 198,650 12,434,778 30,811,635
-
Estimated Unassigned 9/30/2018 1,582,509 1,220,952 193,423 707,489 - 65,350 - 3,769,723

28 | P a g e
SUMMARY OF REVENUES AND EXPENDITURES
FY 2018 General Fund Airport Fund
Hotel
Occupancy Tax
Fund
Equipment
Replacement
Fund
Interest &
Sinking Fund
Capital Projects
Fund
Downtown
Capital
Improvements
Fund
Water Sewer
Capital ProjectUtility Fund
Energy Grants
Fund
Special
Donations Fund
Municipal
Court
Technology
Fund
Local Forfeited
Cash Fund
AEDC
Payroll
Fund
Totals
Estimated Cash Balance 1,594,788 195,630 726,974 264,000 0 11,337,755 68,988 367,320 1,192,830 210 91,126 4,877 36,739 0 15,881,237
Revenues
AD VALOREM/ OTHER TAXES 8,239,858 310,626 744,744 9,295,228
FRANCHISE 932,518 932,518
COURT/PUBLIC SAFETY 264,000 264,000
LICENSES/PERMITS 134,317 134,317
OTHER OPERATING REVENUE 0 48,486 5,663,360 5,711,846
INTRAGOVERNMENTAL 846,498 0 0 846,498
INTERGOVERNMENTAL 15,657 0 200,000 215,657
REIMBURSING REVENUE 441,000 0 500 441,500
OTHER NON OPERATING 210,040 1,254 0 119,500 330,794
Total Revenues 11,083,888 49,740 310,626 0 744,744 0 0 0 5,983,360 0 0 0 0 0 18,172,358
Expenditures
10-CITY MANAGER 357,810 357,810
11-LEGAL 101,850 101,850
12-HUMAN RESOURCES 206,919 206,919
14-FINANCE & TECHNOLOGY 326,200 326,200
15-MAYOR & COUNCIL 46,250 46,250
16-CITY SECRETARY 150,568 150,568
17-FACILITIES 161,121 161,121
20-COMMUNITY DEVELOPMENT 0 0
22-CODE ENFORCEMENT 191,841 191,841
24-PLANNING & DEVELOPMENT 366,578 366,578
32-STREET 1,211,607 85,000 1,296,607
34-PARKS 792,454 10,500 802,954
36-AIRPORT 51,947 51,947
38-FLEET MAINTENANCE 204,312 71,400 275,712
46-FIRE SERVICES 2,793,355 2,793,355
49-ANIMAL CONTROL 121,984 121,984
50-MUNICIPAL COURT 113,321 113,321
51-POLICE ADMINISTRATION 302,912 31,750 334,662
52-POLICE INVESTIGATION 481,632 481,632
53-POLICE PATROL 2,027,620 2,027,620
54-POLICE SUPPORT SERVICES 694,072 694,072
55-NON DEPARTMENTAL 443,761 443,761
61-UTILITY ADMINISTRATION 337,438 337,438
62-WATER UTILITY 1,198,799 1,198,799
63-DISTRIBUTION & COLLECTION 1,358,207 1,358,207
65-WASTEWATER UTILITY 1,433,686 1,433,686
66-UTILITY BILLING 223,256 223,256
69-NON DEPARTMENTAL 1,403,852 1,403,852
68-DEBT SERVICE 744,744 744,744
72-TOURISM 330,111 330,111
03-CAPITAL PROJECTS 12,434,778 0
0
0 0
Total Expenditures 11,096,167 51,947 330,111 198,650 744,744 12,434,778 0 0 5,955,238 0 0 0 0 0 18,376,857
0
Other Sources and Uses 0
Capital Lease
Debt Issuance
Note Proceeds
Discount on Debt
0 0 0 0
Total Other Sourses and Uses 0 0 0 0 0 0 0 0 0 0 0 0 0 0 0
Prior Period Adjustments 0
Estimated Cash Balance 1,582,509 193,423 707,489 65,350 0 0 68,988 367,320 1,220,952 210 91,126 4,877 36,739 0 4,338,983
Combined Funds Cash Flow Summary

29 | P a g e
MAJOR REVENUE SOURCES
PROPERTY TAXES- Property taxes represents the largest percent of revenue sources
for the City of Athens. The assessed valuation, provided by Henderson County
Appraisal District for 2017 is $711,173,951, an increase from last year of
$25,500,250, due mostly to the commercial market. The property tax will remain
at $.685221 per $100 valuation. Property values are provided by the Appraisal
District by July 25th of each year. The City then works with Henderson County to
set the tax rate and determine budgeted revenues.
SALES TAX-The current sales tax rate in Athens is 8.25% on goods/services sold
within the cit limits. Sales tax is collected by businesses and remitted to the Texas
Comptroller of Public Accounts. The State retains 6.25% and distributes 2% to the
City. Of the 2%, 1% is designated for City operations; the other 1% is split: ½ is a
special 4B sales tax that is used to fund projects to promote economic growth,
recreation and tourism; and ½ is used to reduce property taxes. Total sales tax
revenue budgeted for this year is $5.M. Forecasts of sales tax revenue are very
conservative, based on trend analysis and have been budgeted to increase
slightly for the next fiscal year.
SERVICE FEES & PERMITS-The City of Athens charges fees for providing water and
sewer services to the citizens and businesses of Athens. Residential sewer rates
are based on the size of the meter installed at the property. As of 9/1/2017 the
water base rate is $19 for the which includes the first 2,000 gallons, and for every
additional1 gallon, it is $3.15 per 1,000 gallons.
The City anticipates receiving $2,921,694 in water sales and $2,552,366 in sewer
sales. The Utility revenue make up approximately 97% of this major source
category. The remaining amount includes revenue from programs, fees, and
permits. Water and Sewer sales are budgeted based on historical consumption
while factoring in slight population variances and weather forcasting noted in the
Texas Almanac for the East Texas area.
FRANCHISE TAXES-Franchise Tax Revenue includes revenue collected from
electric, telephone, gas, solid waste, internet and cable franchise agreements
with local providers. Franchise taxes are scheduled to remain constant for FY 2018

30
FINES-Revenues collected by the Athens Municipal Court for fines and costs
imposed by the Court. Municipal Court fines are budgeted to remain slightly
elevated to account for a more aggressive collection process.
INTEREST &OTHER INCOME-Interest income and all other miscellaneous revenue
not categorized elsewhere are included. The interest income represents yields on
investment budgeted for FY 2018. These are conservative estimates.
UTILITY FUND REIMBURSEMENT- Revenue transferred from the Utility Fund to the
General Fund totals, $755,702. The transfer is based on a PILO T (payment in lieu
of Taxes) of 5% of water and sewer revenue, along with 50% of the City Manager’s,
City Secretary, Finance and Human Resource total budgets.

`
31
GENERAL FUND

32
GENERAL FUND SUMMARY OF REVENUES AND EXPENDITURES
REVENUE
SUMMARY
FY2015 Actual
FY2016 Actual
FY2017 Adopted Budget
FY2017 Amended
Budget
FY 2017 Projected
Actual
FY 2018 Adopted Budget
AD VALOREM/TAXES 7,604,004 7,853,229 8,086,923 8,086,923 8,265,825 8,239,858
FRANCHISE 933,540 900,757 926,819 926,819 894,372 932,518
COURT 376,954 231,834 223,778 223,778 192,720 264,000
LICENSES/PERMITS 35,602 103,341 49,454 49,454 146,606 134,317
OTHER REVENUE 0 0 0 15 0 0
INTRAGOVERNMENTAL 650,000 949,167 955,000 955,000 680,000 846,498
INTERGOVERNMENTAL 40,550 14,667 44,667 44,667 4,021 15,657
REIMBURSING REVENUE 52,957 235,660 60,800 60,800 211,285 441,000
OTHER NON-OPERATING 72,076 84,736 43,000 43,000 284,934 210,040
TOTAL REVENUES 9,765,684 10,373,392 10,390,456 10,390,456 10,679,764 11,083,888
EXPENDITURE
SUMMARY
FY2015 Actual
FY2016 Actual
FY2017 Adopted Budget
FY2017 Amended
Budget
FY 2017 Projected
Actual
FY 2018 Adopted Budget
10-CITY MANAGER 471,217 203,645 216,930 304,408 290,735 357,810
11-LEGAL 79,655 105,021 95,350 188,250 185,944 101,850
12-HUMAN RESOURCES 144,933 180,384 197,252 197,252 169,764 206,919
14-FINANCE 279,642 236,987 260,847 285,747 273,125 326,200
15-MAYOR & COUNCIL 47,274 54,655 46,250 41,965 32,265 46,250
16-CITY SECRETARY 179,620 266,295 216,779 172,279 155,529 150,568
17-FACILITIES 139,757 221,822 182,800 182,800 161,890 161,121
20-COMMUNITY DEV 152,000 169,106 94,437 94,437 79,095 0
22-CODE ENFORCEMENT 284,701 986 128,431 128,431 105,886 191,841
24-PLANNING 194,686 282,423 302,350 452,350 452,175 366,578
32-STREET 1,025,448 1,317,908 1,399,510 1,513,407 1,460,359 1,211,607
34-PARKS 348,723 986,680 759,903 721,523 637,907 792,454
38-FLEET 167,842 206,742 209,015 209,015 198,326 204,312
46-FIRE SERVICES 2,433,479 2,612,525 2,840,640 2,840,640 2,712,776 2,793,355
49-ANIMAL CONTROL 97,823 322,671 106,660 106,660 100,816 121,984
50-COURT 107,353 114,481 163,998 165,298 163,772 113,321
51-POLICE ADMIN 278,532 287,934 293,089 294,789 287,336 302,912
52-POLICE CID 453,735 488,819 494,712 494,712 464,626 481,632
53-POLICE PATROL 1,681,083 1,793,801 2,055,926 1,833,426 1,784,043 2,027,620
54-POLICE SUPPORT 641,351 633,309 710,012 633,916 594,078 694,072
55-NON-DEPARTMENTAL 188,718 341,464 555,666 675,666 632,593 443,761
TOTAL EXPENDITURES 9,397,571 10,827,658 11,330,557 11,536,971 10,943,040 11,096,166

`
33
Management
FY2015 Actual
FY2016 Actual
FY2017 Adopted Budget
FY2017 Revised Budget
FY 2017 Projected
Actual
FY 2018 Proposed
Budget
City Council 47,273 54,655 46,250 41,965 32,265 46,250
City Manager 471,217 203,645 216,930 304,408 290,735 357,810
Legal 79,655 105,021 95,350 188,250 185,944 101,850
City Secretary 179,620 266,296 216,779 172,279 155,529 150,568
Human Resource 144,933 180,383 197,252 197,252 169,764 206,317
Finance 279,642 236,986 260,847 285,747 273,125 326,200
Municipal Court 107,352 114,481 163,998 165,298 163,772 113,321
Non-Departmental 188,718 341,464 555,666 675,666 632,593 443,761
TOTALS 1,498,410 1,502,931 1,753,072 2,030,865 1,903,727 1,746,077

34
DEPARTMENT: 15-MAYOR AND COUNCIL DIVISION: MANAGEMENT
The Mayor & Council serve as the legislative and governing body of the City. All powers of the City, except as
otherwise provided in the Home Rule Charter, are vested in the City Council, which provides for the exercise and
performance of all duties and obligations imposed upon the City by law.
Expenditures by Category
FY2015 Actual
FY2016 Actual
FY2017 Adopted Budget
FY2017 Amended
Budget
FY 2017 Projected
Actual
FY 2018 Proposed
Budget
Personnel Services
Supplies 268 153 150 150 151 150
Contractual Services 47,005 54,502 46,100 41,815 32,114 46,100
Total Categories 47,274 54,655 46,250 41,965 32,265 46,250
Authorized Personnel (FTEs)
Position/Title Pay Grade FY 2016 FY 2017 FY 2018
Mayor N/A 1 1 1
Councilmembers N/A 4 4 4
Total 5 5 5
FY 2018 Strategic Goal 2017 Strategic Map
Ensure development of a professional staff, which are empowered to work
towards the implementation of key goals for the Council
Efficiency
Provide citizens opportunities for input through Facebook, website, Regular
City Council meetings, and various other avenues.
Community Pride
`
35
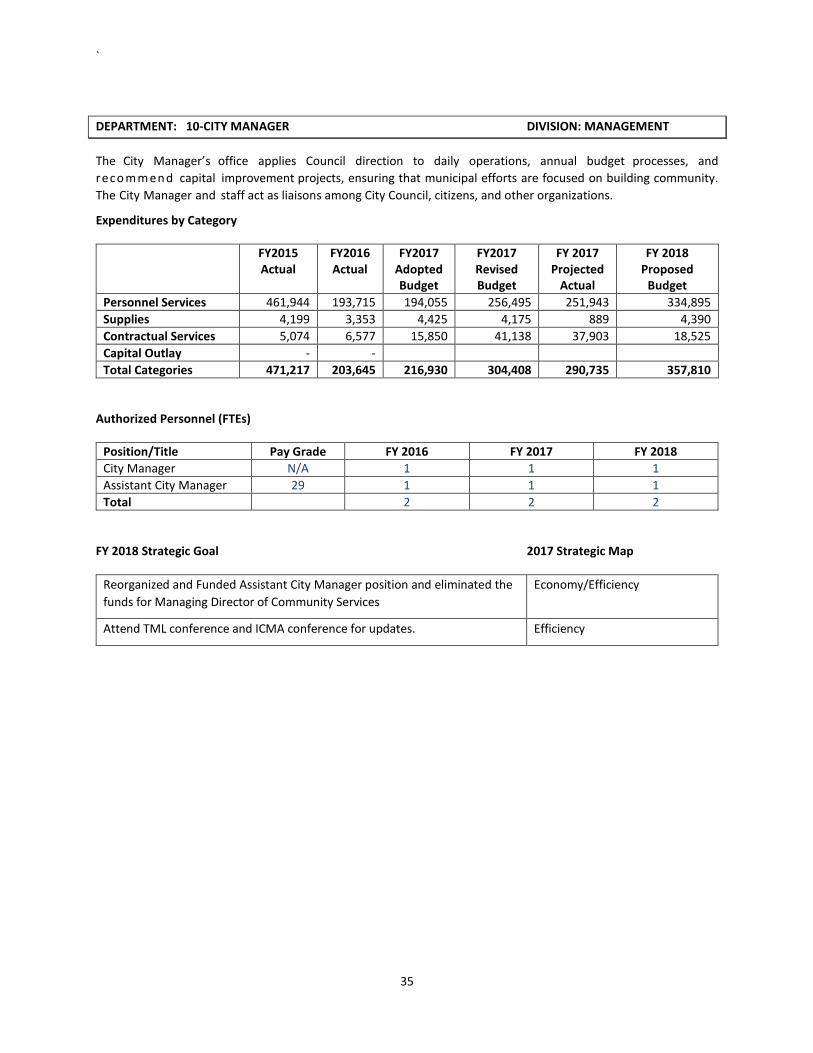
DEPARTMENT: 10-CITY MANAGER DIVISION: MANAGEMENT
The City Manager’s office applies Council direction to daily operations, annual budget processes, and
reco m m end capital improvement projects, ensuring that municipal efforts are focused on building community.
The City Manager and staff act as liaisons among City Council, citizens, and other organizations.
Expenditures by Category
FY2015 Actual
FY2016 Actual
FY2017 Adopted Budget
FY2017 Revised Budget
FY 2017 Projected
Actual
FY 2018 Proposed
Budget
Personnel Services 461,944 193,715 194,055 256,495 251,943 334,895
Supplies 4,199 3,353 4,425 4,175 889 4,390
Contractual Services 5,074 6,577 15,850 41,138 37,903 18,525
Capital Outlay - -
Total Categories 471,217 203,645 216,930 304,408 290,735 357,810
Authorized Personnel (FTEs)
Position/Title Pay Grade FY 2016 FY 2017 FY 2018
City Manager N/A 1 1 1
Assistant City Manager 29 1 1 1
Total 2 2 2
FY 2018 Strategic Goal 2017 Strategic Map
Reorganized and Funded Assistant City Manager position and eliminated the
funds for Managing Director of Community Services
Economy/Efficiency
Attend TML conference and ICMA conference for updates. Efficiency

36
DEPARTMENT: 11-LEGAL DIVISION: MANAGEMENT
The Legal Department, through its appointed Attorney, provides legal advice, attends Council meetings, prosecutes
and defends litigation involving the City, and advises City officials on national and state laws impacting City.
Currently the City is using Birdsong & Armstrong Attorney at Law on a contractual basis.
Expenditures by Category
FY2015 Actual
FY2016 Actual
FY2017 Adopted Budget
FY2017 Amended
Budget
FY 2017 Projected
Actual
FY 2018 Adopted Budget
Personnel Services
Supplies 37 27 50 50 50 50
Contractual Services 79,618 104,994 95,300 188,200 185,894 101,800
Capital Outlay
Total Categories 79,655 105,021 95,350 188,250 185,944 101,850
Authorized Personnel (FTEs)
Position/Title Pay Grade FY 2016 FY 2017 FY 2018
N/A N/A N/A N/A
Total
FY 2018 Strategic Goal 2017 Strategic Map
Continue preparation and review of all required municipal ordinances,
contracts, resolutions and legal instruments and opinions. Handle legal issues
in a cost-efficient manner.
Economy/Efficiency
Act on the City’s behalf in law suits, proceedings in court, and administrative
agencies as needed
Efficiency
Assist with collection procedures with regards to court receivables Efficiency

`
37
DEPARTMENT: 16-CITY SECRETARY DIVISION: MANAGEMENT
The City Secretary serves as the liaison between City administration and the elected officials. This officer helps with the preparation of Council agendas, gives notice of Council meetings, keeps minutes, enrolls approved laws, resolutions and ordinances, keeps the corporate seal, countersigns applicable commission, licenses and contracts, administers City elections, conducts appointments, responds to request for Public Information, and maintains an appropriate records management program.
Expenditures by Category
FY2015 Actual
FY2016 Actual
FY2017 Adopted Budget
FY2017 Amended
Budget
FY 2017 Projected
Actual
FY 2018 Adopted Budget
Personnel Services 162,020 228,824 174,829 119,769 112,301 111,765
Supplies 5,282 8,149 5,600 5,560 4,648 4,200
Contractual Services 12,318 29,323 35,600 46,160 38,580 34,603
Capital Outlay - - 750 750 0 -
Total Categories 179,620 266,296 216,779 172,279 155,529 150,568
Authorized Personnel (FTEs)
Position/Title Pay Grade
FY 2016 FY 2017 FY 2018
City Secretary 26 1 1 1
Deputy City Secretary 17 0 0 1
Compliance & Finance Specialists 19 1 1 0
Total 2 2 2
FY 2018 Strategic Goal 2017 Strategic Map
Continue preparation and review of all required municipal ordinances,
contracts, resolutions and legal instruments and opinions. Handle legal issues
in a cost-efficient manner.
Economy/Efficiency
Act on the City’s behalf in law suits, proceedings in court, and administrative
agencies as needed
Efficiency
Assist with collection procedures with regards to court receivables Efficiency
38
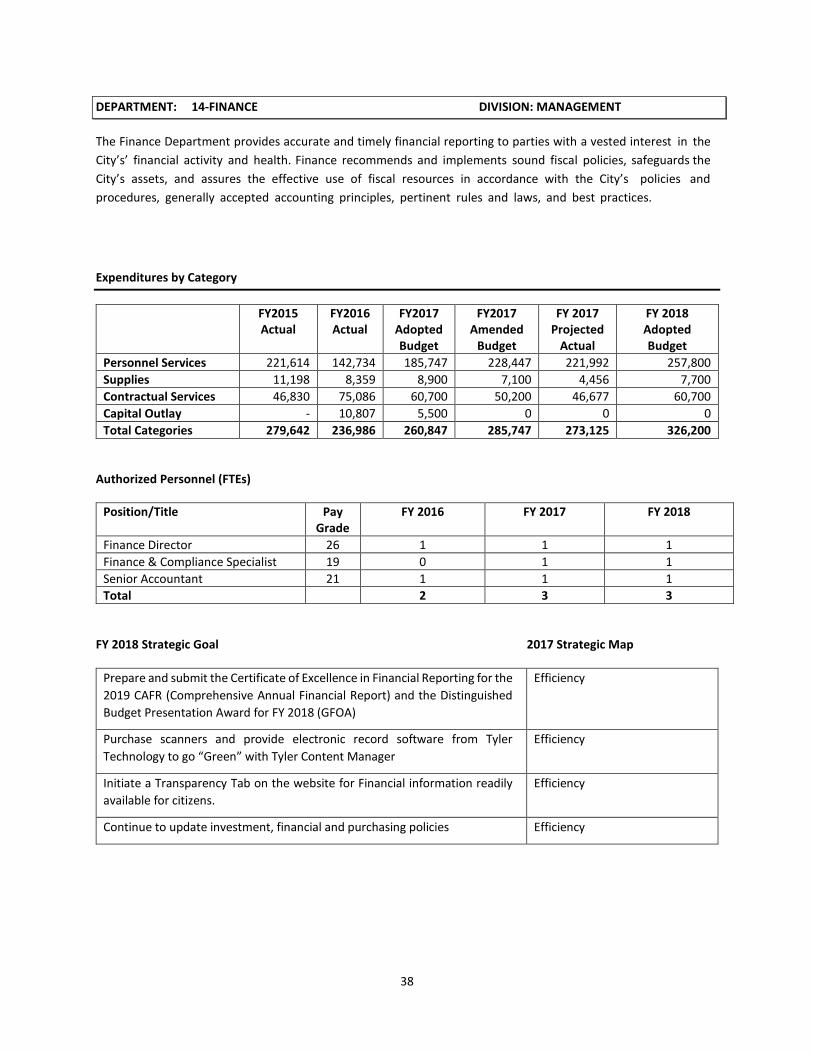
DEPARTMENT: 14-FINANCE DIVISION: MANAGEMENT
The Finance Department provides accurate and timely financial reporting to parties with a vested interest in the
City’s’ financial activity and health. Finance recommends and implements sound fiscal policies, safeguards the
City’s assets, and assures the effective use of fiscal resources in accordance with the City’s policies and
procedures, generally accepted accounting principles, pertinent rules and laws, and best practices.
Expenditures by Category
FY2015 Actual
FY2016 Actual
FY2017 Adopted Budget
FY2017 Amended
Budget
FY 2017 Projected
Actual
FY 2018 Adopted Budget
Personnel Services 221,614 142,734 185,747 228,447 221,992 257,800
Supplies 11,198 8,359 8,900 7,100 4,456 7,700
Contractual Services 46,830 75,086 60,700 50,200 46,677 60,700
Capital Outlay - 10,807 5,500 0 0 0
Total Categories 279,642 236,986 260,847 285,747 273,125 326,200
Authorized Personnel (FTEs)
Position/Title Pay Grade
FY 2016 FY 2017 FY 2018
Finance Director 26 1 1 1
Finance & Compliance Specialist 19 0 1 1
Senior Accountant 21 1 1 1
Total 2 3 3
FY 2018 Strategic Goal 2017 Strategic Map
Prepare and submit the Certificate of Excellence in Financial Reporting for the
2019 CAFR (Comprehensive Annual Financial Report) and the Distinguished
Budget Presentation Award for FY 2018 (GFOA)
Efficiency
Purchase scanners and provide electronic record software from Tyler
Technology to go “Green” with Tyler Content Manager
Efficiency
Initiate a Transparency Tab on the website for Financial information readily
available for citizens.
Efficiency
Continue to update investment, financial and purchasing policies Efficiency

`
39
DEPARTMENT: 12-HUMAN RESOURCES DIVISION: MANAGEMENT
The Human Resources Department coordinates and administers the City’s compensation and benefits package with
the goal to attract, promote, and retain quality employees. Human Resources aids department in recruitment,
organizes new employee on boarding, and offers training opportunities.
Expenditures by Category
FY2015 Actual
FY2016 Actual
FY2017 Adopted Budget
FY2017 Amended
Budget
FY 2017 Projected
Actual
FY 2018 Proposed
Budget
Personnel Services 125,339 92,509 165,552 144,632 118,267 155,475
Supplies 4,578 8,455 8,250 8,250 5,346 9,444
Contractual Services 15,016 79,419 23,450 44,370 46,151 42,000
Total Categories 144,933 180,383 197,252 197,252 169,764 206,919
Authorized Personnel (FTEs)
Position/Title Pay Grade FY 2016 FY 2017 FY 2018
HR Director 26 1 1 1
HR Manager 25 1 0 0
HR Coordinator 17 0 1 1
Total 2 2 2
FY 2018 Strategic Goal 2017 Strategic Map
Continue with updates to the Administrative Directives after review. Efficiency
Complete and implementation of the Compensation Study with Evergreen
Solutions.
Efficiency
Update internal documentation and operational procedures. Efficiency
Increase employee engagement and team building Efficiency
Implementation of the Tyler Technology Human Resource module. Efficiency

40
DEPARTMENT: 55-NON-DEPARTMENTAL DIVISION: MANAGEMENT
This department accounts for services not accounted for somewhere else or that are not included in any other
departments, i.e. insurance, workers compensation, contractual agreements, and aid to organizations, email and
computer technology, etc.
Expenditures by Category
FY2015 Actual
FY2016 Actual
FY2017 Adopted Budget
FY2017 Amended
Budget
FY 2017 Projected
Actual
FY 2018 Adopted Budget
Personnel Services - - 22,167 22,167 1,000 23,000
Supplies 2,266 558 2,338 22,338 10,997 -
Contractual Services 186,452 270,229 531,161 531,161 350,527 420,761
Capital Outlay - 6,899 - - 274,012 -
Unclassified - 63,788 - - - -
Total Categories 188,718 341,464 555,666 675,666 632,593 443,761
Authorized Personnel (FTEs)
Position/Title Pay Grade FY 2016 FY 2017 FY 2018
N/A
Total
FY 2018 Strategic Goal 2017 Strategic Map
Provide for contractual expenses i.e. Microsoft 365 email accounts for 137
employees; Tyler Hosted subscription based Financial software, including
Finance and Court
Efficiency
Funded $40,000 for Aid to Organizations for the following: Community Pride
Contractual agreements with TML for liability and workers’ compensation Efficiency/Economy

`
41
DEPARTMENT: 50-MUNICIPAL COURT DIVISION: MANAGEMENT
The Municipal Court’s mission is to act as an impartial forum to address legal charges brought against an individual.
The Court schedules appearances before a judge, summons jurors, collects fines as levied, issues warrant, and
performs court administrative duties as necessary.
Expenditures by Category
FY2015 Actual
FY2016 Actual
FY2017 Adopted Budget
FY2017 Amended
Budget
FY 2017 Projected
Actual
FY 2018 Adopted Budget
Personnel Services 90,412 95,055 141,383 142,383 149,362 95,006
Supplies 4,379 3,928 4,600 4,900 4,689 4,300
Contractual Services 12,561 15,498 18,015 18,015 9,722 14,015
Capital Outlay - - - - - -
Total Categories 107,352 114,481 163,998 165,298 163,772 113,321
Authorized Personnel (FTEs)
Position/Title Pay Grade
FY 2016 FY 2017 FY 2018
Municipal Court Clerk 14 0 1 0
Municipal Court Administrator 16 1 1 1
Municipal Judge N/A 1 1 1
Total 2 3 2
FY 2018 Strategic Goal 2017 Strategic Map
Review and update efficiencies with in the court processes. Efficiency
Initiate electronic scanning of court documents and electronic signatures
using Tyler Technology.
Efficiency
Update cameras and surveillance equipment for customer service areas Efficiency/Economy

42
Community Services
FY2015 Actual
FY2016 Actual
FY2017 Adopted Budget
FY2017 Revised Budget
FY 2017 Projected
Actual
FY 2018 Adopted Budget
Facilities 139,757 221,822 182,800 182,800 161,890 161,121
Streets 1,025,447 1,317,907 1,399,510 1,513,407 1,460,359 1,211,607
Parks 348,724 986,681 759,903 721,523 637,907 792,454
Fleet Maintenance 167,841 206,742 209,015 209,015 198,326 204,312
TOTALS 1,681,769 2,733,152 2,551,228 2,626,745 2,458,482 2,369,494

`
43
DEPARTMENT: 20-COMMUNITY SERVICES DIVISION: COMMUNITY SERVICES
This department is no longer used as FY 2018. It has been included in the City Managers’ budget and is not
considered a separate department
Expenditures by Category
FY2015 Actual
FY2016 Actual
FY2017 Adopted Budget
FY2017 Amended
Budget
FY 2017 Projected
Actual
FY 2018 Adopted Budget
Personnel Services - 72,273 88,637 88,637 73,494 0
Supplies - 3,132 2,000 1,650 469 0
Contractual Services 152,000 93,701 3,800 4,150 5144 0
Capital Outlay - - - -
Total Categories 152,000 169,106 94,437 94,437 79,095 0
Authorized Personnel (FTEs)
Position/Title Pay Grade FY 2016 FY 2017 FY 2018
Community Development Director
26 1 1 0
Total 1 1 0
FY 2018 Strategic Goal 2017 Strategic Map
This department has been deleted in whole and funds reallocated to the City
Manager’s office. The Manager of Development Services has been unfunded
for FY 2018.
Efficiency

44
DEPARTMENT: 17-FACILITIES DIVISION: ADMINISTRATION
Facilities Department funds the safe and comfortable working environments for all employees in City facilities.
Provides efficient and cost-effective resolutions to service contracts including electricity, small repairs and
maintenance. This department also provides funding for special projects of City facilities.
Expenditures by Category
FY2015 Actual
FY2016 Actual
FY2017 Adopted Budget
FY2017 Amended
Budget
FY 2017 Projected
Actual
FY 2018 Adopted Budget
Personnel Services - - - - - 46,551
Supplies 11,043 10,224 9,500 9,500 10,440 9,670
Contractual Services 103,054 211,598 103,800 108,550 151,450 104,900
Capital Outlay 25,660 - 69,500 64,750 0 -
Total Categories 139,757 221,822 182,800 182,800 161,890 161,121
Authorized Personnel (FTEs)
Position/Title Pay Grade
FY 2016 FY 2017 FY 2018
Facilities Maintenance Tech 11 0 0 1
Total 0 0 1
FY 2018 Strategic Goal 2017 Strategic Map
Reallocate a part-time employee used at the Cain Center for general
maintenance and service of all buildings
Efficiency

`
45
DEPARTMENT: 32-STREETS DIVISION: COMMUNITY SERVICES
The Streets Department maintains streets and drainage systems to ensure they are in safe condition. Streets also
responds to emergency conditions associated with accidents and weather events.
Expenditures by Category
FY2015 Actual
FY2016 Actual
FY2017 Adopted Budget
FY2017 Amended
Budget
FY 2017 Projected
Actual
FY 2018 Adopted Budget
Personnel Services 441,109 451,390 471,510 471,510 442,532 487,737
Supplies 138,750 107,463 145,100 124,600 106,324 141,820
Contractual Services 235,920 246,949 205,900 259,017 259,017 232,050
Capital Outlay 209,668 512,105 577,000 658,280 652,487 350,000
Total Categories 1,025,447 1,317,907 1,399,510 1,513,407 1,460,359 1,211,607
Authorized Personnel (FTEs)
Position/Title Pay Grade FY 2016 FY 2017 FY 2018
Streets Laborer 11 4 4 4
Equipment Operator 13 1 1 1
Equipment Operator II 15 1 1 1
Foreman 16 1 1 1
Streets Superintendent 21 1 1 1
Total 8 8 8
FY 2018 Strategic Goal 2017 Strategic Map
Expand annual Street Rehabilitation Program Planning and Growth
Implement a Drainage Utility and create a process by which projects are
identified, assessed and corrected.
Planning and Growth

46
DEPARTMENT: 34-PARKS DIVISION: COMMUNITY SERVICES
The Parks Division provides maintenance of the parks, municipal facilities, medians, rights of way, and athletic fields.
Parks ensures that all grounds are safe and in good condition for patrons.
Expenditures by Category
FY2015 Actual
FY2016 Actual
FY2017 Adopted Budget
FY2017 Amended
Budget
FY 2017 Projected
Actual
FY 2018 Adopted Budget
Personnel Services 246,514 375,760 449,103 449,103 385,621 527,934
Supplies 33,261 42,560 47,250 51,250 55,441 57,320
Contractual Services 58,974 92,766 81,550 92,400 78,672 96,700
Capital Outlay 9,975 475,595 182,000 128,770 118,173 110,000
Total Categories 348,724 986,681 759,903 721,523 637,907 792,454
Authorized Personnel (FTEs)
Position/Title Pay Grade
FY 2016 FY 2017 FY 2018
Parks Laborer 8 2 2 2
Parks Maintenance Technician 11 4 4 4
Equipment Operator I 13 1 1 1
Parks Foreman 16 1 1 1
Total 8 8 8
FY 2018 Strategic Goal 2017 Strategic Map
Improvement projects, i.e. Peach Park and Soccer Complex at Coleman Park.
Examples are outdoor basketball court, benches, grills, landscaping and
restrooms.
Planning and Growth

`
47
DEPARTMENT: 38-FLEET MAINTENANCE DIVISION: COMMUNITY SERVICES
Fleet M a i n t e n a n c e maintains City vehicles and equipment to p r o v i d e h i g h standards of safety and
efficiency through repairs and routine maintenance to allow City staff to be as efficient as possible.
Expenditures by Category
FY2015 Actual
FY2016 Actual
FY2017 Adopted Budget
FY2017 Amended
Budget
FY 2017 Projected
Actual
FY 2018 Proposed
Budget
Personnel Services 146,958 158,918 164,302 164,302 157,989 176,192
Supplies 12,724 14,303 15,713 15,713 15,845 14,770
Contractual Services 8,159 10,371 13,000 13,000 9,341 13,350
Capital Outlay - 23,150 16,000 16,000 15,151 -
Total Categories 167,841 206,742 209,015 209,015 198,326 204,312
Authorized Personnel (FTEs)
Position/Title Pay Grade FY 2016 FY 2017 FY 2018
Fleet Maintenance Superintendent
21 1 1 1
Mechanic I 11 1 1 0
Mechanic II 14 1 1 2
Total 3 3 3
FY 2018 Strategic Goal 2017 Strategic Map
Maintain a comprehensive inventory program to monitor and control the use
of fuel, oil, lubricant, and other fleet related supplies.
Efficiency
Purchase a large Shop Fan for mechanics to improve working conditions for
shop employees
Efficiency
Provide assistance with annual equipment auction as needed Efficiency

48
Development Services
FY2015 Actual
FY2016 Actual
FY2017 Adopted Budget
FY2017 Revised Budget
FY 2017 Projected
Actual
FY 2018 Adopted Budget
Planning & Development 194,686 282,423 302,350 452,350 452,175 366,578
Code Enforcement 284,702 986 128,431 128,431 105,886 191,841
Total 479,388 283,409 430,781 580,781 558,061 558,419

`
49
DEPARTMENT: 22-CODE ENFORCEMENT DIVISION: DEVELOPMENT SERVICES
Code Enforcement protects the health, safety, and well-being of the citizens of Athens, through routine inspections,
education, monitoring, investigation, and enforcement of food and environmental ordinances.
Expenditures by Category
FY2015 Actual
FY2016 Actual
FY2017 Adopted Budget
FY2017 Amended
Budget
FY 2017 Projected
Actual
FY 2018 Adopted Budget
Personnel Services 195,215 - 112,701 110,201 93,054 122,139
Supplies 20,314 986 6,400 8,150 6,976 13,742
Contractual Services 49,733 - 9,330 10,080 5,856 55,960
Capital Outlay 19,440 - - - - -
Total Categories 284,702 986 128,431 128,431 105,950 191,841
Authorized Personnel (FTEs)
Position/Title Pay Grade FY 2016 FY 2017 FY 2018
CodeEnforcemt Coordinator
15 0 1 2
Building Official 0 0 1
Code Enforcement Officer 15 1 1 1
Total 1 2 2
FY 2018 Strategic Goal 2017 Strategic Map
Provide training to Enforcement Officer to upgrade position to a Building
Inspector with IBC certification, including plumbing and reduce the use of
Bureau of Veritas for inspections
Community Pride

50
DEPARTMENT: 24-PLANNING & DEVELOPMENT DIVISION: DEVELOPMENT SERVICES
The Planning & Development department administers and enforces the building construction, fire, zoning, and
property codes to ensure a safe, well-maintained community and promote a high quality of life.
Expenditures by Category
FY2015 Actual
FY2016 Actual
FY2017 Adopted Budget
FY2017 Amended
Budget
FY 2017 Projected
Actual
FY 2018 Adopted Budget
Personnel Services 187,527 101,733 132,825 197,825 204,014 258,994
Supplies 2,393 8,805 7,225 7,225 6,224 12,563
Contractual Services 4,766 171,649 154,300 219,502 214,315 95,021
Capital Outlay - 236 8,000 27,798 27,622 -
Total Categories 194,686 282,423 302,350 452,245 452,175 366,578
Authorized Personnel (FTEs)
Position/Title Pay Grade FY 2016 FY 2017 FY 2018
GIS Technician 14 1 1 1
Development Coordinator 19 1 1 1
Development Services Director
26 0 1 1
Total 2 3 3
FY 2018 Strategic Goal 2017 Strategic Map
Refresh and support useful tools found in the Comprehensive Plan Planning and Growth
Redevelop the annexation plan for the City; Gather information from citizens
regarding zoning and ordinances changes that need to occur
Planning and Growth

`
51
Fire Services
FY2015 Actual
FY2016 Actual
FY2017 Adopted Budget
FY2017 Revised Budget
FY 2017 Projected
Actual
FY 2018 Proposed
Budget
Fire & Disaster Services 2,433,479 2,612,525 2,840,640 2,840,640 2,712,776 2,793,355
Total 2,433,479 2,612,525 2,840,640 2,840,640 2,712,776 2,793,355
100%
Fire Services

52
DEPARTMENT: 46-FIRE & DISASTER SERVICES DIVISION: FIRE SERVICES
The Fire Department is responsible for serving the public by preserving and protecting life, property, and
the environment for the citizens of Athens and surrounding areas.
Expenditures by Category
FY2015 Actual
FY2016 Actual
FY2017 Adopted Budget
FY2017 Amended
Budget
FY 2017 Projected
Actual
FY2018 Proposed
Budget
Personnel Services 2,246,353 2,373,708 2,364,715 2,364,715 2,343,927 2,488,400
Supplies 47,378 78,471 79,150 75,661 61,150 78,580
Contractual Services 104,335 120,404 103,775 103,775 121,545 125,275
Long Term Debt - - - - - 101,100
Capital Outlay 35,414 48,970 293,000 296,489 186,154 0
Total Categories 2,433,480 2,612,525 2,840,640 2,840,640 2,712,776 2,793,355
Authorized Personnel (FTEs)
Position/Title Pay Grade
FY 2016 FY 2017 FY 2018
Firefighter CS-19 18 18 18
Fire Lieutenant F-20 3 3 3
Fire Captain CS-21 3 3 3
Battalion Chief/Fire Marshall F-24 1 1 1
Fire Chief/EMS Coordinator 28 1 1 1
Total 26 26 26
FY 2018 Strategic Goal 2017 Strategic Map
Maintain requirements for Insurance Services Office (ISO) public protection
classification rating. Our current ISO rating is a
Efficiency
Initiate a reorganization of personnel for Fire Marshall’s office for inspections
and assistance.
Quality of Life
Enhance software capabilities for station/apparatus maintenance, fire
reports and daily operations.
Efficiency

`
53
Police Services
FY2015 Actual
FY2016 Actual
FY2017 Adopted Budget
FY2017 Revised Budget
FY 2017 Projected
Actual
FY 2018 Proposed
Budget
Animal Control 97,823 322,671 106,660 106,660 100,816 121,984
Police Administration 278,532 287,934 293,089 294,789 287,336 302,912
Police Investigation 453,735 488,819 494,712 494,712 464,626 481,632
Police Patrol 1,681,083 1,793,801 2,055,926 1,833,426 1,784,043 2,027,620
Police Support 641,350 633,309 710,012 633,916 594,078 694,072
Total 3,152,608 3,526,535 3,660,399 3,363,503 3,230,899 3,628,220
Animal Control4%
Administration8%
Investigation13%
Patrol56%
Support19%
Animal Control
Administration
Investigation
Patrol
Support

54
DEPARTMENT: 49-ANIMAL CONTROL DIVISION: POLICE SERVICES
The Animal Control department is committed to the humane treatment of domesticated animals and of wildlife.
This department is also responsible for educating the citizens animal services-related issues and rabies alerts.
Expenditures by Category
FY2015 Actual
FY2016 Actual
FY2017 Adopted Budget
FY2017 Amended
Budget
FY 2017 YTD
Actual
FY 2018 Adopted Budget
Personnel Services 40,908 110,519 47,055 47,055 44,742 50,044
Supplies 3,619 5,896 5,600 5,600 3,145 5,100
Contractual Services 53,296 206,257 54,005 54,005 52,929 66,840
Total Categories 97,823 322,671 106,660 106,660 100,816 121,984
Authorized Personnel (FTEs)
Position/Title Pay Grade FY 2015 FY 2016 FY 2017
Animal Control Officer 13 1 1 1
Total 1 1 1
FY 2018 Strategic Goal 2017 Strategic Map
Provide $65,000 funding support for outsourcing the day to day operations of
the animal shelter
Efficiency

`
55
DEPARTMENT: 51-POLICE ADMINISTRATION DIVISION: POLICE SERVICES
The mission of the Athens Police Department is to maintain a safe and peaceful community environment by
providing effective law enforcement services through partnerships, community education, and outstanding public
service.
Expenditures by Category
FY2015 Actual
FY2016 Actual
FY2017 Adopted Budget
FY2017 Amended
Budget
FY 2017 Projected
Actual
FY 2018 Adopted Budget
Personnel Services 268,966 276,735 276,739 276,739 271,392 286,762
Supplies 5,214 3,793 7,000 7,000 4,560 6,800
Contractual Services 4,352 7,406 9,350 11,050 11,384 9,350
Capital Outlay - - - - - -
Total Categories 278,532 287,934 293,089 294,789 287,336 302,912
Authorized Personnel (FTEs)
Position/Title Pay Grade FY 2016 FY 2017 FY 2018
Police Chief 28 1 1 1
Assistant Police Chief CS-26 1 1 1
Total 2 2 2
FY 2018 Strategic Goal 2017 Strategic Map
Initiate hiring and training 4 officers as the law enforcement team approved
in the FY 2017 agreement with Athens Independent School District. The
district has agreed to reimburse the City 75% of the costs.
Community Pride

56
DEPARTMENT: 52-POLICE INVESTIGATION DIVISION: POLICE SERVICES
The Criminal Investigation Department is an integral part of the Athens Police Department. Their responsibilities
include, the investigations of violent crimes, major property crimes and other investigations which require a degree
of specialized investigative approach. The investigators coordinate with local, state, and federal resources in their
investigative efforts.
Expenditures by Category
FY2015 Actual
FY2016 Actual
FY2017 Adopted Budget
FY2017 Amended
Budget
FY 2017 Proposed
Actual
FY 2018 Adopted Budget
Personnel Services 403,634 451,843 436,912 436,912 424,232 450,432
Supplies 16,009 9,189 18,450 18,450 11,120 15,050
Contractual Services 9,604 8,808 18,350 18,350 8,807 16,150
Capital Outlay 24,488 18,979 21,000 21,000 20,895 -
Total Categories 453,735 488,819 494,712 494,712 463,626 481,632
Authorized Personnel (FTEs)
Position/Title Pay Grade FY 2016 FY 2017 FY 2018
Police Sergeant CS-21 1 1 1
Police Officer CS-19 3 3 3
Corporal P-20 1 1 1
Total 5 5 5
FY 2018 Strategic Goal 2017 Strategic Map
Initiate an increase in Assignment Pay for detectives Efficiency

`
57
DEPARTMENT:53-POLICE PATROL DIVISION: POLICE SERVICES
The Patrol department is the most visible of all our departments. It is primarily responsible for responding
to calls for service, enforcing traffic laws, and preventive patrol. Patrol officers also conduct preliminary
investigations of criminal activity discovered or reported during their tour of duty.
Expenditures by Category
FY2015 Actual
FY2016 Actual
FY2017 Adopted Budget
FY2017 Amended
Budget
FY 2017 Projected
Actual
FY 2018 Adopted Budget
Personnel Services 1,410,918 1,514,557 1,704,663 1,504,663 1,417,249 1,919,020
Supplies 117,110 82,504 90,329 88,899 72,865 78,950
Contractual Services 16,655 30,288 214,584 33,714 70,672 29,650
Capital Outlay 136,400 166,452 46,350 170,150 223,257 -
Total Categories 1,681,083 1,793,801 2,055,926 1,833,426 1,784,043 2,027,620
Authorized Personnel (FTEs)
Position/Title Pay Grade
FY 2016 FY 2017 FY 2018
Police Officer CS-19 8 14 14
Police Corporal P-20 4 4 4
Police Lieutenant P-23 1 1 1
Police Sergeant CS-21 4 4 4
Total 17 23 23
FY 2018 Strategic Goal 2017 Strategic Map
Replace L-3 Communications EMA for video server; 13 vehicle video systems,
and 4 body cameras
Efficiency
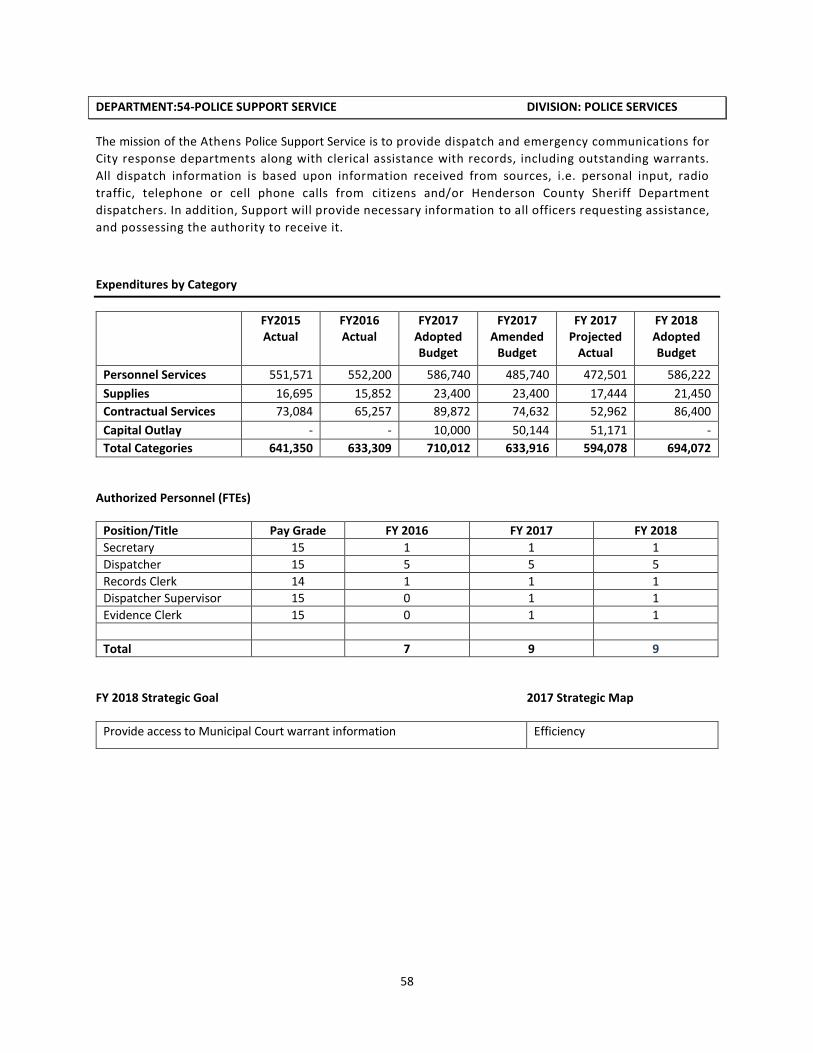
58
DEPARTMENT:54-POLICE SUPPORT SERVICE DIVISION: POLICE SERVICES
The mission of the Athens Police Support Service is to provide dispatch and emergency communications for
City response departments along with clerical assistance with records, including outstanding warrants.
All dispatch information is based upon information received from sources, i.e. personal input, radio
traffic, telephone or cell phone calls from citizens and/or Henderson County Sheriff Department
dispatchers. In addition, Support will provide necessary information to all officers requesting assistance,
and possessing the authority to receive it.
Expenditures by Category
FY2015 Actual
FY2016 Actual
FY2017 Adopted Budget
FY2017 Amended
Budget
FY 2017 Projected
Actual
FY 2018 Adopted Budget
Personnel Services 551,571 552,200 586,740 485,740 472,501 586,222
Supplies 16,695 15,852 23,400 23,400 17,444 21,450
Contractual Services 73,084 65,257 89,872 74,632 52,962 86,400
Capital Outlay - - 10,000 50,144 51,171 -
Total Categories 641,350 633,309 710,012 633,916 594,078 694,072
Authorized Personnel (FTEs)
Position/Title Pay Grade FY 2016 FY 2017 FY 2018
Secretary 15 1 1 1
Dispatcher 15 5 5 5
Records Clerk 14 1 1 1
Dispatcher Supervisor 15 0 1 1
Evidence Clerk 15 0 1 1
Total 7 9 9
FY 2018 Strategic Goal 2017 Strategic Map
Provide access to Municipal Court warrant information Efficiency

`
59
UTILITY FUND

60
UTILITY FUND REVENUE AND EXPENDITURE SUMMARY
REVENUE SUMMARY FY2015 Actual
FY2016 Actual
FY2017 Adopted Budget
FY2017 Amended
Budget
FY 2017 Projected
Actual
FY 2018 Adopted Budget
OPERATING REVENUE 5,040,718 5,463,519 5,591,101 5,951,101 5,502,374 5,663,360
INTRAGOVERNMENT 275,327 237,300 - - - -
INTERGOVERNMENT 325,008 207,000 207,000 200,000 200,000 200,000
REIMBURSING REV 8,535 7,404 500 500 13,410 500
NON-OPERATING 128,171 158,307 97,800 97,800 194,616 119,500
OTHER FINANCING 558 - - - - -
TOTAL REVENUES 5,040,718 6,073,531 6,256,401 6,256,401 5,910,398 5,983,360
EXPENDITURE SUMMARY FY2015 Actual
FY2016 Actual
FY2017 Adopted Budget
FY2017 Amended
Budget
FY 2017 Projected
Actual
FY 2018 Adopted Budget
61-UTILITY ADMIN 309,068 341,408 554,917 494,120 256,299 337,438
62-WATER UTILITY 977,261 990,822 1,581,406 1,531,406 1,098,268 1,198,799
63-DISTRIBUTION & COLLECTION
1,304,430 1,102,321 1,893,896 1,748,896 1,131,489 1,358,207
65-WASTEWATER UTL 1,133,151 1,199,364 1,467,178 1,467,178 1,131,422 1,433,686
66-UTILITY BILLING 225,007 238,924 259,658 259,658 241,380 223,256
69-NON-DEPARTMENTAL 895,907 916,847 1,779,358 1,779,358 1,482,074 1,403,852
TOTAL EXPENDITURES 4,844,824 4,789,686 7,280,616 7,280,616 5,340,932 5,955,238

`
61
DEPARTMENT: 61 UTILITY ADMINISTRATION DIVISION: PUBLIC SERVICES
Mission
The Utility Administration Department assures the most efficient level of service possible with regards to personnel
management, facilities planning, regulatory agency contact, review of construction plans and specifications, material
purchasing, public relation efforts and budget preparation and management.
Expenditures by Category
FY2015 Actual
FY2016 Actual
FY2017 Adopted Budget
FY2017 Amended
Budget
FY 2017 Projected
Actual
FY 2018 Adopted Budget
Personnel Services 247,564 209,578 309,507 253,710 194,055 222,273
Supplies 5,638 14,267 13,850 8,850 9,444 5,290
Contractual Services 52,171 113,868 216,280 216,280 215,216 109,875
Capital Outlay - - 15,280 15,280 15,204 -
Total Categories 309,069 341,409 554,917 494,120 433,918 337,438
Authorized Personnel (FTEs)
Position/Title Pay Grade FY 2016 FY 2017 FY 2018
Managing Director 26 0 1 1
Public Utilities Director 25 1 1 1
Total 1 2 2
FY 2018 Strategic Goal 2017 Strategic Map
Completion of rehab of North Loop and Royal Mountain water storage tanks;
completion of water model study and treatment plan-Optimization Study
Efficiency
Development of water and sewer line replacement program Quality of Life

62
DEPARTMENT: 62-WATER UTILITY DIVISION: PUBLIC SERVICES
The Water Utility Department is responsible for the operations of the water plant and storage tanks within the City
of Athens. Delivering potable water from Athens Municipal Water District and palatable water with adequate
pressure along with maintenance and repairs. Also provided is 24-hour emergency repair response to ensure
continuous water service with minimal interruption.
Expenditures by Category
FY2015 Actual
FY2016 Actual
FY2017 Adopted Budget
FY2017 Amended
Budget
FY 2017 Projected
Actual
FY 2018 Adopted Budget
Personnel Services 395,093 386,499 408,006 408,006 405,972 430,359
Supplies 133,375 124,665 269,500 269,500 268,153 182,740
Contractual Services 412,960 428,651 453,900 453,900 451,703 510,700
Capital Outlay - 740 450,000 400,000 398,000 75,000
Depreciation 35,834 50,266 - - -
Total Categories 977,262 990,821 1,581,406 1,531,406 1,523,827 1,198,799
Authorized Personnel (FTEs)
Position/Title Pay Grade
FY 2016 FY 2017 FY 2018
Water Plant Operator 14 3 3 3
Water Plant Foreman 16 1 1 1
WWT Plant Operator 14 1 1 2
Water Prod Superintendent 21 1 1 1
Total 6 6 7
FY 2018 Strategic Goal 2017 Strategic Map
Proactive on repairs on pumps Efficiency
Replace miscellaneous equipment or machinery at the plant, wells, or storage
tanks for $75,000
Quality of Life
Funded night shift incentive pay Efficiency
Funded a new computer Efficiency

`
63
DEPARTMENT: 63- DISTRIBUTION & COLLECTION DIVISION: PUBLIC SERVICES
The Distribution & Collection Department is responsible for the maintenance and repair of water transmission lines
within the City of Athens distribution system, the monthly meter reading of 4,800+ water accounts and the repair
or replacement of meters.
Expenditures by Category
FY2015 Actual
FY2016 Actual
FY2017 Adopted Budget
FY2017 Amended
Budget
FY 2017 Projected
Actual
FY 2018 Adopted Budget
Personnel Services 522,030 544,790 581,501 581,501 578,593 589,147
Supplies 359,393 158,937 353,165 353,165 351,400 168,240
Contractual Services 86,382 49,042 113,730 129,730 129,081 173,320
Capital Outlay - - 845,500 684,500 683,713 427,500
Depreciation 336,625 349,552 - - - -
Total Categories 1,304,430 1,102,321 1,893,896 1,748,896 1,742,788 1,358,207
Authorized Personnel (FTEs)
Position/Title Pay Grade FY 2016 FY 2017 FY 2018
Line Maintenance Tech 14 6 6 7
Crew Foreman 16 1 1 1
Line Maint Crew Foreman 16 1 1 1
Utility Superintendent 21 1 1 1
Total 9 9 10
FY 2018 Strategic Goal 2017 Strategic Map
Funded line replacements of $300,000. Efficiency
Funded $100,000 for Meter Replacement Program-1 route Quality of Life
Funded Improvements to roof over the Service Center of $9,500 Community Pride
Purchase of Pole Barn to cover equipment and machinery Community Pride

64 | P a g e
DEPARTMENT: 65- WASTEWATER UTILITY DIVISION: PUBLIC SERVICES
The Wastewater Utility Department is responsible for the repair, maintenance, stoppages, lift station repair and
rehabilitation of sewer lines which receives and transports wastewater from residential, commercial and industrial
sites to the City’s lift stations, where it is pumped out to the treatment plant.
Expenditures by Category
FY2015 Actual
FY2016 Actual
FY2017 Adopted Budget
FY2017 Amended
Budget
FY 2017 Projected
Actual
FY 2018 Adopted Budget
Personnel Services 354,945 362,085 441,891 441,891 439,688 412,946
Supplies 85,727 80,500 152,860 132,860 132,196 105,740
Contractual Services 390,029 437,764 518,500 688,500 685,058 840,000
Capital Outlay - 6,916 264,000 203,927 202,907 75,000
Depreciation 302,449 312,099 - - - -
Total Categories 1,113,150 1,199,364 1,377,251 1,467,178 1,459,848 1,433,686
Authorized Personnel (FTEs)
Position/Title Pay Grade FY 2016 FY 2017 FY 2018
WWT Operator 14 5 5 5
Superintendent 21 1 1 1
Foreman 16 1 1 1
Total 7 7 7
FY 2018 Strategic Goal 2017 Strategic Map
Funded major wastewater repair projects, i.e. Imhoff tanks and clarigester Quality of Life
Re-permitting of wastewater plants Efficiency

65
DEPARTMENT: 66 UTILITY BILLING DIVISION: PUBLIC SERVICES
The Utility Billing Department consisting of office personnel with the help of field personnel, bills and collects for all
City utility services. They ensure the delivery of timely and accurate billing and payment information to our
customers; increase public awareness of utility procedures through proactive communication with customers, and
respond to customer requests and issues quickly and fairly, with the intention of satisfying each customer.
Expenditures by Category
FY2015 Actual
FY2016 Actual
FY2017 Adopted Budget
FY2017 Amended
Budget
FY 2017 Projected
Actual
FY 2018 Adopted Budget
Personnel Services 160,805 178,063 194,108 194,108 193,137 191,332
Supplies 25,584 25,515 28,000 28,000 27,860 24,000
Contractual Services 33,872 30,600 37,550 37,550 8,000 8,000
Capital Outlay - - - - - -
Depreciation 4,746 4,746 - - -
Total Categories 225,007 238,924 259,658 259,658 258,360 223,256
Authorized Personnel (FTEs)
Position/Title Pay Grade FY 2016 FY 2017 FY 2018
Utility Billing Clerk 16 1 1 2
Receptionist 13 1 1 1
Utility Specialist 16 1 1 1
Total 3 3 4
FY 2018 Strategic Goal 2017 Strategic Map
Contract with services to include printing and delivery of bills in the “cloud”
with internet access.
Efficiency
Outsourcing of IVR telephone processing of bill payments, outsourcing of the
billing process eliminating continued maintenance to printers and labor-
intensive billing process.
Efficiency
Initiate virtual surveillance cameras in lobby as security for customer service
areas.
Efficiency

66
DEPARTMENT: 69-UTILITY NON-DEPARTMENTAL DIVISION: PUBLIC SERVICES
The Non-Departmental is for specific expenditures not accounted for in other areas. This includes contractual
agreements, long term debt payments, and operating transfers to other funds.
Expenditures by Category
FY2015 Actual
FY2016 Actual
FY2017 Adopted Budget
FY2017 Amended
Budget
FY 2017 Projected
Actual
FY 2018 Adopted Budget
Personnel Services (8,756) (4,459) - - - -
Contractual Services 26,993 24,172 31,000 86,797 86,642 96,000
Long Term Debt 176,980 129,938 557,488 557,488 554,701 542,150
Capital Outlay - 48,085 150,000 260,073 258,773 10,000
Operating Transfers 650,000 704,167 875,000 875,000 870,625 755,702
Unclassified 50,690 4,945 - - - -
Total Categories 895,907 916,848 1,613,488 1,779,358 1,770,740 1,403,852
Authorized Personnel (FTEs)
Position/Title Pay Grade FY 2016 FY 2017 FY 2018
N/A
Total
FY 2018 Strategic Goal 2017 Strategic Map
Funded $540,150 for 2015 Refunding Bond payments Efficiency
Contractual agreements with Tyler Tech and Cynergy for hosted cloud Utility
Billing software, emails, and IT contractual agreements
Efficiency
Operating transfers that include PILOT (payment in lieu of taxes), 5% to the
General Fund; 50% of the City Manager, Finance and Human Resource
departments
Efficiency

67
The utility portion of the debt service payment is directly paid from the Utility Fund
in the Long Term Debt category under Non-Departmental budget. The debt
payment total for FY 2018 is $540,150.

68
Utility Fund 5-Year Capital Projects
Project Title Description Issues Category Cost Estimate
W. WWTP Influent Lines
Replace influent sewer and water lines that feed the W. WWTP.
Sewer line will be replaced on north side of creek and redected
away from the creek.
Both are exposed at a creek crossing. Significant I&I
issues. Vulnerable to widening of the creek. Regulatory $350,000
South Imhoff Tank Repair and maintenance of the South
Tank holds a significant amounto of solid materials.
Prevents settling of wastewater, stresses other WWTP
components, and creates permit vulnerability.
Regulatory $300,000
Scott Street Tank Full Rebuild of Faulk Street GSTCorrect TCEQ violations. Replacement of older metal tank
with concrete tankMandatory $600,765
North Loop Tank Rehabilitation of North Loop ESTCorrect TCEQ violations. Rust mediation, repainting,
replacement of mechanical partsMandatory $373,450
Royal Mountain Standpipe Rehabilitation of Royal Mountain StandpipeCorrect TCEQ violations. Rust mediation, repainting,
replacement of mechanical partsMandatory $406,060
Route 4 AMR Implementation Installation of Smart Meters on Route 4Increase meter reading and leak detection efficiency.
Provide customers with enhanced usage information.Efficiency $100,000
ESTIMATED TOTAL 2,130,275$
Project Title Description Issues Category Cost Estimate
South PalestineReplacement of water line on the west side of Palestine from Ben
Belt to E. College
Weak Pressure due to insufficient size, frequent leak
repairs, high commercial demand, Service Unknown
South Prairieville/ParkReplacement of water lines on Prairieville from Park to Cayuga
and on Park St. from S. Prairieville to Belmont
Weak Pressure due to insufficient size, frequent leak
repairs, high residential demandService $558,773
N. PinkertonReplacemen tof sewer line on N. Pinkerton from St. Joseph to the
N. WWTPUndersized line (6 in.), significant I&I, prone to collapse Regulatory Unknown
N. WWTP Improvement Phase 1*
Replace mechanical screen and grit system, trickling filter
rehabilitation, add belt filter press, disinfection system
improvements
Limited capacity of the WWTP and obsolete treatment
components. Recommended by the 75/90 Study
performed by KSA.
Regulatory $4,200,147
Route 5 AMR Implementation Installation of Smart Meters on Route 5Increase meter reading and leak detection efficiency.
Provide customers with enhanced usage information.Efficiency $100,000
SCADA System*Installation of telemetry, automatic data collection, a remote
operation of WTP and distribution system
Enable staff to automatically detect leaks and other plant
issues from remote locations and to perform many
operational functions remotely.
Efficiency $250,000
ESTIMATED TOTAL 5,108,920$
Project Title Description Issues Category Cost Estimate
N. WWTP Improvement Phase 2*Improvements to final clarifiers, retrofit recirculation pump
station, rehabiiatate influent lift station
Limited capacity of the WWTP and obsolete treatment
components. Recommended by the 75/90 Study
performed by KSA.
Regulatory $3,079,366
Clayton HomesReplacement and elevation of the sewer line extending from
Champion lift station to Clayton Homes
Significant I&I, ongoing blockages requiring weekly
pumping, sewage odor within Clayton homesService Unknown
Massey/Hamlet Replacement of water line from Murcheson to HamlettOutdated, undersized line. Pressure issues and frequent
leaks.Service Unknown
Corsicana to Aaron St.Replacement of sewer line from Corsicana (behind the old Arby's)
to Aaron Street
Oudated clay tile pipe, creek crossing, ongoing I&I issues,
vulnerable to leaks and collapseService Unknown
Route 6 AMR Implementation Installation of Smart Meters on Route 6Increase meter reading and leak detection efficiency.
Provide customers with enhanced usage information.Efficiency $100,000
ESTIMATED TOTAL 3,179,366$
FY 2018
FY 2019
FY 2020

69
Capital Projects continued
Project Title Description Issues Category Cost Estimate
N. WWTP Improvement Phase 3*Aeration basin expansion, sludge pump station improvements,
effluent flood pump station
Limited capacity of the WWTP and obsolete treatment
components. Recommended by the 75/90 Study
performed by KSA.
Regulatory $2,004,688
700 Block of W. CollegeReplace sewer line from 700 block of W. College to Corsicana
(behind Arby's)
Oudated clay tile pipe, creek crossing, ongoing I&I issues,
vulnerable to leaks and collapseService Unknown
Maryland/PalestineRelocate sewer from the rear to the right of way on both streets.
Bryson to Cayuga.Oudated clay tile pipe, ongoing I&I issues Service Unknown
Ward/Bradley/E. ClintonReplace sewer line from Lovers to Joe Prince, and from Lovers to
Crestview.Oudated clay tile pipe, ongoing I&I issues Service Unknown
Cayuga SewerReplacement of sewer line on west side of Cayuga from Ruth to
Highland. On east side from Oddfellows Lodge to HighlandSinkholes, ongoing I&I issues, line breaks Service Unknown
Route 7 AMR Implementation Installation of Smart Meters on Route 7Increase meter reading and leak detection efficiency.
Provide customers with enhanced usage information.Efficiency $100,000
ESTIMATED TOTAL 2,104,688$
Project Title Description Issues Category Cost Estimate
Rosedale Replace water line on entire street (horseshoe). 2 inch galvanized pipe. Ongoing leaks and pressure issues Service Unknown
Ruth Street Replace water line from Cayuga to Bunny Rabbit 2 inch galvanized pipe. Ongoing leaks and pressure issues Service Unknown
Barbara Street Replace water line from Cayuga to Bunny Rabbit 2 inch galvanized pipe. Ongoing leaks and pressure issues Service Unknown
N. WWTP Influent Line Replace 18 inch sewer line from Prairieville to the North WWTP Undersized and older pipe. Service Unknown
Powderhorn Replace water line from Bunny Rabbit to Valle Vista 2 inch galvanized pipe. Ongoing leaks and pressure issues Service Unknown
Route 8 AMR Implementation Installation of Smart Meters on Route 7Increase meter reading and leak detection efficiency.
Provide customers with enhanced usage information.Efficiency $100,000
Mosley Replace 400-500 ft. of water line beginning at Robbins Road 2 inch galvanized pipe. Ongoing leaks and pressure issues Service
ESTIMATED TOTAL 100,000$
Project Title Description Issues Category Cost Estimate
Barker Street Replace water line from Faulk Street to North Palestine1.25 inch galvenized pipe. Ongoing leaks and pressure
issues.Service Unknown
Routes 9-13 AMR Implementation Installation of Smart Meters on Route 7Increase meter reading and leak detection efficiency.
Provide customers with enhanced usage information.Efficiency $500,000
Chase Street Replace water line from Murchison to Midway Undersized line (4 inch) that needs to be looped.Efficiency/
QualityUnknown
Laure/Sunny/Freeman Replace water line on the entirety of the three streets 2 inch galvanized pipe. Ongoing leaks and pressure issues Efficiency Unknown
6th Street to West LarkinReplace sewer connection between 6th street and West Larkin
(through wooded area)
Clay Tile pipe that is prone to failure (not a critical
urgency, but we would like to be proactive in its
replacement
Regulatory Unknown
Bunny Rabbit Road Sewer LineReplace rear sewer (bring to front) from Colonial to Arrowhead.
Add front sewer to Linda Ln.
Clay Tile pipe that is prone to failure (not a critical
urgency, but we would like to be proactive in its
replacement
Regulatory Unknown
E. Clinton Replace water line on E. Clinton Service $368,094
ESTIMATED TOTAL 868,094$
2023
and
Beyond
Remaining Projects
Future Additions to 5-Year CIP
West Wastewater Treatment Plant Capital Improvements
Vehicle and Equipment Replacements
Building Improvements to Utility Service Center and Wastewater Treatment Plants
New Water and Sewer Lines to promote Development
FY 2021
FY 2022

70
DEBT SERVICE FUND

71
DEPARTMENT: DEBT SERVICE FUND DIVISION: ADMINISTRATIVE SERVICES
The Debt Service Fund is to account for the payment of principal and interest on the City’s general obligation debt.
Revenues derived from the interest and sinking portion of the property taxes and can only be used to make the
principal, interest payments, and agent fees on the debt.

72
Note: The GO Series 2015 Refunding payments are paid from the Utility Fund directly.
$4,745,000 General Obligation Refunding Bonds, Series 2015 were issued to refund the 2000
COs, 2004 COs, in business activities and the 1998 COs in the government activities. The debt has
incremental interest rates of .60% to 2.230% over the life of the bond through 2024. Debt obligations
are to be paid from the collection of ad valorem taxes and net revenues of the utility system.
$11,755,000 Combination Tax and Revenue Certificates of Obligations, Series 2017 were
issued for improving and extending the City’s water and wastewater systems, equipping and
improving park and recreation facilities, including improvements to the Cain Center, constructing,
improving and equipping a City Hall, construction and equipping a community center facility,
constructing and equipping firefighting facilities, and the respective professional services. The debt
has incremental interest rates of 4.0% to 4.5 % over the life of the bond through 2040. The debt
obligations are to be paid from the collection of ad valorem taxes and limited revenues of the utilities
system.

73
SCHEDULE OF BOND PAYMENTS
Period Ending Principal Interest Debt Service Annual Debt Service
02/01/2018 504,344.44 504,344.44
08/01/2018 238,900.00 238,900.00
09/30/2018 - 743,244.44
02/01/2019 238,900.00 238,900.00
08/01/2019 280,000 238,900.00 518,900.00
09/30/2019 - 757,800.00
02/01/2020 234,700.00 234,700.00
08/01/2020 295,000 234,700.00 529,700.00
09/30/2020 - 764,400.00
02/01/2021 230,275.00 230,275.00
08/01/2021 310,000 230,275.00 540,275.00
09/30/2021 - 770,550.00
02/01/2022 225,625.00 225,625.00
08/01/2022 330,000 225,625.00 555,625.00
09/30/2022 - 781,250.00
02/01/2023 219,025.00 219,025.00
08/01/2023 350,000 219,025.00 569,025.00
09/30/2023 - 788,050.00
02/01/2024 212,025.00 212,025.00
08/01/2024 370,000 212,025.00 582,025.00
09/30/2024 - 794,050.00
02/01/2025 204,625.00 204,625.00
08/01/2025 395,000 204,625.00 599,625.00
09/30/2025 - 804,250.00
02/01/2026 196,725.00 196,725.00
08/01/2026 415,000 196,725.00 611,725.00
09/30/2026 - 808,450.00
02/01/2027 188,425.00 188,425.00
08/01/2027 440,000 188,425.00 628,425.00
09/30/2027 - 816,850.00
02/01/2028 179,625.00 179,625.00
08/01/2028 465,000 179,625.00 644,625.00
09/30/2028 - 824,250.00
02/01/2029 170,325.00 170,325.00
08/01/2029 495,000 170,325.00 665,325.00
09/30/2029 - 835,650.00
02/01/2030 160,425.00 160,425.00
08/01/2030 525,000 160,425.00 685,425.00
09/30/2030 - 845,850.00
02/01/2031 149,925.00 149,925.00
08/01/2031 550,000 149,925.00 699,925.00
09/30/2031 - 849,850.00
02/01/2032 138,925.00 138,925.00
08/01/2032 580,000 138,925.00 718,925.00
09/30/2032 - 857,850.00
02/01/2033 127,325.00 127,325.00
08/01/2033 615,000 127,325.00 742,325.00
09/30/2033 - 869,650.00
02/01/2034 115,025.00 115,025.00
08/01/2034 650,000 115,025.00 765,025.00
09/30/2034 - 880,050.00
02/01/2035 102,025.00 102,025.00
08/01/2035 680,000 102,025.00 782,025.00
09/30/2035 - 884,050.00
02/01/2036 88,425.00 88,425.00
08/01/2036 720,000 88,425.00 808,425.00
09/30/2036 - 896,850.00
02/01/2037 74,025.00 74,025.00
08/01/2037 755,000 74,025.00 829,025.00
09/30/2037 - 903,050.00
02/01/2038 57,037.50 57,037.50
08/01/2038 800,000 57,037.50 857,037.50
09/30/2038 - 914,075.00
02/01/2039 39,037.50 39,037.50
08/01/2039 845,000 39,037.50 884,037.50
09/30/2039 - 923,075.00
02/01/2040 20,025.00 20,025.00
08/01/2040 890,000 20,025.00 910,025.00
09/30/2040 - 930,050.00
11,755,000$ 7,488,194.44$ 19,243,194.44$ 19,243,194.44$

74
CAPITAL PROJECTS FUND

75
DEPARTMENT: CAPITAL IMPROVEMENT FUND DIVISION: ADMINISTRATIVE SERVICES
At the beginning of FY 2017, the City of Athens established a separate Capital Projects Fund to receive funding from
the General Fund, Downtown Capital Improvement Fund, Hotel Occupancy Tax Fund and the proceeds of the 2016
Certificates of Obligations. The Council approved specific projects to be spent from these funds. Below is the
information submitted to the bond counsel detailing the revenues and expenditures for this fund.
Proposed 2017 General Fund Capital Improvements Program: Funding
2017 Certificates of Obligations $12,173,340
General Fund -Committed Fund Balance $180,000
Hotel Occupancy Tax (HOT)-Committed Fund Balance $375,000
Downtown Capital Fund-Committed Fund Balance $110,000
Total $12,838,340
Proposed General Fund Capital Improvements Program: PROJECTS
Ranking Description Estimated Budget
1 Water Model & Capital Improvements Program $198,000
2 Wastewater Facility Improvements $100,000
3 Security Cameras $80,000
4 Cain Center Professional Services, FF&E, Infrastructure $2,344,107
5 Cain Center Construction $8,200,000
6 Texan Theatre $1,419,500
7 Downtown Aesthetics $85,000
8 Cain Park Improvements, Lighting $40,000
9 Fire Station Improvements $55,000
10 Peach Park Improvements $35,000
11 West Park Improvements $30,000
12 2% CIP Contingency $251,733
Total $12,838,340

76
OTHER FUNDS
The following funds all collect revenues that are restricted and can only be spent under specific
guidelines. For each of these funds, a cash flow statement and a fund description are provided.
Several of these funds are of a nature that they cannot or need not be budgeted, so the cash flow
statements are for informal purposes only.

77
DEPARTMENT:36-AIRPORT DIVISION:11- AIRPORT FUND
The Airport Fund is responsible for maintaining, managing, and promoting the City’s Airport. The City leases the hangers and owners are responsible for their own areas. The Airport Fund is sustained by several revenue sources, including, but not limited to: fuel sales and hangar lease agreements. RAMP (Routine Airport Maintenance Program) Grant reimbursements have also been utilized for capital improvements. Fund expenditures include operating supplies, contractual services and operational transfers.
Revenue Summary
FY2015 Actual
FY2016 Actual
FY2017 Adopted Budget
FY2017 Amended
Budget
FY 2017 YTD Actual
FY 2018 Proposed
Budget
Operating Revenue 48,487 50,574 48,550 48,550 49,233 48,486
Intragovernmental - 26,991 - - - -
Reimbursements 809 - - - - -
Other Non-Operating 717 (157) 1,350 5,850 1,350 1,254
Total Revenues 50,012 77,409 49,900 54,400 50,583 49,740
Expenditures by Category
FY2015 Actual
FY2016 Actual
FY2017 Adopted Budget
FY2017 Amended
Budget
FY 2017 Projected
Actual
FY 2018 Proposed
Budget
Personnel Services - - - - - -
Supplies 1,133 1,840 2,020 2,020 2,010 2,020
Contractual Services 6,132 12,672 11,910 16,410 16,328 12,560
Operating Transfers 10,290 90,400 35,000 35,000 34,825 37,367
Total Categories 17,555 104,912 48,930 53,430 53,163 51,947

78
DEPARTMENT:72-TOURISM DIVISION: 12-HOTEL OCCUPANCY TAX FUND
The City of Athens collects a 7% Hotel Occupancy Tax from hotels, motels, etc. based on room costs for tourism
uses. These taxes are eligible for the following expenses: Visitor information centers, convention registration,
advertising, arts promotion, historical restoration & preservation, sporting event promotion, tourist transportation
system and signage. Funds may also be used for operational expenditures if the primary purpose of the event is to
attract out of town visitors and tourism in general.
Revenue Summary
FY2015 Actual
FY2016 Actual
FY2017 Adopted Budget
FY2017 Amended
Budget
FY 2017 Projected
Actual
FY 2018 Proposed
Budget
HOTEL/OCC’Y TAX 309,914 304,113 261,000 261,000 290,000 308,691
INTEREST INCOME 1,216 1,577 - - 1,000 1,935
MISC REVENUE - 1,899 - - 1,922 -
TOTAL REVENUE 311,130 307,589 261,000 261,000 292,922 310,626
Expenditure by Category
FY2015 Actual
FY2016 Actual
FY2017 Adopted Budget
FY2017 Amended
Budget
FY 2017 Projected
Actual
FY 2018 Proposed
Budget
Personnel Services 83,281 21,253 59,178 59,178 58,882 65,174
Supplies 5,139 340 24,298 24,298 24,177 56,400
Contractual Services 121,964 62,872 150,427 150,427 149,675 171,171
Operating Transfers 45,000 45,000 44,775 37,367
Total Categories 210,385 84,465 278,903 278,903 277,508 330,111
Authorized Personnel (FTEs)
Position/Title Pay Grade FY 2016 FY 2017 FY 2018
Cultural Resources Coordinator 19 0 1 1
Total 0 1 1

79
DEPARTMENT:14- ALL DEPARTMENTS DIVISION: EQUIPMENT REPLACEMENT FUND
The Equipment Replacement Fund is a way to address equipment needs within the City. It is intended to inform the
Council of the major equipment needs on the horizon. The first year of the plan becomes an adopted equipment
budget and relates to the operating budget of the equipment replacement fund, which is approved on an annual
basis. The funding requirements vary from year to year. Funding sources are transfers from departments and/or
auction proceeds. Equipment needs are evaluated each year and the schedule approved by Council priority as
changes in the condition of the equipment. Some items may need replacement sooner than expected due to high
maintenance costs and other items may be extended thus delaying their replacement. Equipment is evaluated using
the maintenance records and condition of the equipment reviewed so as to maximize the life of each piece of
equipment.
Revenue Summary
FY2015 Actual
FY2016 Actual
FY2017 Adopted Budget
FY2017 Amended
Budget
FY 2017 Projected
Actual
FY 2018 Proposed
Budget
INTRAGOVERNMENTAL - - - 264,000 264,000 100,000
TOTAL REVENUES - - - 264,000 264,000 100,000
_____________________________________________________________________________________________
Capital Expenditures by Department
FY2015 Actual
FY2016 Actual
FY2017 Adopted Budget
FY2017 Amended
Budget
FY 2017 Projected
Actual
FY 2018 Proposed
Budget
32-STREETS - - - - - 85,000
34-PARKS 10,500
38-FLEET - - - - - 71,400
51-POLICE ADMIN - - - - - 31,750
Total Categories - - - - - 198,650

80
Department Description Estimated Costs
Department
Ranking
Council
Ranking Notes
512 Laptop Computer 1,381$ 2 A Funded in General Fund
512 Photo ID System 3,344$ 3 A Unfunded
516 Laptop Computer 1,400$ 1 A Unfunded
532 7/8 Dump Truck 85,000$ 2 A Funded
532 Rubber Tire Loader 165,000$ 1 C Unfunded
532 Loader 5,600$ 1 C Funded in General Fund
532 Escavator 152,000$ 3 C Unfunded
534 Skags Mower 10,500$ 1 A Funded
534 Playground Equipment 30,000$ 4 C Unfunded
534 Playground Equipment 89,000$ 7 C Unfunded
534 Fitness Equipment 9,500$ 8 C Unfunded
538 Reconditioned Fork Lift 12,400$ 1 A Funded
538 Field Service Truck 59,000$ 2 A Funded
538 Shop Fan 13,000$ 1 A Funded in General Fund
538 2 Tool Boxes 44,000$ 2 C Unfunded
546 Pick up Truck 40,000$ 1 C Unfunded
551 Police Vehicle 31,750$ 1 A Funded
553 Patrol Vehicle 47,000$ 2 B Unfunded
Total Equipment and Vehicles 799,875$
Funded with Equipment Fund Resources 198,650$
Funded with General Fund Resources 19,981$
To be funded in the future 581,244$
EQUIPMENT FUNDING FROM SUPPLEMENTALS AND CAPITAL REQUESTS

81
GENERAL INFORMATION

82
GENERAL INFORMATION
BUDGET GLOSSARY
Account A separate financial reporting unit for budgeting, management, or accounting
purposes. All budgetary transactions, whether revenue or expenditure, are recorded in accounts.
Several related accounts may be grouped together in a fund. A list of the accounts into which
money can be put or taken is called the chart of accounts.
Accounting Standards The generally accepted accounting principles (GAAP) promulgated by
the Governmental Accounting Standards Board that guide the recording and reporting of
financial information by the state and local governments. The standards establish such guidelines
as when transactions are recognized (accrual, modified accrual, or cash basis), the types and
purposes of funds, and the content and organization of the annual financial report. At the federal
level, accounting standards are developed by the Federal Accounting Standards Advisory Board.
Accrual Basis Refers to when a financial transaction is recorded. Accrual is a method of
accounting in which revenues are recorded when measurable and earned, and expenses are
recognized when a good or service is used. For example, a professional fee is an expense that
recognizes the use of services form attorneys, engineers, etc. In the case of modified accrual
accounting, expenditures are recognized when the goods or services are received and revenues,
such as taxed, are recognizes when measurable and available to pay expenditures in the current
accounting period. See Basis of Accounting.
Accrued Interest In the sale of a new issue of municipal bonds, the dollar amount, based on the
stated rate or rates of interest, which as accrued on the bonds from the dated date, or other
stated date, up to but not to including the date of delivery. When a bond is purchased in the
secondary market, the dollar amount, based upon the stated rate of interest, which has accrued
on the bond form the most recent interest payment date, up to but not including the date of
settlement. Accrued interest is paid to the seller by the purchaser and is usually calculated on a
360-day-year basis (assumes each month has 30 days). See Interest.
Activity Departmental efforts that contribute toward the accomplishment of specific identified
program objectives.
Ad Valorem Tax A direct tax based “according to value” of property. Counties and school districts
and municipalities usually are, and special tax districts may be, authorized by law to levy ad
valorem taxes on property other than intangible personal property. Local governmental bodies
with taxing power may issue bonds or short-term certificates payable from ad valorem taxation.
Adopted-As used in fund/departmental summaries represents the budget by formal action of the
City Council which sets limits for the fiscal year.
Appropriation Legal authorization to make expenditures or enter into obligations for specific
purposes. Appropriations are normally passed by the council every year. An appropriation may
be approved for operating expenditures and another for capital items, or one appropriation may
be passed for both types of expenditures.

83
Assessed Valuation An annual determination of the just or fair market value of property by the
county property appraiser for purposes of ad valorem taxation. If a tax on property is imposed by
virtue of the value of its use, the assessed valuation is its classified use value.
Assessed Value The value of property for the purposes of levying property taxes. In some states
the assessed value is the same as the market value less exemptions, while in others it is some
fraction of market value.
Assets – Resources owned or held by the City, which have monetary value.
Audit Report The report prepared by an auditor covering the audit or investigation of an entity’s
financial position for a given period of time. As a general rule, the report should include: (a) a
statement of the scope of the audit; (b) explanatory comments concerning exceptions from
generally accepted auditing standards; (c) explanatory comments concerning verification
procedures; (e) financial statements and schedules; and (f) statistical tables, supplementary
comments, and recommendations. The auditor’s signature follows item (c) or (d).
Balanced Budget – The expenses or expenditures do not exceed the assets, liabilities and equities
of an entity at a specified date in conformity with GAAP.
Bond Proceeds The money paid to the issuer by the purchaser or underwriter for a new issue of
municipal bonds, used to finance the project or purpose for which the bonds were issued and to
pay certain costs of issuance, as may be provided in the bond contract.
Budget – A financial plan for a specified period of time that consists of proposed expenditures for
a specified purpose and the proposed means to finance therm.
Budget A plan for spending that balances revenues and expenditures over a fixed time period,
usually a year, and that includes, at least by implication, a work plan. In actual practice the term
budget has two connotations: the financial plan presented to the body for adoption; and the
plan finally approved by that body. It is usually necessary to specify whether the budget under
consideration is proposed or whether it has been approved by the appropriating body, although
this may be clear from the context.
Budget Amendment The budget may be formally amended after it has been approved.
Amendments may be required, for example, with the incorporation of a new labor contract or if
revenues fall or grow beyond projections.
Budget Calendar A time table with deadlines when particular tasks must be completed in order
for council to approve the spending plan before the beginning of the next fiscal year.
Budget Cycle The budget cycle includes preparation of budget requests, legislative approval of
the budget requests, budget implementation, and summary reporting on actual budget
transactions.
Budget Guidelines Once revenue projections are in place, the chief executive, along with key
policy makers, develops guidelines to provide a sense of the budget environment for the
forthcoming year. Departments can then make appropriate budgetary requests based on this
information.
84
Budget Document A booklet prepared by the budget office that provides a description of the
budget process and the forms departments need to prepare their budget requests. The manual
will also contain the budget calendar.
Budget Reserves Money accumulated for future purposes in the case of unforeseen
circumstances or for the replacement of buildings or equipment.
Capital Assets Things the city owns, such as buildings, land, roads, bridges, and water treatment
plants that cost a considerable amount of money and that are intended to last a long time.
Capital Budget A spending plan for improvements to or acquisition of land, facilities, and
infrastructure that balances revenues and expenditures, specifies the sources of revenues, and
lists each project or acquisition. Normally a capital budget must be approved by the legislative
body. The capital budget and accompanying appropriation ordinance may be included in a
consolidated budget document that has a section devoted to capital expenditures and another
to operating expenditures, or two separate documents may be prepared – one for the capital
budget and capital improvement plan and another one for the operating budget.
Capital Improvement Plan (CIP) A list of projects for a period of time, usually five years, by
department. It may or may not list anticipated revenues to pay for the projects, and is not
appropriated like a budget, but may be adopted by the legislative body to indicate approval. A
CIP does not grant permission to commit funds, but the first of the plan is normally designated as
the capital budget for the forthcoming year. As each year’s list of projects is approved and
completed, another year of projects is added to the plan to maintain the five-year planning
horizon.
Capital Outlay Spending on fixed assets usually above a certain minimum in cost, such as
equipment that is intended to last more than a year or purchases above a minimum cutoff point
in cost, such as $5,000.
Capital Projects Funds One or more governmental type of funds established to account for
resources used for the acquisition of large capital improvements, other than those accounted for
in proprietary or trust funds.
Cash Basis A method of determining if a budget is balanced. Cash-on-hand can result in an
inaccurate picture since payments for goods and services can be delayed to the next fiscal year.
The cash basis of accounting is not in conformance with the accrual and modified accrual bases
prescribed by the Governmental Accounting Standards Board. See Accrual Basis.
Cash Flow A sufficient amount of cash on hand to cover disbursements or payments that are
coming due. Part of the duties of the finance director is to ensure sufficient cash is on hand or
available in short term investments to meet expected disbursements.
Chart of Accounts A way of recording revenues and expenditures that includes all transactions
and that fits the organizational structure. A chart of accounts assigns a unique number to each
type of transaction (e.g. salaries or property taxes) and to each budgetary unit in the organization.

85
Comprehensive Annual Financial Report Usually called the CAFR; this report summarizes financial
data for the previous fiscal year in a standardized format. An outside auditor often examines this
document to judge if it represents fairly the financial condition of the city. The auditor’s report is
usually attached to the CAFR. The CAFR organizes information by fund and contains two basic
types of statements: (1) a balance sheet that compares assets with liabilities and fund balance
and (2) an operating statement that compares revenues with expenditures. A particular variation
of the operating statement compares the budgeted amounts with the actual levels of revenues
and expenditures.
Contingency A budgeted account set aside to meet unforeseen circumstances. The Charter
requires at least 3% to be allowed for this purpose.
Current Assets Those assets than can be easily converted to cash within the current year.
Current Liabilities – Debt or other legal obligation arising out of transactions in the past, which must
be liquidated, renewed, or refunded within a year.
Debt Limit The maximum amount of debt which an issuer of municipal securities is permitted to
incur under constitutional, statutory or charter provisions.
Debt Ratios Comparative statistics showing the relationship between the issuer’s outstanding debt
and such factors as its tax base, income, or population. Such ratios are often used in the process
of determining credit quality of an issue, especially in the case of general obligation bonds. See
Bonded Debt.
Debt Service Annual payments of interest and principle that the city owes on money that it has
borrowed.
Debt Service Funds One or more funds established to account for revenues and expenditures used
to repay the principal and interest on debt.
Delinquent Taxes – Taxes that remain unpaid on and after the date on which a penalty or interest
for non-payment is attached.
Department – A subdivision of the City government organization responsible for specific services;
all departments are units grouped by category under one of five divisions, Management,
Community Services, Development Services, Public Safety Services and Public Services.
Depreciation - The process of estimating and recording the expired useful life of a fixed asset
which is used to distribute its costs over its revenue producing years.
Disbursement Payment for goods or services that have been delivered and invoiced.
Encumbrances Budget authority that is set aside to pay for expenditures that have been
committed either by the authorization of a purchase order or by a contract.
Enterprise Fund A separate fund that supports services primarily from fees. Examples are water,
sewer, golf, and airport funds. Some local governments also treat as enterprises those funds that
run like a business and charge fees, but do not cover all their costs; the remaining costs may be
transferred out of the general or other funds or may come from grants or earmarked taxes.
Enterprise fund agencies generate their own revenue through the sale of services. That revenue
directly affects spending levels of that agency.

86
Enterprise Activity A revenue gathering project or business which supplies funds necessary to pay
debt service on bonds issued to finance the facility. The debts of such projects are self-liquidating
when the projects earn sufficient monies to cover all debt service and other requirements imposed
under the bond contract. Common examples include water and sewer plants, electrical supply
facilities, and private business projects financed with industrial development bonds.
Effective Tax Rate – The tax rate that would impose the same total taxes as the previous year on
properties taxed in both years. The effective tax rate gives the taxing unit approximately the same
amount of money to spend as it had in the previous year.
Expiration Date Future date at which the demand feature of a security ends.
Fiscal Policy The use of revenue, spending, and debt, especially by the federal government, to
promote economic growth, reduce unemployment, and maintain stable prices. Fiscal policy has
its origins in the macroeconomic theories of John Maynard Keynes, but in more recent years newer
theories, such as supply-side economics, have altered the assumptions about how best to use the
federal budget to accomplish the goals of fiscal policy.
Fiscal Year A designated 12 month period for budgeting and for record keeping purposes. All the
financial transactions within that twelve month period are presented together, to see if revenues
cover expenditures.
Fixed assets The least liquid of assets such as land, buildings, equipment, and other improvements.
Franchise Fee – A fee paid by public service utilites for the use of public property in providing their
services.
Full-Time Equivalent The number of hours per year that a full time employee is expected to work.
Two workers who each work half that number of hours together equal one full time equivalent.
The hours of a number of part timers or temporary workers can be added up to see how many full
time positions they are equivalent to.
Fully Registered A bond which has been registered as to both principal and interest according to
the bond contract. Such bonds are payable only to the owner, or to the order of the owner, whose
name is noted on records of the issuer. See Bond register; Registered Bond. Compare bearer bond.
Fund A self-balancing set of accounts. Governmental budgeting and accounting is based on a
series of funds, each with separate revenues, expenditures, and balances. Each fund is set up for
a separate purpose and each fund balances its assets against liabilities and any residual becomes
fund balance.
Fund Balance The difference between a fund’s assets and its liabilities. Portions of the fund
balance may be reserved for various purposes such as contingencies or encumbrances at the
end of the fiscal year.
GAAP See Generally Accepted Accounting Principles
GASB See Governmental Accounting Standards Board.
General Fund The major fund in most governmental units. While other funds tend to be restricted
to a single purpose, the general fund is a catch all, for general governmental purposes that are

87
not broken out separately in a single purpose fund. Most basic functions, such as police, fire, and
streets, are usually located in the general fund.
General Obligation (GO) Bond A particular kind of bond backed by the full faith and credit of the
issuing entity in which the pledge of security to pay back the bond is the government’s ability to
raise taxes. This is very secure for the investors, and therefore helps lower borrowing costs. Ad
valorem taxes necessary to pay debt service on GO bonds are typically not subject to the
constitutional property tax millage limits. Such bonds constitute debts of the issuer and normally
require approval by election prior to issuance. In the event of default, the holders of GO bonds
have the right to compel a tax or legislative appropriation, by mandamus or injunction, in order
to satisfy the issuer’s obligation.
Generally Accepted Accounting Principles (GAAP) Uniform minimum standards for financial
recording and reporting established by the accounting profession through such independent
entities as the Governmental Accounting Standards Board.
GFOA See Government Finance Offers Association.
Governmental Accounting Standards Board (GASB) The body that sets accounting standards
specifically for governmental entities at the state and local level.
Governmental Bonds One of two categories of bonds established under the Tax Reform Act of
1986. Bonds issued by localities for the financing of traditional activities and which meet certain
tests (related to private use and security).
Government Finance Officers Association Professional organization primarily of state and local
government finance offers.
Grants A payment of money from one governmental unit to another or from a government to a
not for profit. Grants are often earmarked for a specific purpose or program.
Home Rule A limited grant of discretion from state governments to local governments, concerning
either the organization of functions or the raising of revenue. Without home rule, local
governments are restricted to whatever functions, organization, and revenue sources are
specified by the state government, and are bound by whatever limits in revenue or borrowing
that state requires.
Independent Auditor An accounting firm or occasionally a state or local official not associated
with the local government who reviews the annual financial report and compare it with a sample
of financial transactions, in order to certify that the report represents accurately the fiscal
condition of the governmental unit.
Interfund Transfers The movement of money from one fund to another in a governmental unit. An
interfund transfer is normally governed by rules of what is and is not permissible, and usually has to
be approved by the legislative body.
Line-Item Budget A format for budgeting in which departmental outlays are grouped according
the items that will be purchased, one item or groups of items on each line of the budget. See
Object of expenditure.
Liquidity Usually refers to the ability to convert assets (such as investments) into cash.

88
Lower Floater General term for a security with a variable interest rate and also having a tender
feature.
Mill An increment of taxation measured in units of one-tenth (0.1) of one cent or 0.001 of one
dollar.
Modified Accrual See Accrual Basis.
Note A written, short-term promise of the issuer to repay a specified principal amount on a certain
date, together with interest at a stated rate, or according to a formula for determining that rate,
payable from a defined source of anticipated revenue. A variety of note types are used
according to the anticipated revenue source: Bond Anticipation Notes (BANs), Construction Loan
Notes (CLNs), Grant Anticipation Notes (GANs), Revenue Anticipation Notes (RANs), and Tax
Anticipation Notes (TANs).
Object of Expenditure A way of grouping and displaying in the budget the items to be purchased.
Commodities would be a major classification; office supplies might be a minor classification. Same
as line-item budgeting.
Obligations See Encumbrances.
Operating Budget The portion of a budget that deals with routinely recurring expenditures, such
as salaries, electricity bills for city hall, postage, printing and duplicating, paper supplies, and
gasoline for automobiles. The operating budget is in a sense the opposite of a capital budget,
which includes one-time, or non-recurring costs for major expenditures of items or projects
intended to last a long time. The operating and the capital budget, or a consolidated document
may be prepared that has a section devoted to operating expenditures and another to capital.
Operating Deficit The amount by which this year’s (or this budget period’s) revenues are
exceeded by this year’s (or this budget period’s) expenditures. An operating deficit does not take
into account balances left over from prior years that may use to pay off this year’s shortfall.
Pay-As-You-Go Paying for capital projects out of current tax and grant revenues rather than
issuing debt to pay for them.
Pay-As-You-Use Incurring debt to pay for capital outlays rather than paying out of current
revenues.
Payments in Lieu of Taxes (PILOTS) One method used to decide how much money is appropriate
to transfer from enterprises into a government’s general fund using the argument that such
payments are in exchange for taxes that would have been paid if the service had been provided
by a privately- owned firm. The City of Athens uses 5% of the water and sewer revenues in lieu of
franchise taxes.
Pension Funds A category of fiduciary funds used to safeguard the assets of an employee
retirement program.
Per Capita Debt The amount of an issuer’s debt divided by population, which is used as an
indication of the issuer’s credit position by reference to the proportionate debt borne per resident.

89
Performance Budget This budget format includes information on performance goals, objectives
and measures for workload, efficiency and effectiveness for each governmental program. Ideally,
allocations are linked to these performance measures, but in many cases the linkage is loose or
nonexistent. As long as there are performance measures in the budget, it is called a performance
budget.
Performance Indicators Measures of the achievement of stated program goals and objectives.
Percent of property reported stolen that is recovered by the police department could be one
measure of police department performance.
Permanent Funds A category of governmental funds, established by GASBS 34, used to report on
funds whose outflow is legally restricted to the earnings, not principal, from the fund for purposes
that benefit the government or its citizens.
Property Tax – Revenues received in a period from current taxes an delinquent taxes. Property
taxes are levied on bother real and personal property according to the property’s valuation and
the tax rate.
Public Hearings Open meetings regarding proposed budget allocations—either operating or
capital—that provide citizens an opportunity to voice their views on the merits of proposals.
Purchase Orders An agreement drawn up to buy goods and services from a specific vendor with
a promise to pay when delivered.
Retained Earnings - An equity account reflecting the accumulated earnings of a proprietary fund.
Rainy Day Funds Revenue stabilization reserves that provide resources when revenues decline due
to a recession, loss of a major taxpayer, or other event that temporarily results in a loss of tax
revenues.
Required Supplemental Information A section of the CAFR, required by GASBS 34 that presents a
comparison of the adopted budget, the budget as amended, and the actual revenue and
expenditure figures (budgetary basis).
Reserve Fund The fund which may be used to pay debt service if the sources of the pledged
revenues do not generate sufficient funds to satisfy the debt service requirements. The reserve
fund is either funded in whole or in part from the proceeds of the bonds or is allowed to
accumulate gradually over a period of years through required payments from the pledged
revenues. If the reserve fund is used in whole or in part to pay debt service, the issuer usually is
required to replenish the reserve fund from the first available funds or revenues. A typical reserve
requirement might be the maximum aggregate annual debt service requirement for any year
remaining until the bonds reach maturity. The size and investment of the reserve may be subject
to arbitrage regulations.
Assigned Fund Balance That portion of a fund’s fund balance that is not available for
appropriation because they have been legally committed to some future use. See Restricted Fund
Balance and Unassigned Fund Balance.
Reserves for Debt Service An account usually for revenue bonds used to provide funds in the event
revenues are insufficient to repay the principal and interest on debt that is coming due in the
current year.

90
Revenue Bond A particular kind of bond in which the revenue to pay back the bond and interest
comes from the project that the borrowed money was used to create, expand, or improve.
SEC See Securities and Exchange Commission.
Special Revenue Funds A type of fund used to account for revenues legally earmarked for a
particular purpose. For example, a hotel/motel occupancy tax may be earmarked for tourism
and convention development. A Hotel/Motel Tax fund would then account for the revenues and
expenditures associated with such purposes.
Statement of Activities A statement that presents the cost of providing government services by
function. For both governmental and business activities, program revenues are reported and then
expenses netted to provide a summary of the amount of tax subsidy required for each activity.
Statement of Net Assets A general purpose financial statement established by GASBS 34 that
reports the overall financial position of the government by listing major categories of assets and
liabilities and reporting their difference as net assets.
Take or Pay Contract A sales agreement which requires the purchaser to pay the seller whether
or not goods or services are available and, if available, whether or not the purchaser uses them.
This type of requirement is generally used in electric power sales contracts which stipulate that
payment will be made by the purchasers to the electricity wholesaler whether or not conditioned
upon the performance of the wholesaler, the completion or operation of the power project or the
use of the goods or services.
Tax Base The total property and resources or transactions (as in sales) available for taxation.
Tax Expenditures Abatements, partial or full exemptions, tax credits, deductions or other foregone
tax revenues.
Tax Rate The amount of tax stated in terms of a unit of the tax base; for example, 10 mill per dollar
of assessed valuation of taxable property.
Tax Roll The official list showing the amount of taxes levied against each taxpayer or parcel of
property, prepared and authenticated in proper form to warrant the collecting officers to
proceed with the enforcement of the tax.
Transfers Funds moved from one account to another or between funds.
Unassigned Fund Balance That portion of a fund’s fund balance that is available for appropriation.
See Assigned Fund Balance and Restricted Fund Balance.
Unforeseen Contingencies Funding for unanticipated expenditures of a non-recurring nature that
protects the government from issuing short debt to cover these needs.
Yield to Maturity The rate of return to the investor earned from payments of principal interest, with
interest compounded semiannually and assuming that interest paid is reinvested at the same rate.
Yield to maturity takes into account the time value of the investment. Compare Current Yield;
Yield to Call.

91
GENERAL INFORMATION/ACRONYM GUIDE
ADA …. American Disability Act
CAFR …. Comprehensive Annual Financial Report
AEDC …. Athens Economic Development Corp.
CID …. Criminal Investigation Department
CIP …. Capital Improvement Program
AISD .... Athens Independent School District
CGFO …. Certified Government Finance Officer
CMO .... City Manager’s Office
CPA .… Certified Public Accountant
CO …. Certificate of Obligation
FT .... Full Time
FTE …. Full Time Equivalent
FY .… Fiscal Year
GASB …. Governmental Accounting Standards Board
GFOA …. Government Finance Officers of America
GO …. General Obligation
HCAD …. Henderson County Appraisal District
I & S …. Interest and Sinking
ISO .… Insurance Services Board
M & O …. Maintenance and Operations
MGD …. Millions of Gallons Daily
MUD …. Municipal Utility District
NIMS …. National Incident Management System
OPEB .... Other Post-Employment Benefits
PD …. Police Department
SRO …. School Resource Officer

92

93
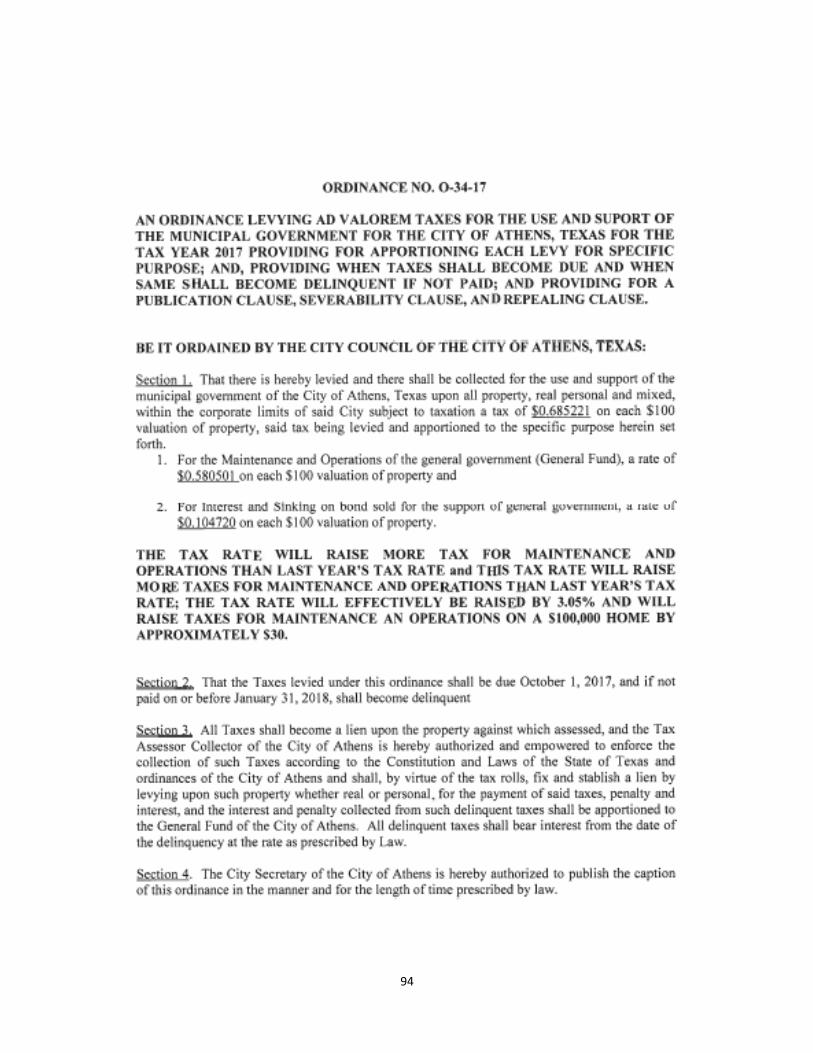
94
95

96
FULL TIME EQUIVALENT SCHEDULE
POSITION TITLE GRADE
NUMBER OF
POSITIONS FUND DEPT GRADE
NUMBER OF
POSITIONS FUND DEPT GRADE
NUMBER OF
POSITIONS FUND DEPT
Animal Control Officer 13 1 10 49 13 1 10 49 13 1 10 49
Assistant City Manager 29 1 40 61 29 1 40 61 29 1 10 10
Assistant Fire Chief CS-26 1 10 46 CS-26 1 10 46 CS-26 1 10 46
Assistant Police Chief CS-26 1 10 51 CS-26 1 10 51 CS-26 1 10 51
Battalion Chief/ Fire Marshall P-24 1 10 46 P-24 1 10 46 P-24 1 10 46
City Manager N/A 1 10 10 N/A 1 10 10 N/A 1 10 10
City Secretary 26 1 10 16 26 1 10 16 26 1 10 16
Code Enforcement Coordinator 16 1 10 22 16 1 10 22 16 1 10 22
Code Enforcement Officer 15 1 10 32 15 1 10 32 15 1 10 32
Community Development Manager 25 1 10 1 25 1 10 1 25 1 10 0
Cultural Resources Coordinator 19 1 12 72 19 1 12 72 19 1 12 72
Development Coordinator 19 1 10 24 19 1 10 24 19 1 10 24
Director of Finance 26 1 10 14 26 1 10 14 26 1 10 14
Managing Director of Development 26 1 10 24 26 1 10 24 26 1 10 24
Director of Utilities 26 1 40 61 26 1 40 61 26 1 40 61
Equipment Operator I, Parks 13 1 10 34 13 1 10 34 13 1 10 34
Equipment Operator I, Streets 13 1 10 32 13 1 10 32 13 1 10 32
Equipment Operator II, Streets 15 1 10 32 15 1 10 32 15 1 10 32
Evidence Technician 15 1 10 52 15 1 10 52 15 1 10 52
Facilities Maintenance Technician 11 0.5 10 34 11 0.5 10 34 11 0.5 10 17
Finance & Compliance Specialist 19 1 10 14 19 1 10 14 19 1 10 14
Fire Captain CS-21 3 10 46 CS-21 3 10 46 CS-21 3 10 46
Fire Chief/ EMS Coodinator 28 1 10 46 28 1 10 46 28 1 10 46
Fire Fighter CS-19 18 10 46 CS-19 18 10 46 CS-19 18 10 46
Fire Lieutenant P-20 3 10 46 P-20 3 10 46 P-20 3 10 46
Fleet Maintenance Superintendent 21 1 10 38 21 1 10 38 21 1 10 38
GIS Technician 14 1 10 24 14 1 10 24 14 1 10 24
Human Resources Coordinator 17 1 10 12 17 1 10 12 17 1 10 12
Human Resources Director 25 1 10 1 25 1 10 1 25 1 10 1
IT & SCADA Technician 19 1 40 61 19 1 40 61 19 1 40 61
Line Maintenance Foreman 16 2 40 63 16 2 40 63 16 2 40 63
Line Maintenance Superintendent 21 1 40 63 21 1 40 63 21 1 40 63
Line Maintenance Technician 14 7 40 63 14 7 40 63 14 7 40 63
Mechanic I 11 1 10 38 11 1 10 38 11 1 10 38
Mechanic II 14 1 10 38 14 1 10 38 14 1 10 38
Muncipal Court Clerk 14 1 10 50 14 1 10 50 14 1 10 50
Municipal Court Administrator 16 1 10 50 16 1 10 50 16 1 10 50
Municipal Judge N/A 0.5 10 50 N/A 0.5 10 50 N/A 0.5 10 50
FY 2017 FY 2018FY 2016
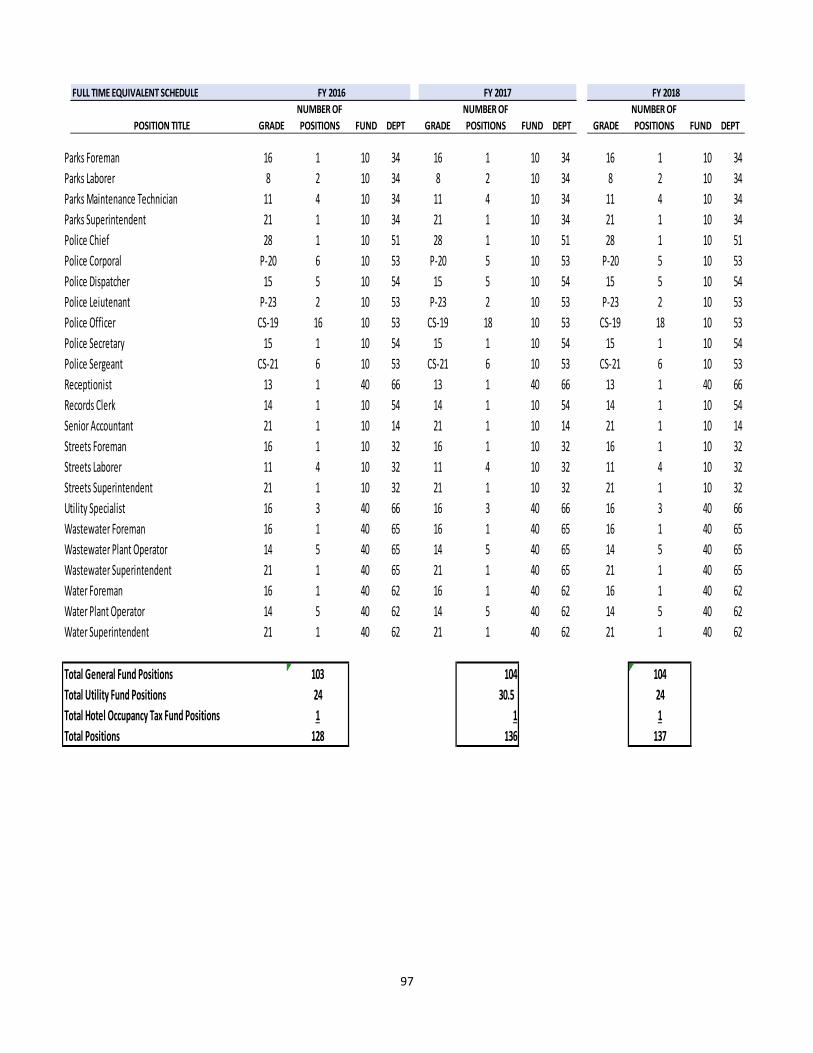
97
Parks Foreman 16 1 10 34 16 1 10 34 16 1 10 34
Parks Laborer 8 2 10 34 8 2 10 34 8 2 10 34
Parks Maintenance Technician 11 4 10 34 11 4 10 34 11 4 10 34
Parks Superintendent 21 1 10 34 21 1 10 34 21 1 10 34
Police Chief 28 1 10 51 28 1 10 51 28 1 10 51
Police Corporal P-20 6 10 53 P-20 5 10 53 P-20 5 10 53
Police Dispatcher 15 5 10 54 15 5 10 54 15 5 10 54
Police Leiutenant P-23 2 10 53 P-23 2 10 53 P-23 2 10 53
Police Officer CS-19 16 10 53 CS-19 18 10 53 CS-19 18 10 53
Police Secretary 15 1 10 54 15 1 10 54 15 1 10 54
Police Sergeant CS-21 6 10 53 CS-21 6 10 53 CS-21 6 10 53
Receptionist 13 1 40 66 13 1 40 66 13 1 40 66
Records Clerk 14 1 10 54 14 1 10 54 14 1 10 54
Senior Accountant 21 1 10 14 21 1 10 14 21 1 10 14
Streets Foreman 16 1 10 32 16 1 10 32 16 1 10 32
Streets Laborer 11 4 10 32 11 4 10 32 11 4 10 32
Streets Superintendent 21 1 10 32 21 1 10 32 21 1 10 32
Utility Specialist 16 3 40 66 16 3 40 66 16 3 40 66
Wastewater Foreman 16 1 40 65 16 1 40 65 16 1 40 65
Wastewater Plant Operator 14 5 40 65 14 5 40 65 14 5 40 65
Wastewater Superintendent 21 1 40 65 21 1 40 65 21 1 40 65
Water Foreman 16 1 40 62 16 1 40 62 16 1 40 62
Water Plant Operator 14 5 40 62 14 5 40 62 14 5 40 62
Water Superintendent 21 1 40 62 21 1 40 62 21 1 40 62
Total General Fund Positions 103 104 104
Total Utility Fund Positions 24 30.5 24
Total Hotel Occupancy Tax Fund Positions 1 1 1
Total Positions 128 136 137
FULL TIME EQUIVALENT SCHEDULE
POSITION TITLE GRADE
NUMBER OF
POSITIONS FUND DEPT GRADE
NUMBER OF
POSITIONS FUND DEPT GRADE
NUMBER OF
POSITIONS FUND DEPT
FY 2017 FY 2018FY 2016
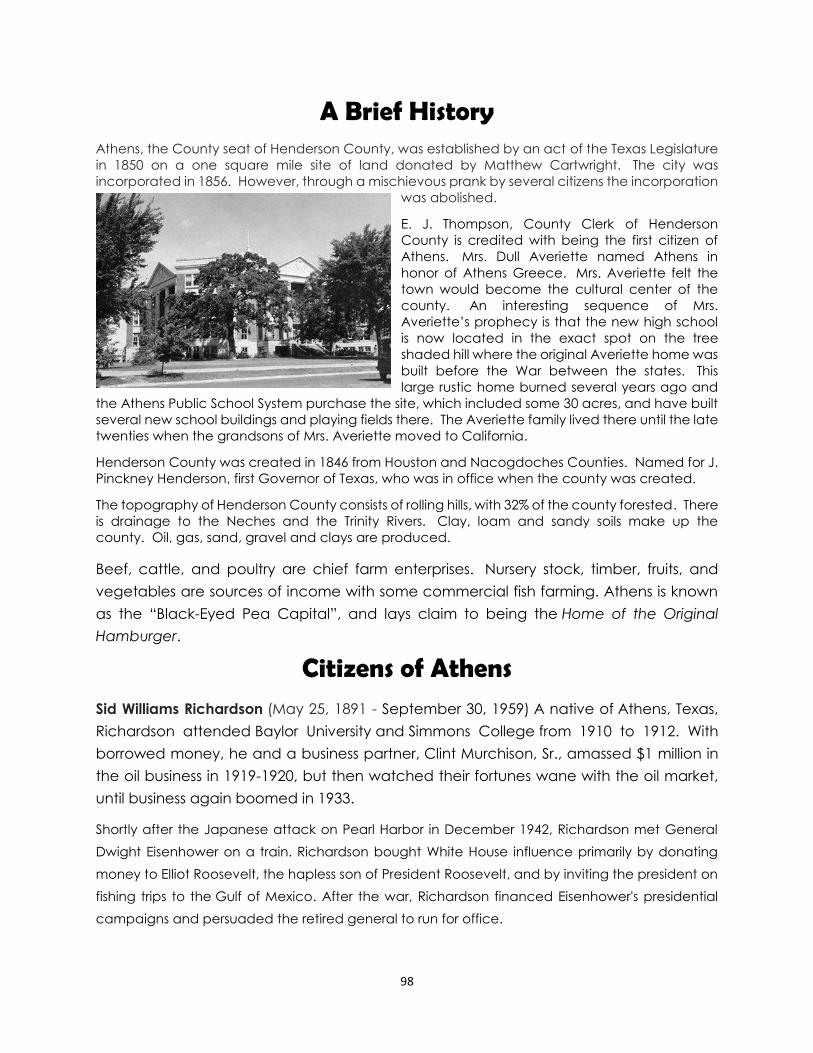
98
A Brief History Athens, the County seat of Henderson County, was established by an act of the Texas Legislature
in 1850 on a one square mile site of land donated by Matthew Cartwright. The city was
incorporated in 1856. However, through a mischievous prank by several citizens the incorporation
was abolished.
E. J. Thompson, County Clerk of Henderson
County is credited with being the first citizen of
Athens. Mrs. Dull Averiette named Athens in
honor of Athens Greece. Mrs. Averiette felt the
town would become the cultural center of the
county. An interesting sequence of Mrs.
Averiette’s prophecy is that the new high school
is now located in the exact spot on the tree
shaded hill where the original Averiette home was
built before the War between the states. This
large rustic home burned several years ago and
the Athens Public School System purchase the site, which included some 30 acres, and have built
several new school buildings and playing fields there. The Averiette family lived there until the late
twenties when the grandsons of Mrs. Averiette moved to California.
Henderson County was created in 1846 from Houston and Nacogdoches Counties. Named for J.
Pinckney Henderson, first Governor of Texas, who was in office when the county was created.
The topography of Henderson County consists of rolling hills, with 32% of the county forested. There
is drainage to the Neches and the Trinity Rivers. Clay, loam and sandy soils make up the
county. Oil, gas, sand, gravel and clays are produced.
Beef, cattle, and poultry are chief farm enterprises. Nursery stock, timber, fruits, and
vegetables are sources of income with some commercial fish farming. Athens is known
as the “Black-Eyed Pea Capital”, and lays claim to being the Home of the Original
Hamburger.
Citizens of Athens Sid Williams Richardson (May 25, 1891 - September 30, 1959) A native of Athens, Texas,
Richardson attended Baylor University and Simmons College from 1910 to 1912. With
borrowed money, he and a business partner, Clint Murchison, Sr., amassed $1 million in
the oil business in 1919-1920, but then watched their fortunes wane with the oil market,
until business again boomed in 1933.
Shortly after the Japanese attack on Pearl Harbor in December 1942, Richardson met General
Dwight Eisenhower on a train. Richardson bought White House influence primarily by donating
money to Elliot Roosevelt, the hapless son of President Roosevelt, and by inviting the president on
fishing trips to the Gulf of Mexico. After the war, Richardson financed Eisenhower's presidential
campaigns and persuaded the retired general to run for office.

99
Richardson was president of Sid Richardson Gasoline Co. in Kermit, Sid Richardson Carbon
Company in Odessa, and Sid W. Richardson Inc., in Fort Worth, and was a partner in Fort Worth-
based Richardson and Bass Oil Producers. [1]
Upon his death aged 68 in 1959, Richardson, a bachelor, bequeathed a large portion of his estate
to his foundation, and left several million dollars to his nephew-partner, Perry Richardson Bass.
Richardson named John B. Connally, the future Texas governor, as co-executor of the estate, a
designation which provided Connally with steady income for years thereafter.
Clinton William Murchison, Jr. (September 12, 1923 – March 30, 1987) a native of Athens,
Texas was a businessman and founder of the Dallas Cowboys football team. In 1960, the
National Football League approved a franchise for Dallas, and Murchison, along with
Bedford Wynne, was the franchisee or license holder. A motivating factor in the NFL's
decision to award a license for Dallas was the establishment of the American Football
League (AFL) by Lamar Hunt, another Dallas area businessman.
For the most part, Murchison was a hands-off owner, delegating a great deal of operational
control of the Cowboys to General Manager Tex Schramm, Coach Tom Landry and
Scouting/Personnel Director Gil Brandt. His general attitude was to hire experts and let them
execute the aspect of the business that fell in their expertise. Hence, Landry enjoyed absolute
authority over the day-to-day running of the actual team; Brandt was unhindered in the area of
drafting and scouting players, and Schramm oversaw many of the team's day to day
administrative concerns. This laissez faire attitude has been credited by many Cowboys fans as
the driving force in the team's 20 consecutive winning seasons from 1966–1985. In 1984, Murchison
sold the Dallas Cowboys to an investment syndicate led by Bum Bright, a Dallas area businessman
who had a background in banking/financial services and in oil/gas production. Bright in turn sold
the Cowboys to Jerry Jones in 1989 following several losing seasons.

100
City of Athens Statistics
Incorporation
Date of Incorporation 1902
Date of Home Rule Charter Adoption December 4, 1972
Form of Government Council/Manager
City Officials Mayor and (4) Council Members
Number of Full Time Employees 137
Area in Square Miles 17.0
Estimated Population 12,782
By Age
Under 18 35.1%
18-65 Years 49.6%
65 and over 4.7%
By Race
Caucasian 50.7%
Hispanic 29.0%
African/American 19.3%
Native American .1%
Asian 1.3%
By Gender
Female 50.5%
Male 49.5%
Median Resident Age 32.3
Estimated Median Household Income $34.288
Average Household Size 3.19
Average Value of Single Family Residence $100,000

101

102
Current Taxes (Ad Valorem Taxes) Property taxes provide one of the largest sources of revenue for the City of Athens, and
determining the tax rate is a major part of the annual budget process. The basis of assessment
is the value of the property. This is determined by the Henderson County Tax Appraisal District
each year.
The City has received the tax roll
from Henderson County Appraisal
District. The certified value for 2017
is $711,216,991. Once the tax value
has been certified, from Henderson
County Appraisal District on or about
July 25th, the truth in taxation process is used with the certified values to establish an effective
tax rate and a rollback tax rate.
.
TAX YEAR ASSESSED VALUATIONS TAX RATE M&O Debt Service TAXES ASSESSED
2006 545,379,300 0.443793 0.362853 0.080940 2,420,355
2007 585,422,923 0.443793 0.364969 0.078824 2,598,066
2008 616,884,246 0.481808 0.393078 0.088730 2,972,198
2009 633,521,417 0.518512 0.428578 0.089934 3,284,885
2010 632,433,077 0.552076 0.464044 0.088032 3,491,511
2011 634,745,864 0.600387 0.515045 0.085342 3,810,932
2012 641,165,486 0.600387 0.517172 0.083215 3,849,474
2013 651,226,345 0.645140 0.552823 0.092317 4,201,322
2014 669,991,990 0.645140 0.550946 0.094194 4,322,386
2015 692,001,796 0.645140 0.559220 0.085920 4,464,380
2016 685,673,701 0.685221 0.586721 0.098500 4,698,380
ANALYSIS OF PROPERTY VALUATIONS AND TAX RATES

103
Delinquent Taxes Taxes are billed on October 1 and the delinquency date is February 1 of the year following the
levy. Delinquent taxes are incurred on taxes paid on or after the delinquency date. Delinquent
taxes, are incurred on taxes paid on or after the delinquency date, and from previous years.
Delinquent Taxes Oct Nov Dec Jan Feb Mar April May June July Aug Sept Total Trend
FY 2012 12,168 4,713 2,586 4,355 5,548 3,782 2,710 3,409 2,456 2,844 3,091 37,181 84,843 100%
FY 2013 10,794 6,121 21,647 3,625 3,051 4,264 6,449 4,170 1,921 6,312 4,328 -15,761 56,921 -33%
FY 2014 10,259 5,885 5,152 6,662 4,910 3,891 2,857 1,347 2,864 3,749 3,151 12,390 63,117 11%
FY 2015 31,568 18,352 8,565 1,911 3,424 6,060 2,155 5,687 1,474 3,625 2,957 -48,918 36,860 -42%
FY 2016 8,846 5,228 3,204 2,355 8,285 2,376 -3,846 2,661 1,244 2,522 2,265 -31,104 4,036 -89%
Projected 2017 17,308 3,787 13,438 5,429 7,812 6,493 1,156 2,661 1,244 2,522 2,265 2,265 66,380 1545%
Proposed 2018 17,654 3,863 13,707 5,538 7,968 6,623 1,179 2,714 1,269 2,572 2,310 2,310 67,708 2%
102% 102% 102% 102% 102% 102% 102% 102% 102% 102% 102% 102%

104
Penalty/Interest: Taxes Current taxes are those that are paid prior to the delinquency date. Delinquent taxes, along with
penalties and interest, are incurred on taxes paid on or after the delinquency date.
Penalties and Interest Oct Nov Dec Jan Feb Mar April May June July Aug Sept Total Trend
FY 2012 2,835 1,179 1,588 5,503 8,525 5,255 3,784 4,351 4,415 5,121 3,278 1,463 47,297 100%
FY 2013 3,210 1,640 5,991 4,443 8,718 12,027 6,106 5,704 4,649 6,156 3,732 5,014 67,390 42%
FY 2014 2,625 1,721 1,547 6,959 6,695 5,450 3,242 2,680 10,823 8,937 3,575 4,023 58,277 -14%
FY 2015 10,444 6,728 2,271 3,577 5,228 6,008 6,866 8,755 4,860 4,242 2,373 1,844 63,196 8%
FY 2016 2,328 1,347 967 2,893 9,414 4,413 2,768 4,178 2,577 2,782 5,353 1,649 40,669 -36%
Projected 2017 4,579 1,063 3,337 6,006 14,832 5,976 2,639 4,178 2,577 2,782 5,353 1,649 54,971 35%
Proposed 2018 4,671 1,084 3,404 6,126 15,129 6,096 2,692 4,262 2,629 2,838 5,460 1,682 56,070 2%
102% 102% 102% 102% 102% 102% 102% 102% 102% 102% 102% 102%
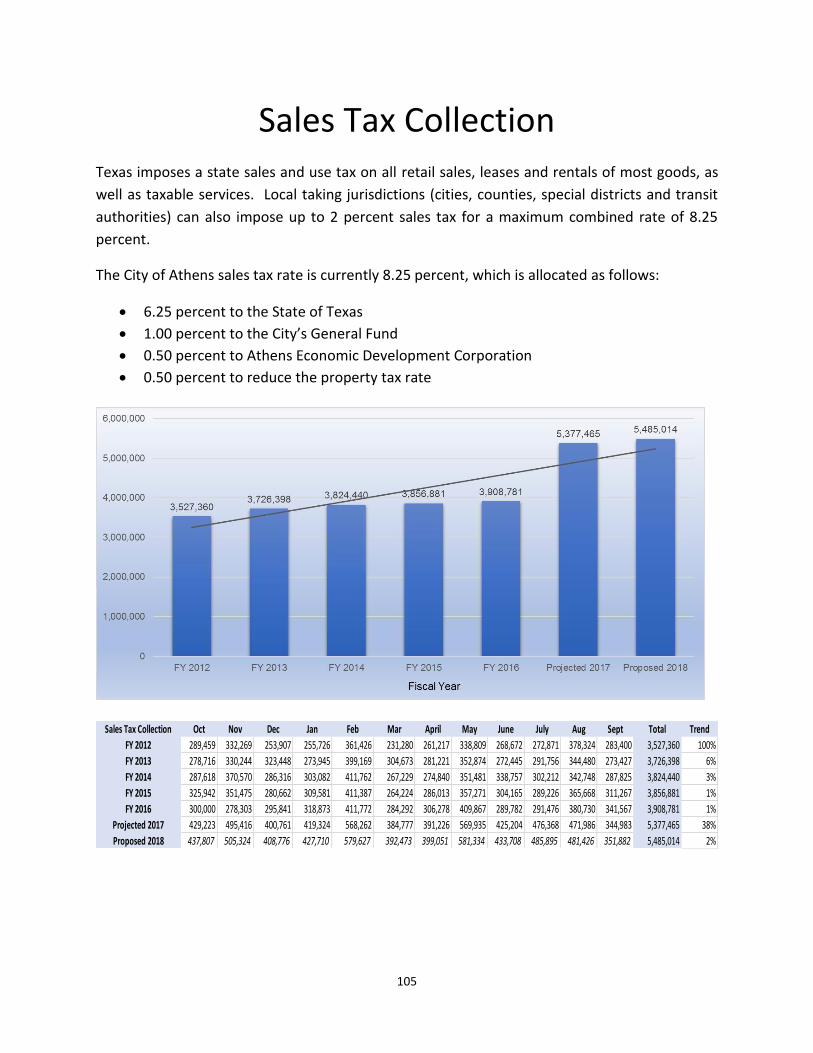
105
Sales Tax Collection Texas imposes a state sales and use tax on all retail sales, leases and rentals of most goods, as
well as taxable services. Local taking jurisdictions (cities, counties, special districts and transit
authorities) can also impose up to 2 percent sales tax for a maximum combined rate of 8.25
percent.
The City of Athens sales tax rate is currently 8.25 percent, which is allocated as follows:
• 6.25 percent to the State of Texas
• 1.00 percent to the City’s General Fund
• 0.50 percent to Athens Economic Development Corporation
• 0.50 percent to reduce the property tax rate
Sales Tax Collection Oct Nov Dec Jan Feb Mar April May June July Aug Sept Total Trend
FY 2012 289,459 332,269 253,907 255,726 361,426 231,280 261,217 338,809 268,672 272,871 378,324 283,400 3,527,360 100%
FY 2013 278,716 330,244 323,448 273,945 399,169 304,673 281,221 352,874 272,445 291,756 344,480 273,427 3,726,398 6%
FY 2014 287,618 370,570 286,316 303,082 411,762 267,229 274,840 351,481 338,757 302,212 342,748 287,825 3,824,440 3%
FY 2015 325,942 351,475 280,662 309,581 411,387 264,224 286,013 357,271 304,165 289,226 365,668 311,267 3,856,881 1%
FY 2016 300,000 278,303 295,841 318,873 411,772 284,292 306,278 409,867 289,782 291,476 380,730 341,567 3,908,781 1%
Projected 2017 429,223 495,416 400,761 419,324 568,262 384,777 391,226 569,935 425,204 476,368 471,986 344,983 5,377,465 38%
Proposed 2018 437,807 505,324 408,776 427,710 579,627 392,473 399,051 581,334 433,708 485,895 481,426 351,882 5,485,014 2%

106
Mixed Beverage Tax Mixed beverage gross receipts tax is a tax on the sale of alcoholic beverages at establishments holding a mixed beverage permit. It is collected by the state and remitted to the City quarterly, and effective January 1, 2014, equals 6.7 (.067) percent of mixed beverage sales (prior to Jan. 1, 2014, 14 percent of gross receipts). This amount is in addition to the standard sales tax applicable to mixed beverage sales, which in Athens is 8.25%.
Mixed Beverage Tax Oct Nov Dec Jan Feb Mar April May June July Aug Sept Total Trend
FY 2012 4,916 0 0 4,253 0 0 5,377 0 0 5,007 0 0 19,554 100%
FY 2013 5,105 0 0 4,591 0 0 5,077 0 0 5,270 0 0 20,043 3%
FY 2014 7,078 0 0 6,914 0 0 6,913 0 0 7,288 0 0 28,193 41%
FY 2015 6,146 0 0 7,218 0 0 7,102 0 0 7,817 0 0 28,283 0%
FY 2016 8,382 0 0 7,675 0 0 7,539 0 0 7,494 0 0 31,090 10%
Projected 2017 9,529 0 0 7,237 0 0 6,848 0 0 7,569 0 0 31,183 0%
Proposed 2018 9,720 0 0 7,382 0 0 6,985 0 0 7,720 0 0 31,807 2%
102% 102% 102% 102% 102% 102% 102% 102% 102% 102% 102% 102%
6,000,000

107
Franchise Fees Gas-The gas utility service is paid quarterly for the use of City
streets and public right-of way for the purpose of providing
gas service, to cover the costs incurred by the City in
connection with the administration of the franchise. The fee
amount is 5 percent fee on gross receipts/sales received by
the Atmos Energy from the customers of Athens.
Phone Internet - The phone and internet service is paid quarterly for the use of City streets and
public right-of way for the purpose of providing phone and internet service and to cover the
costs incurred by the City in
connection with the
administration of the franchise.
The fee amount is 5% percent fee
on gross receipts/sales received
by Cebridge dba Suddenlink,
CenturyLink and other internet
providers in this area, from the
customers of Athens.
Cable- The cable franchise fee is paid quarterly for the use of City streets and public right-of way
for the purpose of providing cable services and to cover the
costs incurred by the City in
connection with the administration of the franchise. The fee
amount is 5 percent fee on gross receipts/sales received by
Suddenlink from the customers of Athens.
History Atmos
FY 2012 $63,586
FY 2013 $53,719
FY 2014 $69,648
FY 2015 $85,299
FY 2016 $70,466
2017 Projected $75,000
2018 Proposed $79,534
History Cebridge CenturyLink Other
FY 2012 $16,761 $64,234 $ 0
FY 2013 $19,723 $59,937 $13,173
FY 2014 $25,887 $52,165 $12,766
FY 2015 $28,693 $46,316 $12,061
FY 2016 $31,953 $41,633 $ 5,568
2017 Projected $32,000 $37,981 $ 6,000
2018 Proposed $32,047 $33,981 $ 6,432
History Suddenlink
FY 2012 $ 35,449
FY 2013 $ 62,623
FY 2014 $141,357
FY 2015 $139,225
FY 2016 $136,718
2017 Projected $136,963
2018 Proposed $137,208
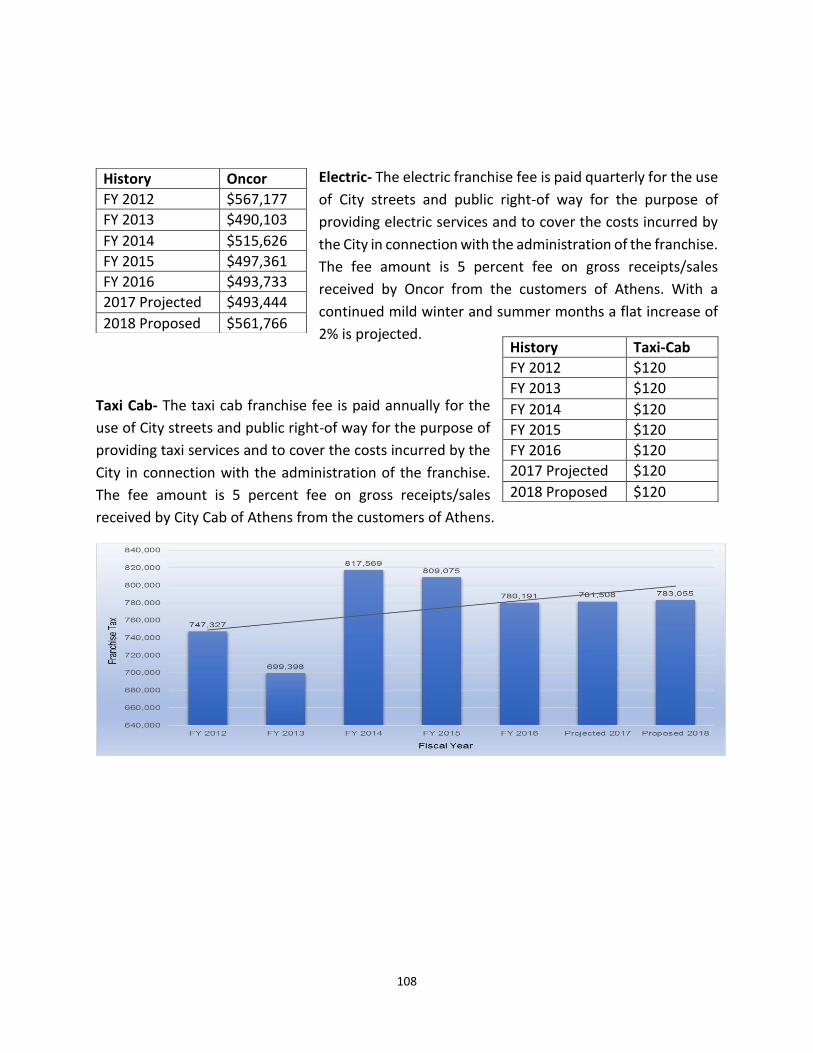
108
Electric- The electric franchise fee is paid quarterly for the use
of City streets and public right-of way for the purpose of
providing electric services and to cover the costs incurred by
the City in connection with the administration of the franchise.
The fee amount is 5 percent fee on gross receipts/sales
received by Oncor from the customers of Athens. With a
continued mild winter and summer months a flat increase of
2% is projected.
Taxi Cab- The taxi cab franchise fee is paid annually for the
use of City streets and public right-of way for the purpose of
providing taxi services and to cover the costs incurred by the
City in connection with the administration of the franchise.
The fee amount is 5 percent fee on gross receipts/sales
received by City Cab of Athens from the customers of Athens.
History Oncor
FY 2012 $567,177
FY 2013 $490,103
FY 2014 $515,626
FY 2015 $497,361
FY 2016 $493,733
2017 Projected $493,444
2018 Proposed $561,766
History Taxi-Cab
FY 2012 $120
FY 2013 $120
FY 2014 $120
FY 2015 $120
FY 2016 $120
2017 Projected $120
2018 Proposed $120

109
Franchise Fees: Solid Waste The solid waste franchise fee is paid monthly for the use of City streets and public right-of way
for the purpose of providing garbage services and to cover the costs incurred by the City in
connection with the administration of the franchise. The fee amount is 5 percent fee on gross
receipts/sales received by Republic Services from the residential and commercial customers of
Athens.
Solid Waste Franchise Oct Nov Dec Jan Feb Mar April May June July Aug Sept Total Trend
FY 2012 9,773 9,897 9,706 9,734 9,569 9,637 9,691 9,647 0 19,399 9,668 10,230 116,951 100%
FY 2013 9,980 10,083 10,078 10,078 10,133 10,589 10,184 10,204 10,040 9,933 9,909 10,497 121,708 4%
FY 2014 10,380 10,120 10,116 10,077 10,017 10,025 10,072 10,101 9,959 10,383 9,921 10,281 121,452 0%
FY 2015 10,221 12,693 10,159 9,940 10,132 10,134 10,180 10,160 10,109 9,858 10,733 10,139 124,458 2%
FY 2016 10,109 10,144 10,126 10,136 8,808 10,100 10,324 0 10,592 9,780 9,639 20,803 120,561 -3%
Projected 2017 9,643 11,674 9,647 10,506 10,450 9,644 10,466 10,160 10,592 9,878 9,735 10,000 122,395 2%
Proposed 2018 9,836 11,907 9,840 10,716 10,659 9,837 10,675 10,363 10,804 10,075 9,930 10,200 124,843 2%
102% 102% 102% 102% 102% 102% 102% 102% 102% 102% 102% 102%

110
Income from Fines Municipal Court Fines The City’s Municipal Court receives revenues from citations issued for violations (up to and including the Class C misdemeanor level) of the City’s codes and ordinances, the state’s Uniform Traffic Code, and other provisions of state law. The fine amounts vary according to the specifications contained in the applicable legislation. The State of Texas received their portion of the fines before any is recognized by the City. All citations that have gone to warrant have be turned over to our collection agency. The outstanding balance of citations is just over $1.6M.
History
Fines 5%-10% Court Fees
Time Payments
FY 2012 $217,797 $5,026 $4,820
FY 2013 $ 77,798 $5,791 $4,366
FY 2014 $526,982 $6,204 $5,368
FY 2015 $361,356 $6,702 $6,366
FY 2016 $215,110 $6,488 $5,624
2017 Projected $198,000 $6,274 $5,050
2018 Proposed $233,174 $6,081 $5,127

111
Re-Zoning Fees Zoning establishes the types of land use permitted on a specific tract of land. Zoning regulates size, intensity, height of development, signage, screening and parking related to development. Rezoning fees are charged to recover most of the costs incurred by the City in connection with application reviews, public hearings and notifications, reproduction, publishing and mailing various document associated with the zoning and annexation process.
Re-Zoning Fees Oct Nov Dec Jan Feb Mar April May June July Aug Sept Total Trend
FY 2012 100 0 100 400 100 0 0 200 0 48 0 100 1,048 100%
FY 2013 0 100 300 200 100 300 0 100 100 100 0 0 1,300 24%
FY 2014 100 0 0 0 100 148 0 100 0 100 100 200 848 -35%
FY 2015 200 0 0 100 100 0 300 0 0 100 100 0 900 6%
FY 2016 0 100 100 0 200 0 100 300 100 320 1,240 480 2,940 227%
Projected 2017 0 0 0 20 0 0 300 300 0 0 0 0 620 -79%
Proposed 2018 0 0 0 20 0 0 300 300 0 0 0 0 620 0%
102% 102% 102% 102% 102% 102% 102% 102% 102% 102% 102% 102%

112
Platting Fees These fees are charged for platting services and public improvement reviews performed by City staff. Platting is required for divisions of property or creating a new building site. Plat fees are collected to recover costs associated with staff reviews for compliance with minimum lot size, street access, utility provisions, drainage and flood protection. The fees vary by type of plat and lot size. The fee recovers the cost of services provided to developers by the City to ensure minimum design and construction standards for public improvements.
Platting Fees Oct Nov Dec Jan Feb Mar April May June July Aug Sept Total Trend
FY 2012 0 0 0 0 0 0 0 0 0 0 40 48 88 100%
FY 2013 0 0 0 0 0 0 40 0 48 0 0 0 88 0%
FY 2014 0 48 0 0 0 0 0 0 0 48 0 44 140 59%
FY 2015 0 48 96 0 0 0 0 0 0 0 0 0 144 3%
FY 2016 112 0 0 0 0 0 0 0 0 450 0 160 722 401%
Projected 2017 0 0 0 0 210 320 0 160 0 0 0 0 690 -4%
Proposed 2018 0 0 0 0 210 320 0 160 0 0 0 0 690 0%
100% 100% 100% 100% 100% 100% 100% 100% 100% 100% 100% 100%

113
Building Permits These fees are collected for building construction permits and sign permits within the City. These revenues offset the operating costs of permit issuance, reviewing building construction and sign plans, conducting field inspections, and associated administrative efforts.
Building Permits Oct Nov Dec Jan Feb Mar April May June July Aug Sept Total Trend
FY 2012 434 5,865 1,882 1,231 5,748 2,265 924 476 3,226 1,371 2,366 6,540 32,328 100%
FY 2013 1,487 2,478 3,622 410 2,876 900 1,166 1,090 1,008 5,645 1,037 319 22,038 -32%
FY 2014 353 777 196 994 926 747 1,189 1,050 2,633 2,582 718 1,724 13,889 -37%
FY 2015 650 511 5,513 1,558 1,715 227 4,325 651 774 1,008 632 782 18,346 32%
FY 2016 1,427 564 612 730 956 240 1,351 3,578 4,680 36,565 19,551 5,291 75,545 312%
Projected 2017 4,325 11,281 1,500 35,034 3,284 11,705 3,325 7,928 4,680 1,008 8,000 5,291 97,361 29%
Proposed 2018 4,325 11,281 1,500 35,034 3,284 11,705 3,325 7,928 4,680 1,008 8,000 5,291 97,361 0%
100% 100% 100% 100% 100% 100% 100% 100% 100% 100% 100% 100%

114
Electrical Permits Electrical permit fees are collected for electrical installations within the City, and are collected to offset the costs of providing electrical inspection services and associated administrative efforts. Exemptions from these fees include installations used by electricity supply, electric railway, or communication agencies in the generation, transmission, or distribution of electricity, or for the operation of street railways, signals, or the transmission of intelligence when located within or on public thoroughfares, buildings, or premises used exclusively by an agency operating under a franchise agreement with the City.
Electrical Permits Oct Nov Dec Jan Feb Mar April May June July Aug Sept Total Trend
FY 2012 560 226 427 483 174 117 1,793 334 477 279 620 250 5,740 100%
FY 2013 340 730 889 428 267 490 192 306 207 237 363 307 4,756 -17%
FY 2014 187 308 165 275 306 110 287 240 104 346 730 304 3,362 -29%
FY 2015 264 110 75 391 357 109 719 309 205 172 508 237 3,456 3%
FY 2016 400 116 365 188 478 155 186 227 839 1,210 1,596 650 6,410 85%
Projected 2017 1,872 2,500 1,590 160 320 240 1,390 530 500 1,200 1,500 600 12,402 93%
Proposed 2018 1,909 2,550 1,622 163 326 245 1,418 541 510 1,224 1,530 612 12,650 0%
102% 102% 102% 102% 102% 102% 102% 102% 102% 102% 102% 102%

115
Plumbing Permits Plumbing permit fees are collected for plumbing installations within the City, and are collected to offset the costs of providing plumbing inspection services and associated administrative efforts. Exemptions from these fees include work done by City employees or other companies furnishing water in the laying of water mains and services, or City sewer mains and services, or to the installation of gas distributing mains and services in the streets and alleys by employees of the gas distributing company, or any work performed by such gas distributing company on any piping or connection up to and including the outlet connections of the service meter.
Plumbing Permits Oct Nov Dec Jan Feb Mar April May June July Aug Sept Total Trend
FY 2012 406 379 164 356 213 364 1,000 284 422 407 574 474 5,043 100%
FY 2013 371 547 1,632 239 484 479 533 376 148 554 256 177 5,796 15%
FY 2014 167 235 130 233 316 447 418 491 415 553 678 984 5,067 -13%
FY 2015 270 243 252 496 678 332 287 1,200 387 267 700 542 5,654 12%
FY 2016 299 270 867 289 360 144 316 494 912 1,150 1,038 1,185 7,324 30%
Projected 2017 1,050 2,300 1,200 1,354 800 1,447 1,040 560 900 1,150 1,038 1,185 14,024 91%
Proposed 2018 1,071 2,346 1,224 1,381 816 1,476 1,061 571 918 1,173 1,059 1,209 14,304 2%
102% 102% 102% 102% 102% 102% 102% 102% 102% 102% 102% 102%

116
Mechanical Permits Mechanical permit fees are collected for mechanical installations (heating, ventilation, and air conditioning) within the City, and are collected to offset the costs of providing mechanical inspection services and associated administrative efforts.
Mechanical Permits Oct Nov Dec Jan Feb Mar April May June July Aug Sept Total Trend
FY 2012 0 55 686 240 15 128 155 166 178 328 562 142 2,655 100%
FY 2013 38 314 0 0 257 92 313 416 74 214 154 236 2,108 -21%
FY 2014 124 141 26 162 150 32 175 78 76 172 344 163 1,643 -22%
FY 2015 217 99 0 233 416 35 270 122 16 0 101 171 1,680 2%
FY 2016 66 284 78 157 168 132 110 111 712 80 956 160 3,014 79%
Projected 2017 490 1,500 80 80 80 80 80 80 700 80 800 80 4,130 37%
Proposed 2018 500 1,530 82 82 82 82 82 82 714 82 816 82 4,213 2%
102% 102% 102% 102% 102% 102% 102% 102% 102% 102% 102% 102%

117
Henderson County Fire/First Responder
Fees County Fire Marshal’s office is the controller of the Contract with Henderson County and part of
the ETMC. These are fees from a mutual agreement between each fire department entity
determined year to year equally between volunteer departments and paid departments
responding and assisting other departments.
First Responder Fees Oct Nov Dec Jan Feb Mar April May June July Aug Sept Total Trend
FY 2012 0 0 0 0 0 10,522 0 0 0 0 1,903 0 12,425 100%
FY 2013 0 0 0 0 0 10,522 0 0 0 0 0 0 10,522 -15%
FY 2014 0 3,010 0 0 0 0 10,522 0 0 0 0 4,018 17,550 67%
FY 2015 0 0 0 0 0 10,550 0 0 0 0 0 0 10,550 -40%
FY 2016 4,081 0 0 0 0 0 10,587 0 0 0 0 0 14,667 39%
Projected 2017 0 4,004 0 0 0 10,522 0 0 0 0 0 1,000 15,526 6%
Proposed 2018 0 4,085 0 0 0 10,522 0 0 0 0 0 1,050 15,657 1%
102% 102% 102% 102% 102% 102% 102% 102% 102% 102% 102% 102%
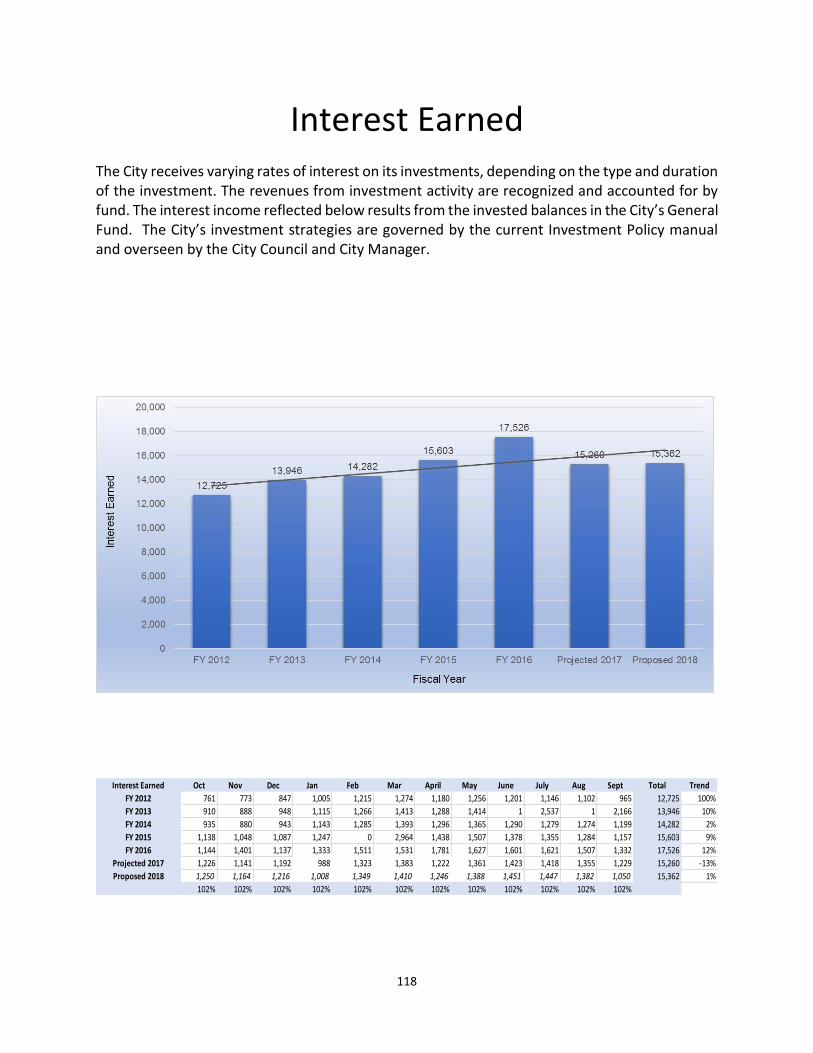
118
Interest Earned The City receives varying rates of interest on its investments, depending on the type and duration of the investment. The revenues from investment activity are recognized and accounted for by fund. The interest income reflected below results from the invested balances in the City’s General Fund. The City’s investment strategies are governed by the current Investment Policy manual and overseen by the City Council and City Manager.
Interest Earned Oct Nov Dec Jan Feb Mar April May June July Aug Sept Total Trend
FY 2012 761 773 847 1,005 1,215 1,274 1,180 1,256 1,201 1,146 1,102 965 12,725 100%
FY 2013 910 888 948 1,115 1,266 1,413 1,288 1,414 1 2,537 1 2,166 13,946 10%
FY 2014 935 880 943 1,143 1,285 1,393 1,296 1,365 1,290 1,279 1,274 1,199 14,282 2%
FY 2015 1,138 1,048 1,087 1,247 0 2,964 1,438 1,507 1,378 1,355 1,284 1,157 15,603 9%
FY 2016 1,144 1,401 1,137 1,333 1,511 1,531 1,781 1,627 1,601 1,621 1,507 1,332 17,526 12%
Projected 2017 1,226 1,141 1,192 988 1,323 1,383 1,222 1,361 1,423 1,418 1,355 1,229 15,260 -13%
Proposed 2018 1,250 1,164 1,216 1,008 1,349 1,410 1,246 1,388 1,451 1,447 1,382 1,050 15,362 1%
102% 102% 102% 102% 102% 102% 102% 102% 102% 102% 102% 102%

119
Compost Site Fees
Compost Site Fees Oct Nov Dec Jan Feb Mar April May June July Aug Sept Total Trend
FY 2012 2,087 543 898 1,435 1,277 1,816 1,605 627 1,768 1,828 1,786 1,736 17,406 100%
FY 2013 1,436 561 1,394 695 1,538 1,450 1,015 1,576 2,030 1,734 1,234 1,287 15,950 -8%
FY 2014 1,136 892 473 1,170 1,888 2,628 1,467 1,390 2,636 1,510 1,842 1,670 18,702 17%
FY 2015 2,036 1,292 1,361 950 1,731 1,720 1,664 1,496 2,752 2,471 2,436 2,321 22,230 19%
FY 2016 1,784 1,343 1,186 1,110 3,212 1,686 2,064 2,097 1,703 3,185 3,136 1,919 24,425 10%
Projected 2017 1,371 610 581 1,080 999 1,556 1,058 1,086 858 2,389 2,471 1,970 16,029 -34%
Proposed 2018 1,357 604 575 1,069 989 1,540 1,047 1,075 849 2,365 2,447 1,050 14,968 -7%
99% 99% 99% 99% 99% 99% 99% 99% 99% 99% 99% 99%

120
Auction Proceeds The City receives income from annual auctions. Items auctioned include surplus City property, vehicles that have reached the end of their specified lifecycles, and stolen property recovered by the Police Department that have not been claimed. Auctions are overseen by the Fleet Department in accordance with established property disposal guidelines. Monies received from auctioned items are deposited into the General Fund.
Auction Proceeds Oct Nov Dec Jan Feb Mar April May June July Aug Sept Total Trend
FY 2012 0 0 0 0 0 26,804 0 0 0 0 0 0 26,804 100%
FY 2013 0 0 0 0 0 0 0 0 27,771 0 0 0 27,771 4%
FY 2014 0 0 0 0 0 0 0 0 0 0 0 0 0 -100%
FY 2015 0 0 0 0 0 0 0 0 0 0 26,513 0 26,513 0%
FY 2016 0 0 0 0 0 0 0 0 0 0 0 0 0 -100%
Projected 2017 0 0 0 0 0 0 64,946 0 0 0 0 0 64,946 0%
Proposed 2018 0 0 0 0 25,000 0 0 0 0 0 0 0 25,000 -62%

121
Airport Fund
Building Leases Oct Nov Dec Jan Feb Mar April May June July Aug Sept Total
FY 2012 4,026 0 0 1,165 449 647 0 0 124 0 0 0 6,411
FY 2013 4,026 0 0 1,386 245 403 0 245 0 0 0 0 6,305
FY 2014 1,276 2,750 0 1,165 408 647 0 0 0 0 0 2,750 8,996
FY 2015 1,276 0 0 1,574 245 403 0 0 0 0 0 2,750 6,247
FY 2016 1,276 0 403 1,614 0 0 0 0 0 0 0 2,750 6,042
Projected 2017 1,276 0 0 901 0 0 0 0 0 0 0 2,750 4,927
Proposed 2018 1,276 0 400 0 200 500 0 0 0 0 0 2,750 5,126
Hanger Rent Oct Nov Dec Jan Feb Mar April May June July Aug Sept Total
FY 2012 2,425 3,475 4,700 4,203 3,475 2,600 3,300 2,425 4,000 2,600 3,400 3,125 39,728
FY 2013 3,125 2,600 5,103 4,425 2,075 1,950 4,175 4,200 3,300 3,125 2,425 4,200 40,703
FY 2014 2,950 2,425 3,178 4,175 4,525 2,950 2,775 3,100 3,475 2,250 4,175 2,975 38,953
FY 2015 3,550 2,800 3,325 2,800 3,500 3,378 3,500 3,150 3,725 3,325 3,325 3,100 39,478
FY 2016 4,350 1,725 3,825 5,075 3,325 3,150 3,710 3,535 3,710 3,360 3,010 3,360 42,135
Projected 2017 3,010 2,135 4,235 4,614 3,010 3,535 3,535 2,944 2,944 3,745 3,745 3,745 41,197
Proposed 2018 2,083 2,642 4,689 4,195 2,725 3,967 3,368 2,452 2,336 4,175 4,659 4,174 41,465
69% 124% 111% 91% 91% 112% 95% 83% 79% 111% 124% 111%
Fuel Sales Oct Nov Dec Jan Feb Mar April May June July Aug Sept Total
FY 2012 150 201 89 268 146 137 84 72 108 126 155 103 1,639
FY 2013 127 199 212 64 116 144 164 190 192 234 203 194 2,040
FY 2014 151 203 150 94 143 122 182 181 195 172 256 164 2,013
FY 2015 145 197 207 194 128 158 130 171 224 192 264 109 2,118
FY 2016 155 190 137 125 73 140 133 133 85 162 217 116 1,664
Projected 2017 173 191 97 119 187 167 76 60 85 162 217 116 1,650
Proposed 2018 193 193 69 113 477 198 44 27 85 162 217 116 1,895
112% 101% 71% 95% 256% 119% 58% 45% 100% 100% 100% 100%
Interest Oct Nov Dec Jan Feb Mar April May June July Aug Sept Total
FY 2012 41 40 43 44 42 46 45 47 46 49 32 19 493
FY 2013 42 42 43 45 41 43 38 38 0 78 0 80 489
FY 2014 41 45 48 49 46 51 51 52 52 54 20 53 561
FY 2015 56 55 58 59 0 113 92 57 55 58 58 56 717
FY 2016 60 59 59 60 53 55 54 62 63 64 54 54 695
Projected 2017 60 58 60 61 55 60 61 62 63 64 65 54 723
Proposed 2018 60 57 61 62 58 65 69 62 63 64 78 54 754
100% 98% 102% 102% 104% 108% 113% 101% 101% 101% 120% 101%

122
Hotel Occupancy Tax (HOT) Fund
Hotel tax is revenue collected from hotels and motels located within Athens city limits. The
amount paid to the City is set my ordinance at 7% of the room rate charged by the hotel or motel,
excluding all other services provided (meals, laundry, etc.) for each day a room costing more than
$2 per day is occupied. With the City Council’s focus on events and attractions, the anticipated
revenues have increased conservatively by 2%. These funds may be used for both advertising
and operational expenditures, as long as the primary purpose of the event is to attract out-of-
town visitors or tourism in general.
Interest income is the earned interest received from checking account at Prosperity Bank.
Tax Revenue Oct Nov Dec Jan Feb Mar April May June July Aug Sept Total Trend
FY 2012 17,447 18,058 10,697 8,043 11,289 14,215 21,857 20,904 26,673 25,594 18,386 17,104 210,267 100
FY 2013 18,681 18,590 21,585 14,612 13,600 16,960 20,902 20,736 26,301 27,521 16,010 20,996 236,494 12%
FY 2014 19,918 25,924 20,469 12,963 15,720 16,537 22,127 23,138 15,242 23,309 25,122 13,763 234,232 -1%
FY 2015 12,948 18,914 65,473 30,762 19,264 16,956 19,489 23,454 28,659 26,866 29,238 27,890 319,913 37%
FY 2016 25,373 29,190 20,840 10,583 17,003 35,710 24,470 28,622 30,720 30,270 29,338 21,993 304,112 -5%
Projected 2017 25,820 24,941 24,845 18,803 16,761 17,974 28,017 28,035 30,000 30,000 29,000 22,000 296,196 -3%
Proposed 2018 26,336 25,440 25,342 19,179 17,096 18,333 28,577 28,596 30,600 30,600 29,580 22,440 302,120 2%
102% 102% 102% 102% 102% 102% 102% 102% 102% 102% 102% 102%
Interest Oct Nov Dec Jan Feb Mar April May June July Aug Sept Total Trend
FY 2012 44 45 49 51 49 61 60 66 60 66 69 70 690 100
FY 2013 71 67 72 74 68 77 75 77 0 161 0 166 907 31%
FY 2014 86 82 174 88 81 88 0 85 85 90 93 90 1,043 15%
FY 2015 93 88 99 106 0 206 104 101 98 105 108 108 1,216 17%
FY 2016 115 113 120 28 114 125 130 250 164 134 142 144 1,577 30%
Projected 2017 155 157 162 159 141 158 157 150 164 134 142 144 1,823 16%
Proposed 2018 159 160 165 162 143 162 160 153 167 137 145 147 1,859 2%
102% 102% 102% 102% 102% 102% 102% 102% 102% 102% 102% 102%

123
Debt Service Fund
The Debt Service (Interest & Sinking) Fund is to account for the portion of revenues collected for
long term bonds payable. The primary source of revenue for the debt service fund is ad valorem
property tax. Approximately 11% of the total property tax revenues collected are used to pay
principal and interest on the City’s outstanding certificates of obligation bond debt. The
Henderson County Tax office collects the taxes and directly deposits into our bank account at
Prosperity Bank.
Delinquent property tax income is also collected which is taxes due from previous years. Both
the delinquent property tax and penalty income are difficult to predict as there is no way to
determine how many property owners will pay late and/or have penalties assessed to their tax
bills, so these items are budgeted based solely upon collections from previous years.
Ad Valorem Collections Oct Nov Dec Jan Feb Mar April May June July Aug Sept Total Trend
FY 2012 56,251 61,009 111,517 204,881 61,739 8,083 4,432 4,273 4,028 4,436 2,118 687 523,453 100
FY 2013 56,870 49,058 186,870 292,309 61,229 29,468 8,611 7,861 5,796 5,745 2,865 2,399 709,081 35%
FY 2014 30,570 41,692 167,439 242,687 65,832 9,307 4,041 3,878 10,976 7,727 2,293 2,115 588,557 -17%
FY 2015 39,497 26,079 182,898 253,327 77,227 9,216 9,640 10,183 5,233 3,484 1,091 839 618,714 5%
FY 2016 34,868 37,732 181,130 212,815 77,941 6,966 14,518 4,395 2,402 2,113 3,694 637 579,211 -6%
Projected 2017 38,815 34,276 188,639 266,296 80,937 7,837 3,446 6,118 5,687 4,701 2,412 1,335 640,500 11%
Proposed 2018 43,209 31,137 196,459 333,217 84,048 8,817 818 8,516 13,465 10,459 1,575 2,800 734,519 15%
111% 91% 104% 125% 104% 113% 24% 139% 237% 222% 65% 210%
Delinquent Taxes Oct Nov Dec Jan Feb Mar April May June July Aug Sept Total Trend
FY 2012 2,352 922 522 848 1,147 747 546 704 488 552 620 3,715 13,163 100
FY 2013 1,928 1,063 3,810 660 541 766 1,118 778 345 1,194 775 -729 12,249 -7%
FY 2014 2,063 1,176 1,093 1,325 1,012 797 576 273 566 790 670 -815 9,526 -22%
FY 2015 5,411 3,415 1,482 369 628 1,055 393 1,045 263 625 539 -10,035 5,190 -46%
FY 2016 1,516 893 555 409 1,436 412 -719 261 246 434 390 -5,710 123 -98%
Projected 2017 2,697 604 2,096 842 1,222 1,060 194 612 382 719 599 600 11,627 9323%
Proposed 2018 2,697 604 2,096 1,000 1,222 1,060 194 612 382 719 599 500 11,685 1%
Penalty and Interest Oct Nov Dec Jan Feb Mar April May June July Aug Sept Total Trend
FY 2012 554 235 316 952 1,557 906 671 776 773 877 584 258 8,459 100
FY 2013 630 293 1,072 938 1,875 2,598 1,248 1,208 1,000 1,294 765 1,254 14,175 68%
FY 2014 509 335 351 1,220 1,182 949 565 461 1,851 1,543 648 724 10,338 -27%
FY 2015 1,794 1,303 399 624 906 1,036 1,183 1,549 834 726 423 333 11,110 7%
FY 2016 398 226 170 458 1,500 697 401 677 372 443 845 271 6,458 -42%
Projected 2017 723 173 527 987 2,418 1,017 445 677 372 443 845 271 8,898 38%
Proposed 2018 737 176 538 1,007 2,466 1,037 454 691 379 452 862 276 9,076 2%
102% 102% 102% 102% 102% 102% 102% 102% 102% 102% 102% 102%

124
Utilities Fund-Water Income
Water income is generated from residential and commercial water users. All of the City’s water
source is derived from Athens Municipal Water Association. Once the water has been treated, it
is tested and sent to the City’s water tanks for distribution. The City then bills both residential
and commercial customer for the sale of water. Although no substantial increase in customers
are expected in 2018, a $.09% rate increase in water rates over the previous year goes into effect
September 1, 2017. This is a direct result of a water study conducted in 2015 which allowed for
an annual increase thru 2019. Water rates have been established for residential and commercial
customers with minimum rate being based upon meter size per Ordinance O-41-15.
Water Income Oct Nov Dec Jan Feb Mar April May June July Aug Sept Total Trend
FY 2012 217,387 182,118 161,909 153,565 148,901 156,101 156,834 201,421 220,825 229,813 268,139 231,146 2,328,159 100
FY 2013 196,225 180,393 173,090 156,097 157,060 155,999 167,250 180,313 204,998 237,248 253,156 230,953 2,292,782 -2%
FY 2014 201,172 178,147 152,381 156,968 159,410 150,871 166,100 190,787 193,937 203,847 215,246 212,227 2,181,093 -5%
FY 2015 203,148 185,399 160,103 161,805 152,263 147,903 166,485 160,582 163,833 194,509 272,367 227,723 2,196,120 1%
FY 2016 315,533 238,526 200,880 209,990 189,404 425,112 832 199,767 211,505 712,326 -103,721 280,679 2,880,833 31%
Projected 2017 267,759 249,311 200,363 201,552 201,455 211,368 220,697 224,887 211,505 315,549 315,549 343,948 2,963,942 3%
Proposed 2018 291,857 271,749 218,396 219,692 219,586 211,368 220,697 245,127 199,020 343,948 343,948 423,056 3,208,443 8%
109% 109% 109% 109% 109% 109% 109% 109% 109% 109% 109% 123%
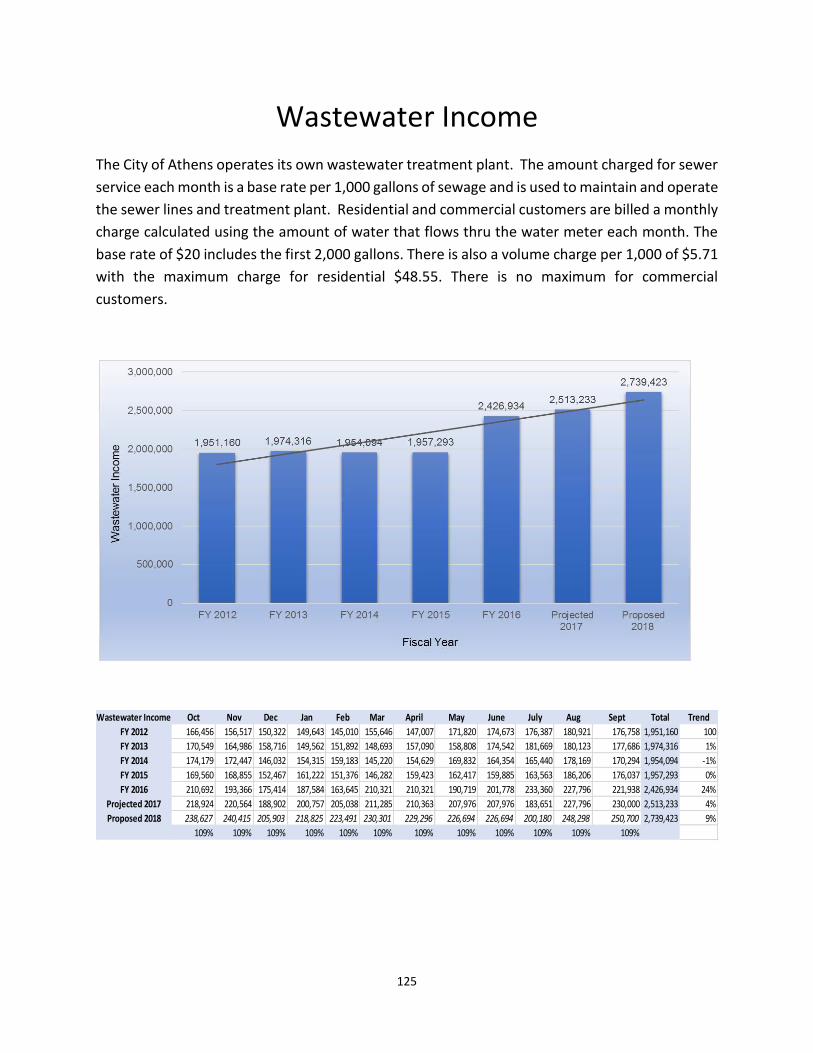
125
Wastewater Income
The City of Athens operates its own wastewater treatment plant. The amount charged for sewer
service each month is a base rate per 1,000 gallons of sewage and is used to maintain and operate
the sewer lines and treatment plant. Residential and commercial customers are billed a monthly
charge calculated using the amount of water that flows thru the water meter each month. The
base rate of $20 includes the first 2,000 gallons. There is also a volume charge per 1,000 of $5.71
with the maximum charge for residential $48.55. There is no maximum for commercial
customers.
Wastewater Income Oct Nov Dec Jan Feb Mar April May June July Aug Sept Total Trend
FY 2012 166,456 156,517 150,322 149,643 145,010 155,646 147,007 171,820 174,673 176,387 180,921 176,758 1,951,160 100
FY 2013 170,549 164,986 158,716 149,562 151,892 148,693 157,090 158,808 174,542 181,669 180,123 177,686 1,974,316 1%
FY 2014 174,179 172,447 146,032 154,315 159,183 145,220 154,629 169,832 164,354 165,440 178,169 170,294 1,954,094 -1%
FY 2015 169,560 168,855 152,467 161,222 151,376 146,282 159,423 162,417 159,885 163,563 186,206 176,037 1,957,293 0%
FY 2016 210,692 193,366 175,414 187,584 163,645 210,321 210,321 190,719 201,778 233,360 227,796 221,938 2,426,934 24%
Projected 2017 218,924 220,564 188,902 200,757 205,038 211,285 210,363 207,976 207,976 183,651 227,796 230,000 2,513,233 4%
Proposed 2018 238,627 240,415 205,903 218,825 223,491 230,301 229,296 226,694 226,694 200,180 248,298 250,700 2,739,423 9%
109% 109% 109% 109% 109% 109% 109% 109% 109% 109% 109% 109%

126
Water and Sewer Taps
Water and Sewer Tap fees are associated with connections to existing public water or sewer
lines. A tap fee is a connection fee used to cover the costs of service installation which may
include, service line, excavation or boring costs, paving, etc. The City of Athens charges a fee for
both the water and sewer taps. Water and sewer tap fees have been established for residential
and commercial customers, per Ordinance O-39-15.
Water Tap Fees Oct Nov Dec Jan Feb Mar April May June July Aug Sept Total Trend
FY 2012 1,985 307 0 1,884 0 2,389 3,315 6,056 2,985 3,895 2,275 725 25,817 100
FY 2013 1,960 2,160 3,602 665 8,869 740 1,832 1,385 5,905 2,650 2,447 0 32,215 25%
FY 2014 0 169 . 1,388 75 0 1,009 12,673 5,823 1,650 2,343 0 25,130 -22%
FY 2015 930 0 0 3,880 75 2,397 383 0 665 4,844 1,450 0 14,624 -42%
FY 2016 1,045 2,576 0 1,179 780 1,560 0 780 890 1,285 0 190 10,285 -30%
Projected 2017 2,710 890 1,825 4,339 2,310 6,285 780 780 890 1,285 0 190 22,284 117%
Proposed 2018 2,764 908 1,862 4,426 2,356 6,411 796 796 908 1,311 0 194 22,730 2%
102% 102% 102% 102% 102% 102% 102% 102% 102% 102% 102% 102%
Sewer Tap Fees Oct Nov Dec Jan Feb Mar April May June July Aug Sept Total Trend
FY 2012 0 0 515 1,040 0 5,831 2,268 0 930 2,797 1,115 0 14,497 100
FY 2013 1,010 545 570 0 1,660 1,395 3,574 545 1,635 545 1,010 70 12,559 -13%
FY 2014 0 1,010 332 545 0 0 0 0 25 270 831 0 3,012 -76%
FY 2015 545 545 0 570 25 545 1,010 0 1,555 490 429 1,010 6,724 123%
FY 2016 545 545 337 2,020 0 545 0 545 570 1,425 415 0 6,947 3%
Projected 2017 1,555 0 890 1,090 1,090 1,010 1,090 550 576 1,439 419 0 9,710 40%
Proposed 2018 1,586 0 908 1,112 1,112 1,030 1,112 561 587 1,468 428 0 9,904 2%
102% 102% 102% 102% 102% 102% 102% 102% 102% 102% 102% 102%

127
Bulk Water Sales
Bulk Water Sales is water intended for potable uses sold inside the City of Athens. The costs is
$8.78 per 1,000 gallons. We are estimating a flat minimum of 2% increase.
Bulk Water Sales Oct Nov Dec Jan Feb Mar April May June July Aug Sept Total Trend
FY 2012 2,397 731 660 240 511 361 355 342 650 1,658 1,006 997 9,908 100
FY 2013 472 585 574 414 504 468 581 766 538 1,289 465 516 7,172 -28%
FY 2014 420 282 648 664 910 302 588 487 618 874 537 738 7,068 -1%
FY 2015 1,303 1,756 439 276 1,034 1,357 321 894 1,204 3,675 4,615 12,381 29,255 314%
FY 2016 5,528 812 289 432 381 1,392 225 1,685 639 907 782 956 14,028 -52%
Projected 2017 1,309 162 2,151 354 925 572 226 1,237 652 925 798 975 10,286 -27%
Proposed 2018 1,335 165 2,194 361 944 583 231 1,262 665 944 814 995 10,491 2%
102% 102% 102% 102% 102% 102% 102% 102% 102% 102% 102% 102%

128
Reconnection Fees
A charge is assessed to the customers when a reconnection of service is needed. Most
reconnection fees are associated with disconnection for non-payment of a bill. Based on previous
years we trended a 2% increase.
Reconnect Fee Oct Nov Dec Jan Feb Mar April May June July Aug Sept Total Trend
FY 2012 5,250 2,950 3,150 2,650 2,750 2,850 2,350 2,650 3,250 2,400 4,100 5,400 39,750 100
FY 2013 2,300 2,700 3,750 2,750 3,250 2,550 3,650 2,950 3,550 3,750 4,025 3,400 38,625 -3%
FY 2014 3,050 4,550 2,300 4,000 5,500 2,800 2,850 3,050 2,700 5,300 4,400 3,200 43,700 13%
FY 2015 4,100 5,000 3,700 4,200 1,900 2,650 2,700 2,450 2,300 2,550 2,150 3,800 37,500 -14%
FY 2016 3,850 2,000 2,850 3,050 2,750 2,350 2,600 2,900 3,950 2,950 2,850 5,450 37,550 0%
Projected 2017 6,500 2,350 4,200 3,300 4,100 2,450 2,800 3,650 5,550 3,009 2,907 5,559 46,375 24%
Proposed 2018 6,630 2,397 4,284 3,366 4,182 2,499 2,856 3,723 5,661 3,069 2,965 5,670 47,303 2%
102% 102% 102% 102% 102% 102% 102% 102% 102% 102% 102% 102%

129
Utilities-Other Fees
Inspection Fees Oct Nov Dec Jan Feb Mar April May June July Aug Sept Total Trend
FY 2012 2,220 1,590 1,590 1,440 2,580 2,070 1,950 1,890 2,580 2,250 2,340 1,530 24,030 100
FY 2013 2,220 1,560 1,080 1,680 2,370 1,650 2,310 2,580 1,530 2,100 2,370 2,220 23,670 -1%
FY 2014 1,860 1,800 1,530 2,010 2,280 1,710 1,800 2,070 2,902 2,580 2,940 2,610 26,092 10%
FY 2015 2,010 1,380 1,560 1,770 1,920 1,890 1,830 1,620 2,160 2,440 2,190 2,040 22,810 -13%
FY 2016 2,160 2,130 1,680 1,770 2,250 1,860 2,160 1,882 2,503 2,429 2,363 1,500 24,687 8%
Projected 2017 2,250 1,830 1,920 1,800 2,280 2,130 1,320 1,233 2,553 2,478 2,410 1,530 23,734 -4%
Proposed 2018 2,295 1,867 1,958 1,836 2,326 2,173 1,346 1,258 2,604 2,527 2,458 1,561 24,209 2%
102% 102% 102% 102% 102% 102% 102% 102% 102% 102% 102% 102%
Disposal Fees Oct Nov Dec Jan Feb Mar April May June July Aug Sept Total Trend
FY 2012 338 610 1,095 906 983 968 981 1,099 735 768 1,160 500 10,143 100
FY 2013 582 918 730 1,205 1,337 2,197 3,221 2,916 2,548 2,209 843 282 18,988 87%
FY 2014 595 968 1,396 1,893 2,660 2,688 3,167 3,682 2,268 440 2,260 1,914 23,931 26%
FY 2015 332 2,369 2,498 2,030 2,238 2,571 3,831 3,602 3,458 3,305 4,704 5,096 36,034 51%
FY 2016 4,672 5,429 6,254 6,801 4,366 11,718 0 5,634 5,300 6,658 2,422 4,604 63,858 77%
Projected 2017 4,002 2,866 2,978 3,311 3,655 4,146 4,842 5,228 5,300 6,791 2,470 4,696 50,286 -21%
Proposed 2018 4,082 2,923 3,038 3,377 3,728 4,229 4,939 5,333 5,406 6,927 2,520 4,790 51,291 2%
102% 102% 102% 102% 102% 102% 102% 102% 102% 102% 102% 102%
System Fee Oct Nov Dec Jan Feb Mar April May June July Aug Sept Total Trend
FY 2012 25 0 50 50 0 125 125 25 75 50 100 25 650 100
FY 2013 620 100 100 25 175 75 100 75 100 75 50 0 1,495 130%
FY 2014 0 25 25 50 25 0 25 0 125 75 25 650 1,025 -31%
FY 2015 50 0 0 200 50 112 75 0 63 50 80 25 705 -31%
FY 2016 50 150 25 25 25 75 0 50 0 75 25 0 500 -29%
Projected 2017 120 25 100 115 276 123 75 0 0 77 26 0 936 87%
Proposed 2018 122 26 102 117 282 125 77 0 0 78 26 0 955 2%
102% 102% 102% 102% 102% 102% 102% 102% 102% 102% 102% 102%

130
Penalties Income
Customers must pay a penalty when making a payment after the due date each month. Penalties
charged for late payments are assessed once a month and are charged to both residential and
commercial customers on any balance remaining over $10.00. A conservative increase is
proposed.
Penalties Oct Nov Dec Jan Feb Mar April May June July Aug Sept Total Trend
FY 2012 7,813 7,702 7,345 6,376 7,198 6,641 6,479 6,537 6,385 7,674 7,836 7,483 85,469 100
FY 2013 7,201 7,243 6,464 6,996 5,484 6,025 5,631 7,719 6,413 7,869 7,865 7,699 82,609 -3%
FY 2014 8,013 6,405 6,897 7,122 6,360 5,966 6,846 7,171 6,737 7,237 6,271 7,134 82,159 -1%
FY 2015 7,981 6,304 7,233 8,928 6,234 6,265 6,708 6,626 6,833 7,231 7,226 8,737 86,306 5%
FY 2016 8,032 887 8,441 6,221 5,443 6,457 6,310 7,782 8,631 6,939 9,708 10,872 85,723 -1%
Projected 2017 7,569 8,139 8,364 7,367 9,247 6,101 7,015 8,613 8,717 6,939 9,708 10,872 98,651 15%
Proposed 2018 7,720 8,302 8,531 7,514 9,432 6,223 7,155 8,785 8,892 7,078 9,902 11,089 100,624 2%
102% 102% 102% 102% 102% 102% 102% 102% 102% 102% 102% 102%