Embed Size (px)
Citation preview

Ver 308
May 2007
GHK International, UK
in association with Infrastructure Professionals Enterprise
ENC Consulting Engineers
Urban Development Department Government of Uttarakhand
City Development Plan: Dehradun
Revised Under
Jawaharlal Nehru National Urban Renewal Mission (JNNURM)
Ver 308

Preface
The City Development Plan (CDP) of Dehradun is prepared as a part of the initiative of Government of Uttarakhand to access funds under the Jawaharlal Nehru Urban Renewal Mission (JNNURM). CDP is one of the pre requisites for accessing funds under the scheme.
This CDP focuses on the municipal area of Dehradun. At the same time it takes into consideration the future urban growth of Dehradun city which is likely to grow beyond the present municipal boundary. The requirement of infrastructure should therefore meet such growth in future. The CDP was first prepared in August 2006. The CDP was adopted by the State Level Nodal Agency and forwarded to Ministry of Urban Development, Government of India. The CDP was subsequently appraised by the National Institute of Urban Affairs (NIUA). The comments and observations of NIUA have been duly incorporated in this revised report.

Uttarakhand Urban Development Project
Dehradun City Development Plan Page i
Contents List of Tables……………………………………… ……………………………………iv Abbreviations and Acronyms .................................................................................vi Executive Summary ...............................................................................................ix 1. Introduction and Background ........................................................................ 1
1.1 Background of JNNURM.....................................................................................................1 1.2 Objective of CDP.................................................................................................................1 1.3 Process of CDP Preparation ...............................................................................................2
2. City Profile..................................................................................................... 5 2.1 About Dehradun ..................................................................................................................5 2.2 Topography and Natural Resources ...................................................................................5 2.3 Historical Background .........................................................................................................5 2.4 Climate ................................................................................................................................6 2.5 City and its Surroundings ....................................................................................................7
2.5.1 Institutional Attractions .............................................................................................................. 7 2.5.2 Tourist Attractions...................................................................................................................... 7
2.6 Linkages and Connectivity ..................................................................................................7 3. Situational Analysis – Problems and Opportunities....................................... 8
3.1 Socio-economic Profile........................................................................................................8 3.1.1 Demographic Profile .................................................................................................................. 8 3.1.2 Urban Poverty Profile .............................................................................................................. 13 3.1.3 Situation Analysis .................................................................................................................... 17 3.1.4 Key Urban Social Issues.......................................................................................................... 26
3. 2 Economic Development ....................................................................................................27 3.2.1 Demographic Features ............................................................................................................ 27 3.2.2 Economic Base of the City....................................................................................................... 28 3.2.3 Economic Growth Potential ..................................................................................................... 30
3.3 Physical Growth and Urban Environment .........................................................................32 3.3.1 Planning Efforts in the Past ..................................................................................................... 32 3.3.2 Physical Constraints for Growth .............................................................................................. 41 3.3.3 Future Directions of Growth..................................................................................................... 41 3.3.4 Tourism and Buildings/ Structures of Heritage Importance...................................................... 44 3.3.5 Key Issues Relating to Physical Growth and Built Environment .............................................. 46
3.4 Municipal Infrastructure .....................................................................................................47 3.4.1 Water Supply ........................................................................................................................... 47 3.4.2 Sewerage and Sanitation......................................................................................................... 56 3.4.3 Storm Water Drainage............................................................................................................. 60 3.4.4 Solid Waste Management........................................................................................................ 64 3.4.5 Roads and Transport ............................................................................................................... 71
3.5 Environmental Management .............................................................................................78 3.5.1 Status of Pollution – Air, Water and Noise...................................................................................... 78
4. Urban Governance and Institutional Setup ................................................. 81 4.1 Components of Governance .............................................................................................81
4.1.1 Role of State Government ....................................................................................................... 82 4.2 JNNURM and Urban Governance.....................................................................................83
4.2.1 Goal......................................................................................................................................... 83 4.2.2 Focus....................................................................................................................................... 83 4.2.3 Objective.................................................................................................................................. 83 4.2.4 Multi-Institutionality .................................................................................................................. 83 4.2.5 Urban Reforms Agenda........................................................................................................... 84
4.3 Institutional Profile .............................................................................................................84 4.3.1 Dehradun Nagar Nigam (DNN)................................................................................................ 86
4.4 Inter-Agency Coordination Issues .....................................................................................89 4.4.1 Three perspectives .................................................................................................................. 89 4.4.2 Bold Initiatives ......................................................................................................................... 90 4.4.3 Institutional Changes in Dehradun Context ............................................................................. 91
4.5 Role of Private Sector in Urban Infrastructure Provision...................................................92 4.6 Role and Responsibilities of the ULB under the 74th CAA ...............................................92
4.6.1 Municipal Executive Structure ................................................................................................. 94 4.6.2 Management Upgradation ....................................................................................................... 95

Uttarakhand Urban Development Project
Dehradun City Development Plan Page ii
4.6.3 Community Participation.......................................................................................................... 95 4.7 Training and Capacity Building Initiatives .........................................................................96
4.7.1 Political Leadership ................................................................................................................. 97 5. Financial Profile of Dehradun Nagar Nigam (DNN) and Other Agencies .... 99
5.1 Towards a City Development Plan – Financial Aspects....................................................99 5.2 Review of Existing Fiscal and Financial Situation .............................................................99 5.3 Overview of DNN Finances .............................................................................................100
5.3.1 Receipts Analysis .................................................................................................................. 101 5.3.2 Expenditure Analysis ............................................................................................................. 104 5.3.3 Key Indicators........................................................................................................................ 106 5.3.4 Dehradun Nagar Nigam – Key Issues ................................................................................... 107
5.4 Overview of Mussourie Dehradun Development Authority (MDDA) Finances................108 5.4.1 Composition of Income.......................................................................................................... 109 5.4.2 Expenditure ........................................................................................................................... 109 5.4.3 Financial Position of MDDA................................................................................................... 110
5.5 Assessment of Financial Performance of Uttarakhand Jal Sansthan.............................111 5.5.1 Key Issues ............................................................................................................................. 112
6. The City and its Vision ............................................................................. 113 6.1 Introduction......................................................................................................................113 6.2 SWOT Analysis ...............................................................................................................113 6.3 Stakeholders Consultations – Vision Exercise................................................................117 6.4 Stakeholders’ Perceptions...............................................................................................117 6.5 Contextual Framework for the Dehradun City Vision ......................................................158 6.6 Sector Strategies.............................................................................................................161
7. Sector Strategies & Identification of Projects & Programme Interventions 162 7.1 Physical Growth and Built Environment ..........................................................................162
7.1.1 Identification of Projects and Programme Interventions ........................................................ 163 7.2 Municipal Infrastructure Development.............................................................................166
7.2.1 Water Supply ......................................................................................................................... 166 7.2.2 Sewerage and Sanitation....................................................................................................... 170 7.2.3 Storm Water Drainage........................................................................................................... 171 7.2.4 Solid Waste Management...................................................................................................... 174 7.2.5 Roads and Transportation ..................................................................................................... 176 7.2.6 Street Light ............................................................................................................................ 185
7.3 Environmental Management ...........................................................................................186 7.4 Urban Poverty Reduction ................................................................................................187 7.5 Economic Development ..................................................................................................189 7.6 Strengthening Urban Governance and Institutional Development..................................190
7.6.1 Dehradun Context ................................................................................................................. 190 7.6.2 Major Recommendations....................................................................................................... 194
7.7 Municipal Financial Management....................................................................................196 7.7.1 Double Entry System of Accounting ...................................................................................... 196 7.7.2 Property tax: .......................................................................................................................... 196
8. City Investment Plan, Strategies and Implementation Plan....................... 197 8.1 City Investment Plan (CIP) ..............................................................................................197
8.1.1 Institutionalising the CIP Process .......................................................................................... 197 8.2 Capital Facilities, Investment Phasing and Implementation............................................198
8.2.1 Summary of Investments ....................................................................................................... 198 8.3 Sectoral Investment Plan ................................................................................................200
8.3.1 Water Supply ......................................................................................................................... 200 8.3.2 Sewerage .............................................................................................................................. 201 8.3.3 Roads and Transport ............................................................................................................. 202 8.3.4 Storm Water Drainage........................................................................................................... 203 8.3.5 Street Lighting ....................................................................................................................... 203 8.3.6 Solid Waste Management...................................................................................................... 204 8.3.7 Urban Poor ............................................................................................................................ 205 8.3.8 Urban Renewals and Redevelopment ................................................................................... 206
8.4 Financing Plan.................................................................................................................206 8.5 Financial and Operating Plan ..........................................................................................207
8.5.1 Cost Estimates and Financing Plan....................................................................................... 207 8.5.2 CDP Sustainability................................................................................................................. 208
8.6 Investment Sustenance Plan...........................................................................................211

Uttarakhand Urban Development Project
Dehradun City Development Plan Page iii
Annexes
Annex 3.1.1: Year-wise projection of population up to the year 2035 Annex 3.1.2: List of Slum Population in Dehradun Annex 3.1.3: Methodology of Socio-economic Survey Annex 3.3.1: Deviations in Land Uses in the Master Plan Annex 3.3.2: Development Schemes / Projects Implemented by the MDDA
Annex 3.4.1: Details of Existing Sewerage Facilities and Proposed Sewage System and Sewage Treatment Plants
Annex 6: Stakeholders Consultations Annex 7.2.1: Water Supply Annex 7.2.2: Growth of Water Demand Annex 7.2.3: Solid Waste Management

Uttarakhand Urban Development Project
Dehradun City Development Plan Page iv
List of Tables Table 3.1.1: Dehradun Population and Decadal Growth Rate ..........................................................8 Table 3.1.2: Age-Sex Distribution and Sex Ratio ..............................................................................9 Table 3.1.3: Literacy Status of Population Age 7 Years and Above..................................................9 Table 3.1.4: Occupation by Age ........................................................................................................9 Table 3.1.5: Income Expenditure and Savings................................................................................10 Table 3.1.6: Distribution of Population by Household Composition and Possession......................11 Table 3.1.7: Willingness to Improve House .....................................................................................12 Table 3.1.8: Migration ......................................................................................................................13 Table 3.1.9: Data on Water Supply..................................................................................................18 Table 3.1.10: Responsibility of Water Collection .............................................................................18 Table 3.1.11: Time spent for collecting water ..................................................................................19 Table 3.1.12: Quality of Water .........................................................................................................19 Table 3.1.13: Data on Sanitation .....................................................................................................20 Table 3.1.14: Solid Waste Management..........................................................................................21 Table 3.1.15: Disposal of Solid Waste.............................................................................................21 Table 3.1.16: Data on Drainage and Water Logging .......................................................................22 Table 3.1.17: Approach Road..........................................................................................................23 Table 3.1.18: Priority in Order of Importance to Quality of Life (%).................................................24 Table 3.1.19: Hygiene Practices......................................................................................................24 Table 3.2.1: Tourist Arrivals in Dehradun ........................................................................................28 Table 3.2.2: Percentage Contribution of Three Economic Sectors to NSDP ..................................29 Table 3.2.3: Large and Medium Scale Industrial Units in Dehradun District and Number of Workers
Employed..................................................................................................................................30 Table 3.3.1: Existing and Proposed Land Use - Master Plan 2001................................................33 Table 3.3.2: Key Provisions under Master Plan 2001 ....................................................................35 Table 3.3.4: Land use 2003-04 as per Draft Master Plan................................................................39 Table 3.3.5: Proposed Land use as per Draft Master Plan 2025 ....................................................40 Table 3.3.6: Land encroached by Malin Bastis................................................................................41 Table 3.3.7: Land Use Changes between 1965-1989 .....................................................................43 Table 3.4.1: Present Availability of Water from Various Sources....................................................48 Table 3.4.2 Present Status of Dehradun Water Supply (2005-06)..................................................55 Table 3.4.3: Characteristics of Sewerage Zones.............................................................................57 Table 3.4.4: Service Levels of Sewerage System ...........................................................................58 Table 3.4.5: New Schemes for Sewerage Augmentation and Sewage Treatment .........................59 Table 3.4.6: Climatic Data................................................................................................................60 Table 3.4.7: Catchment Aeas of Town Draining into Various Rivers...............................................63 Table 3.4.8: List of Water Logged Areas ........................................................................................63 Table 3.4.9: Composition of MSW in Dehradun ..............................................................................64 Table 3.4.10: Characteristics of MSW in Dehradun ........................................................................65 Table 3.4.11: Vehicle/Equipment Presently Being Utilized by DNN for Transportation of Solid
Waste........................................................................................................................................66 Table 3.4.12: Wards Covered Under Different Solid Waste Management Circles..........................67 Table 3.4.13: Present Staff Strength of Public Health Department .................................................68 Table: 3.4.14: Number of Registered Motor Vehicles in Dehradun.................................................75 Table 3.5.1: Status of Air Pollutants during the year 2005-06.........................................................79 Table 3.5.2: Noise Monitoring Result (All values are in dB) ............................................................80 Table 4.3.1: Institutional-Functional Matrix (DNN)...........................................................................85 Table 4.3.2: Functions of Committees in DNN ................................................................................88 Table 4.3.3: Sector Issues ...............................................................................................................89 Table 5.1: Summary financial profile of DNN FY 2001-02 to FY 2005-06 (INR million)................100 Table 5.2: Summary Revenue by Source Categories, DNN FY 2001-06 (INR million) ................101 Table 5.3: Composition of Non-tax revenues, DNN FY 2001-02 to FY 2004-05...........................103 Table 5.4: Composition of Capital Receipts, DNN FY 2001-02 to FY 2005-06.............................104 Table 5.5: Composition of Revenue expenditure, DNN FY 2001-02 to FY 2005-06.....................105 Table 5.6: Composition of capital expenditure, DNN FY 2001-02 to FY 2005-06.........................105 Table 5.7: Fiscal health indicators, DNN FY 2001-02 to FY 2005-06 ...........................................106 Table 5.8: Demand, Collection and Balance .................................................................................108

Uttarakhand Urban Development Project
Dehradun City Development Plan Page v
Table 5.9: Composition of Income - MDDA ...................................................................................109 Table 5.10: Composition of Revenue Expenditure ........................................................................110 Table 5.11: Financial Summary .....................................................................................................111 Table 5.12: Composition of Income – DDN Division .....................................................................111 Table 5.13: Composition of Expenses – DDN Division .................................................................112 Table 5.14: Demand, Collection and Balance Statement..............................................................112 Table 6.1: City Level SWOT Analysis............................................................................................114 Table 6.2: SWOT Analysis for Individual Sectors..........................................................................115 Table 7.1.1: Sector Vision, Key Issues and Strategies..................................................................162 Table 7.1.2: Identification of Projects and Programme Interventions - Urban Renewal, Heritage and
Preservation of Water Bodies.................................................................................................163 Table 7.6.2: Achieving Good Urban Governance..........................................................................194 Table 8.1: Summary of Capital Investments (Rs. Crores) .............................................................199 Table 8.2: Water Supply Sub-Projects Investments ......................................................................200 Table 8.3: Sewerage Sub-Projects Investments............................................................................202 Table 8.4: Roads and Transport Sub-Projects Investments..........................................................202 Table 8.5: Storm Water Drainage Sub-Projects Investments........................................................203 Table 8.6: Street lighting Sub-Projects Investments......................................................................204 Table 8.7: Solid Waste Management Sub-Projects Investments ..................................................204 Table 8.8: Urban Poor Sub-Projects Investments .........................................................................205 Table 8.9: Urban Renewals, Cultural Heritage and Preservation of Water Bodies.......................206 Table 8.10: Investment Program ...................................................................................................207 Table 8.11: Assumed O&M Expenditure .......................................................................................209 Table 8.12: CDP Sustainability – Dehradun Jal Sansthan ............................................................211 Table 8.13: CDP Sustainability – Dehradun NN............................................................................211 Table 8.14: Financial Improvement Action Plan ............................................................................212 Table 8.15: Financial and Operating Plan .....................................................................................213

Uttarakhand Urban Development Project
Dehradun City Development Plan Page vi
Abbreviations and Acronyms ADB Asian Development Bank ADP Annual Development Plan ARV Annual Ratable Value BHEL Bharat Heavy Electrical BMS Basic Minimum Services BPL Below Poverty Line BOD Biological Oxygen Demand BOO Build Own Operate BOT Build Operate Transfer BSY Balika Samriddhi Yojna CAA Constitutional Amendment Act CBO Community Based Organisation CCF City Challenge Fund CDP City Development Plan CDS Community Development Society CII Confederation of Indian Industry CIP City Investment Plan CO Community Organiser CPHEEO Central Public Health Engineering and Environmental Organisation CSO Civil Society Organisation CVB Central Valuation Board DA Development Authority DDP Draft Development Plan DFID Department for International Development (UK) DFR Draft Feasibility Report DLBs Directorate of Local Bodies DM District Magistrate DNN Dehradun Nagar Nigam DoE Department of Environment DoHFW Department of Health and Family Welfare DPR Detailed Project Report DSC Design and Supervision Consultant DUDA District Urban Development Agency DWACUA Development for Women and Children in Urban Area EIA Environmental Impact Assessment EIRR Economic Internal Rates of Return EWS Economically Weaker Section FIRR Financial Internal Rates of Return GIS Geographical Information System GoU Government of Uttarakhand GoI Government of India GSDP Gross Domestic Product H&ED Housing and Environment Department HUDCO Housing and Development Corporation ICDS Integral Child Development System IDSMT Integrated Development of Small and Medium Towns IHSDP Integrated Housing and Slum Development Programme

Uttarakhand Urban Development Project
Dehradun City Development Plan Page vii
ILCS Integrated Low Cost Sanitation IRC Indian Road Congress ISBT Inter State Bus Terminus ISO International Standard Organisation IT Information Technology JNNURM Jawaharlal Nehru National Urban Renewal Mission KABB Knowledge Attitude Belief Behavior LIC Life Insurance Corporation LPCD Litres per Capita per Day MAPPR Municipal Action Plan for Poverty Reduction M&E Monitoring and Evaluation MDDA Mussourie Dehradun Development Authority MDG Millennium Development Goals MFF Multi-tranche Financing Facility MIC Mayor in-Council MIS Management Information System MLD Millions Litres Per Day MMIS Municipal Management Information System MoRTH Ministry of Road Transport and Highways MSW Municipal Solid Waste NGO Non Government Organisation NH National Highway NHC Neighbourhood Committee NHG Neighbourhood Group NP Nagar Palika NPP Nagar Palika Parishad NRY Nehru Rozgar Yojana NSDP National Slum Development Programme O&M Operation and Maintenance PFDF Pooled Finance development Facility PIU Project Implementation Unit PMC Project Management Consultant PMIUPEP Prime Minister’s Integrated Urban Poverty Eradication Programme PMU Project Management Unit PPP Public Private Partnership PPTA Project Preparation for Technical Assistance PRA Participatory Rapid Assessment PSP Private Sector Participation PWD Public Works Department RAP Resettlement Action Plan SADA Special Area Development Authority SDM Sub Divisional Magistrate SFC State Finance Commision SH State Highway SIDCUL State Industrial Development Corporation Limited, Uttarakhand SJSRY Swarna Jyanti Shahari Rojgar Yojna STP Sewage Treatment Plant SUDA State Urban Development Agency SWM Solid Waste Management SWOT Strength, Weakness, Opportunity & Threat

Uttarakhand Urban Development Project
Dehradun City Development Plan Page viii
TA Technical Assistance TCPO Town and Country Planning Organisation T&CP Town and Country Planning Department ToR Terms of Reference TPO Town Planning Officer UBSP Urban Basic Services Programme UADD Urban Administration and Development Department UBSP Urban Basic Services for the Poor UDA Urban Development Authority UFW Unaccounted for Water UJS Uttarakhand Jal Sansthan ULB Urban Local Body UPCL Uttarakhand Power Corporation Ltd. UPE Urban Poverty Eradication UPJN Uttarakhand Pey Jal Nigam URIF Urban Reform Incentive Fund USAID United States Agency for International Development USWEP Urban Self Employment Programme UUDP Uttarakhand Urban Development Project UWEP Urban Wage Employment Programme VAMBAY Valmiki Ambedkar Awas Yojana VRS Voluntary Retirement Scheme WHO World Health Organization

Uttarakhand Urban Development Project
Dehradun City Development Plan Page ix
Executive Summary Dehradun, the interim capital of the newly formed state of Uttarakhand is one of the 3 towns of Uttarakhand listed under the Jawaharlal Nehru National Urban Renewal Mission (JNNURM). The city currently has a population of nearly 5 lakh and requires substantial investment to upgrade, expand and provide new infrastructure to meet the growing demand rapid pace of urbanization and fast rate of population growth. The current rate of decadal growth is nearly 40 percent, which is likely to continue until the population stabilizes at a lower rate of growth. This City Development Plan (CDP) is intended to provide a perspective for development for the next 25 years, keeping in view longer term growth until the year 2036.
Dehradun is at a cross road at the moment. The city, which is home to prestigious national institutions like the Survey of India, Oil & Natural Gas Commission, Forest Research Institute and the like is emerging into a busy, economically active vibrant city serving the state as a whole from its age old image of a residential and institutional centre in the midst of peace, quiet and serene environment. Natural environment is one of the most prized element of this city, being situated in the beautiful Doon valley. The demands and challenges of development and preservation of its rich natural environment require to be met concurrently.
In keeping with the guidelines of the JNNURM for preparation of the CDP, a process of consultation and participation of all stakeholders have been adopted from the initiation until finalization of this CDP. The process started with identifying and sensitizing the stakeholders and continued through preparation of city vision, prioritization of infrastructure provision and preparation of sectoral strategies, concurrently with extensive data collection, analysis of current situation of various elements of urban planning and infrastructure development. Strategies, Interventions and Action Plans were developed in continuous consultation with the stakeholders.
The situation analysis of the various elements brought out key issues. The sectoral key issues that emerged out of Stakeholders consultations and discussions with Dehradun Nagar Nigam and para-statals are:
i) Physical Growth and the Built Environment: There are major issues of
overcrowding and haphazard growth, congestion in core city area, unexplained changes in land uses, lack of developed land for affordable housing and non-conforming land uses in both core city and newly developed areas. Coupled with this, there are unmet needs of community facilities, eg., wholesale and local markets, slaughter houses and a range of such facilities. Degradation of riverside and lack of public open spaces, sports and recreational facilities are leading to an unsustainable situation.
ii) Water Supply: Unequal distribution of water, low pressures, old dilapidated
pipelines, uncontrolled zoning and unsatisfactory operation and maintenance requires thorough reorganization and upgradation of this sector.
iii) Sewerage: Inadequate coverage of area under sewerage system, disposal of
raw sewage into natural water courses has rendered this sector a cause for environmental and health concern; requires immediate intervention and a

Uttarakhand Urban Development Project
Dehradun City Development Plan Page x
careful planning with adoption of appropriate technology to take care of environmental concerns.
iv) Storm Water Drainage: Although the natural topography of the city helps in
gravity drainage, there are pockets of waterlogging; besides, natural drainage courses require rehabilitation, as they are choked with disposed solid waste and encroached upon, particularly by the urban poor.
v) Solid Waste Management: The city has not met its mandatory obligations
under the Solid Waste Management Rules, 2000 and is burdened with an inefficient collection system, lack of environmentally sound disposal site(s) and uncontrolled dumping at a site by a rivulet. It thus requires immediate and sustained effort to upgrade to a full service level.
vi) Roads and Transport: This sector perhaps is the most troubled one with
annual vehicular growth reaching an unprecedented rate of 10 percent, congestion and lack of parking spaces are everyday problems citizens face. The extremely narrow roads in the core city area, inadequate traffic management throughout the city and a general lack of proper road hierarchy requires a sustained effort over a period of time to reorganize the road sector. Public transport, which is in a rudimentary state, also requires large scale investment to support economic activity commensurate with the growth potential.
vii) Urban Poor: The city has about 80 poverty pockets or slums, accommodating
about 1.2 lakh population, registering an increase of nearly 40 percent over 1991 population. Approximately, 7.6 percent of the poor are families below poverty line (BPL). The urban basic services in these pockets vary widely. However, much is needed to improve overall municipal services. The noteworthy point is that residents are willing to pay for services. They are even willing to pay tax. The proposed strategies for poverty reduction may include Community Organization, Income Generation Activities, Community Participation, Housing and Infrastructure Development Projects.
viii) Institution and Governance: Dehradun Nagar Nigam has very few functions
in the municipal domain. Unlike city corporations elsewhere in India, DNN has very limited role to play in the city’s planning, development and infrastructure provision. In fact, solid waste management is the main function of DNN. Conventional municipal functions such as water supply, sewerage, roads, etc. are in the hands of either para-statals or state agencies. In the absence of institutionalization of citizens’ involvement through smaller ward committees and other mechanisms, city management has remained virtually an ‘outsiders’ job and not a participative civic management. Dehradun being the capital city of the State, needs a strong municipal government and this essential requirement needs to be acknowledged at the highest level in state administration. Besides functional devolution in terms of 74th CAA, all-round municipal capacity building and organisational development would be of paramount necessity. Dehradun needs a strong municipal political executive as the key driver of change management.
ix) Municipal Finance of DNN and Finance of Para-statals: DNN, UJS, and
MDDA are the three most important agencies responsible for the urban finance in Dehradun. DNN’s revenue receipts (own) mainly comprises of

Uttarakhand Urban Development Project
Dehradun City Development Plan Page xi
property / house tax, rentals and advertisement. UJS’s revenue receipts are mainly water tax and water charges. MDDA’s revenue receipts mainly arise out of urban assessment, interest and miscellaneous receipts, deposits and loan recoveries while capital receipts comprise of capital loan recoveries and grants from state and central governments. Its revenue expenditure is due to establishment, operation and maintenance (O&M), interest and debt servicing as also due to refund of deposits. Its capital expenditure comprise of land acquisition, development works, construction as also grants to DNN and Panchayats and acquisition of other assets. Efforts are under way for converting the accounting system into accrual based double entry accounting system of accounting. There is a need to provide suitable training on double-entry accounting/accrual system of accounting. The arrears (accounts receivable) need to be reduced by streamlining the collection machinery. There is lack of financial and taxation powers. Under the present financial status it is very difficult for DNN to access funds from market. There is considerable room for review and revision of the current tax rates. The data base and information management is poor and there is a lack of use of technology in infrastructure monitoring.
Identification of Projects and City Investment Plan (CIP) : Based on situation analysis, strategy to achieve vision and continued consultations, projects have been identified, and costs estimated. The city needs a total investment of of Rs. 6,580.4 crores in two phases as listed below. This investment phasing until 2025 will be further detailed for each sector at the DPR stage. The sector-wise summary of the Capital Investment Plan is given below
S. No. Sector1 Phase 1 2006-13
Phase 2 2014-25
Total (Rs.Crores)
1. Water Supply 128.50 1269.70 1,398.20
2. Sewerage and Sanitation 319.65 41.20 360.85
3. Solid Waste Management 33.35 26.79 60.14
4. Roads and Transport 2,165.00 1,501.90 3,666.90
5. Street Lights 7.60 7.60
6. Storm Water Drainage 94.36 16.12 110.48
7. Urban Poor / Slums 49.94 12.37 62.31
8. Urban Renewal, Heritage and Preservation of Water Bodies
433.68 480.28 913.96
Total 3232.08 3348.36 6,580.44
Note: Above costs are at current 2006 prices and include 7.5% physical contingency and 5% project management assistance.
The GoU is in negotiation with ADB and it is anticipated that ADB funds could be leveraged for Haridwar and other urban centers in Uttarakhand. The application of JNNURM funds to the city’s investment proposals contained within this CDP and associated CIP will be appropriately adjusted during preparation of DPRs in sub-sectors where application of ADB funds will be involved.
1 Sectors are summarised below according to sector priorities.

Uttarakhand Urban Development Project
Dehradun City Development Plan Page xii
Mandatory and Optional Reforms
JNNURM guidelines provide for mandatory and optional reforms at the State and DNN/Para Statal levels in the areas of Institution and finance. Steps have been initiated for implementation of some of the mandatory reforms like introduction of e-governance, introduction of double entry accounting system, property tax reform to achieve 85% efficiency within 7 years, user charges to recover O&M cost, budget earmarking for basic services to the poor, basic services to the poor and security of tenure at affordable prices and computerisation including software development.
Mandatory reforms at State level like decentralisation of powers, repealing of urban land ceiling and regulation act, reform of rent control lawas, rationalisation of stamp duty to bring down to 5%, enactment of public disclosure law and community participation law and city planning function to be assigned to urban local bodies are under active consideration.

Uttarakhand Urban Development Project
Dehradun City Development Plan Page 1
1. Introduction and Background 1.1 Background of JNNURM
Urban population constitutes nearly 28 percent of India’s total population (2001 census). More importantly, during the last five decades, the urban population has grown five times, while the total population has grown three times2. The population living in slums has also grown rapidly, posing a challenge to the urban basic services. Faced with this phenomenal growth, it became imperative for the Government of India to draw up an integrated and coherent national strategy to develop selected cities on a mission mode. The Jawaharlal Nehru National Urban Renewal Mission (JNNURM) is a “reforms driven, fast track, planned development of identified cities with focus on efficiency in urban infrastructure/services delivery mechanism, community participation and accountability of Urban Local Bodies (ULBs)/para-statals towards citizens”.
Considering the magnitude of investment and contents, the JNNURM will have significant impact on cities and city planning system. With the launch of JNNURM, urban development has acquired a renewed focus. JNNURM aims at providing incentives to cities to undertake institutional, structural and fiscal reforms, necessary to improve service delivery systems that are sustainable, enhance local economic performance and bring about transparency and accountability in the functioning of municipal governments. The mission cities are required to prepare a City Development Plan (CDP) for accessing the funds under the scheme.
Of the 63 towns identified and targeted under JNNURM, Dehradun is one of the three towns in Uttarakhand under “selected cities /UAs” (state capitals and other cities). Haridwar and Nainital have been identified as towns of religious/historic and tourist importance. All three towns have less than 1 million population.
The CDP is intended to provide an action plan towards creating economically productive, efficient, equitable and responsive cities. Following are the basic steps in preparation of a CDP:
• In-depth Analysis of Existing Situation
• Development of a Vision of the City
• Formulation of City Development Strategies including city governance and required reforms
• Preparation of Action Plan with identified projects under each sector of infrastructure
• Preparation of City Investment Plan
1.2 Objective of CDP
The objective of the CDP is to provide a perspective and a pathway of future development of a city/town over the next 25 years. It presents a clear view of where are we to-day, arising out of analysis of current situation. It strives to put
2 Guidelines for Projects of Jawaharlal Nehru National Urban Renewal Mission, December 2005

Uttarakhand Urban Development Project
Dehradun City Development Plan Page 2
together collective vision of the citizens and other stakeholders where do we wish to go. Finally, it also provides roadmap of strategies, alternatives and action plans of how we achieve the vision of the city and how we manage the city ourselves. In essence, it provides options and choices as exercised by stakeholders, not the city as an urban space by default. Clearly, a CDP is a blue-print of an informed exercise, owned by the citizens and the city government, i.e., the ULB.
1.3 Process of CDP Preparation
CDP Dehradun has been prepared through four steps forming the process of preparation. In the first step, consultants’ team members gathered data and information from various sources, made field visits, carried out detailed discussions with the officials concerned followed by an analysis of the current situation. Data gaps were identified and these were filled by generating primary data and utilising such primary data collated and analysed further. For this purpose, a detailed socio-economic survey with purposive stratified random sampling of 1160 households was carried out and the results analysed. The whole exercise enabled the consultants to identify both present shortcomings and likely interventions needed over the next 25 years or the planning/design period.
In the next step, it was desired to sensitize the stakeholders, appraise them about the CDP process and impress upon the need for their participation towards forming the city vision and sector visions. This was done by holding a workshop with the municipal ward councillors, elected representatives and officials in charge of various departments looking after relevant components of infrastructure in Dehradun. During this workshop, two things came up clearly – (i) the present needs of Dehradun city in terms of infrastructure and (ii) a broad consensus regarding priorities of interventions in various sectors including infrastructure and urban management.
Before holding the next workshop to elicit citizen’s vision, documentations were prepared (i) about JNNURM, (ii) city vision, (iii) evaluation / performance of infrastructure and (iv) sectoral visions and priorities of intervention. Stakeholders were identified as:
• Primary stakeholders (e.g., residents, interest groups, CBOs and NGOs)
• Secondary stakeholders (service providers – e.g., UPJN, UJS, PWD,
Stakeholder Consultation: Calendar of Events
• 15th June- 15th July: Socio- economic Survey - Field Group Discussions with Urban Poor – Verification of Slums
• 21st June, 2006: First Workshop with Nagar Nigam Councillors, CBO’s and NGO’s, Elected Representatives, Senior Officers of Nagar Nigam and Infrastructure Departments e.g. PWD, UJS, UPJN etc. Chaired by the Minister, Urban Development
• 28th June: Second Workshop with Primary Stakeholders, Secondary Stakeholders and Tertiary Stakeholders to formulate and agree on a City Vision chaired by the Mayor Dehradun Nagar Nigam
• 28th June: Group Discussions and Consultation with Working Groups – (a) Urban Planning and Land Management, (b) Water and Sanitation, (c) Roads and Transport, (d) Solid Waste Management, (e) Basic , (f) Urban Services to the Poor, (g) Governance and Finance
• Series of Consultation with Nagar Nigam, SUDA, UPJN, PWD, UJS, Irrigation Department and such other organisations (Mid May till Mid July)
• 20th July: Discussion on Identified Projects for CDP with all Secondary Stakeholders, chaired by the Minister, Urban Development
Uttarakhand Urban Development Project
Dehradun City Development Plan Page 3
UPPCL officers at District/Division level etc.)
• Tertiary Stakeholders (Policy providers – Secretaries of concerned department(s), M.D. of UPJN, CGM of UJS etc. at state level)
The workshop was held with the Mayor in the chair. After brief introduction by the Minister of Urban Development and the Mayor, Citizens were requested to write their vision about the city of future. Later, they were asked to present their views in the open house for discussion. At the end of the workshop, the vision statement was adopted collectively. During the proceedings, a number of citizens showed keen interest in certain sectors. They were invited to participate in the subsequent sector vision workshop. In the sector vision workshop, six sub-groups met in roundtables for a Focus Group Discussions. The sub-groups were:
• Institutional and Finance
• Solid Waste Management and Environment
• Roads, Traffic and Transport
• Water, Sewerage and Sanitation
• Urban Planning, Tourism and Industries
• Urban Poor and Slum Development
Each sub-group comprised citizens, representatives of CBOs/NGOs, officials of para-statal bodies (e.g., for Roads and Transportation group, representatives from PWD, Police (traffic), Nagar Nigam etc.) and Consultants’ subject experts. After discussions on the sector vision over the next 25 years, interventions were discussed, identified and consensus was reached in prioritising them.
Based on the activities of steps 1, 2 and 3, sub-projects were developed and cost estimates prepared. These were again discussed at length over a period of time with Nagar Nigam officials and officials of concerned para-statal bodies. The consolidated list of projects was presented in a meeting held with the State Steering Committee (chaired by the Minister of Urban Development), and their views obtained before the final list of identified project with estimated costs was drawn up.
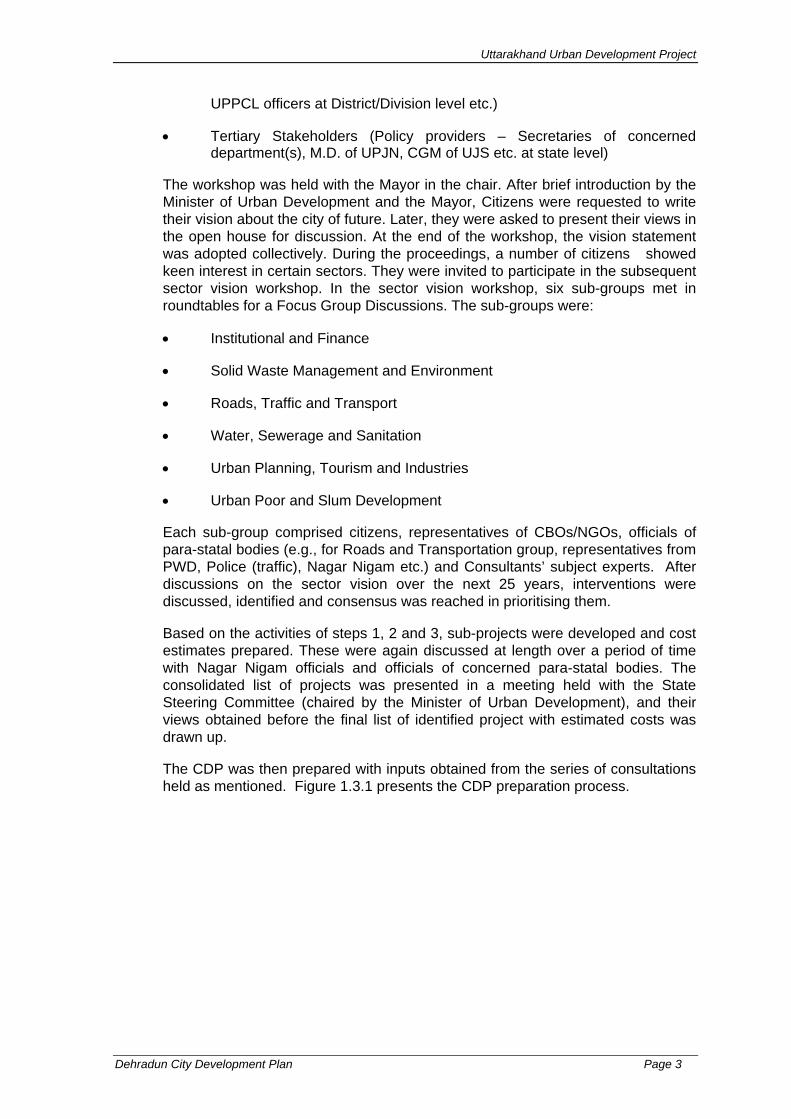
The CDP was then prepared with inputs obtained from the series of consultations held as mentioned. Figure 1.3.1 presents the CDP preparation process.
Uttarakhand Urban Development Project
Dehradun City Development Plan Page 4
Figure 1.3.1: Process of CDP Preparation
Rapid Assessment of Existing Situation
Presentation and Discussion on Inception
Report
In-depth Situational Analysis including Socio-
economic Surveys Key Issues, Unmet Demand and Future
Requirements
Discussions with Stakeholders on
Identified projects and Field Visits
Stakeholders Consultations 1st
GoU initiative to introduce JNNURM to ULBs and other Stakeholders
Identification and Selection of Projects
and Sub Projects
Cost Estimation of Identified Projects
Formulation of City Vision and Sector
Strategies
Preparation of City Investment Plan
INCEPTION REPORT
CITY DEVELOPMENT PLAN
Presentation on Identified Projects with
Stakeholders
Discussions with ULBs and Concerned Departments
Field Visits
Stakeholders Consultations 2nd
Session 1 - To discuss Key Issues/Findings and Develop City Vision
Session 2 - Sectoral Vision and Goals

Uttarakhand Urban Development Project
Dehradun City Development Plan Page 5
2. City Profile 2.1 About Dehradun
Dehradun is the administrative centre and the interim capital of the new state of Uttarakhand. Dehradun is situated at the Himalayan foothills in the fertile Doon Valley. The valley is well known for its salubrious climate and natural beauty. It is due to this reason Dehradun has been one of the favourite residential cities.
Dehradun is also one of the most beautiful resort centres in India, it is well known for its scenic natural beauty, beautiful forests, waterfalls and surroundings. It is also an important educational centre of the country. India's some of the best public schools and convents are located here. The Indian Military Academy, Forest Research Institute, ONGC and many more offices of Central and State Govt are located here.
Dehradun is well linked with rail, road and air routes to all the parts of the state and the country. Main languages spoken in the district are Hindi, Garhwali Sindhi, Punjabi, and Urdu.
2.2 Topography and Natural Resources
The Doon Valley has the Himalayas to its north, the Shivalik range to its south, the sacred river Ganga to its east and the river Yamuna to its west. The city of Dehradun is surrounded by river Song on the east, river Tons on the west, Himalaya ranges on the north and Sal forests in the south.
The Doon Valley is situated between the two most important rivers of India. i.e. Ganga and Yamuna, located in a picturesque setting. Dehradun is surrounded by dense forest all around and number of streams and canals dissect the city in the north-south direction. The high hills in the east and north and Sivaliks in the south give an interesting topographical setting to the city. All the hill ranges around Dehradun (except the Sivaliks) are rich in lime stone reserves. Nestled in a wide and thickly forested valley of the Sivalik ranges, Dehradun is famous for its fruit orchards such as leechis and mangoes. Forest products play an important role in the economy of the Dehradun district.
2.3 Historical Background
The name Dehradun is a combination of two words "Dehra" which means Camp and "Dun" which means valley. Its history goes back to the 17th century. It was annexed by the British in 1815 and had been one of their favourite places due to its location and climate.

Uttarakhand Urban Development Project
Dehradun City Development Plan Page 6
Historical Perspective During the 17th century the Sikh Guru Ram Rai, who belongs to the sect of Udasi
Fakirs, took up his residence in the Dun. During the 18th century the city was invaded frequently by Sikhs and Gujjars. From 1803 to 1814 it was under the occupation of the Gorkhas. In April 1815, Gorkhas were ousted from Garhwal region and Garhwal was annexed by
the British. In that year the area now comprising tehsil Dehra Dun was added to district Saharanpur.
During 1822 to 1828, new roads were developed and improvements were done to other works of public utility. The hill stations of Mussoorie and Landour which have been established in 1827-1829 now began to have a most beneficial effect upon the prosperity and development of the city.
In 1825, however, it was transferred to the Kumaon Division. In 1828, Dehra Dun and Jaunsar Bhabar were placed under the charge of a separate
Deputy Commissioner In 1829, the Dehra Dun district was transferred from the Kumaon Division to the
Meerut Division. In 1842, Dun was attached to Saharanpur district and placed under an officer
subordinate to the Collector of the district but since 1871 it is being administered as separate district.
In 1878, training college was set up for forest rangers at national level. In 1884, the Central Government took its possession and named it as “Imperial Forest School”.
In 1968 the district was taken out from Meerut division and included in the Garhwal Division.
During the Rai days, the town became a major academic and research centre and a base for the Indian Military Academy and the Survey of India. There are also several prestigious boarding schools including the Doon School, India's one of the most exclusive private school.
The growth and development of the city was further accelerated with the establishments of two military cantonments in 1872 and 1908. The development of the tea industry and the extended operations of the forest department, the growth of Dehra as a cantonment and as a retreat for well-to-do pensioners, the establishment of Chakrata, the increasing population of Mussoorie and Landour and the opening up of the railway in 1900 have all contributed towards the great advancement in material prosperity and development of Dehradun. During the post independence period, the city has registered an unprecedented growth in its population as well as area. Establishments of large scale industries e.g. Amitabh Textile Mills ltd in 1960, Miniature Bulb industries of India in 1958, Bengal Immunity in 1969, Doon Valley Combers in 1962, Indian Woollen Textile Mills in 1966, Raj Narain Flour Mills in 1964 and a number of other small scale industries and banks have greatly triggered the growth of the city. Till 1960, there has been no effort to channelise the haphazard growth of the city. For planning, regulation and control of developmental activities, Dehradun Regulated Area was declared in 1963 under the provision of UP Regulation of Building Operations Act, 1958.
2.4 Climate
Dehradun is situated at an altitude of 2,200 feet above sea level. Dehradun enjoys a salubrious climate due to its location in the hilly part of the state. During the summer months, the temperature ranges between 36°C and 16.7° C. The winter months are colder with the maximum and minimum temperatures touching 23.4°C and 5.2° C respectively. Dehradun experiences heavy to moderate showers during late June to mid-August. Most of the annual rainfall of about 2000mm in the

Uttarakhand Urban Development Project
Dehradun City Development Plan Page 7
district is received during the months from June to September, July and August being the rainiest months in the season.
2.5 City and its Surroundings
Nestled in Doon Valley, Dehradun has several attractions, many of which are academic institutions and research centres of national importance.
2.5.1 Institutional Attractions
Many institutions of national importance like the Forest Research Institute; Oil and Natural Gas Commission; Indian Military Academy; Indian Institute of Petroleum, Indian Institute of Remote Sensing, Zoological Survey of India, Wadia Institute of Himalyan Geology and Survey of India, National Institute of Visually Handicapped etc are located in Dehradun.
2.5.2 Tourist Attractions
Dehradun, the headquarters of the district is visited by a large number of tourist every year, many of them en-route to Mussoorie. There are a number of places worth-seeing in Dehradun and its surroundings in terms of their tourism attractions such as Gurudwara temple, Sahastradhara, Robbers Cave, Dakpatthar, Tapkeshwari Mahadeo temple, Malsi Deer Park, Raipur spring, etc.
Jhanda Fair is held every year at the historic Guru Ram Rai Darbar in Dehradun City in memory of the Guru.
Kalsi is an archaeological site situated close to River Yamuna on the way from Dehradun to the hill station of Chakrata.
Rajaji National Park is situated at the edge of the sprawling Dehradun valley, was founded in 1966 and spreads over an area of about 820 sq. km. Nestled in a lush valley of the Sivalik Range, the park is an ideal holiday resort with its many picnic spots and excursion sites for the nature lover. Rajaji National Park is one of the most famous national parks of India.
2.6 Linkages and Connectivity
Dehradun is well connected by road to New Delhi and other major towns in north India. Road distances to some important centres in the region are: Delhi 255 km; Chandigarh 130 km; Haridwar 54 km; Mussoorie 34 km; Rishikesh 43 km; Agra 382 km; Shimla 221 km; Yamunotri 279 km; Kedarnath 270 km; Nainital 297 km. The city is well connected by daily direct trains coming in from Delhi, Calcutta, Mumbai, Varanasi, Lucknow and other places. The nearest airport from Dehradun is the Jolly Grant Airport situated on the outskirts of the town, around 25 km away from the city.

Uttarakhand Urban Development Project
Dehradun City Development Plan Page 8
3. Situational Analysis – Problems and Opportunities 3.1 Socio-economic Profile
3.1.1 Demographic Profile
In order to study the socio-economic profile of the city, secondary data (from various sources, including the Census of India) were collected and analysed. To supplement the analysed secondary data, primary data were obtained from the socio-economic survey analysed and the results utilised. The following sections present an overall socio-economic profile of Dehradun.
Population and Population Growth
In 1981 and 1991 decades, the decadal change in population of Dehradun was 21.33% and 21.85% respectively. The sudden jump to 39.73 % in the next decade is explained by the fact that in this decade Uttarakhand was made a separate State with Dehradun as its capital. In the decade 1991-01, Dehradun achieved decadal population growth rate of 39.73 %, which was considerably higher than the national average of 21.53 %3 .
Table 3.1.1: Dehradun Population and Decadal Growth Rate
Year Population (‘000 persons) Decadal Growth Rate (%)
1971 166 1981 211 21.53 1991 270 21.85 2001 448 39.73
Dehradun population growth rate considerably increased in decade 1991-2001 due to its becoming the capital of the newly created state of Uttarakhand. The possibility of its maintaining a relatively high growth rate of population is high due firstly to State’s initiative to achieve higher rate of growth of the economy of the State per se and for expansion of the industrial base of Dehradun among some other areas. Besides, the impact of factors like large investments in industries which are expected to be made in the coming years; the planned infrastructure and institutional improvement with financial assistance of the ADB; and the proposed overall development of the town under the Jawaharlal Nehru National Urban Renewal Mission will widen employment opportunities both in secondary and tertiary sectors. These factors together will lead to the already relatively higher growth rate of service sector to attain a still faster growth rate in the decades to come. As this happens, population will attain much faster rate of growth due to large in-migration of workers to this town besides the natural growth of population. As Dehradun started with a low population base of 4.48 lakhs only (2001) its population growth rate in terms of percentage is expected to be faster in the coming decades as a result of its economic factors mentioned above.
On the basis of this understanding, it is assumed that the population of Dehradun will grow at the rate of 4 % per annum for 5 years following 2009, 3.5 % from 2010 to 2014, and 3.0 % from 2015 to 2019. As the base (population) expands, the rate
3 Directorate of Economics and Statistics, Government of Uttarakhand, Statistical Diary, Uttarakhand,2004-05, page 9, Table 1
Uttarakhand Urban Development Project
Dehradun City Development Plan Page 9
of growth in terms of percentage will gradually slow down although in absolute numbers population will keep increasing. It is presumed that population growth rate will stabilize at 2.5 to 2.0 % per annum for the next few decades. Annex 3.1.1 provides year-wise projected population over the next thirty years.
The number of daily commuters to the town is believed to be quite high but no estimate of it is available. In the absence of any other basis, the commuter population has been taken as 5% of the permanent population.
Social Composition Age Sex Structure of Population
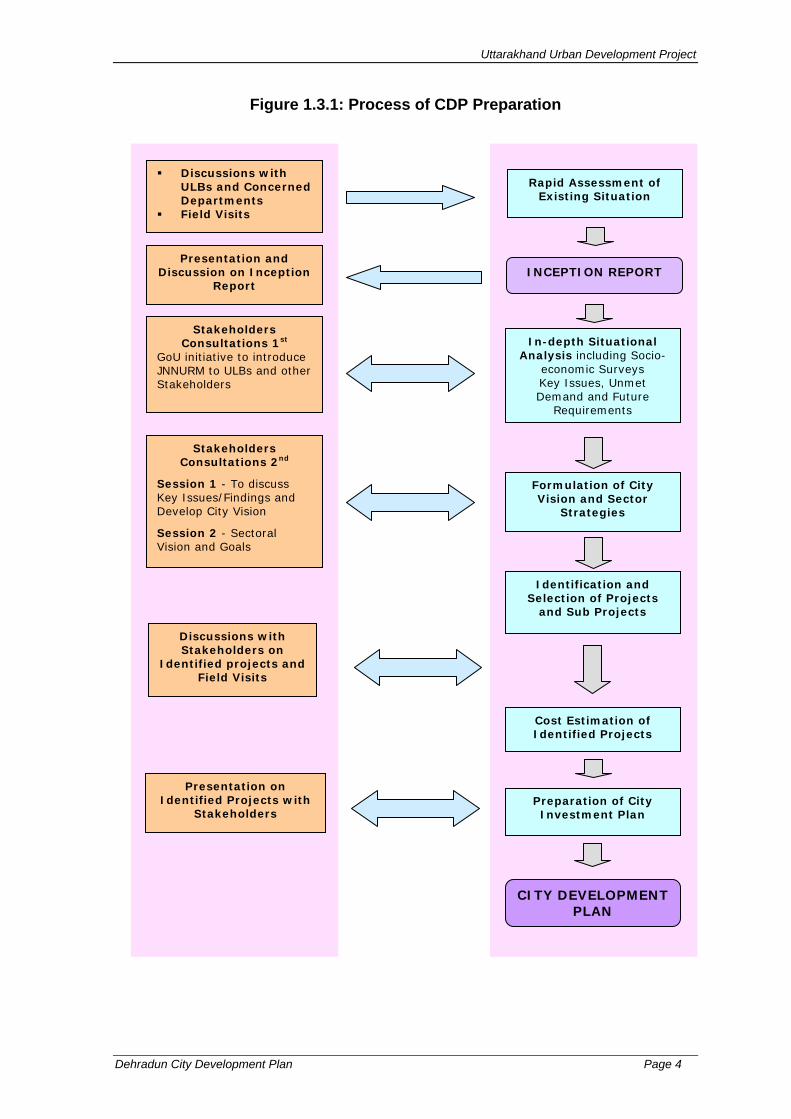
The overall sex ratio in the sampled households is 850, which is a bit lower than that reported (900) in Census of India 2001. The age group of 15-44 have highest population for both the sexes.
Table 3.1.2: Age-Sex Distribution and Sex Ratio
Age Group Male Female All
Sex Ratio
All 54.1 45.9 100.0 0-4 3.4 3.0 3.2 5-9 6.4 5.2 5.8
10-14 8.7 8.9 8.8 15-44 54.9 59.3 56.9 45-59 16.5 15.3 15.9 60+ 10.2 8.3 9.3
850
Literacy
Literacy is an important indicator of social development; it has its effects on demographic characteristics and participation in labour force. As per Census of India 2001 literacy rate in urban Dehradun is 90.3 for males and 81.1 for females. The survey results show there are 97.9 percent literate males and 95.2 percent females. Overall literacy is 96.7 percent.
Table 3.1.3: Literacy Status of Population Age 7 Years and Above
Male Female Total Town
Illiterate Literate Illiterate Literate Illiterate Literate
Dehradun 2.1 97.9 4.8 95.2 3.3 96.7
Occupation
Data on occupation shows that 28 % are in service, 11.6 % are self employed, 29.8 % are students, 25.4 % are housewives, 0.1 % are farmer, and 4.2 % are retired. Only 0.9 % is unemployed.
Table 3.1.4: Occupation by Age
Age Group (in years)*
Category <18 18-24 25-44 45-59 60+ Total
Service 1.4 12.8 32.7 37.3 18.7 28 Self Employed 0.3 8 17 15.9 11.2 11.6
0.0
20.0
40.0
60.0
80.0
0-4 5-9 10-14 15-44 45-59 59+
Age Group
Male
Female

Uttarakhand Urban Development Project
Dehradun City Development Plan Page 10
Age Group (in years)*
Category <18 18-24 25-44 45-59 60+ Total
Unemployed 0.5 2.3 0.9 0.2 0.9 0.9 Farmer 0.1 0.2 0.1 Student 97.1 56.3 3.2 29.8 Housewife 0.6 13.1 38.3 35.0 31.7 25.4 Retired 0.1 0.2 5.5 33.3 4.2 Total 100 100 100 100 100 100 * Percentage of Population
Income and Expenditure
More than 50 percent of population is in medium income groups, 8 percent of the sampled population is below poverty line. Mean per capita income of the families is Rs.2372 and mean household income is Rs.10461. There is a considerable proportion of population in the middle expenditure and savings groups.
Table 3.1.5: Income Expenditure and Savings
Income In Rs. Households (%)
Per Capita Income Below Poverty Line (BPL) Upto 562 7.6 Poor 563-1999 46.8 Lower-Middle 2000-3499 28.0 Upper-Middle 3500-5999 11.6 High 6000+ 6.0
Mean Income Rs.2372.4 Upto 2999 14.9 3000-5999 26.7 6000-9999 26.4
10000-14999 15.8 15000+ 16.2
Mean Income Rs.10460.6
Upto 2999 18.8 3000-5999 32.6 6000-9999 28.4
Household Income
10000-14999 10.5
Income and Expenditure Pattern
05
101520253035
Upto 2999 3000-5999
6000-9999
10000-14999
15000+
Income Group
Perc
ent Income
Expenditure
Savings

Uttarakhand Urban Development Project
Dehradun City Development Plan Page 11
Income In Rs. Households (%)
15000+ 9.6 Mean Expenses Rs.7943.4
In Rs. Upto 2999 8.6 3000-5999 22.7 6000-9999 30.6
10000-14999 16.5 15000+ 21.6
Household Savings Mean Saving Rs.4405.8
Table 3.1.6 shows the distribution of population by household composition and possession. Majority have freehold title of their land and having their own pucca house with electricity. On an average 18 percent of all the families in the slums stays with some other family. Even in the higher income groups ownership of land is lacking. Access to electric supply increases with higher income. More than 90 percent of the households have legal electric connection even in the BPL group.
Eighty percent of the BPL households use gas as fuel for making food. This increases with higher income. Except high income groups all others use kerosene as fuel; wood is mainly used by the BPL families (13.3%). Some of poor and lower-middle group also use wood for this purpose.
It is evident from Table 3.1.7 that willingness to improve house reduces with higher income. As the higher income groups already have good houses, they don’t have the wish to improving it further, while 74.4 percent BPL families and more than 50 percent of poor and lower-middle families are willing to spend for improving their houses.
Table 3.1.6: Distribution of Population by Household Composition and Possession
Income Group Characteristics of Households (%)
Below Poverty Level
Poor Lower-Middle
Upper-Middle
High
Land Ownership Freehold title 72.2 67 61.1 67.4 47.9 Lease 1.1 3.2 3 1.4 11.3 Patta 0 0.4 0 0 0 Joint patta(%) 0 0 0.3 0.7 0 Other legal right 23.3 28.5 34.3 30.4 39.4 No legal right 3.3 0.9 1.2 0 1.4 House Ownership Own 91.1 95.3 96.4 97.1 91.5 Rented 8.9 4.7 3.6 2.9 8.5 Mean rent per month (in Rs.) 387.6 1321.7 1093.9 1575.3 4083.3 House Type Kutcha 6.7 4.3 0.9 1.4 0 Semi-pucca 35.6 17.7 5.1 4.3 0 Pucca 057.8 78 94 94.2 100 Access to Electricity

Uttarakhand Urban Development Project
Dehradun City Development Plan Page 12
Income Group Characteristics of Households (%)
Below Poverty Level
Poor Lower-Middle
Upper-Middle
High
Yes 93.3 97.5 99.4 99.3 100 No 6.7 2.5 0.6 0.7 0 Electric Meter Yes 98.8 100 99.4 100 100 No 1.2 0 0.6 0 0 Fuel Used Gas 80 94.2 99.1 98.6 100 Kerosene 13.3 8.1 2.1 1.4 0 Wood 10 4.9 0.6 0 0 Other 1.1 0 0 0 0
Table 3.1.7: Willingness to Improve House
Income Group Willingness (household in %) BPL Poor Lower-Middle Upper-Middle High
Willing 74.4 57.3 55.1 42 28.2
Unwilling 25.6 42.7 44.9 58 71.8
Migration
It was found that almost all the sampled families are residing in the city for more than 20 years; only the higher income groups are residing for about 14 years. While tracing the migration pattern within last 5 years it was found that majority (79.5 percent) of the sampled families are in the city for more than that period. Even more than 80 percent the BPL and poor families are residing in the city for more than 5 years (Table 3.1.8). Of all the households 2.8 percent moved from another part of the city, 1.3 percent migrated from another city and 0.4 percent came from rural area. This contradicts the notion that poor settlements are created by in-migration from rural areas. This also negates the assumption that after being designated as new State capital Dehradun receives a large inflow of in-migrants, especially the poor population.
Willingness to Spend for Improving
House
020406080
BPL
Poor
Lo wer
-
Upp
er-
Middle
High
Income Group
Perc
ent
Willing
Migration Pattern
0
1
2
3
4
5
6
7
8
9
BPL Lower-Middle
High
I nc om e Gr oup
From anot her part oft he cit y
From anot her cit y
From a rural area

Uttarakhand Urban Development Project
Dehradun City Development Plan Page 13
Table 3.1.8: Migration
Income Groups Migration*
All BPL Poor Lower-Middle
Upper-Middle High
All moved in last 5 years 718 38 325 217 89 49 From another part of the city (%) 2.8 5.3 0.6 3.7 4.5 8.2 From another city (%) 1.3 0 1.2 0 2.2 6.1 From a rural area (%) 0.4 0 0.3 0.5 1.1 0 Not Applicable (%) 79.5 84.2 83.1 78.3 74.2 67.3 Not specified (%) 16 10.5 14.8 17.5 18 18.4
*Data show household in %
3.1.2 Urban Poverty Profile
Poverty and Vulnerability
Under JNNURM only provision of basic services and infrastructure development are permissible- the focus is on alleviation of non-income poverty. It is, however, necessary to examine poverty with reference to its various dimensions including asset ownership; and program packages need to be worked out to reduce urban poverty especially the vulnerability of the poor and to enhance their assets in terms of- labour, human capital, housing, social capital and so on.
The Situation as Found in Slums of Dehradun
This section presents an overview of the urban poverty in city of Dehradun. In the absence of any recent studies, sufficient secondary data on the extent of poverty levels in the city are not available. There is a report of Government of Uttarakhand which is based on study of only 7 slums in the State. According to information available from the Dehradun Nagar Nigam (DNN) and the State Urban Development Agency (SUDA) the city has 79 slums4 scattered across the city (Annex 3.1.2). However according to DNN, there are more slums including those which are unregistered, bringing the total to 103.
4 A slum is a compact settlement with collection of poorly build tenement mostly of temporary nature, crowded together usually with inadequate sanitary and drinking water facilities in unhygienic conditions (GoU 2002).
JNNURM and Urban poverty As stated in JNNURM guideline “The ever increasing number of slum dwellers causes tremendous pressure on urban basic services and infrastructure. In order to cope with massive problems that have emerged as a result of rapid urban growth, it has become imperative to draw up a coherent urbanization policy/strategy to implement projects.” The objectives of the Mission are stated below:
Focused attention to integrated development of Basic Services to the Urban Poor in the cities covered under the Mission.
Provision of Basic Services to Urban Poor including security of tenure at affordable prices, improved housing, water supply, sanitation and ensuring delivery through convergence of other already existing universal services of the Government for education, health and social security. Care will be taken to see that the urban poor are provided housing near their place of occupation.
Secure effective linkages between asset creation and asset management so that the Basic Services to the Urban Poor created in the cities, are not only maintained efficiently but also become self-sustaining over time.
Ensure adequate investment of funds to fulfill deficiencies in the Basic Services to the Urban Poor.
Scale up delivery of civic amenities and provision of utilities with emphasis on universal access to urban poor.
Keeping these in view, an effort has been made to promote an integrated slum development project to improve living condition and general quality of life of the urban poor, which in turn will improve the quality of life of the city as a whole. Against this background, it has been planned to analyse the urban poverty situation and formulate appropriate strategies to deal with the existing problem situation and promote sustainable development.

Uttarakhand Urban Development Project
Dehradun City Development Plan Page 14
In order to obtain first hand information, visits were made to 106 slums (103 listed by DNN and 3 more found in the city). In the absence of adequate secondary data, an effort was made to assess the prevailing situation through: • Focus group discussions • Observations • Socio-economic sample survey. Description of the methodology used for the
socio-economic survey is presented in the Annex 3.1.3. The results of the survey are presented in the next section. Questionnaire of survey format is provided in Annex 3.1.4.
It was found that some slums got upgraded and have come out of slum status. The appraised list of slums in DNN area was obtained from SUDA, which showed 79 slums. All these slums are authorised by the DNN. The survey team had finally analysed situation in 69 slums as it was apparent from the spot analysis that 10 slums of the later list also been already upgraded.
Household Profile
As per the appraised slum list form SUDA there are about 16,917 households in slums with a population of 120,850; average household size being 7.1. It has been observed that the poverty pockets in the town are usually along river or drain (Map 3.1.1). Unlike the slums in other states, in terms of housing and environmental sanitation, most of the slums of Dehradun are much better placed. But those, in many places, are having unauthorised construction. The slums on encroached land along river bank or nallahs are generally worse in comparison to other slums. Of the below poverty line (BPL) population 3.3 percent households and 0.9 percent of the poor do not have any legal rights of the land. It was evident also from the FGDs that tenure insecurity exists in many settlements. In the absence of ownership of land and clear policy to address their problems, the poor suffer from many inadequacies in terms of access to basic services and infrastructure; in addition socio-economic plights add to their misery. The situation as observed in the slums is depicted below and the detail situation analysis is presented in the Section 3.1.3.
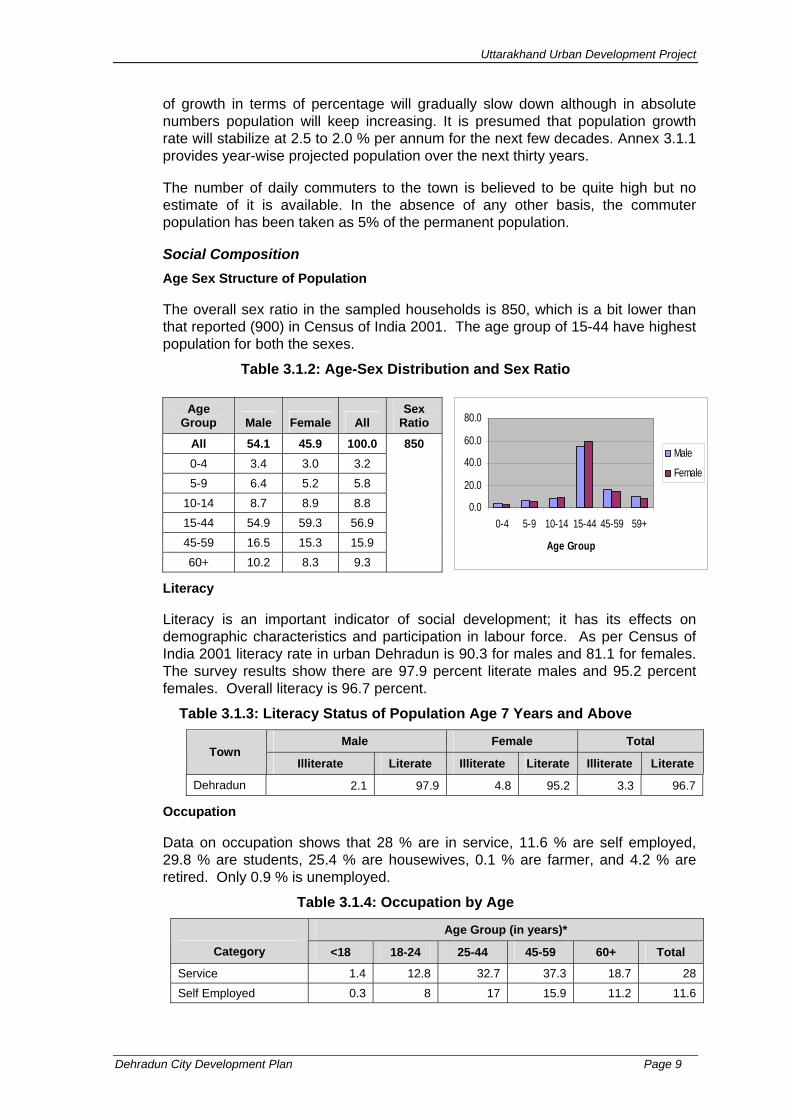
Water Supply
Water problem exists in many slums; water supply is very irregular in some. Duration of supply is mostly 1-2 hrs each in morning and evening in a day, sometimes water is not supplied for 2-3 days; so people are not satisfied. In low zone areas the residents get water supply through out the day except during 11.30 am to 3.00 pm. In some slums there is no supply in the morning; it is available during 7.30-9.30 pm. As there is low pressure at peripheries, many families have fixed booster pumps for drawing water. Water quality is good but not clean in some slums. In some taps muddy water flows, residents in some slums complained about bad smell of the water; some complained that sometimes worm was present in the collected water. In one slum on the slope the residents fetch water from tap for which they need to climb up; they store water in household tanks. There is no stand post or hand pump in many areas and the existing ones are in bad shape. Stand posts are mostly without platform and post and often without bibcock. There is usually a long gap between breakdown and repair of hand pumps. Sometime residents contribute and get it repaired privately. People queue up for collecting water and there is frequent quarrel during that time. As approach road is narrow is some slums, no rigging machine can be

Uttarakhand Urban Development Project
Dehradun City Development Plan Page 15
taken in for installing other hand pumps in the locality. There is no water meter in houses; costing is done half yearly or on annual basis.
Sanitation and Sewerage
Most of the slum residents have their own latrine in their houses and they use septic tank or soak pit. A few families do not have latrine at home they go for open defecation to the river bed or jungle. In Pandit Colony slum there are three landlords; one of them has constructed one latrine with three seats, which opens in the existing sewer line. Some people use that and rest go for open defecation. In some other slums, e.g. at Idgah, residents pay Rs.30 for using community latrine and irregular users pay Rs.3 per day or per use.
Sewer line is absent in many areas, people have soak pit with their latrines. Some of the latrines open in the river. At places sewer is blocked. Urgent requirement of sewers exists in several areas.
Solid Waste Management
Sweeping and SWM is done by municipality but it is very irregular and overall management is poor. SW situation is gloomy in many poverty pockets; there is no arrangement for solid waste collection. The residents, therefore, dump waste openly on street or in river or in drain or down the hill slope. Many have appointed private sweepers for cleaning and pay them monthly, or waste disposal is done by self. The drains and streets in slums are either rarely cleaned or never cleaned at all. Private sanitary workers collect Rs.30 from each house for collecting waste. Residents feel that waste bins need to be placed in the localities.
Storm Water Drainage
Drains are mostly absent. Water logging is frequent during rains; this stagnant water even enters houses in some localities as in Chander Road Nayee Basti. In some slums drains are broken and in many localities those are clogged as they are not cleaned regularly. Street side drains are not continuous and broken at some places. The drains and streets are never or very rarely cleaned. The residents of some slums complain that people from surrounding buildings dump garbage in this drain. According to the residents of slums those are along the rivers there is flooding problem during rains.
It was observed in a locality on Mata Mandir Marg that quite a few houses on one side are having their ground floor below the road level. In a discussion with a resident of the locality it was found that the road is very new, only a few months old. Earlier there was a canal along the side of the road on the same side. During rains that used to overflow and flood all the low lying areas including the houses. Once the flooding was so much that when a resident opened the back door water gushed to Suman Nagar and flooded the slum.
Approach Road and Street Lighting
In some slums approach road is not paved and very narrow. Other colonies have proper approach road. Streets are in bad condition in the slums and street lights are less in number and many are not well maintained. Light bulbs are non-functional often.

D
D
D
DD
D
D
D
^
!(
!(!(
!(
!(!(!(
!( !(
!(
!(
!(
!(
!(
!(
!(
!(
!(
!(
!(
!(
!(
!(
!(
!(
!(
!(!(!(
!(!(
!(
!(
!(!(
!(
!(!(
!(!(
!(
!(
!(
!(
!(!(!(
!(
!(
!(
!(!(
!(!(
!(!(
!( !(
!(
!(
!(
!(
!(
!(!(
!(
!(
!(
!(
!(
!( !(
!(
!( !(!(
!(
!(
!(!(
!(
!(!(
!(
!(!(
!(
!(!(
!( !(
!(!(
!( !(!( !(
!(
To M
usso
orie
To Sah
astrad
hara
To Raipur
To GurudwaraTo Haridwar
To Haridwar
To Saharanpur
CANTT AREA
To Chakrata
KARGI
MAJRA
RAJPUR
HARIPUR
KARANPUR
SALAWALA
DALANWALA
ADHOIWALA
DHARAMPUR
KAULAGARH
KAILASHPURI
PATEL NAGAR
KRISHNANAGARINDIRA COLONY DILARAM BAZAR
DEFENCE COLONY
CONNAUGHT PLACE
HATHIBARKALA ESTATE
DEHRADUN CANTTAREA
GHANTAGHAR
km1 0 1 2 3
UTTARANCHAL URBAN DEVELOPMENT PROJECTGOVERNMENT OF UTTARANCHAL
Data Source
Legend
Municipal Boundary
National Highway
State Highway
Major City Road
Railway Line
River / Drain
Base Map prepared from Dehradun Guide Map (Survey of India) and Dehradun Nagar Nigam Map
M A P 3 . 1 . 1 : - C O N C E N T R A T I O N O F P O V E R T Y P O C K E T S
:
Poverty Pockets Concentration
Field Visits!
Dehradun Nagar Nigam!
State Urban Development Agency!
!(
D E H R A D U NCITY DEVELOPMENT PLAN
Uttarakhand Urban Development Project
Dehradun City Development Plan Page 17
Others
Power cuts are very frequent in the city. This is as the people perceive it, due to the old electric system, as now these are not capable of taking the load. Roads are ill-maintained with potholes and dug-up sites in many places. In Shanti Vihar flooding has been prevented by erecting stone-retaining wall on both sides of the river. The residents complained that there is no connecting bridge over the river between slum colonies of Shanti Vihar and Vani Vihar.
The slum residents are willing to pay for services. They are even willing to pay tax, but often the Municipal Corporation is not paying attention to this. In some localities they are even willing to form local groups to manage their problems.
The river flows in the rainy season and eventually turns into a big drain during rest of the seasons. After discussion with the residents in a few slums it was assessed that scarcity of water leads to unhygienic condition which in turn affect personal hygiene, leading to various illnesses.
After this brief portrayal of the slum situation a detail situation analysis of Dehradun as a whole is being presented in the subsequent section.
3.1.3 Situation Analysis
Adequate secondary data at household level on water supply, sanitation, solid waste management etc. are not available. Consequently, data from socio-economic survey at household level were analysed and the findings are discussed in this section. Wherever secondary data are available, these are used in the situation analysis, supplemented by further field studies
Water Supply
Majority (90%) of the households have in-house water supply connection. Of the BPL households 63.3 percent and 86.8 percent of the poor have house connection. The number of house connection increases with higher income.
0
20
40
60
80
100
120
BPL Poor Lower-Middle
Upper-Middle
High
House connect ion
Public st and post

Uttarakhand Urban Development Project
Dehradun City Development Plan Page 18
Water problem exists in many slums as the supply is very irregular. Duration of supply is mostly 1-2 hours each in morning and evening, some days water is not supplied. In low zone areas the residents get water supply throughout the day except during 11.30 am to 3.00 pm. In some slums there is no supply in the morning; it is available during 7.30-9.30 pm. As there is low pressure at peripheries, many families have installed booster pumps for drawing water directly from the distribution pipeline. Water quality is generally good. But in some taps muddy water flows, residents of some slums complained about bad smell of the water; some complained that sometimes worm was present in the collected water. In slum of Vivek Vihar on the hill slope the residents fetch water from tap for which they need to climb up; they store water in household tanks. There is no stand post or hand pump in many areas and the existing ones are in bad shape. Stand posts are mostly without platform and post and often without bibcock. There is usually a long gap between breakdown and repair of hand pumps. Sometime residents contribute and get it repaired privately. People queue up for collecting water and there is frequent quarrel during that time. As approach road is narrow is some slums, no rigging machine can be taken in for installing hand pumps in the locality. There is no water meter in houses; costing is done half yearly or on annual basis. Hand pump is used only in poorer localities.
Table 3.1.9: Data on Water Supply
Source of Drinking Water (Household in %)
BPL Poor Lower-Middle
Upper-Middle
High
House connection 63.3 86.8 97.9 96.4 98.6 Public stand post 32.2 9.7 1.8 0.7 1.4 Neighbour's house 0 1.1 0 1.4 0 Municipal tanker 0 0 0 0 0 Private vendor 0 0.2 0 0 0 Tube well/ Hand pump 4.4 1.3 0 0 0 Pond/ River 0 0 0 0 0 Others 0 0.9 0.3 1.4 0
Water is mostly fetched by women, even men share this responsibility. It has been noted that mostly men in BPL households collect water from outside. A few (0.5%) families having house connection sell piped water to their neighbours. None of the BPL group and HIG sells water. On an average 1 person collects water from each of those families.
Table 3.1.10: Responsibility of Water Collection
Gender (Household in %)
BPL Poor Lower-Middle
Upper-Middle
High
All 7.6 46.8 28.0 11.6 6.0 Adult male (%) 37.8 15.9 19.3 17.4 18.3 Adult female (%) 56.7 79.1 78.6 78.3 81.7 Boy (%) 5.6 4.1 2.1 2.9 0 Girl (%) 1.1 2.2 1.5 1.4 1.4
On an average people from the lower and lower-middle income groups travel less than 50 metres and spend half an hour for collection of drinking water.

Uttarakhand Urban Development Project
Dehradun City Development Plan Page 19
Table 3.1.11: Time spent for collecting water
Time spent per day (in minutes)
BPL Poor Lower-Middle
Upper-Middle
High
Households 33 73 7 5 1 <30 (%) 42.4 63 28.6 80 100 30-45 (%) 18.2 12.3 57.1 20 0 46-59 (%) 30.3 19.2 14.3 0 0 60+ (%) 9.1 5.5 0 0 0 Mean time (%) 37.6 31.2 34.4 23.4 20 Standard Deviation (%) 17.3 16 10.6 6.8 0
Distance in meter
Households 33 73 7 5 1 <50 m (%) 60.6 76.7 100 100 100 51-100 m (%) 15.2 17.8 0 0 0 100-150 m (%) 24.2 4.1 0 0 0 151+m (%) 0 1.4 0 0 0 Mean distance (%) 59.8 44.2 30 30 30 Standard Deviation (%) 40 30.4 0 0 0
72 percent expressed that they judge the quality by its taste, 14 per cent said they consider the appearance for this. Most (60 %) of the families do not treat water before consumption; on an average 31 percent filters it.
Table 3.1.12: Quality of Water
Quality* BPL Poor Lower-Middle Upper-Middle High
Household 7.6 46.8 28.0 11.6 6.0 Good 52.2 34.6 32.5 31.2 32.4 Medium 42.2 60.4 63.6 59.4 62 Poor 5.6 5 3.9 9.4 5.6
*Data show household in %
Forty one percent BPL families and 20 percent of poor are willing to take new house connection for water supply.
020406080
100120
BPLPoo
r
Lower-
Middle
Upper-
Middle
High
<30
30-45
46-59
60+0
20406080
100120
BPLPoo
r
Lower-
Midd le
Upper-M
iddle
High
<50 metr
51-100 metr
100-150 metr
151+metr
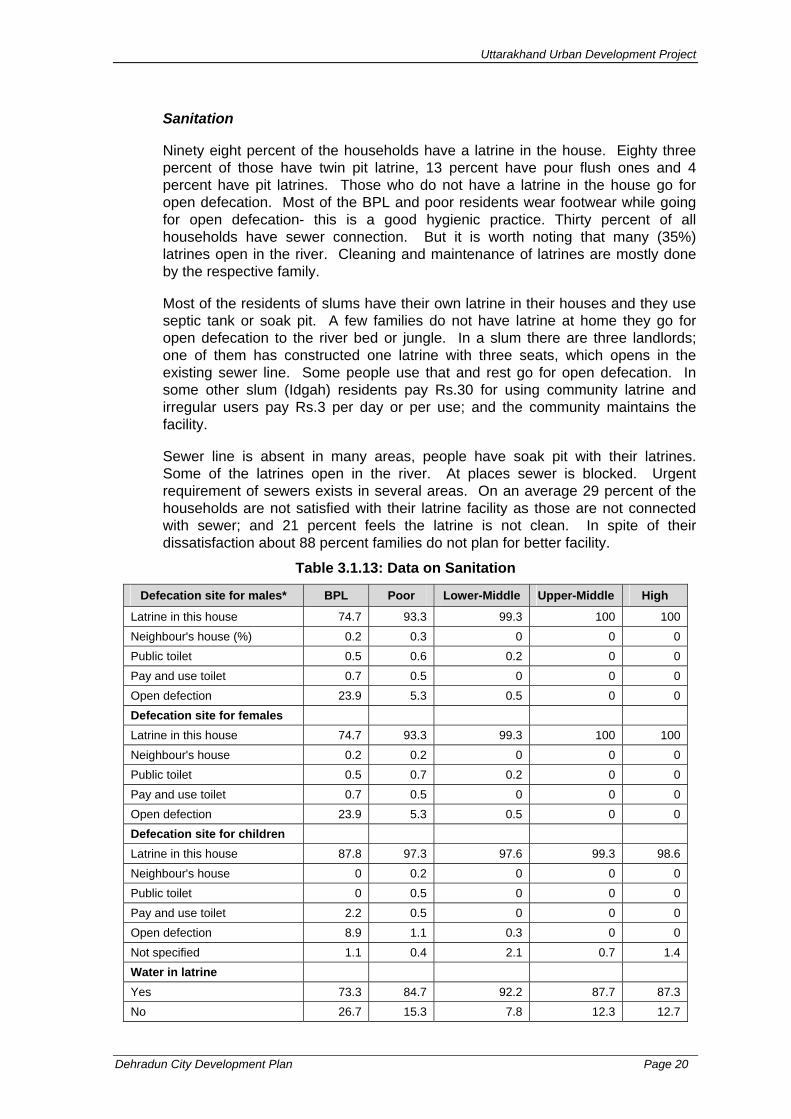
Uttarakhand Urban Development Project
Dehradun City Development Plan Page 20
Sanitation
Ninety eight percent of the households have a latrine in the house. Eighty three percent of those have twin pit latrine, 13 percent have pour flush ones and 4 percent have pit latrines. Those who do not have a latrine in the house go for open defecation. Most of the BPL and poor residents wear footwear while going for open defecation- this is a good hygienic practice. Thirty percent of all households have sewer connection. But it is worth noting that many (35%) latrines open in the river. Cleaning and maintenance of latrines are mostly done by the respective family.
Most of the residents of slums have their own latrine in their houses and they use septic tank or soak pit. A few families do not have latrine at home they go for open defecation to the river bed or jungle. In a slum there are three landlords; one of them has constructed one latrine with three seats, which opens in the existing sewer line. Some people use that and rest go for open defecation. In some other slum (Idgah) residents pay Rs.30 for using community latrine and irregular users pay Rs.3 per day or per use; and the community maintains the facility.
Sewer line is absent in many areas, people have soak pit with their latrines. Some of the latrines open in the river. At places sewer is blocked. Urgent requirement of sewers exists in several areas. On an average 29 percent of the households are not satisfied with their latrine facility as those are not connected with sewer; and 21 percent feels the latrine is not clean. In spite of their dissatisfaction about 88 percent families do not plan for better facility.
Table 3.1.13: Data on Sanitation
Defecation site for males* BPL Poor Lower-Middle Upper-Middle High
Latrine in this house 74.7 93.3 99.3 100 100 Neighbour's house (%) 0.2 0.3 0 0 0 Public toilet 0.5 0.6 0.2 0 0 Pay and use toilet 0.7 0.5 0 0 0 Open defection 23.9 5.3 0.5 0 0 Defecation site for females Latrine in this house 74.7 93.3 99.3 100 100 Neighbour's house 0.2 0.2 0 0 0 Public toilet 0.5 0.7 0.2 0 0 Pay and use toilet 0.7 0.5 0 0 0 Open defection 23.9 5.3 0.5 0 0 Defecation site for children Latrine in this house 87.8 97.3 97.6 99.3 98.6 Neighbour's house 0 0.2 0 0 0 Public toilet 0 0.5 0 0 0 Pay and use toilet 2.2 0.5 0 0 0 Open defection 8.9 1.1 0.3 0 0 Not specified 1.1 0.4 2.1 0.7 1.4 Water in latrine Yes 73.3 84.7 92.2 87.7 87.3 No 26.7 15.3 7.8 12.3 12.7
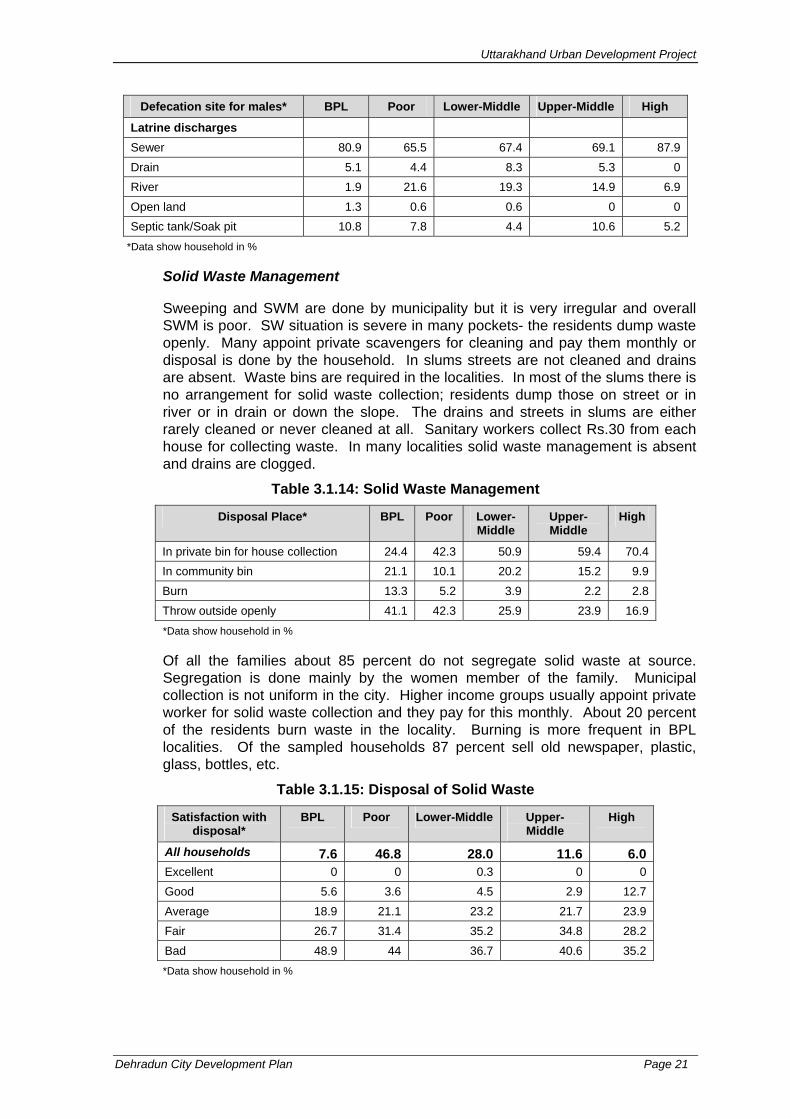
Uttarakhand Urban Development Project
Dehradun City Development Plan Page 21
Defecation site for males* BPL Poor Lower-Middle Upper-Middle High
Latrine discharges Sewer 80.9 65.5 67.4 69.1 87.9 Drain 5.1 4.4 8.3 5.3 0 River 1.9 21.6 19.3 14.9 6.9 Open land 1.3 0.6 0.6 0 0 Septic tank/Soak pit 10.8 7.8 4.4 10.6 5.2
*Data show household in %
Solid Waste Management
Sweeping and SWM are done by municipality but it is very irregular and overall SWM is poor. SW situation is severe in many pockets- the residents dump waste openly. Many appoint private scavengers for cleaning and pay them monthly or disposal is done by the household. In slums streets are not cleaned and drains are absent. Waste bins are required in the localities. In most of the slums there is no arrangement for solid waste collection; residents dump those on street or in river or in drain or down the slope. The drains and streets in slums are either rarely cleaned or never cleaned at all. Sanitary workers collect Rs.30 from each house for collecting waste. In many localities solid waste management is absent and drains are clogged.
Table 3.1.14: Solid Waste Management
Disposal Place* BPL Poor Lower-Middle
Upper-Middle
High
In private bin for house collection 24.4 42.3 50.9 59.4 70.4 In community bin 21.1 10.1 20.2 15.2 9.9 Burn 13.3 5.2 3.9 2.2 2.8 Throw outside openly 41.1 42.3 25.9 23.9 16.9 *Data show household in %
Of all the families about 85 percent do not segregate solid waste at source. Segregation is done mainly by the women member of the family. Municipal collection is not uniform in the city. Higher income groups usually appoint private worker for solid waste collection and they pay for this monthly. About 20 percent of the residents burn waste in the locality. Burning is more frequent in BPL localities. Of the sampled households 87 percent sell old newspaper, plastic, glass, bottles, etc.
Table 3.1.15: Disposal of Solid Waste
Satisfaction with disposal*
BPL Poor Lower-Middle Upper-Middle
High
All households 7.6 46.8 28.0 11.6 6.0 Excellent 0 0 0.3 0 0 Good 5.6 3.6 4.5 2.9 12.7 Average 18.9 21.1 23.2 21.7 23.9 Fair 26.7 31.4 35.2 34.8 28.2 Bad 48.9 44 36.7 40.6 35.2 *Data show household in %

Uttarakhand Urban Development Project
Dehradun City Development Plan Page 22
Storm Water Drainage
Storm water drainage is present in the city. Drains are absent in some slums. Drains are mostly pucca but open. It has been noticed that those are clogged in many localities. Water logging is frequent during rains; this stagnant water even enters houses in some localities. In some slums drains are broken and in many localities those are clogged as they are not cleaned regularly. Street side drains are not continuous and broken at some places. The drains and streets are never or very rarely cleaned. The residents of some slums complain that people from surrounding buildings dump garbage in this drain. According to the residents of slums those are along the rivers there is flooding problem during rains.
It was observed in a locality on Mata Mandir Marg that quite a few houses on one side are having their ground floor below the road level. In a discussion with a resident of the locality it was found that the road is very new, only a few months old. Earlier there was a canal along the side of the road on the same side. During rains that used to overflow and flood all the low lying areas including the houses. Once the flooding was so much that when a resident opened the back door the water gushed to Suman Nagar and flooded the slum. Water logging is frequent and many localities remain under water for long (at least 1 week in a year). Most of the affected families do not suffer any damage due to flooding and water logging.
Table 3.1.16: Data on Drainage and Water Logging
Characteristics (Household in %)
BPL Poor Lower-Middle Upper-Middle High
Households 7.6 46.8 28.0 11.6 6.0Yes 73.3 77.1 75.3 65.2 59.2 No 26.7 22.9 24.7 34.8 40.8 Nature of drain Pucca 52.2 65.9 65.7 52.9 57.7 Kutcha 21.1 12.1 10.2 13 2.8 Covered 10 9.5 9.3 4.3 21.1 Open 63.3 65.9 65.4 59.4 38 Flowing 35.6 45 45.8 37 28.2 Clogged 37.8 31 28.9 27.5 29.6 Water logging/Flooding problem Yes 27.8 12.3 6.6 7.2 7 No 72.2 87.7 93.4 92.8 93 Frequency <5 times in a year 72 70.6 63.6 50 20 5-10 times in a year 24 16.2 18.2 30 20 10+ times a year 4 13.2 18.2 20 60 Duration <1 week in a year 88 76.5 81.8 40 40 1 week to 1 month in a year 8 10.3 9.1 50 20 1-3 months in a year 0 2.9 0 0 20 3+ months a year 4 10.3 0 10 20 Not specified 0 0 9.1 0 0
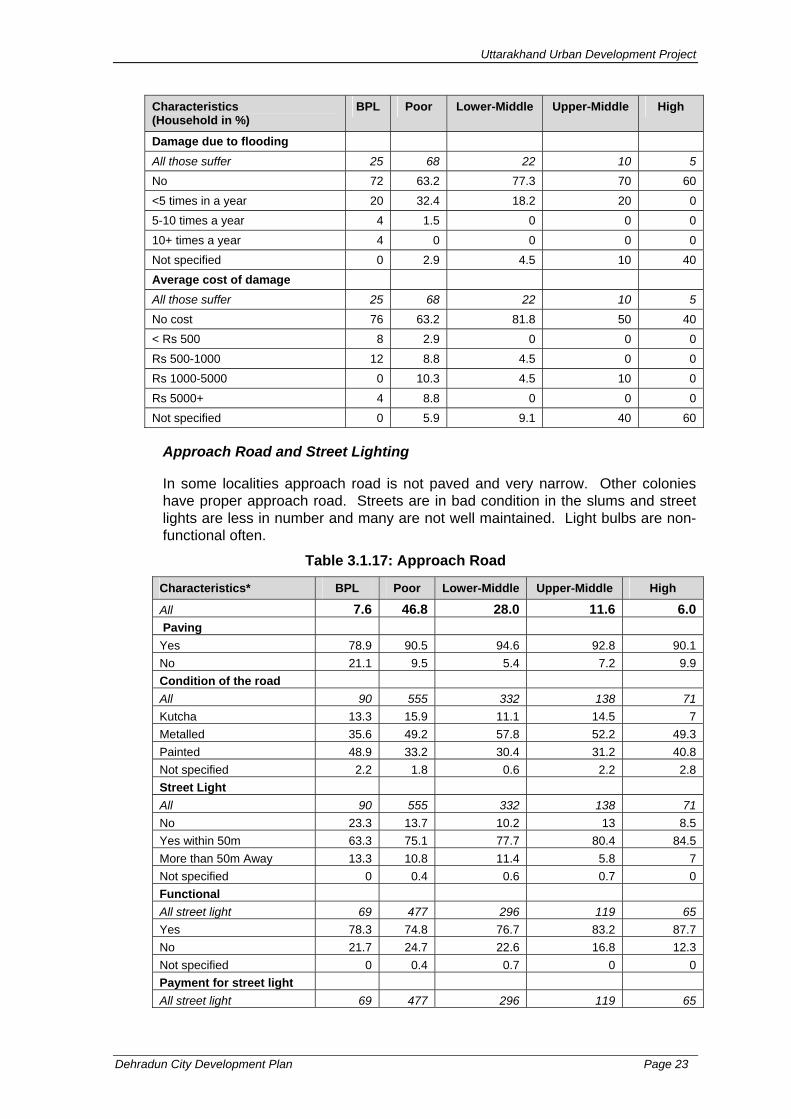
Uttarakhand Urban Development Project
Dehradun City Development Plan Page 23
Characteristics (Household in %)
BPL Poor Lower-Middle Upper-Middle High
Damage due to flooding All those suffer 25 68 22 10 5 No 72 63.2 77.3 70 60 <5 times in a year 20 32.4 18.2 20 0 5-10 times a year 4 1.5 0 0 0 10+ times a year 4 0 0 0 0 Not specified 0 2.9 4.5 10 40 Average cost of damage All those suffer 25 68 22 10 5 No cost 76 63.2 81.8 50 40 < Rs 500 8 2.9 0 0 0 Rs 500-1000 12 8.8 4.5 0 0 Rs 1000-5000 0 10.3 4.5 10 0 Rs 5000+ 4 8.8 0 0 0 Not specified 0 5.9 9.1 40 60
Approach Road and Street Lighting
In some localities approach road is not paved and very narrow. Other colonies have proper approach road. Streets are in bad condition in the slums and street lights are less in number and many are not well maintained. Light bulbs are non-functional often.
Table 3.1.17: Approach Road
Characteristics* BPL Poor Lower-Middle Upper-Middle High
All 7.6 46.8 28.0 11.6 6.0 Paving Yes 78.9 90.5 94.6 92.8 90.1 No 21.1 9.5 5.4 7.2 9.9 Condition of the road All 90 555 332 138 71 Kutcha 13.3 15.9 11.1 14.5 7 Metalled 35.6 49.2 57.8 52.2 49.3 Painted 48.9 33.2 30.4 31.2 40.8 Not specified 2.2 1.8 0.6 2.2 2.8 Street Light All 90 555 332 138 71 No 23.3 13.7 10.2 13 8.5 Yes within 50m 63.3 75.1 77.7 80.4 84.5 More than 50m Away 13.3 10.8 11.4 5.8 7 Not specified 0 0.4 0.6 0.7 0 Functional All street light 69 477 296 119 65 Yes 78.3 74.8 76.7 83.2 87.7 No 21.7 24.7 22.6 16.8 12.3 Not specified 0 0.4 0.7 0 0 Payment for street light All street light 69 477 296 119 65

Uttarakhand Urban Development Project
Dehradun City Development Plan Page 24
Characteristics* BPL Poor Lower-Middle Upper-Middle High
Yes 7.2 5 5.4 10.9 13.8 No 91.3 94.3 92.6 89.1 86.2 Not specified 1.4 0.6 2 0 0
*Data show household in %
Priorities
Of all the sampled households 75 percent expressed that their first priority is water supply. Second priority of twenty eight percent is sanitation and 46 percent placed drainage in their third priority. Solid waste collection was the fourth priority to some families. Most (54%) of the families put emphasis on roads and street lighting as their fifth priority. A large number (80%) considered proximity to public transport as the sixth priority.
Table 3.1.18: Priority in Order of Importance to Quality of Life (%)
Services (Household in %)
Priority 1 Priority 2 Priority 3 Priority 4 Priority 5 Priority 6
Water 75 Sanitation 28.4 Drainage 45.5 Solid waste collection 33.6 35.86 Roads, street lighting 54.1 Proximity to public transport
80.6
Health and Hygiene
It has been found that hygienic practices of citizens are good. Use of soap is high, 90-100 percent of the people, who go for open defecation uses footwear. Reported cases of diarrhoea and ARI are very rare. Total reported death was 14, the causes are presented below. A death due to TB was reported from the BPL group.
Table 3.1.19: Hygiene Practices
Characteristics* BPL Poor Lower-Middle Upper-Middle High
Hand washing after defection All 7.6 46.8 28.0 11.6 6.0With mud 7.8 5 5.1 5.1 5.6 With water 7.8 6.3 2.1 3.6 2.8 With soap 84.4 88.6 92.8 91.3 91.5 Use of footwear while going for open defecation Yes 90 100 100 0 0 No 10 0 0 0 0 Diarrhoea in last six months Yes 5.6 1.4 1.8 0.7 1.4
0%20%40%60%80%
100%
Priority1
Priority3
Priority5
Prioities of CommunityWater
Sanitation
Drainage
Solid w aste collection
Roads, street lighting
Proximity to publictransport

Uttarakhand Urban Development Project
Dehradun City Development Plan Page 25
Characteristics* BPL Poor Lower-Middle Upper-Middle High
No 94.4 98.6 98.2 99.3 98.6 Acute Respiratory Infection (ARI) in last six months Yes 5.6 2 0.6 0.7 0 No 94.4 98 99.4 99.3 100 Work days lost in illness None 83.3 84.3 88.9 81.9 84.5 Less than 5 days 1.1 0.4 0.9 0.7 1.4 5-10 days 6.7 0.5 0.3 1.4 1.4 10-20 days 0 0.2 0 0 0 More than 20 days 0 1.4 1.5 0.7 0 Not specified 8.9 13.2 8.4 15.2 12.7 Death in last year Yes child under 5 0 0.4 0.3 1.4 0 Yes Other 2.2 1.3 0.6 0 0 No 97.8 98.4 99.1 98.6 100 Probable cause of death HH having death case 2 9 3 2 0 Diarrhoea 0 11.1 0 50 0 Road accident 0 0 33.3 0 0 Not known 0 11.1 0 0 0 Polio 0 11.1 0 0 0 TB 100 0 33.3 0 0 Heart attack 0 22.2 0 50 0 Old age 0 22.2 0 0 0 Sugar 0 0 33.3 0 0 Illness 0 22.2 0 0 0 Average cost of treatment for the family per month All 90 555 332 138 71 Nothing 6.7 11.5 18.4 15.2 19.7 Less than Rs 50 5.6 6.3 3.6 7.2 8.5 Rs 50-100 3.3 8.3 9.9 13.8 14.1 Rs 100-200 23.3 19.6 18.1 19.6 25.4 Rs 200+ 52.2 43.2 43.1 34.1 23.9 Not specified 8.9 11 6.9 10.1 8.5 *Data show household in %
Others
Power cuts in the localities are very frequent. This is, as the people perceive it, due to the old electric system, as now these are not capable of taking the load. Roads are ill-maintained with potholes and dug-up sites in many places. In some places, like Shanti Vihar, flooding has been prevented by erecting stone-retaining wall on both sides of the river. Residents of Shanti Vihar and Vani Vihar complained that there is no connecting bridge over the river between these slum colonies.
The slum residents are willing to pay for services. They are even willing to pay tax, but often the NN is not paying attention to this. In some localities they are even willing to form local groups to manage their problems. The river flows in the rainy season and eventually turns into a big drain during rest of the seasons. After discussion with the residents in a few slums it was assessed that scarcity of
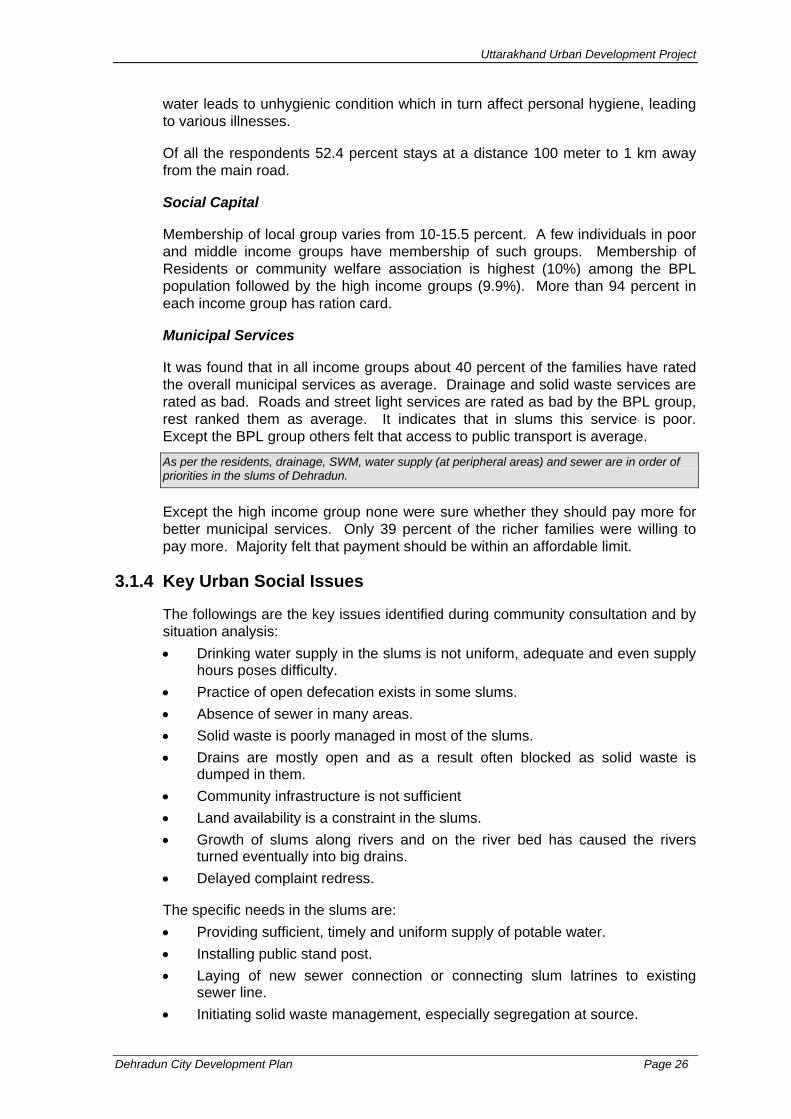
Uttarakhand Urban Development Project
Dehradun City Development Plan Page 26
water leads to unhygienic condition which in turn affect personal hygiene, leading to various illnesses.
Of all the respondents 52.4 percent stays at a distance 100 meter to 1 km away from the main road.
Social Capital
Membership of local group varies from 10-15.5 percent. A few individuals in poor and middle income groups have membership of such groups. Membership of Residents or community welfare association is highest (10%) among the BPL population followed by the high income groups (9.9%). More than 94 percent in each income group has ration card.
Municipal Services
It was found that in all income groups about 40 percent of the families have rated the overall municipal services as average. Drainage and solid waste services are rated as bad. Roads and street light services are rated as bad by the BPL group, rest ranked them as average. It indicates that in slums this service is poor. Except the BPL group others felt that access to public transport is average.
As per the residents, drainage, SWM, water supply (at peripheral areas) and sewer are in order of priorities in the slums of Dehradun.
Except the high income group none were sure whether they should pay more for better municipal services. Only 39 percent of the richer families were willing to pay more. Majority felt that payment should be within an affordable limit.
3.1.4 Key Urban Social Issues
The followings are the key issues identified during community consultation and by situation analysis: • Drinking water supply in the slums is not uniform, adequate and even supply
hours poses difficulty. • Practice of open defecation exists in some slums. • Absence of sewer in many areas. • Solid waste is poorly managed in most of the slums. • Drains are mostly open and as a result often blocked as solid waste is
dumped in them. • Community infrastructure is not sufficient • Land availability is a constraint in the slums. • Growth of slums along rivers and on the river bed has caused the rivers
turned eventually into big drains. • Delayed complaint redress.
The specific needs in the slums are: • Providing sufficient, timely and uniform supply of potable water. • Installing public stand post. • Laying of new sewer connection or connecting slum latrines to existing
sewer line. • Initiating solid waste management, especially segregation at source.

Uttarakhand Urban Development Project
Dehradun City Development Plan Page 27
• Construction of side drains. • Paving approach roads. • Maintenance of street lights. • Organising residents in the participatory process • Involvement of CBOs / NGOs in the whole process. • Construction of a few community centres which could also be used as base
offices of community based complaint redress system • Establishing a community development cell in the NN and deploying an
officer, who could be a link between the MC and the base offices. • Launching awareness programme. • Securing land tenure to the residents and providing low cost housing. EWS
housing schemes should be targeted at registered slum dwellers. In-situ upgradation should be given priority within such schemes.
• Convergence of various programmes. • Desilting of rivers and cleaning waste deposited in them.
3. 2 Economic Development
3.2.1 Demographic Features
Dehradun’s population was 4.48 lakhs as per Census 2001. There was an unprecedented decennial increase in population (40%) of Dehradun in the 1991-10 decade. This is explained by the fact that in this decade Uttarakhand was carved out of the state of Uttar Pradesh with Dehradun as the state capital (section 3.1.1.above).
In all probability, Dehradun’s population growth rate will still be faster in the coming decades as the economic development policy now being pursued by the State will continue to create more job opportunities, which in turn will attract more job seekers to this town. Taking into consideration various economic factors, particularly the perspective of economic development in the town, the population has been projected up to the year 2025. Understandably, Dehradun has a large floating population, constituted of tourists, commuters, and business travellers. Tourist arrivals in 2003, 2004 and 2005 were 9.29 lakhs, 10.25 lakhs, and 10.26 lakhs respectively. The average annual percentage increase was 5% only. However, for a long term projection, the growth rate of tourist population per day is a necessary input. In Dehradun, as is understood, most of the tourist arrivals occur in three months a year (April -June). Taking the tourist population of 2005 (10.26 lakhs) as the base, and dividing it by 3 months (90 days), the average tourist arrival per day works out to 11,400. Applying the annual average growth
DehradunProjected population
0
200
400
600
800
1000
1200
2001 2005 2010 2015 2020 2021
Year
Tous
and
pers
ons

Uttarakhand Urban Development Project
Dehradun City Development Plan Page 28
rate of India’s population (2%), the floating population (tourists) has been projected.
The number of daily commuters to the town is believed to be quite high but no estimate of it is available. In the absence of any other basis, the commuter population has been taken as 5% of the permanent population. For year-wise projected population refer to Annex 3.1.1
Table 3.2.1: Tourist Arrivals in Dehradun
The sex ratio of Dehradun as per Census 2001 was 900 female per thousand male. This ratio is lower than the state average of 950. One of the reasons for lower ratio could be that there are a good number of workers who have left behind their families at places outside Dehradun. The literacy rate of Dehradun is relatively high. In 2001, male literacy rate was 90.3 and that of female literacy was 81.1, the gender gap being only 9. The average household size is about 5 persons; the density of population in 2001 was around 6,700 persons per sq. km.
3.2.2 Economic Base of the City
A data based assessment of the economic base of the city is not possible as essential economic information for the purpose is not readily available separately for the towns of Uttarakhand. It can, however, be conjectured that the dominant sector of the economy of Dehradun is the tertiary sector. This is substantiated by the fact that in most of the years since 1996-97, among the three economic sectors in Uttarakhand, tertiary sector’s contribution to the NSDP was the highest (Table 3.2.3), and that of the secondary sector the lowest. Tertiary sector is constituted of activities like: transport and storage; communication; trade, hotel and restaurant; finance, insurance, real estate; bus services; and community, social, and personal services. It may further be conjectured that Dehradun accounts for substantial portion of the contribution of tertiary sector to the NSDP. The basis of this contention is that, besides being the state capital and the largest town in the State (the distant second is Haridwar), most of the above mentioned tertiary sector activities are concentrated in Dehradun.
Year Tourist Arrivals (in lakhs)
2000 4.6
2001 4.6
2002 7.1
2003 9.3

Uttarakhand Urban Development Project
Dehradun City Development Plan Page 29
Table 3.2.2: Percentage Contribution of Three Economic Sectors to NSDP
Sectors Year Primary Secondary Tertiary
1996-97 38.74 23.7 37.56 1997-98 37.97 23.34 38.69 1998-99 38.93 21.52 39.54 1999-00 40.08 19.85 40.07 2000-01 37.98 21.51 40.51 2001-02 33.92 23.77 42.31 2002-03 31.79 25.95 42.26 2003-04 30.65 25.61 42.74
Source: Directorate of Economics and Statistics, Government of Uttarakhand, Estimates of State Domestic Product of Uttarakhand, 1993-94 to 2003-04
Furthermore, Dehradun is the place of work for a large number of state and central government employees, and employees of private sector offices. Most of the major banks, public and private sector financial institutions and different service providers have their one or more branches in Dehradun.
Being the gateway to the Himalayan region of the State, and the last rail head in the State, Dehradun attracts large number of tourists on their onward journeys to different hill destinations. The tourist arrival in 2003 to this town was also quite large; it was more than 9 lakhs in 2003 (Table 3.2.2). Dehradun is also the whole sale trading centre for the entire hill region of the State.
Before the formation of Uttarakhand as a separate State, Dehradun or for that matter the area of this State was not in the focus in respect of industrial development. Thus, Dehradun and its surroundings could not emerge in the past as an industrially advanced area. Hence its percentage contribution to the secondary sector was perhaps low. The town was rather known for its institutional activities as many important and well known institutions are located here like, some famous schools, Indian Military Academy, Survey of India, Indian Forest Institute, and much other such government of India, State Government, and private institutions. In Dehradun per se there are no large or medium scale

Uttarakhand Urban Development Project
Dehradun City Development Plan Page 30
industrial units. However, in the District of Dehradun, 37 large and medium scale industrial units employing, 8278 workers are in operation (Table 3.2.4). Though these units are not located within the city area, these together have strong impact on the tertiary sector of the economy of Dehradun city.
Table 3.2.3: Large and Medium Scale Industrial Units in Dehradun District and Number of Workers Employed
Type of industrial Units No. of workers No. of Units
Home appliance 281 2 Pharmaceuticals and chemicals 3513 7 Engineering 387 5 Electrical 1909 8 PVC/ plastic 154 4 Food processing 997 4 Glass products 685 1 Others 441 8 Total 7607 37
Source: Government of Uttarakhand, Directorate of Industries, Directory – Large and Medium I industries (Functioning), 2005I
3.2.3 Economic Growth Potential
Dehradun, like many other towns of Uttarakhand, has high potentiality for faster rate of growth of both secondary and tertiary sectors. ‘The New Industrial Policy 2003’ of the Government of Uttarakhand has made a clear statement of the State’s vision about industrial development in the State up to the year 2007. The policy document also indicates State’s intended interventions to translate the vision into reality. Dehradun and for that matter the State of Uttarakhand has the following advantages for economic growth:
• The State is rich in power resources and potential with availability of assured, uninterrupted, quality power at affordable and competitive rates.
• Action being taken to simplify and rationalise the labour laws
• The State has an earth station at Dehradun and two more are proposed. An Information Technology Park is in the process of being established.
• Action being taken to simplify and rationalise the labour laws
• A multipurpose industrial promotion, investment and infrastructure development corporation, State Industrial Development Corporation of Uttarakhand Limited (SIDCUL) has been set up.5
‘The New Industrial Policy 2003’ of the Government of Uttarakhand has spelled out vision for industrial development and has announced various concessions to attract industries, some salient points of which are listed below:
5 Government of Uttarakhand, New Industrial Policy 2003 and Concessional Industrial Package
Uttarakhand Urban Development Project
Dehradun City Development Plan Page 31
A vision statement:
• To create high quality world class infrastructure facilities in the State.
• To provide single window facilitation in the State to expedite project clearances.
• To promote and encourage private sector participation in the development and management of infrastructure projects.
• To provide assured power supply for industries.
• To simplify and rationalise labour laws.
• To promote small scale and cottage industries.
• To promote tourism as a focus area and develop Uttarakhand as a premier global tourism destination.
• To promote and strengthening air, rail, road, and other connectivity.
• To develop Uttarakhand as a premier education and research centre Fiscal incentives
• 100% central excise for ten years.
• 100% income tax exemption for first five years and 30% for next five years for companies and 25% for others.
• CST @ 1 % for five years.
• Capital investment subsidy of 15% subject to a maximum Rs. 3 million.
• 100% exemption of entertainment tax for multiplex projects for three years. Policy instruments
• Single window contact, information and facilitation.
• Single window clearance mechanism.
• Deemed clearance. Information technology
• IT and IT related services accorded industry status.
• A dedicated IT park is already coming up in Dehradun
• Exemption on electricity duty on generator sets of IT industries established in IT park/industrial estates.
• Free bandwidth up to 2 mbps to all IT software companies/IT enabled service based companies, call centres, BPOs etc. for one year subject to some conditions.

Uttarakhand Urban Development Project
Dehradun City Development Plan Page 32
The industrial development policy of the State of Uttarakhand would provide impetus to faster rate of industrialization of Dehradun. More than one Integrated Industrial Estates in Dehradun are in the offing. Besides, the impact of three factors viz. large investments in industries which are expected to be made in the coming years; the planned infrastructure and institutional improvement with financial assistance of the ADB and the Urban Infrastructure Fund; and the proposed overall development of the town under the Jawaharlal Nehru Urban Renewal Mission will widen employment opportunities both in secondary and tertiary sectors.
The over all growth of secondary sector the State, will push up the tertiary sector activities of Dehradun. The growth of the services like banking, finance, and insurance, communication, trading, transport, hospitality (hotels and restaurants) etc. in tandem with the growth in industrial sector in the State; will have impact on the economy of Dehradun. For Dehradun is the hub of these activities in Uttarakhand. These economic factors will further strengthen with the development of tourism, more so because Dehradun is the gateway of tourist destinations in Uttarakhand.
As stated earlier, the process of industrialization has just started in the State of Uttarakhand. It will be some time before the rate of growth of secondary sector gets accelerated and that of service sector attain still higher growth rate.
3.3 Physical Growth and Urban Environment
3.3.1 Planning Efforts in the Past
During the post independence period the city had registered steady urban growth. The growth rate took a quantum jump from 1991 registering a nearly 40 per cent decadal growth during 1991-2001. With a view to check the uncontrolled haphazard growth of Dehradun, the State Government, in 1963, declared the area falling within municipal limits and the areas falling within 5 mile radius beyond municipal limit as “Regulated Area” under Section 3 of the UP (Regulation of Building Operations) Act, 1958. In October 1984, the State Government notified “Mussoorie-Dehradun Development Area” under the provision of UP Urban Planning and Development Act, 1973 including 185 revenue villages and surrounding Mussoorie and Dehradun Urban areas. Thus Mussoorie – Dehardun Development Authority (MDDA) was constituted for the planning and development of the aforesaid development areas. The preparation of zonal development plans and regulations have been recommended under section 9 of the UP Urban Planning and Development Act, 1973.
Till now two master plans have been prepared for the city of Dehradun. The first master plan for 1982-2001 came into effect in 1982 and continues to be the legal document. The second master plan is conceived for 2025 but still is in its’ draft form. The salient features of both these plans have been discussed in the following sections:
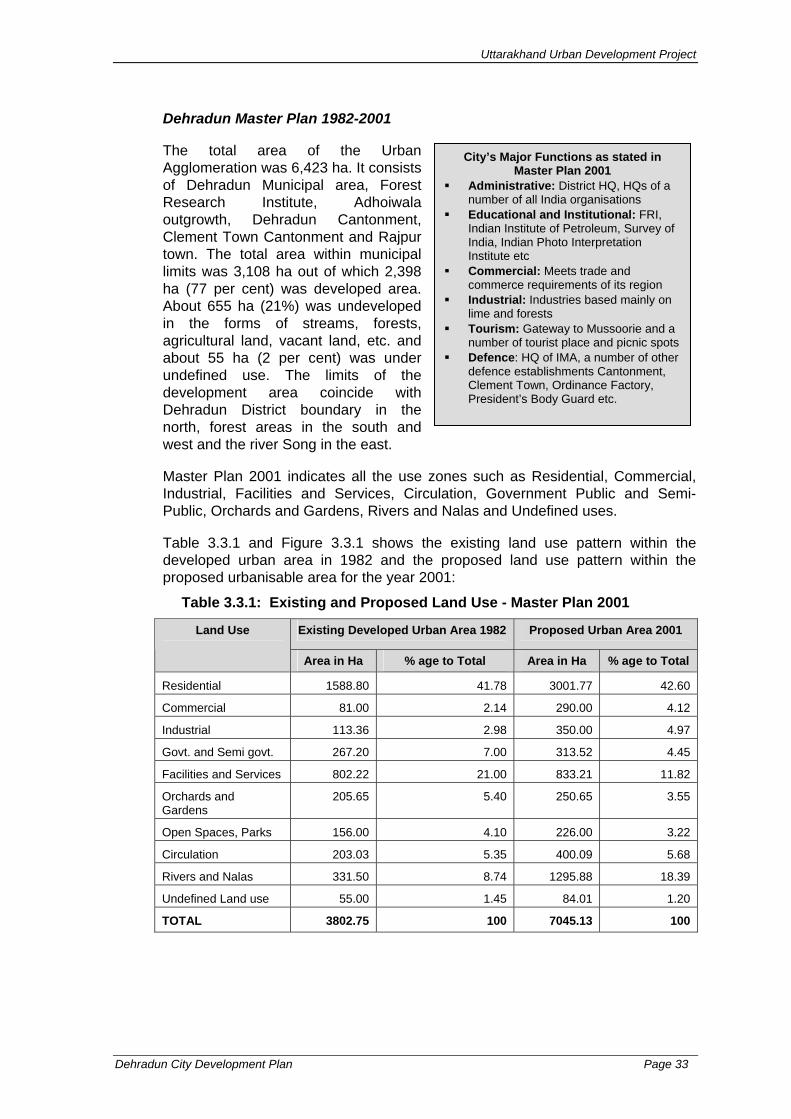
Uttarakhand Urban Development Project
Dehradun City Development Plan Page 33
City’s Major Functions as stated in Master Plan 2001
Administrative: District HQ, HQs of a number of all India organisations
Educational and Institutional: FRI, Indian Institute of Petroleum, Survey of India, Indian Photo Interpretation Institute etc
Commercial: Meets trade and commerce requirements of its region
Industrial: Industries based mainly on lime and forests
Tourism: Gateway to Mussoorie and a number of tourist place and picnic spots
Defence: HQ of IMA, a number of other defence establishments Cantonment, Clement Town, Ordinance Factory, President’s Body Guard etc.
Dehradun Master Plan 1982-2001
The total area of the Urban Agglomeration was 6,423 ha. It consists of Dehradun Municipal area, Forest Research Institute, Adhoiwala outgrowth, Dehradun Cantonment, Clement Town Cantonment and Rajpur town. The total area within municipal limits was 3,108 ha out of which 2,398 ha (77 per cent) was developed area. About 655 ha (21%) was undeveloped in the forms of streams, forests, agricultural land, vacant land, etc. and about 55 ha (2 per cent) was under undefined use. The limits of the development area coincide with Dehradun District boundary in the north, forest areas in the south and west and the river Song in the east.
Master Plan 2001 indicates all the use zones such as Residential, Commercial, Industrial, Facilities and Services, Circulation, Government Public and Semi-Public, Orchards and Gardens, Rivers and Nalas and Undefined uses.
Table 3.3.1 and Figure 3.3.1 shows the existing land use pattern within the developed urban area in 1982 and the proposed land use pattern within the proposed urbanisable area for the year 2001:
Table 3.3.1: Existing and Proposed Land Use - Master Plan 2001
Existing Developed Urban Area 1982 Proposed Urban Area 2001 Land Use
Area in Ha % age to Total Area in Ha % age to Total
Residential 1588.80 41.78 3001.77 42.60
Commercial 81.00 2.14 290.00 4.12
Industrial 113.36 2.98 350.00 4.97
Govt. and Semi govt. 267.20 7.00 313.52 4.45
Facilities and Services 802.22 21.00 833.21 11.82
Orchards and Gardens
205.65 5.40 250.65 3.55
Open Spaces, Parks 156.00 4.10 226.00 3.22
Circulation 203.03 5.35 400.09 5.68
Rivers and Nalas 331.50 8.74 1295.88 18.39
Undefined Land use 55.00 1.45 84.01 1.20
TOTAL 3802.75 100 7045.13 100
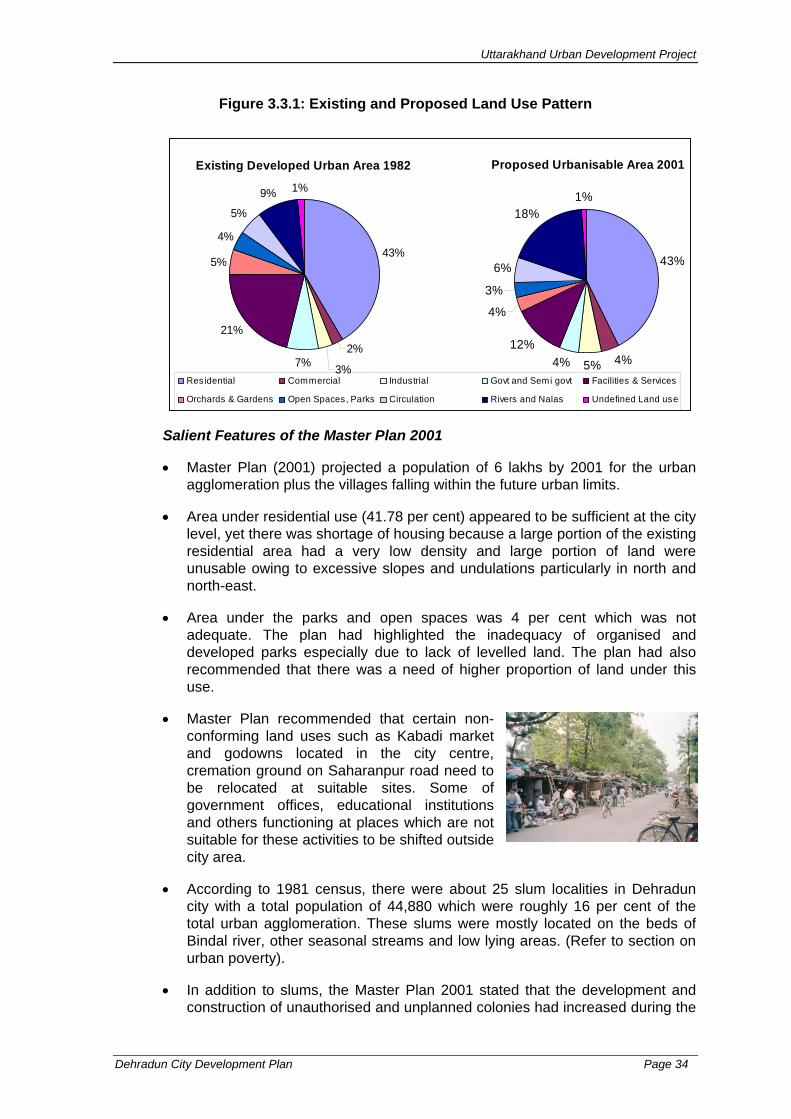
Uttarakhand Urban Development Project
Dehradun City Development Plan Page 34
Figure 3.3.1: Existing and Proposed Land Use Pattern
Salient Features of the Master Plan 2001
• Master Plan (2001) projected a population of 6 lakhs by 2001 for the urban agglomeration plus the villages falling within the future urban limits.
• Area under residential use (41.78 per cent) appeared to be sufficient at the city level, yet there was shortage of housing because a large portion of the existing residential area had a very low density and large portion of land were unusable owing to excessive slopes and undulations particularly in north and north-east.
• Area under the parks and open spaces was 4 per cent which was not adequate. The plan had highlighted the inadequacy of organised and developed parks especially due to lack of levelled land. The plan had also recommended that there was a need of higher proportion of land under this use.
• Master Plan recommended that certain non-conforming land uses such as Kabadi market and godowns located in the city centre, cremation ground on Saharanpur road need to be relocated at suitable sites. Some of government offices, educational institutions and others functioning at places which are not suitable for these activities to be shifted outside city area.
• According to 1981 census, there were about 25 slum localities in Dehradun city with a total population of 44,880 which were roughly 16 per cent of the total urban agglomeration. These slums were mostly located on the beds of Bindal river, other seasonal streams and low lying areas. (Refer to section on urban poverty).
• In addition to slums, the Master Plan 2001 stated that the development and construction of unauthorised and unplanned colonies had increased during the
Proposed Urbanisable Area 2001
43%
4%5%4%12%
4%
3%
6%
18%1%
Residential Commercial Industrial Govt and Semi govt Facilities & Services
Orchards & Gardens Open Spaces, Parks Circulation Rivers and Nalas Undefined Land use
Existing Developed Urban Area 1982
43%
2%
3%7%
21%
5%
4%
5%
9% 1%

Uttarakhand Urban Development Project
Dehradun City Development Plan Page 35
last five years (1975-80) due to lack of proper regulation and control of development activities. This issue has further been discussed in subsequent sections.
• All types of industries occupy about 114 hectares of land within developed urban area, of which 36 hectares of land is within the municipal limits.
• Master Plan stated that there were about 171 registered lime kilns on Rajpur road and Sahastradhara road. These lime kilns were concentrated in a haphazard and ill planned manner on the bank of Rispana Rao.
• Master Plan stated that the haphazard industrialisation in Doon valley was leading to encroachments on natural resources. In this context, the Master Plan has recommended that there is a need for a regional policy to locate various types of industries keeping in view the following:
Declaration of Doon valley as “ environmentally fragile area” Stopping of mining and quarrying activities in the Mussoorie hills and
Sahastradhara area Conservation and protection of adequately forested area Afforestation of partly or wholly denuded area Planning and regulation of urban growth in the Doon valley Imposition of strict control over the location of new industries in the
Dehradun district.
The Doon Valley Board constituted by the Government of India declared Doon Valley as a “Pollution Free Area” in 1982. It was decided by the Board not to renew the mining leases for lime stone quarries on Dehradun-Mussourie road and the Sahastradhara area.
Key Provisions under Master Plan 2001
A brief summary of the key provisions in Master Plan 2001 are discussed in Table 3.3.2.
Table 3.3.2: Key Provisions under Master Plan 2001
Components Key Provisions in Master Plan 2001 Progress / Remarks Housing and Area Development
Mainly planned towards south and south-west direction between Dehradun, Haridwar road and Dehradun-Chakrata road. Some residential areas have also been proposed between Rajpur road and Sahastradhara road.
Residential development mainly along Haridwar road, Saharanpur road and Chakrata road. MDDA has developed and constructed row housing / flats (Sahastradhara Enclave) on Sahastradhara Road
Traffic and Transport
The Regional and Major city Roads proposed to be widened are: Saharanpur Road, Haridwar Road, Chakrata Road, Raipur Road, Sahastradhara Road, Rajpur Road, Mussoorie Bye-pass, Gandhi Road, General Mahadeo Singh Road, Kanoli Road, Bye-Pass Road. Other roads which are proposed to be widened are: Kalidas Marg, Kaulagar Road, Paltan Bazar Road, New Cantt Road, Tilak Road, Ansari Road.
MDDA has developed 28 acres of land for Transport Nagar on Saharanpur Road. About 22 acres is yet to be developed which includes 8 acres for ISBT workshops.
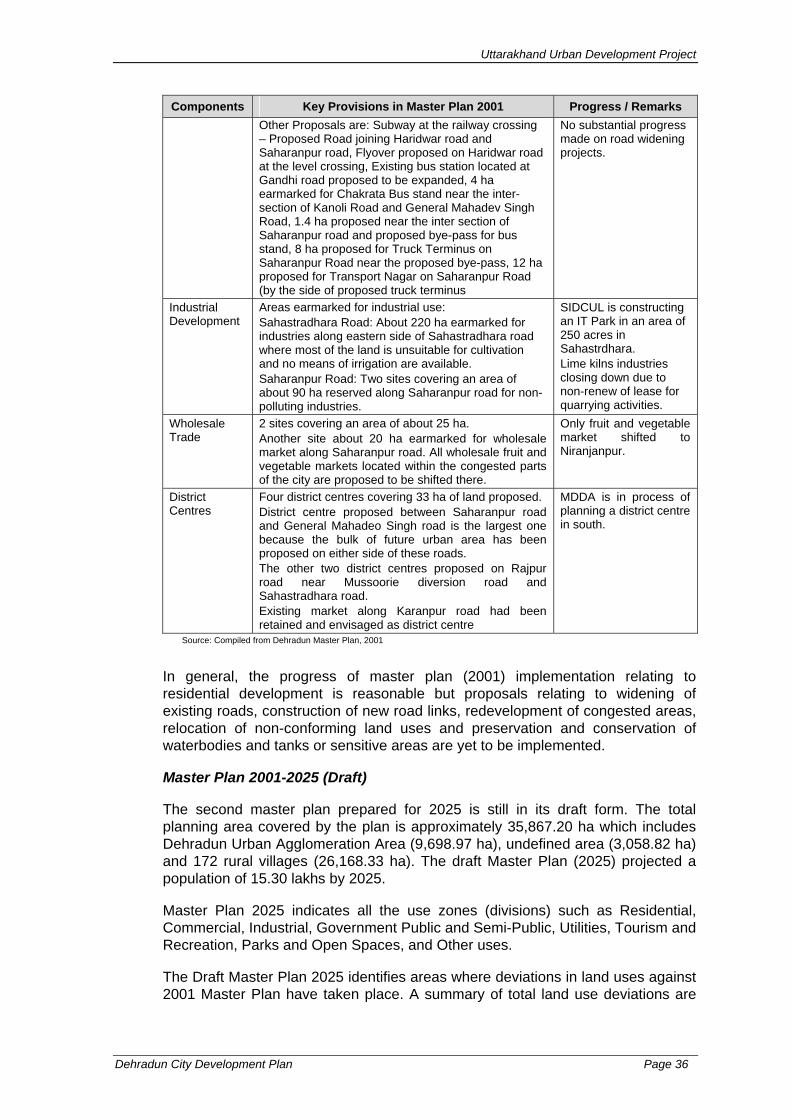
Uttarakhand Urban Development Project
Dehradun City Development Plan Page 36
Components Key Provisions in Master Plan 2001 Progress / Remarks Other Proposals are: Subway at the railway crossing – Proposed Road joining Haridwar road and Saharanpur road, Flyover proposed on Haridwar road at the level crossing, Existing bus station located at Gandhi road proposed to be expanded, 4 ha earmarked for Chakrata Bus stand near the inter-section of Kanoli Road and General Mahadev Singh Road, 1.4 ha proposed near the inter section of Saharanpur road and proposed bye-pass for bus stand, 8 ha proposed for Truck Terminus on Saharanpur Road near the proposed bye-pass, 12 ha proposed for Transport Nagar on Saharanpur Road (by the side of proposed truck terminus
No substantial progress made on road widening projects.
Industrial Development
Areas earmarked for industrial use: Sahastradhara Road: About 220 ha earmarked for industries along eastern side of Sahastradhara road where most of the land is unsuitable for cultivation and no means of irrigation are available. Saharanpur Road: Two sites covering an area of about 90 ha reserved along Saharanpur road for non-polluting industries.
SIDCUL is constructing an IT Park in an area of 250 acres in Sahastrdhara. Lime kilns industries closing down due to non-renew of lease for quarrying activities.
Wholesale Trade
2 sites covering an area of about 25 ha. Another site about 20 ha earmarked for wholesale market along Saharanpur road. All wholesale fruit and vegetable markets located within the congested parts of the city are proposed to be shifted there.
Only fruit and vegetable market shifted to Niranjanpur.
District Centres
Four district centres covering 33 ha of land proposed. District centre proposed between Saharanpur road and General Mahadeo Singh road is the largest one because the bulk of future urban area has been proposed on either side of these roads. The other two district centres proposed on Rajpur road near Mussoorie diversion road and Sahastradhara road. Existing market along Karanpur road had been retained and envisaged as district centre
MDDA is in process of planning a district centre in south.
Source: Compiled from Dehradun Master Plan, 2001
In general, the progress of master plan (2001) implementation relating to residential development is reasonable but proposals relating to widening of existing roads, construction of new road links, redevelopment of congested areas, relocation of non-conforming land uses and preservation and conservation of waterbodies and tanks or sensitive areas are yet to be implemented.
Master Plan 2001-2025 (Draft)
The second master plan prepared for 2025 is still in its draft form. The total planning area covered by the plan is approximately 35,867.20 ha which includes Dehradun Urban Agglomeration Area (9,698.97 ha), undefined area (3,058.82 ha) and 172 rural villages (26,168.33 ha). The draft Master Plan (2025) projected a population of 15.30 lakhs by 2025.
Master Plan 2025 indicates all the use zones (divisions) such as Residential, Commercial, Industrial, Government Public and Semi-Public, Utilities, Tourism and Recreation, Parks and Open Spaces, and Other uses.
The Draft Master Plan 2025 identifies areas where deviations in land uses against 2001 Master Plan have taken place. A summary of total land use deviations are

Uttarakhand Urban Development Project
Dehradun City Development Plan Page 37
given in Table 3.3.3 and further details of the diversions in land uses are given in Annex 3.3.1.
Table 3.3.3: Summary of Land Use Deviations against 2001 Master Plan
Changed Land Use Area in hectares %age Residential 1157.06 52.36 Commercial 139.35 6.31 Industrial 165.09 7.47 Community Facilities 77.21 3.49 Park and Open Spaces 11.52 0.52 Agricultural 355.14 16.07 Orchards 172.58 7.81 Forest 19.36 0.88 Undefined 90.98 4.12 Roads / Transport 21.49 0.97 Total Land Use Deviations 2209.78 100.00
Source: Master Plan 2025 (Draft)
Land Deviations – Proposed (for 2001) v/s Actual 2003-04
The land use proposed for 2001 has been compared with the existing land use in 2003-04 in the subsequent sections and shown in Map 3.3.1.
• Large areas under agricultural land use converted for residential purpose i.e about 741 ha.
• About 125 ha land under residential use converted for industrial development and 117 ha land under industrial use converted for residential development purpose.
• About 94 ha land under green belt and nallas converted for residential development purpose.
• Approximately 43 ha of land under the forest use converted for residential development and some 42 ha under garden and orchards use converted for residential development purpose
• The total area of converted land use is 2210 ha out of which 1157 ha (52 per cent) is converted for residential development purpose.
• Map 3.3.1 shows that most of the land use deviations occurred along Sahastradhara road, Haridwar road, Haridwar by pass, Rispana and Bindal rivers and also areas lying between Saharanpur road and Haridwar by pass.
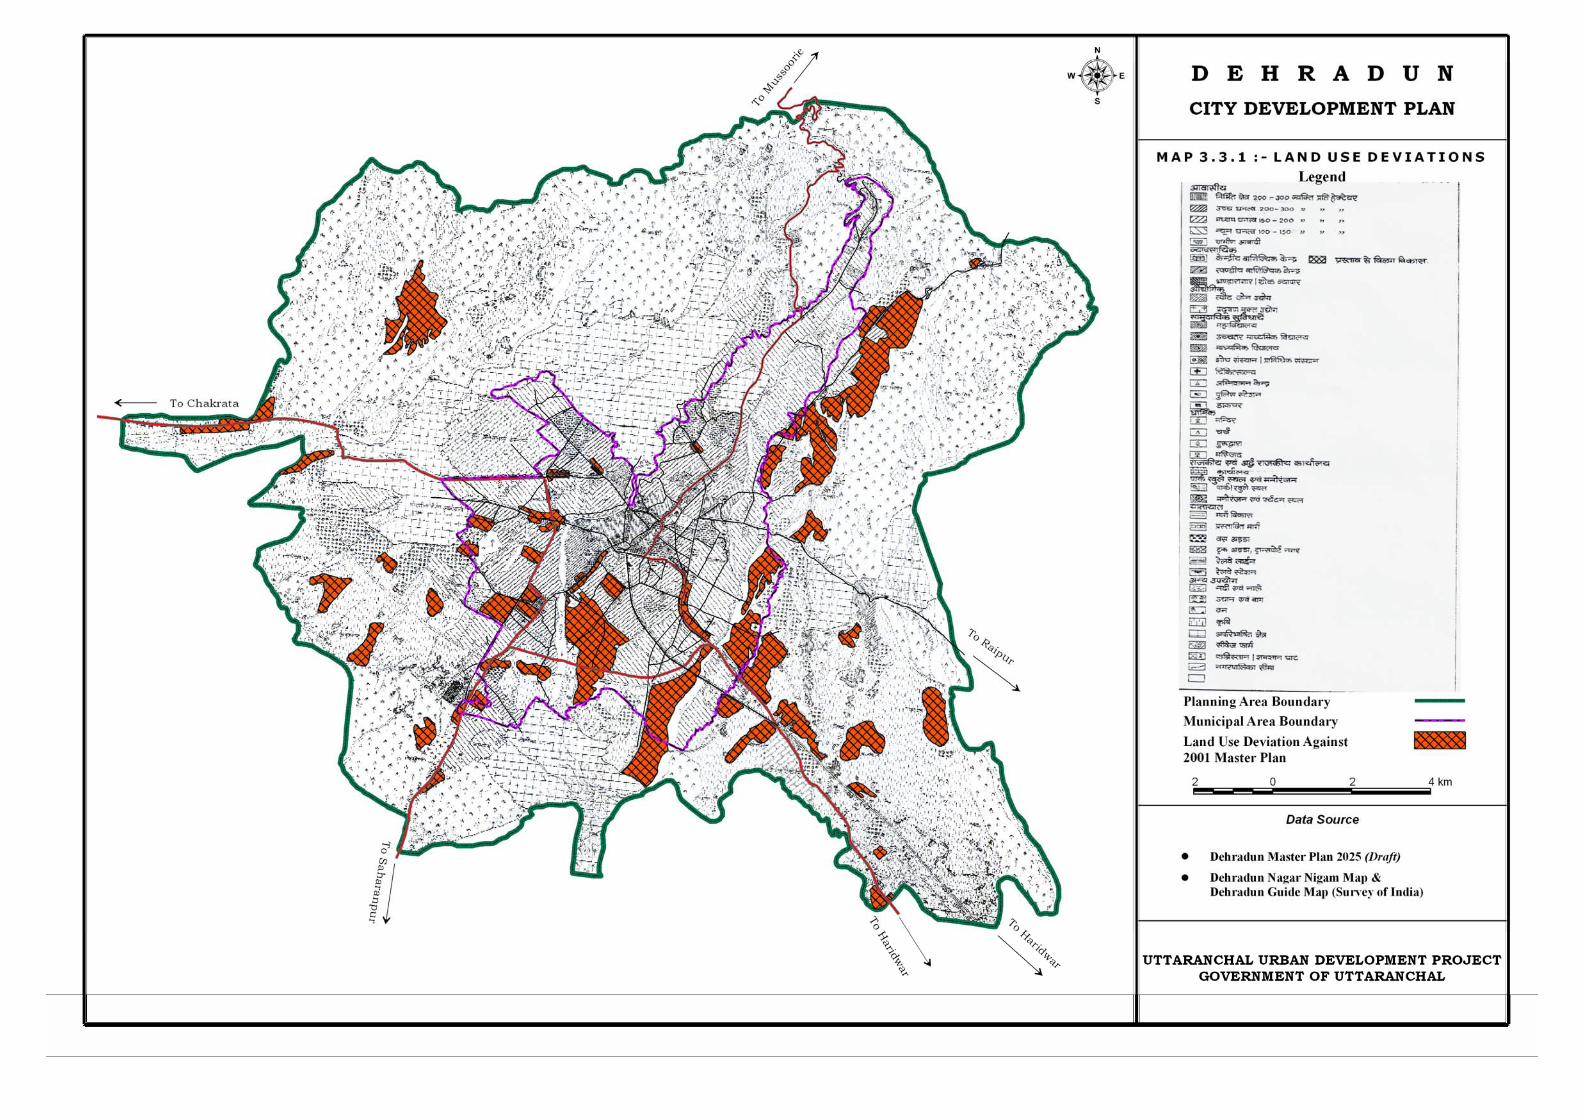

Uttarakhand Urban Development Project
Dehradun City Development Plan Page 39
Details of the existing land use distribution – 2003-04 for the MDDA planning area are given in Table 3.3.4.
Table 3.3.4: Land use 2003-04 as per Draft Master Plan
Land Use 2003-04 Land Use
Area in Ha %age to Total Residential 4071.8 11.35 Commercial 341.43 0.95 Industrial 183.44 0.51 Govt. and Semi govt. 479.62 1.34 Facilities and Services 415.42 1.16 Traffic/Transportation 821.96 2.29 Gardens 728.37 2.03 Open Spaces 584.92 1.63 Tea Gardens 709.24 1.98 Agriculture 9585.41 26.72 Wastelands 879.88 2.45 Rivers and Nalas 1179.25 3.29 Forest Areas 12288.36 34.26 Military Farm 70.28 0.20 FRI 469 1.31 Undefined Land use 3058.82 8.53 TOTAL 35,867.2 100
Land Use Analysis – Proposed for 2001 v/s Actual 2003-04 • Area proposed for 2001 under residential land use was 3,002 ha that
increased to 4,072 ha in 2003-04. This shows that the demand of residential land use was much higher than what was proposed in 1982 Master Plan.
• Area proposed under industrial land use was 350 ha for 2001 but it got limited to 183 ha in 2003-04. Most of the SIDCUL projects are coming up outside the Dehradun Planning Area except the IT Park at Sahastradhara. SIDCUL is constructing an IT Park in an area of 250 acres in Sahastrdhara area.
• Area proposed under commercial use was 290 ha that increased to 341 ha in 2003-04. This shows that the demand of commercial activities was much higher than what was proposed in 1982 Master Plan.
• About 833 ha areas proposed for 2001 under utilities and facilities use but it got limited to 415 ha in 2003-04. This shows that most of the utilities and facilities as proposed in 1982 is not being implemented.
0500
10001500200025003000350040004500
Are
a in
ha
Res
iden
tial
Com
mer
cial
Indu
stria
l
Gov
t & S
emi
govt
Faci
lities
&Se
rvic
es
Traf
fic &
Tran
spor
tatio
n
Land Use
Figure 3.3.2: Land Use Analysis - Proposed vs Actual
Proposed 2001
Existing 2003-2004

Uttarakhand Urban Development Project
Dehradun City Development Plan Page 40
The proposed land use as per draft master plan is given in table 3.3.5 below:
Table 3.3.5: Proposed Land use as per Draft Master Plan 2025
S.No. Land Use Area in Ha %age to Total
1 Residential 5325.65 14.842 Commercial 423.32 1.183 Industrial 331.67 0.924 Govt. and Semi govt. 925.97 2.585 Facilities and Services 1030.49 2.886 Utilities 132.92 0.377 Tourism and Recreation 202.16 0.568 Parks, Open spaces 978.88 2.739 Traffic and Transportation 1517.80 4.23
10 Other land uses 24998.34 69.71 TOTAL 35867.20 100
Housing Draft Master Plan 2025 provides the estimated additional housing requirements in Dehradun urban agglomeration area. The Plan states a shortfall of 3,288 housing units in 2001 which is expected to be covered up in the following years. Slums
The Master Plan 2025 (draft) states that there are 79 slums, of which 62 are situated on DNN land, 9 on Guru Rai Darbar land, 4 on Waqf board, 3 on unidentified and 1 on Badrinath Mandir Samiti land. The details of land that have been encroached by the malin bastis is provided in Table 3.3.6:
Figure 3.3.3: Proposed Land use as per Draft Master Plan 2025
15%
1%
1%
3%
3%
0%
1%
3%
4%
69%
Residential Commercial Industrial Govt and Semi govt Facilities and ServicesUtilitiesTourism and Recreation Parks, Open spacesTraffic and Transportation Other land uses
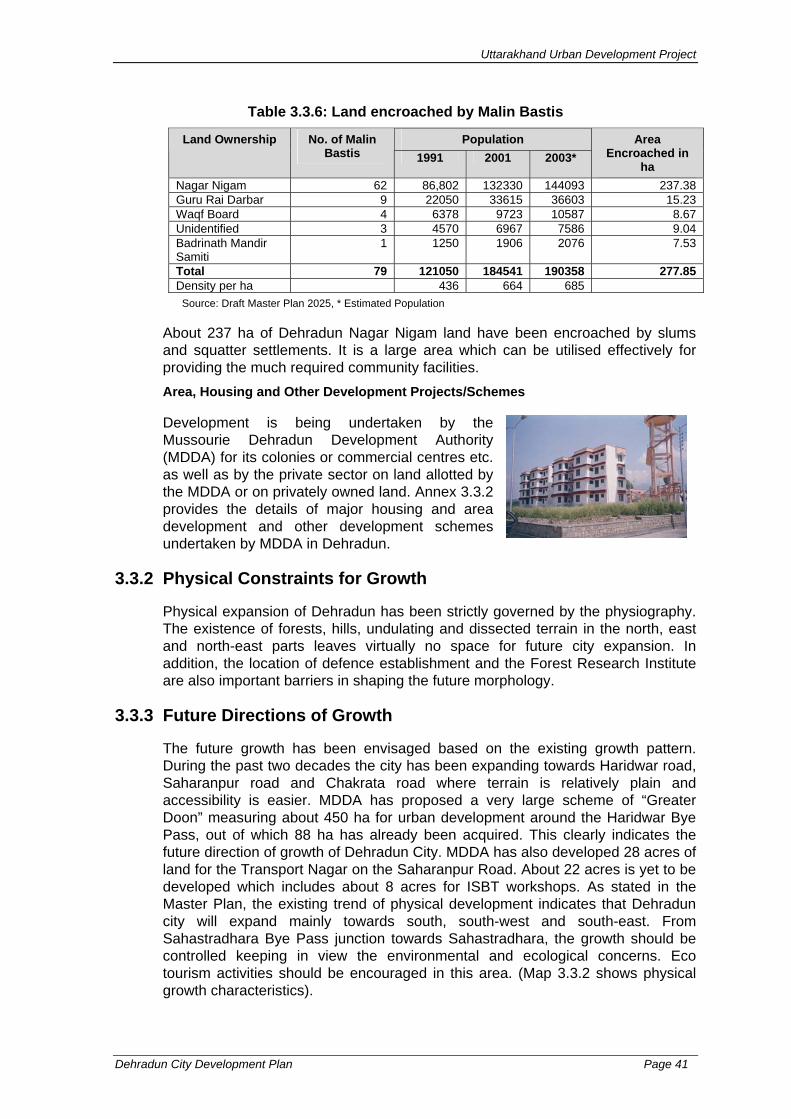
Uttarakhand Urban Development Project
Dehradun City Development Plan Page 41
Table 3.3.6: Land encroached by Malin Bastis
Population Land Ownership No. of Malin Bastis 1991 2001 2003*
Area Encroached in
ha Nagar Nigam 62 86,802 132330 144093 237.38 Guru Rai Darbar 9 22050 33615 36603 15.23 Waqf Board 4 6378 9723 10587 8.67 Unidentified 3 4570 6967 7586 9.04 Badrinath Mandir Samiti
1 1250 1906 2076 7.53
Total 79 121050 184541 190358 277.85 Density per ha 436 664 685
Source: Draft Master Plan 2025, * Estimated Population
About 237 ha of Dehradun Nagar Nigam land have been encroached by slums and squatter settlements. It is a large area which can be utilised effectively for providing the much required community facilities. Area, Housing and Other Development Projects/Schemes
Development is being undertaken by the Mussourie Dehradun Development Authority (MDDA) for its colonies or commercial centres etc. as well as by the private sector on land allotted by the MDDA or on privately owned land. Annex 3.3.2 provides the details of major housing and area development and other development schemes undertaken by MDDA in Dehradun.
3.3.2 Physical Constraints for Growth
Physical expansion of Dehradun has been strictly governed by the physiography. The existence of forests, hills, undulating and dissected terrain in the north, east and north-east parts leaves virtually no space for future city expansion. In addition, the location of defence establishment and the Forest Research Institute are also important barriers in shaping the future morphology.
3.3.3 Future Directions of Growth
The future growth has been envisaged based on the existing growth pattern. During the past two decades the city has been expanding towards Haridwar road, Saharanpur road and Chakrata road where terrain is relatively plain and accessibility is easier. MDDA has proposed a very large scheme of “Greater Doon” measuring about 450 ha for urban development around the Haridwar Bye Pass, out of which 88 ha has already been acquired. This clearly indicates the future direction of growth of Dehradun City. MDDA has also developed 28 acres of land for the Transport Nagar on the Saharanpur Road. About 22 acres is yet to be developed which includes about 8 acres for ISBT workshops. As stated in the Master Plan, the existing trend of physical development indicates that Dehradun city will expand mainly towards south, south-west and south-east. From Sahastradhara Bye Pass junction towards Sahastradhara, the growth should be controlled keeping in view the environmental and ecological concerns. Eco tourism activities should be encouraged in this area. (Map 3.3.2 shows physical growth characteristics).


Uttarakhand Urban Development Project
Dehradun City Development Plan Page 43
The land use / land cover change detection study was done by G. Sarantuya from IIRS, Dehradun which also indicates that the city has been expanding mainly towards Haridwar and Saharanpur road. Figure 3.3.4 shows the land use / land cover change detection between 1965-1989.
Figure 3.3.4: Land Use / Land Cover Change Detection
The land use /land cover detection from 1965 to 1989 is depicted in Table 3.3.7.
Table 3.3.7: Land Use Changes between 1965-1989
Land Use 1965-1989 (area in ha)
1989-96 (area in ha)
1996-98 (area in ha)
Total (area in ha)
Agricultural to built-up 690.4 715.5 302.3 1708.2 Forest to built-up 64.2 170.7 49.8 284.7 Garden to built-up 51.7 58.7 15.2 125.6 Open space to built-up 203.4 114.6 25 343 Others to built-up 65.9 205.1 3.3 274.3 River to built-up 176.4 16.0 22.5 214.9
Source: Unpublished project report on land use/land cover change detection study by G. Sarantuya from IIRS, Dehradun
Figure 3.3.5: Land Use / Land Cover Changes 1965-1989
Land Use / Land Cover Changes 1965-1989
58%
10%
4%
12%
9%7%
Agricultural to built-up
Forest to built-up
Garden to built-up
Open space to built-up
Others to built-up
River to built-up

Uttarakhand Urban Development Project
Dehradun City Development Plan Page 44
It has been observed from the above figure that the expansion of urban area was principally into agricultural lands, or to say, the significant loss of non built-up area comprising agricultural land and non-green area for urban development.
3.3.4 Tourism and Buildings/ Structures of Heritage Importance
Tourism
Dehradun is well known for its scenic natural beauty, beautiful forest, waterfalls and surroundings. The city is regarded as the gateway to many famous tourist destinations like Mussoorie, Rishikesh, Badrinath, Kedarnath and others. The city is visited by a large number of tourists. See table 3.3.8 below.
Table 3.3.8: Number of Tourists – Existing and Projected Year Indian Foreign Total %age increase
1997 8,69,919 4,355 8,74,274 -
1999 5,62,151 10,693 5,72,844 (-)34.47
2001 8,45,175 12,667 8,57,838 (+) 49.75
2003 9,17,070 11,922 9,28,992 (+) 8.29
2011* 11,55,510 13,490 11,69,000 (+) 25.83
2021* 16,83,000 17,000 17,00,000 (+) 45.42
2025* 20,68,300 21,000 20,89,300 (+) 22.90 Source: Draft Master Plan 2025
Figure 3.3.6: Number of Tourists
Dehradun has several attractions, many of which are academic institutions and research centres of national importance. The town is a major academic and research centre and a base for the Indian Military Academy and the Survey of India. The Forest Research Institute is main centre of research and planning in the fields of flora and fauna in India. There are also several prestigious boarding schools including the Doon School, India's most exclusive private school. Other places of interest in Dehradun are the Anthropological Survey of India, Botanical Survey of India, Forest Research Institute, Indian Institute of Petroleum, Indian Institute of Remote
Number of Tourists
0
200000
400000
600000
800000
1000000
1200000
1400000
1600000
1800000
2000000
2200000
1 2 3 4 5 6 7
Year
No.
of T
ouris
ts
Total Tourists
1997 1999 2001 2003 2011 2021 2025

Uttarakhand Urban Development Project
Dehradun City Development Plan Page 45
Sensing, Indian Military Academy, Rashtriya Indian Military College, Survey of India, Wadia Institute of Himalayan Geology and Zoological Survey of India. The Central Braille Press or Rashtriya Drishtibaditarth Sansthan Bharat is the largest producer of Braille texts in India. The Robber's Cave, situated on the outskirts of the city, is a famous view point. Tapovan is the place where it is believed that Guru Dronacharya (of Mahabharata) had his ashram. Tapkeshwar Temple is dedicated to Lord Shiva and is known for its association with Mahabharata. Kalsi is an archaeological site situated close to River Yamuna on the way from Dehradun to the hill station of Chakrata. Dakpatthar is a major tourist attraction opening the visitors to the beauty of Doon Valley. There is a 16 km (easy) trekking route from Dehradun to Mussoorie.
Dehradun has tremendous possibilities for tourism development.
Areas of Archaeological, Historical, Cultural and Architectural Importance
An inventory of the heritage buildings of cultural, historical, socio-economical and architectural values was taken up by INTACH in the past and several buildings were divided in grades based on the respective value of each building. Based on the listing the important features, areas, zones, precincts and buildings of heritage and historical importance can be divided into the six distinct geographical regions (see box below).
Some of the major recommendations made by the INTACH are: (i) the canals of Doon valley to be declared as a special protected zone with a programme for restoration, reuse and development, (ii) heritage conservation plan of Guru Ram Rai Durbar area, (iii) development of public spaces in the Paltan Baz ar area of the city, (iv) restoration of public gardens
Identification and Confirmation of Features, Areas, Zones, Precincts and Buildings of Heritage Importance
(i) Canal Network – Heritage Zone I: It includes major canals of Doon – Beejapore, Rajpur, Kutha Pathar, Khalunga and Jakhan
(ii) Cantonment – Heritage Zone II: Some of the significant sites are: Circuit house, Bijapur Canal Guest house, Robber’s Cave, Cambrian hall, RIMC, 501 Field Survey Engineering Group Officer’s Mess, Doon School Chandbagh estate), Lal Gate, Tapkeshwar Mahadev temple.
(iii) Raipur, including Sahastradhara – Heritage Zone III: This zone has many significant historical sites like – Sahastradhara, Tapovan, Gillespie’s Memorial, Kalunga Fort Maidan, Sharmain Ki Haveli, Maldeota Temple
(iv) Guru Ram Rai Durbar, including Paltan Bazar Area and Ranger’s College – Heritage Zone IV : This area has many important heritage sites: Guru Ram Rai Durbar, CNI Boy’s Inter College, Clock Tower, Jama Masjid – Dhamawala, Inamullah Building, Nagalia haveli, Darshini gate, Ranger’s college
(v) FRI, IMA and Precincts – Heritage Zone V: Forest Research Institute, Chetwood Building, Indian Military Academy.
(vi) Rajpur, including George Everest Estate – Heritage Zone VI: Arcadia, Hathipaon House, (George Everest House)
Source: Compiled from Preserving the Historical Landscape of Dehradun by INTACH
Uttarakhand Urban Development Project
Dehradun City Development Plan Page 46
including Gandhi Park, Mata Wala Bagh, Bombay Bagh, Bhandari bagh and some of the private litchi orchards, and inner city Development. It is necessary to take steps in collaboration with the private sector and interested communities to protect such buildings and their surroundings. Some of the projects identified by INTACH for improvement and redevelopment have been discussed and considered in the investment plan in Chapter 7 and 8.
3.3.5 Key Issues Relating to Physical Growth and Built Environment
• Ribbon development along major transport corridors: Due to lack of forward planning and the effective application of development controls, all the primary radial transit routes particularly Rajpur road, Chakrata road, Saharanpur road and Haridwar road to the city are rendered inefficient due to ribbon development. This in turn creates congestion, poor utilisation of the right-of-way, increased travel times, increased air pollution and a reduction in the efficiency of the urban economy as a whole. Roadside trading and encroachments require control to ensure the main road carriageway is not obstructed. Particular efforts will be needed to limit inappropriate ribbon development along the primary roads.
• Over crowding, haphazard development without proper infrastructure in city core area: The large concentration of human activities in the urban core (i.e areas around Clock Tower) has resulted in over crowding, haphazard development, malin bastis etc without adequate infrastructure. Most of the housing areas in the central core particularly Khurbura, Chukkuwala, Ansari road, Neshwilla road, Kawli road etc have zig-zag narrow roads which are difficult to be widened and there is a general lack of parks and open spaces too. Urban renewal and redevelopment projects
• Pressure of urban development around Haridwar bypass road and also areas lying between Saharanpur road and Haridwar road: During the past decade the city has been expanding towards Haridwar road, Saharanpur road and Chakrata road where terrain is relatively plain and accessibility is easier. Recent sporadic development has taken place to the north-east and south-west of city as well as areas lying between Saharanpur road, Haridwar road and Haridwar bye pass. Sites along the Haridwar bypass road are quite attractive for commercial uses because of the increased accessibility. Some large-scale institutional development is also taking place along the Saharanpur road and Chakarata road. These areas are under tremendous development pressure and immediate attention to proper planning and enforcement are very essential.
• Unplanned and uncoordinated sub division of peripheral fringe areas: The peripheral fringe area (outside municipal corporation limits but within the planning area) is under pressure for further urban growth but does not have the same level of planning and development control. Little control has been exercised over this development leading to conversion of prime agricultural land and conversion of water bodies for urban uses. This requires proper development control and enforcement.
• Lack of developed land for affordable housing: Discussions with local people suggests that there is a shortage of affordable housing in Dehradun. Due to shortage of affordable housing, slum areas are growing in city and surrounding areas. The poor cannot have developed sites for house construction at an affordable price because of high cost of land and

Uttarakhand Urban Development Project
Dehradun City Development Plan Page 47
non-expansion of infrastructure in a planned way which has resulted in squatter settlements on urban fringe areas and within city areas. Unfortunately, the Master Plan does not indicate how shelter for the urban poor or the land required might be provided. It is essential to be able to estimate actual housing needs of the people, particularly those of the economically disadvantaged groups. (refer to section on urban poverty)
• Slow progress of implementation of Master Plan: There a lack of clarity over the departmental responsibilities for land use planning, development, maintenance and enforcement which have resulted in ineffective and uncoordinated decision-making and actions in the form of departure from the Master Plan Proposals.
• Land speculation: Discussions with local people and concerned departments suggests that the area of urbanisation of the city has occurred in an ad-hoc manner, often into the green areas. By and large the percentage of economic land holdings is reducing. In the expansion of settlements in particular, original land-owners of agricultural land and orchards have parcelled their holdings and sold at high prices. This is resulting in speculation by creating a false escalation in demand and price of land. This issue needs to be addressed in the Master Plan 2025.
• Deterioration of old buildings of historical importance: The old buildings of historical importance in terms of their heritage value, architecture or its use have been neglected in the past. A medium to long term strategy to conserve/preserve these deteriorating structures will not only restore the old character of the city but will also add to the tourism potential in the city.
In the short to medium term, it is highly likely that the next ‘boom’ cycle of development will occur. For the city to be in a position to effectively manage these future pressures in a manner which yields more developmental than speculative results, it will be necessary to seamlessly integrate the planning of the whole planning area to enable the peri-urban fringe to play its proper role in development.
3.4 Municipal Infrastructure
3.4.1 Water Supply
The first piped water supply was introduced in Dehradun in the 1885 from Kolukhet springs situated about 25 km. from Dehradun. This was a gravity flow system and subsequently more surface water sources were tapped and more area was covered under gravity flow in the northern part of Dehradun. Subsequently due to limited surface water sources, ground water sources are being exploited to supplement the water demand of the town which has been found to be successful.
The water supply of Dehradun is operated and maintained by Uttarakhand Jal Sansthan (UJS), an institution working under Department of Drinking Water, Government of Uttarakhand (GoU), who also constructs small works. Large capital works and overall planning are carried out by another corporation named as Uttarakhand Pey Jal Nigam (UPJN) also working under Department of Drinking Water. Although it is supposed to be a municipal function, Dehradun Nagar Nigam

Uttarakhand Urban Development Project
Dehradun City Development Plan Page 48
(DNN) is not involved in the planning, design, construction, operation, maintenance and service delivery of this important Urban Infrastructure. This section deals with the analysis of current situation of water supply, its problems, key issues and the likely scenario of water supply with respect to water demand, resources, system requirements and related aspects.
Water Sources and / Generation of Water
Ground water is the main sources of water for Dehradun City from which it meets about 76% of its total supply of 102.51MLD. The rest 24 % or about 24.54 MLD is drawn from the various sources of surface water, as shown in the Table 3.4.1.
Table 3.4.1: Present Availability of Water from Various Sources
S.No. Name of Sources Approximate quantity Available (MLD)
1. Bajpur canal 10.00 2. Badal River 6.00 3. Mosi fall 8.00 4. Kolhu khet 0.54 Total: Surface Sources 24.54
5. Tube wells 57 Nos. 77.97 Total 102.51
Since Dehradun is situated in a valley having large potential for ground water recharge, abstraction of ground water through deep tube wells have been proved to be quite successful. Presently 57 tubewells of diameter varying between 150 and 300 mm each about 120 m deep are supplying water to the town.
Treatment of Water
There are 2 water treatment plants (WTP) of capacity 20 and 14 MLD respectively catering to surface water sources. Both the WTPs are however working to under capacity based on availability of water at the sources and actually able to produce about 24.54 MLD. The WTP-1 at Dilaram Bazar is able to treat about 16 MLD as received from Bijapur Canal (10 MLD) and Bandal River (6 MLD). The WTP-2 at Sensai Ashram is able to treat about 8.54 MLD as received from Moussi fall (8 MLD) and Kolhu khet (0.54 MLD). A small quantity of treated water (about 3 MLD or less) is supplied to the adjoining villages from WTP-2 which is ignored in assessment of existing situation and calculation of future demand, considering such supply will remain to be part of the project and cannot be withdrawn. The WTPs comprise of settling tanks and rapid sand gravity filters followed by chlorination. The ground water is supplied directly after chlorination.
Distribution System
Dehradun is broadly divided into three water supply zones; Gravity flow zone, Pumping flow zone and mixed flow zone. The northern part of the town mainly Rajpur Road and localities around it falls under the gravity flow zone, while the southern part of the town including old city area receive water through pumping. The third zone has come into existence which is in between these two zones and can be called as mixed zone where water is supplied through pumping as well as from surface sources. Map 3.4.1 indicates the extent of water supply zones in the map of Dehradun.

D
D
D
DD
D
D
D
^
To M
usso
orie
To Sah
astrad
hara
To Raipur
To GurudwaraTo Haridwar
To Haridwar
To Saharanpur
CANTT AREA
To Chakrata
KARGI
MAJRA
RAJPUR
HARIPUR
KARANPUR
SALAWALA
DALANWALA
ADHOIWALA
DHARAMPUR
KAULAGARH
KAILASHPURI
PATEL NAGAR
KRISHNANAGARINDIRA COLONY DILARAM BAZAR
DEFENCE COLONY
CONNAUGHT PLACE
HATHIBARKALA ESTATE
DEHRADUN CANTTAREA
GHANTAGHAR
km1 0 1 2 3
UTTARANCHAL URBAN DEVELOPMENT PROJECTGOVERNMENT OF UTTARANCHAL
Data Source
Base Map prepared from Dehradun Guide Map (Survey of India) and Dehradun Nagar Nigam Map
M A P 3 . 4 . 1 : - W A T E R S U P P L Y Z O N E S
Legend
Municipal Boundary
National Highway
State Highway
Major City Road
Railway Line
River / Drain
Gravity Zone
Pumping Zone
Mixed Zone
: D E H R A D U NCITY DEVELOPMENT PLAN
Uttaranchal Jal Sansthan!

Uttarakhand Urban Development Project
Dehradun City Development Plan Page 50
Geographically the entire town is covered by the water supply network but with some missing feeder and branches to convey treated water to the entire population.
There are 44 Over Head Tanks (OHT)/Clear Water Reservoirs (CWR) serving the water supply system within the municipal limits. The combined storage capacity of these OHT and CWRs is 35,600 KL against a total supply of 102.51 MLD i.e. about 35 % of the total supply which is sufficient to cater present supply situation. However the locations of the storage tanks need to be examined during detailed engineering stage to achieve appropriate hydraulic efficiency of the distribution network. Map 3.4.2 shows existing and proposed reservoirs
The total length of distribution network in the town is 1964.35 km in addition to 119.65 km of rising mains from 57 tubewells. Map 3.4.3 shows existing and proposed tubewells. In several cases the distribution lines are buried under the middle of the road arising out of road widening programs. The old and dilapidated pipe lines in the old city area also give rise to frequent problems in service. Repairing of these pipelines is also poses various problems to the traffic system of the town.
There are 82,874 domestic water connections of which about 14% are provided to the adjoining rural areas. In addition there are 7,412 commercial connections and 780 community standposts provided from the network.
There is no proper record of actual number of households in Dehradun municipal area which DDN is now trying to establish. The estimated number of household in Dehradun is about 1,16,000 with an average household size of 4.7. The socio-economic survey revealed that about 9 % of the town population (51,000) is living in slums. Households belonging to the economically weaker section use standpost supply in a ratio of about 20 houses per standpost. Accordingly, the piped water supply coverage to the population of Dehradun can be presumed to be not more than 71%. To make up this gap about 90 numbers India mark-2 hand pumps are provided in strategic locations by UJS. The level of service in respect of supply hours is erratic. Generally, the water supply hours in the piped areas are about 4 hours twice a day but in low lying areas the supply continues beyond closing hours and also in some areas supply is available only once and that too in late night hours. There are at least 30 crisis localities where water supply is provided through tankers.
Unaccounted for Water (UFW)
No proper investigation and study have been conducted by any agency to determine a reasonable figure of Unaccounted for Water (UFW) in Dehradun water supply system. The UPJN/UJS however agrees that line and production losses of water are to the extent of about 30 %. The actual UFW may however be more than this. Some of the major reasons for high UFW are:
• Undetected leakages due to construction of metaled roads over the pipelineOpen zone boundaries allowing water to flow free from high pressure zones to low pressure zones resulting in some areas getting water supply for long hours beyond supply period developing a tendency of wastage and misuse of water.

D
D
D
DD
D
D
D
^
!
!
!
")")
")")
")
!
")") ")
")
$!!!
!!
!
")
!#*!
#*!
")
To M
usso
orie
To Sah
astrad
hara
To Raipur
To GurudwaraTo Haridwar
To Haridwar
To Saharanpur
CANTT AREA
To Chakrata
KARGI
MAJRA
RAJPUR
HARIPUR
KARANPUR
SALAWALA
DALANWALA
ADHOIWALA
DHARAMPUR
KAULAGARH
KAILASHPURI
PATEL NAGAR
KRISHNANAGARINDIRA COLONY DILARAM BAZAR
DEFENCE COLONY
CONNAUGHT PLACE
HATHIBARKALA ESTATE
DEHRADUN CANTTAREA
GHANTAGHAR
km1 0 1 2 3
UTTARANCHAL URBAN DEVELOPMENT PROJECTGOVERNMENT OF UTTARANCHAL
Data Source
Base Map prepared from Dehradun Guide Map (Survey of India) and Dehradun Nagar Nigam Map
M A P 3 . 4 . 2 : - E X I S T I N G & P R O P O S E D W A T E R R E S E R V O I R S
Legend
Municipal Boundary
National Highway
State Highway
Major City Road
Railway Line
River / Drain
")
#*
!
$
Existing Over Head Tank
Proposed Clear Water Reservoir
Proposed Over Head Tank
Existing Clear Water Reservoir
: D E H R A D U NCITY DEVELOPMENT PLAN
Dehradun Jal Sansthan & Field Studies!
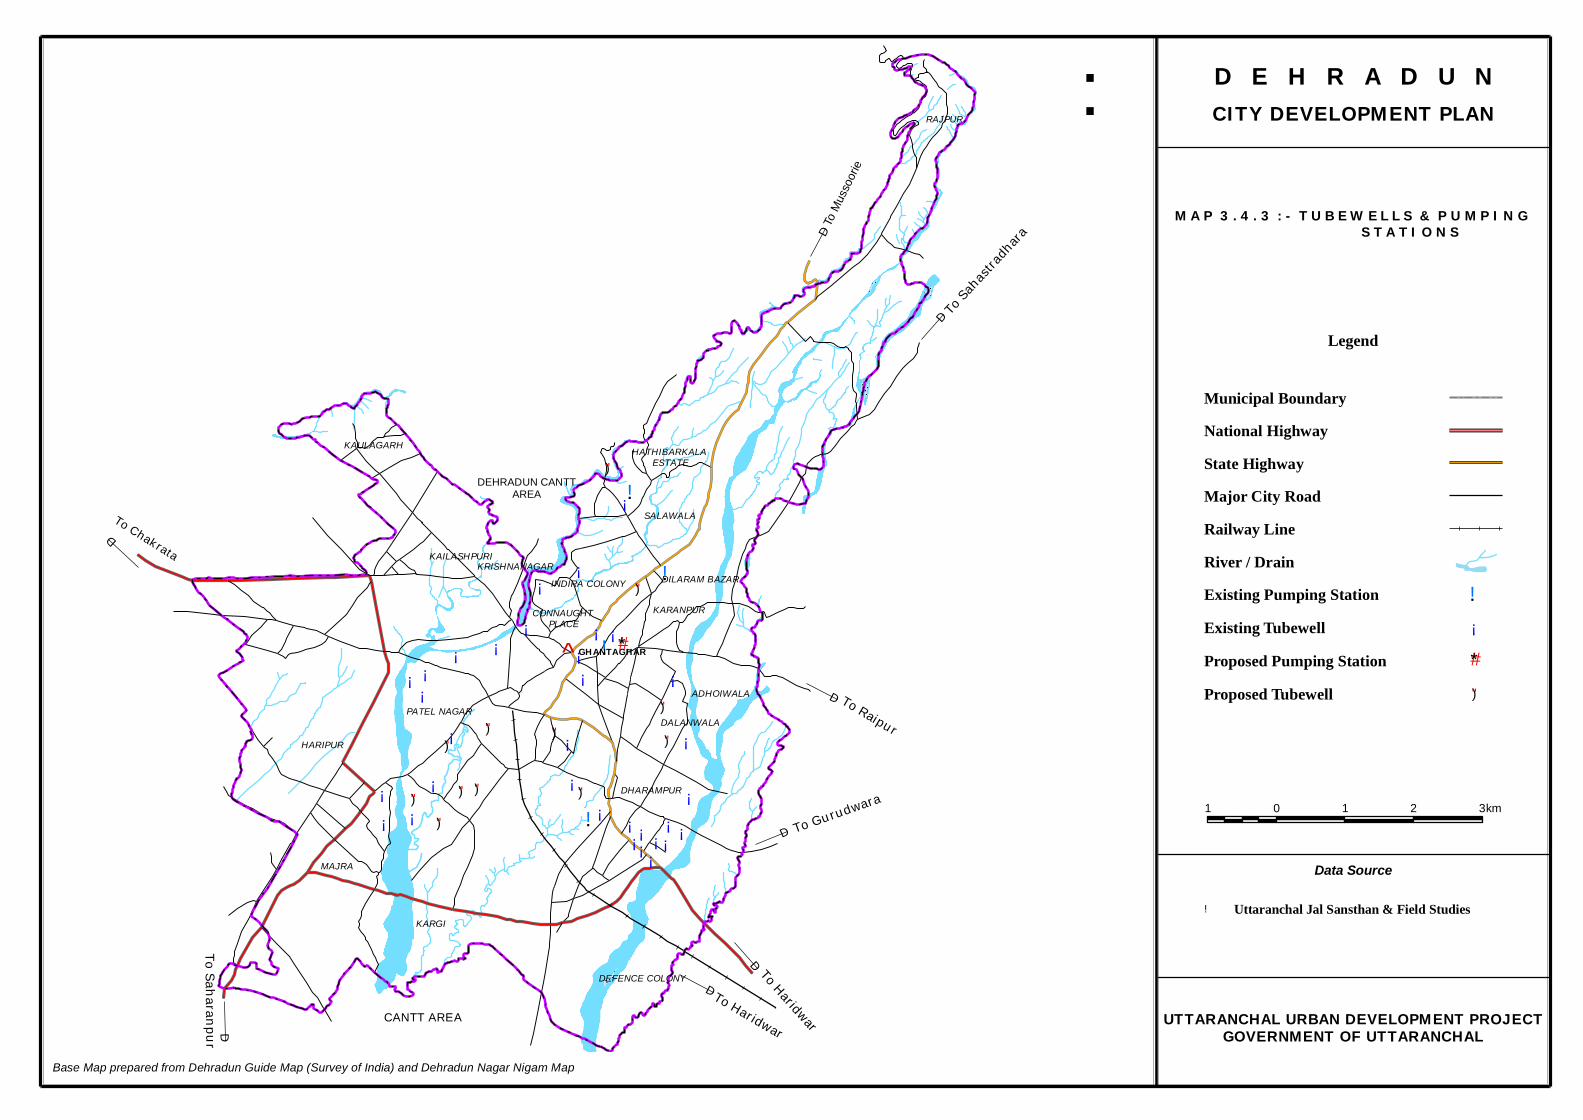
D
D
D
DD
D
D
D
¡¡¡¡
¡¡
¡
¡¡¡
!.¡
")¡
¡")")
")")
")
¡")
¡¡
¡
")¡
¡¡ ¡
¡¡
¡
¡")
")
¡¡
¡ !.#*¡¡
!.")
¡¡
¡!.
")
^
To M
usso
orie
To Sah
astrad
hara
To Raipur
To GurudwaraTo Haridwar
To Haridwar
To Saharanpur
CANTT AREA
To Chakrata
KARGI
MAJRA
RAJPUR
HARIPUR
KARANPUR
SALAWALA
DALANWALA
ADHOIWALA
DHARAMPUR
KAULAGARH
KAILASHPURI
PATEL NAGAR
KRISHNANAGARINDIRA COLONY DILARAM BAZAR
DEFENCE COLONY
CONNAUGHT PLACE
HATHIBARKALA ESTATE
DEHRADUN CANTTAREA
GHANTAGHAR
km1 0 1 2 3
UTTARANCHAL URBAN DEVELOPMENT PROJECTGOVERNMENT OF UTTARANCHAL
Data Source
Base Map prepared from Dehradun Guide Map (Survey of India) and Dehradun Nagar Nigam Map
M A P 3 . 4 . 3 : - T U B E W E L L S & P U M P I N G S T A T I O N S
Uttaranchal Jal Sansthan & Field Studies!
: D E H R A D U NCITY DEVELOPMENT PLAN
Legend
Municipal Boundary
National Highway
State Highway
Major City Road
Railway Line
River / Drain
!.
¡
#*
")
Existing Tubewell
Proposed Pumping Station
Proposed Tubewell
Existing Pumping Station

Uttarakhand Urban Development Project
Dehradun City Development Plan Page 53
• Out living its utility for some of the existing pipelines in old city area potential to frequent breakdown and leakages.
• General leakage from joints and valves in the distribution system. • Production losses due to reduction in efficiencies of old aging equipment and
filter beds in the water works. • Unauthorized tapping and duplicate connections. • Tampering with the ferrule sizes (i.e. changing a smaller ferrule by an
unauthorized bigger ferrule). • Wastage through the stand posts by the removal of taps. • Non recording of connections and consumption • Missing revenue collection from certain consumers.
Considering all these major causes that are prevalent in the Dehradun water supply system the total UFW is estimated to be not less than 30%.
Per Capita Water Supply
Considering 30% line and production losses the total quantity of water reaching to 5,80,000 population of the town (including a floating population of 35,000) is about 72 MLD. The average per capita supply rate may therefore be assumed as 124 litre per day which is slightly below the norm of 135 lpcd prescribed by the Central Public Health and Environmental Engineering Organization (CPHEEO) of Government of India. The supply rate varies throughout the town. Distribution of per capita water availability is shown in Map 3.4.4.
Water Quality
There is sometimes deterioration in the quality of water at times due to malfunctioning of the treatment plants. Many of the old pipes buried under the road in course of their widening develop leakages and remain undetected. It results in sucking back the outside water/sewage when supply is closed consequently polluting the water.
Operation and Maintenance
Uttarakhand Jal Sansthan bears the responsibility of maintenance of water supply system. During the study, field visits were made and detailed discussion were held with consumers (primarily citizens of Dehradun Nagar Nigam area) officials of both UJS and UPJN. The findings related to O and M are:
• Lack of standby power generation system to make up frequent interruptions in power supply.
• Low efficiency of old pumping machineries requiring replacement.
• Lack of adequate data base of transmission and distribution system there exists no drawing/map of distribution system, which is the basic information needed.

D
D
D
DD
D
D
D
^
To M
usso
orie
To Sah
astrad
hara
To Raipur
To GurudwaraTo Haridwar
To Haridwar
To Saharanpur
CANTT AREA
To Chakrata
KARGI
MAJRA
RAJPUR
HARIPUR
KARANPUR
SALAWALA
DALANWALA
ADHOIWALA
DHARAMPUR
KAULAGARH
KAILASHPURI
PATEL NAGAR
KRISHNANAGARINDIRA COLONY DILARAM BAZAR
DEFENCE COLONY
CONNAUGHT PLACE
HATHIBARKALA ESTATE
DEHRADUN CANTTAREA
GHANTAGHAR
km1 0 1 2 3
UTTARANCHAL URBAN DEVELOPMENT PROJECTGOVERNMENT OF UTTARANCHAL
Data Source
Base Map prepared from Dehradun Guide Map (Survey of India) and Dehradun Nagar Nigam Map
M A P 3 . 4 . 4 : - W A T E R A V A I L A B I L I T Y
: D E H R A D U NCITY DEVELOPMENT PLAN
Legend
Municipal Boundary
National Highway
State Highway
Major City Road
Railway Line
River / Drain
LPCD between 70 to 135
LPCD less than 70
LPCD more than 135
Uttaranchal Jal Sansthan & Field Studies!

Uttarakhand Urban Development Project
Dehradun City Development Plan Page 55
• Many rising mains are tapped and used as distribution main leading to large scale drop in pressure, wastage of energy and disruption in supply.
• The UFW rate is believed to be high resulting in large revenue losses.
• Low tariff and absence of metering contributing to large scale wastage; UJS has little or no means to control such wastage.
• Zones are generally interconnected with each other, resulting in uncontrolled transfer of water from zones in higher ground elevation to those in lower ground deviation.
Summary of present status of water supply system of Dehradun
Table 3.4.2 summarizes the present status of water supply system of Dehradun.
Table 3.4.2 Present Status of Dehradun Water Supply (2005-06)
S/N Item Quantity 1 Total Permanent Population in Municipal Area 5,80,000 2 (Permanent Population = 5,45,000 + Floating Population = 35,000) 3 Estimated households 1,16,000 4 Total No. of Domestic Connections. 21,272 5 Total No. of Commercial Connections. 7,412 6 Total No. of standpost 780 7 Total Length of Pipeline 2084 km 8 Total Nos. of Storage Tanks (OHT/CWR) 44 9 Total Capacity of Storage Tanks (OHT/CWR) 35,600 KL 10 Total No. of Tube well 57 11 Estimated line and production losses 30% 12 Average rate of per capita water supply 124 litre/day
Key Issues
Based on the above situation analysis, the following emerge as the key issues facing water supply system in Dehradun:
• Lack of adequate data base and maps on transmission and distribution system network.
• The zones are open and water of one zone freely travels to other zones.
• Unequal distribution of water resulting in acute shortage in several localities where water has to be supplied through tankers in the summer season
• Lack of pressure in the consumers’ end
• Deterioration in quality of water at times
• Inefficient network hydraulics with respect to tapping, pumping and balancing storage tanks causing lack of pressure
• In the intermittent supply system the tendency of the consumer is to keep the taps open throughout the supply increasing the peak factor and raising the chances of wastage of water

Uttarakhand Urban Development Project
Dehradun City Development Plan Page 56
• The old and dilapidated network develops leakages most of which are buried under roads and remain undetected. This resulting in sucking back the outside water when supply is closed consequently polluting the water supply
• Lack of standby power generation system at Tubewell Headworks as interruptions in power supply is frequent.
• Low efficiency of old pumping plants
• Many rising mains are tapped and used as distribution main leading to large scale drop of pressure, wastage of energy and disruption in supply.
• Abnormal growth in high density areas raising water demand with which the existing diameters of pipeline cannot cope.
• The cost of water recovered is many times lower than its production cost
3.4.2 Sewerage and Sanitation
Coverage of Sewerage Network
Sewerage system was introduced in Dehardun in 1921, which mainly consisted of surface drains, water flush latrine and short length intercepting sewers. Since, then it has been extended to various parts of the town.
The city is located at an altitude of 640 meters above mean sea level. The lowest altitude is 600 meters in the southern part, whereas the highest altitude is 1000 m on the northern part. The site of the city slopes gently north to South having a gradient of 1:37.5 and is heavily dissected by a number of seasonal streams and Nalas known as Khalas.
The drainage of the city is borne by the rivers namely Bindal and Rispana Rao. The direction of flow of streams and nallas in the eastern part is north to south (Bindal River) and in western part it is north to southwest (Rispana River).
At present, around 50 % of the population is covered with sewerage system. The probable reason was the effectiveness of septic tank and soak pit systems due to the higher depth of water table (80-100 m) and the availability of sandy-gravel strata.
Presently, there is no Sewage treatment Plant (STP) working in Dehradun. The collected sewage is either used for irrigation or directly disposed into Bindal and Rispana Rivers.
Based on the topography of the town and necessity of sewage treatment, the city is divided into 6 sewerage zones. Zone I: Bindal river drainage zone which collects sewage from eastern part of the city for the proposed Kargi STP. Zone II: Rispana River drainage zone which collects sewage from western part of the city for the proposed Daudwala STP. Zone III: Separate saucer shaped topographical zone in the eastern part of the city which collects sewage for the proposed Indira Nagar STP. Zone IV: Very small saucer shaped zone in the northern part of the city which collects the sewage for proposed Vijay Colony STP. Zone V: Small saucer shaped zone in the northern part of the city which collects the sewage for proposed Salawala STP. Zone VI: Very small saucer shaped zone in the northern

Uttarakhand Urban Development Project
Dehradun City Development Plan Page 57
part of the city which collects the sewage for proposed Doon Vihar STP. The area covered and characteristics of each zone are covered in Table 3.4.3
Table 3.4.3: Characteristics of Sewerage Zones
Zones Sub *Zones
Population (2006)
Sewage Generated
MLD
Area Covered Remarks
I Kargi A1-A9 D E1-E2 F1 I
328483 35.5 Dobhalwala, Chukkuwala, Luniya, Dandipur, Mannuganj, Paltan Bazar, Dhamawala, Kutchery road, Hanuman Chowk, Pipal mandi, Moti Bazar, Lakhibagh, Rithamandi, Khurbura, , Rajendra Nagar, Kaulagarh Road, ONGC Colony and Karanpur., Yamuna Colony, Sanjaywala, New Guru Road, New Park Road, Valmiki Basti, Gandhigram, Maharani Bagh, Mohit Nagar, Ballupur chowk. Race Course, Chandra Nagar, Rest Camp
• Bindal River drainage Zone, Covers Eastern part of the city. Gravity based system due to natural topography.
• 71 % of the population is covered with Sewerage.
II Daud-wala
B, C, L and M
149554 16.2 Dalanwala Area, Arya Nagar, Sewak Ashram, Prakash Vihar, Shastri Nagar, Ajabpur Danda, Chironwali Village, Kandoli, Kewal Vihar.
• Rispana River drainage Zone covers western part of the city. Gravity based system due to natural topography.
• 30 % population of Zone II covered with sewerage.
III Indira Nagar
H, A10 and E3
43157 4.7 Indira Nagar, Jal Nigam Colony, ITBP, Maharani Bagh, Mohit Nagar, Basanthali.
• Saucer shaped topography cannot be connected to main sewer of Kargi, Therefore separate STP is needed.
• 0% population covered with sewerage.
IV Vijay Colony
F2 6608
0.7 Vijay Colony Area
• Saucer shaped topography cannot be connected to main sewer of Kargi, Therefore separate STP is needed.

Uttarakhand Urban Development Project
Dehradun City Development Plan Page 58
Zones Sub *Zones
Population (2006)
Sewage Generated
MLD
Area Covered Remarks
• 100 % population is covered with sewerage.
V Sala-wala
A4 18481 2 Salawala Area • Saucer shaped topography cannot be connected to main sewer of Kargi, Therefore separate STP is needed.
• 0% population covered with sewerage.
VI Doon Vihar
G1 14623 1.6 Jakhan Area • Scarcely populated, not economical to connect to Kargi STP, Therefore separate STP is needed.
• 50 % of the population is covered with sewerage.
Others J,K 19094 2.1 Semi urban area of village Prempur Mafi., Saraswati Vihar, Ajabpur Khurd,
• Don’t fall under priority schemes.
• Partially covered with sewerage
* Sub Zones are zones considered by Uttarakhand PayJal Nigam.
Service Levels of Sewerage System
Service levels for sewerage collection and treatment is very poor. Out of the total 62.6 MLD sewage generated by 580,000 population only 32.1 MLD is collected. Rest 30.6 MLD is treated by individual septic tank and soak pit systems. Present gap in treatment capacity is 32 MLD. (Table 3.4.4)
Table 3.4.4: Service Levels of Sewerage System
Details Units Remarks Water Supply 102.5 MLD Actual Water Reached to Consumers 87 MLD 15 % distribution Loss Sewerage generated 62.7 MLD 28 % net supply loss Sewage Collected 32.1 MLD 80 % of water consumption Gap in treatment capacity 32 MLD 0 % treatment capacity
Treatment and Disposal of Sewage
Presently about 50 % of population of Dehradun is covered with sewerage systems. The collected sewage is used for sewage farming or discharged directly to Rispana or Bindal Rivers. Presently, there is no working sewage treatment plant in Dehradun.
Due to upliftment in economic and social status of inhabitants and rapid increase in population of the town in last five years, the public demand for health sanitary condition has been gathering mass attention for the last few years. The construction of new sewerage systems and STP are therefore an urgent need of today.
Therefore, funds are needed for the implementation of new sewerage schemes to increase the sewerage coverage from 51% to 95%, adoption of advanced on site and package sewage treatments for scarcely populated areas, construction on 6 new 97.5 MLD STP,s. These new proposed schemes can cater the Dehradun population for next 15 years i.e., until 2021. Different schemes are summarized in

Uttarakhand Urban Development Project
Dehradun City Development Plan Page 59
Table 3.4.5 for 95 % sewerage coverage and treatment. Details of existing and proposed sewerage facilities are provided in Annex 3.4.1. In addition, location of STPs is also provided therein.
Key Issues Including Current Difficulties and Future Demand
In the proposed scheme, the coverage is to be increased to 95 % and 100% treatment of collected sewage. However, if the coverage cannot reach to 95 %, implementation of on-site treatment for low density areas over the medium term is needed. In addition, implementation of package treatment systems for new residential and industrial establishments in peri-urban or scattered areas will be applicable.
Table 3.4.5: New Schemes for Sewerage Augmentation and Sewage Treatment
Zones Remarks I Kargi • New sewerage schemes for Sub Zone D(60 % population) = 800 lacs (20 km
sewer length) • New sewerage schemes for Sub Zone E1-E2 = 1974.6 Lacs (46 km sewer
length) • New sewerage schemes for Sub Zone I = 7512 Lacs (120.9 km sewer length) • New 56 MLD Capacity STP at Kargi outfall= 3360 Lacs. • 100 % Treated sewage and sludge reuse for agriculture.
II Daudwala • New sewerage schemes for Sub Zone C =1033.45 lacs (23.9 km sewer length)
• New sewerage schemes for Sub Zone L = 4476.35 Lacs (55.2 km sewer length)
• New sewerage schemes for Sub Zone M = 2297.61 Lacs (52.4 km sewer length)
• New 28 MLD Capacity STP at Daudwala= 1680 Lacs • Land acquisition cost for 28 MLD STP = 1000 Lacs. • 100 % Treated sewage and sludge reuse for agriculture.
III Indira Nagar
• New sewerage schemes for Sub Zone H = 2748.58 Lacs (44 km sewer length)
• New 8 MLD Capacity STP at Indira Nagar= 480 Lacs • Land acquisition cost for 8 MLD STP = 200 Lacs. • 100 % Treated sewage and sludge reuse for horticulture, recreational parks
and agriculture. IV Vijay Colony
• New 1 MLD Capacity STP at Vijay Colony = 100 Lacs. • 100 % Treated sewage and sludge reuse for horticulture, recreational parks
and agriculture. V Salawala • New sewerage schemes for Sub Zone A4 = 100 Lacs (52.4 km sewer length)
• New 3 MLD Capacity STP at Salawala = 300 Lacs • Land acquisition cost for 28 MLD STP = 200 Lacs • 100 % Treated sewage and sludge reuse for horticulture, recreational parks
and agriculture. VI Doon Vihar
• New 1.5 MLD Capacity STP at Doon Vihar = 150 Lacs. • 100 % Treated sewage and sludge reuse for horticulture, recreational parks
and agriculture. Others • On Site Sanitation is needed.
There is no information available on the length and diameters and profile of the existing sewerage system, therefore a GIS and SEWERCAD software assisted database of the existing system is needed. The databases would be very useful in implementing proposed schemes for sewerage.
At present, sever clogging is observed in some areas, the most common reason is the dumping of municipal solid waste in the manhole chambers, therefore a comprehensive solid waste management plan should be prepared for the prevention of entering municipal solid waste in the sewer line.

Uttarakhand Urban Development Project
Dehradun City Development Plan Page 60
Operation and maintenance of STP’s is a very critical matter, therefore Action plan for proper O and M of STP’s is needed. Encourage pay and use category of public conveniences with community involvement in the maintenance of the same. It is observed that currently sewerage is not covered by way of user charges; only sewerage service charges @ 4% of taxable amount are collected as part of property tax. Thus project committee should move towards separate user charge for sewerage or incorporate a cess on water supply charge.
The strategy is to be formulated for 100 % treated sewage and sludge reuse for agriculture, horticulture, ornamental purposes such as recreational parks. For large STPs, anaerobic digestion of sludge is to be adopted to recover biogas for operating dual fuel generators during the power supply cut-off.
New technologies based on aerobic treatment are needed for sewage treatment. The main criteria of selection of these technologies are the high effluent quality, low land requirement, no odour, vector or nuisance and less operation and maintenance.
3.4.3 Storm Water Drainage
Climate and Rainfall
Dehradun is generally hot in summers, and cold in the winters. The temperature fluctuates between 360 in the hottest months of May and June to near freezing point in January.
Dehradun receives an average annual rainfall of about 2050mm. The maximum rainfall occurs in July and August amounting over 1200 mm of rainfall.
The average climatic data for the last 25 years is given in the following Table 3.4.6.
Table 3.4.6: Climatic Data
Temperature Month Rainfall (mm) Relative Humidity (%)
Maximum Minimum Average January 46.9 91 19.3 3.6 10.9 February 54.9 83 22.4 5.6 13.3 March 52.4 69 26.2 9.1 17.5 April 21.2 53 32 13.3 22.7 May 54.2 49 35.3 16.8 25.4 June 230.2 65 34.4 29.4 27.1 July 630.7 86 30.5 22.6 25.1 August 627.4 89 29.7 22.3 25.3 September 261.4 83 29.8 19.7 24.2 October 32.0 74 28.5 13.3 20.5 November 10.9 82 24.8 7.6 15.7 December 2.8 89 21.9 4.0 12.0 Annual Average 2051.4 76 27.8 13.3 20.0
Drainage System
Practically the whole town, wherever Roads or brick pavement exist have some or the other kind of side drains leading to storm water drains except in slums or some parts of peripherals areas which have recently been included in the limits of Nagar Nigam. However, the conditions of most of the drains need cleaning remodelling and repairs.

Uttarakhand Urban Development Project
Dehradun City Development Plan Page 61
Due to hilly terrain Dehradun City has a natural drainage pattern with sufficient gradients to drain off storm water easily in to the two main natural drainage channels i.e. rivers Bindal and Rispana. Asan, Tons and Dulhani rivers discharges in these two rivers directly or through their tributaries. The slope of both the main rivers i.e. Rispana and Bindal is from North to South.
There are 8 Nos. of drainage basing covering the town as given below.
• Bindal Basin
• Bindal Sub basin No.1
• Bindal Sub Basin No.2
• Bindal Sub Basin No.3
• Rispana Basin
• Asan River Basin
• Dulhani River Basin
• Tons River Basin
The Names of the main drains discharging their flow in to Rispana and Bindal rivers and the catchment areas draining to these are given below.
Rispana River
S.No. Name of the Drains Length Areas connected with the drains 1.
I.T Park Drain 2.8 km. 3 to 5m i) Dhoran village
ii) Sahastra Dhara Road iii) Rajeshwar Rao Nagar
2. Mayur Vihar drain 5.4 km width 3 to 5 km
i) Sondhowali ii) Chindowali iii) Mayurvihar iv) Keval vihar v) Suman Puri vi) State Bank colony.
3. Ambiwala Gurudwara Nala
6km 3 to 4m
i) Badrish colony ii) Jyoti vihar iii) Dharampur Danda iv) Shastri Nagar v) Defence colony vi) Inderpur
4. Nehru colony I block byepass
3.7 km width 1.5m
i) Nehru colony ii) Haridwar road iii) Pragati vihar iv) Saket colony v) Rispana puram vi) Dharampur
5. Survey Chowk upto Raipur Road Deal
3 km width 1.2m
i) Karanpur ii) Old Dalanwala iii) Vikas lane iv) Azad colony v) Adarsh vihar vi) Deal colony
6. Nala PaniChowk 1km width 1.2km
i) Vikas lane colony D-2,3,4. ii)Keval vihar iii)Sumanpuri iv)Nala Pani Road.

Uttarakhand Urban Development Project
Dehradun City Development Plan Page 62
Bindal River
S.No. Name of the Drains Length / (km) width (m) Connected areas 1. From Brijlok to New
Cant Road Nala. 4.5 km width 6m
i) Salawala ii) Chandralok colony iii) Dilaram Bazar iv) New cant. Road v) Rajpur Road
2. Mannu Ganj Nala 4.8 km 3m to 5m
i) Ghantaghar to Moti Bazar
ii) Neshvilla Road iii) Mannu ganj iv) Moti Bazar v) Anand chowk vi) Dandipur vii) Khadri viii) Jilak Road
3. Govind Garh Nala 2.5km. 2.5 to 4.0m
i) Shanti vihar ii) Teacher colony iii) Rajendra nagar iv) Saiyyed Mohalla v) Yamuna Colony
4. Chorkhala Nala 1.0 km. 2m to width
i) Mitralok ii) Deeplok iii) Aakash deep iv) Rajendra bag B-
Block 5. Bhandari Bagh Nala 3.5km.
4 to 6m i) Lakhi Bagh ii) Vishwakarma colony iii) Bhandari bagh. iv) Pathari Bagh v) THDC colony
6. Chandra Nagar to Race course drain
5.5 km. 2 to 5m width
i) Haridwar Road ii) Race course iii) Chander Nagar iv) Police line v) Race cource A,B,C
Block vi) Saraswati Vihar.
7. Subhash Road- Police head office
4km 1.5m
i) Subhash Road ii) Cross Road iii) New Survey Road iv) New Road v) Kachahri Road vi) Chander Nagar
8. Asian School Nala 2.2 km 3m
i) Ganga Vihar ii) Kalindi Enclave iii) Kanwali village iv) Engineer Enclave v) Om vihar vi) Shastri Nagar
Situation Analysis
To accommodate increased storm water run-off due to growing urbanization, some parts of these drains were lined with stone or brick masonry. Covers have also been provided over some lengths. Field visits reveal that the main drainage channels are heavily silted because garbage is routinely thrown into these channels often packed in polythene bags. This causes a formidable problem as the polythene slows down the disintegration of the degradable material packed in side. Thus most of the main drains are in a bad shape at present and need repairs, reconstruction and other works in nearly 50% of their lengths.

Uttarakhand Urban Development Project
Dehradun City Development Plan Page 63
Although the area of the town is well drained, there are certain localized problems leading to in sufficient drainage and water logging during heavy rains. The following table provides a list of water logged areas. Possible causes are also mentioned.
Catchment areas of town draining into various rivers are given in Table 3.4.7.
Table 3.4.7: Catchment Aeas of Town Draining into Various Rivers
S. No.
Catchment Area Receiving stream/river
1 North, Central and southern part of Dehradun i.e., Johri Road in North, Moti Bazar, Paltan Bazar and area around kaonli Road in west.
R. Bindal
2 (North and Eastern part of Dehradun) Rajpur Canal road (North) Laxmi road, Subhash Road, Haridwar Road, E.C Road and Dhampur in East
R. Rispana r
3 Localities in east like Danda Dulhani Nadi 4 South- western part of the town)
Area around chakrate Road, Simadwar Road, GMS Road, Panditwari Road and Niranjanpur.
R. Asan
5 Western part of the town) Area around kaula garh Road, Sirmour Marg, Canal Road etc.
Tons River
Table 3.4.8: List of Water Logged Areas
S.No. Name of Locality Probable causes 1. Panditwadi The Drain closed by I.M.A 2. Bhnd village Drain closed 3. Darshan Lal Chowk Undersized drains 4. Race Course Drain Inadequate size 5. Subhash and Patel Road Obstruction to discharge in to road
side drain 6. Sevak Ashram Road and D.L Road area Improper side drains 7. Dalanwala Area Improper side drains 8. Nehru colony Area Encroachment on drains 9. Ajabpur Area by pass Drains non existent 10. Bhagat Singh Colony Unplanned growth of colonies 11. Rajiv Nagar, Haridwar Road Lack of proper drains
On inspection of the Mannu Ganj drain which is one of the biggest drains passing through the main town it was found that on Ghanta Ghar to ONGC road crossing a major length has been covered under the Prabhat Cinema compound without provision of manhole chambers. Towards North of this spot houses have been constructed without leaving any approach to the drain. Similar is the case with the drain flowing along Paltan Bazar which has been encroached upon by the Shopkeepers.
The minimum that can be done to facilitate cleaning and maintenance of such drains is to provide bigger size man holes 900mm.dia at 30 m Intervals, besides living and reconstruction in necessary stretches.
Key issues Including Current Deficiencies and Future Demand
• Due to faster growth of population and rapid increase in the land prices habitation has extended to the low lying areas which do not have proper drainage outlets.

Uttarakhand Urban Development Project
Dehradun City Development Plan Page 64
• Dumping of garbage, particularly plastics, causes serious reduction in waterways of main drainage channels
• Encroachments both by poor and often other sections resulted not only constriction of waterway but also problems of access for repair and maintenance activities
• In the old city areas, space for construction of roadside drains is a major problem
• 60% to 70% of the houses which do not have a sewer connection or a Septic tank are discharging their toilet waste in to the existing drains, causing series environmental problems.
• Decrease in green areas i.e., parks and gardens and increase in built up areas has increased the runoff in side the town.
• Due to cutting of forests and depletion of green cover the top soil of the surrounding hills is being eroded causing accumulation of silt in the rivers causing over flow and back flow of water in residential and commercial areas.
3.4.4 Solid Waste Management
Municipal Solid Waste Generation
According to the “Dehradun Nagar Nigam (DNN)” the city on an average, generates about 200 MT of MSW per day. The assessment is based on the assumption of per capita generation @ 0.4kg/capita/day. Besides domestic, other major sources of MSW generation of the city are shops and commercial establishments, hotels and restaurants and fruit and vegetable markets.
Waste Composition and Characteristics
DNN has carried out MSW composition and characteristic analysis for the city through Andhra Pradesh technology Development and Promotion Centre. The result of the analysis suggests the following composition of the city MSW. (Table 3.4.9)
Table 3.4.9: Composition of MSW in Dehradun
Source: Dehradun Municipal Corporation
Constituent Composition (%) Organic Matter/Bio-Mass 65.0 Paper 3.5 Rags/Textiles 6.0 Plastics 7.0 Glass 1.5 Rubber/Leather 1.5 Metal 0.5 Stones 8.0 Sand/Earth 7.0
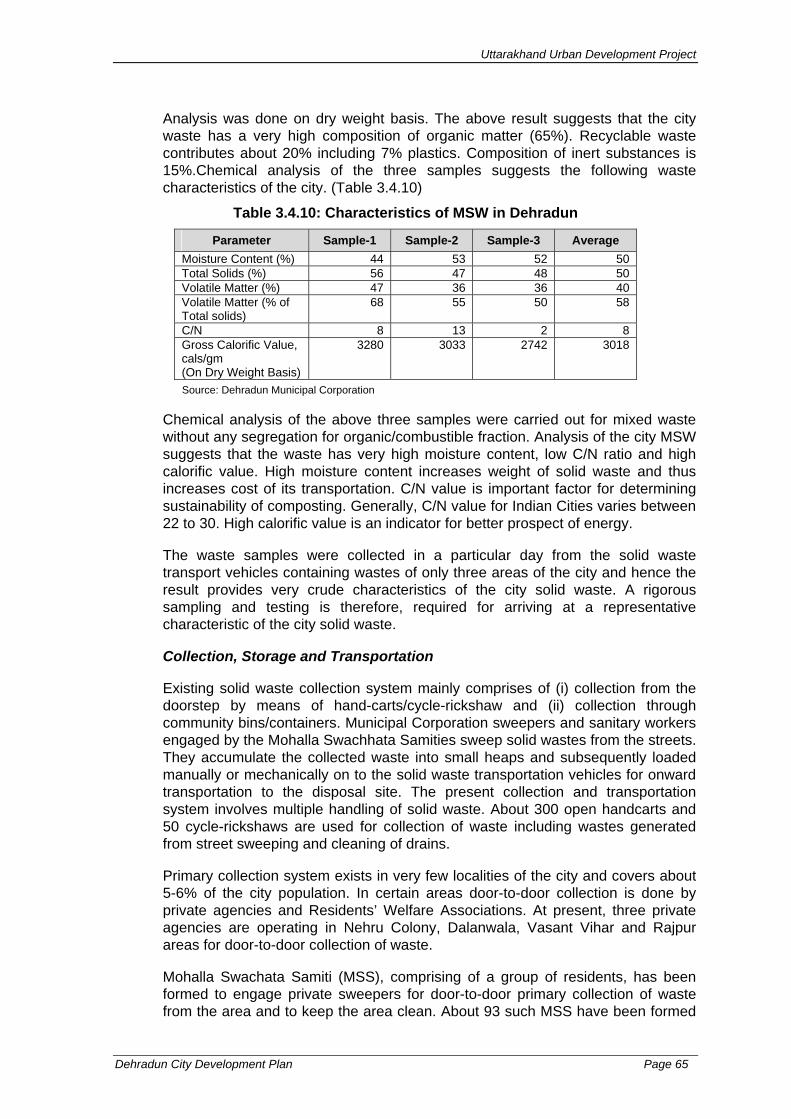
Uttarakhand Urban Development Project
Dehradun City Development Plan Page 65
Analysis was done on dry weight basis. The above result suggests that the city waste has a very high composition of organic matter (65%). Recyclable waste contributes about 20% including 7% plastics. Composition of inert substances is 15%.Chemical analysis of the three samples suggests the following waste characteristics of the city. (Table 3.4.10)
Table 3.4.10: Characteristics of MSW in Dehradun
Parameter Sample-1 Sample-2 Sample-3 Average Moisture Content (%) 44 53 52 50 Total Solids (%) 56 47 48 50 Volatile Matter (%) 47 36 36 40 Volatile Matter (% of Total solids)
68 55 50 58
C/N 8 13 2 8 Gross Calorific Value, cals/gm (On Dry Weight Basis)
3280 3033 2742 3018
Source: Dehradun Municipal Corporation
Chemical analysis of the above three samples were carried out for mixed waste without any segregation for organic/combustible fraction. Analysis of the city MSW suggests that the waste has very high moisture content, low C/N ratio and high calorific value. High moisture content increases weight of solid waste and thus increases cost of its transportation. C/N value is important factor for determining sustainability of composting. Generally, C/N value for Indian Cities varies between 22 to 30. High calorific value is an indicator for better prospect of energy.
The waste samples were collected in a particular day from the solid waste transport vehicles containing wastes of only three areas of the city and hence the result provides very crude characteristics of the city solid waste. A rigorous sampling and testing is therefore, required for arriving at a representative characteristic of the city solid waste.
Collection, Storage and Transportation
Existing solid waste collection system mainly comprises of (i) collection from the doorstep by means of hand-carts/cycle-rickshaw and (ii) collection through community bins/containers. Municipal Corporation sweepers and sanitary workers engaged by the Mohalla Swachhata Samities sweep solid wastes from the streets. They accumulate the collected waste into small heaps and subsequently loaded manually or mechanically on to the solid waste transportation vehicles for onward transportation to the disposal site. The present collection and transportation system involves multiple handling of solid waste. About 300 open handcarts and 50 cycle-rickshaws are used for collection of waste including wastes generated from street sweeping and cleaning of drains.
Primary collection system exists in very few localities of the city and covers about 5-6% of the city population. In certain areas door-to-door collection is done by private agencies and Residents’ Welfare Associations. At present, three private agencies are operating in Nehru Colony, Dalanwala, Vasant Vihar and Rajpur areas for door-to-door collection of waste.
Mohalla Swachata Samiti (MSS), comprising of a group of residents, has been formed to engage private sweepers for door-to-door primary collection of waste from the area and to keep the area clean. About 93 such MSS have been formed
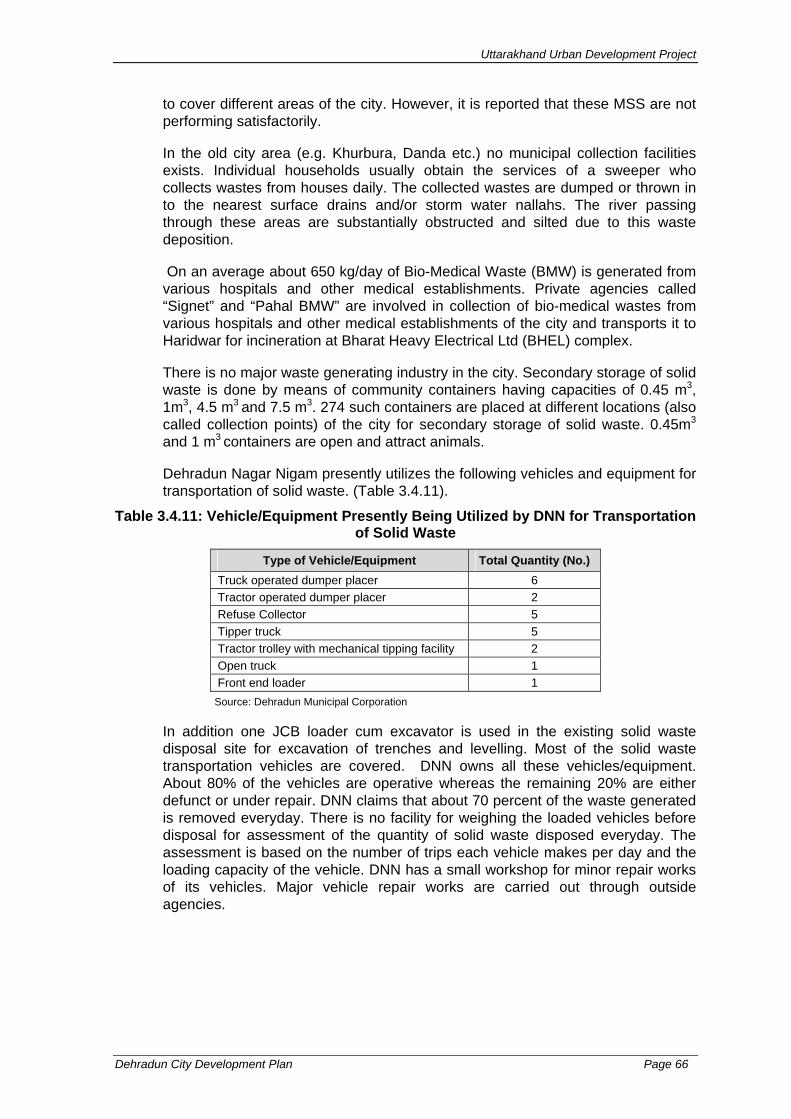
Uttarakhand Urban Development Project
Dehradun City Development Plan Page 66
to cover different areas of the city. However, it is reported that these MSS are not performing satisfactorily.
In the old city area (e.g. Khurbura, Danda etc.) no municipal collection facilities exists. Individual households usually obtain the services of a sweeper who collects wastes from houses daily. The collected wastes are dumped or thrown in to the nearest surface drains and/or storm water nallahs. The river passing through these areas are substantially obstructed and silted due to this waste deposition.
On an average about 650 kg/day of Bio-Medical Waste (BMW) is generated from various hospitals and other medical establishments. Private agencies called “Signet” and “Pahal BMW” are involved in collection of bio-medical wastes from various hospitals and other medical establishments of the city and transports it to Haridwar for incineration at Bharat Heavy Electrical Ltd (BHEL) complex.
There is no major waste generating industry in the city. Secondary storage of solid waste is done by means of community containers having capacities of 0.45 m3, 1m3, 4.5 m3 and 7.5 m3. 274 such containers are placed at different locations (also called collection points) of the city for secondary storage of solid waste. 0.45m3 and 1 m3 containers are open and attract animals.
Dehradun Nagar Nigam presently utilizes the following vehicles and equipment for transportation of solid waste. (Table 3.4.11).
Table 3.4.11: Vehicle/Equipment Presently Being Utilized by DNN for Transportation of Solid Waste
Type of Vehicle/Equipment Total Quantity (No.) Truck operated dumper placer 6 Tractor operated dumper placer 2 Refuse Collector 5 Tipper truck 5 Tractor trolley with mechanical tipping facility 2 Open truck 1 Front end loader 1
Source: Dehradun Municipal Corporation
In addition one JCB loader cum excavator is used in the existing solid waste disposal site for excavation of trenches and levelling. Most of the solid waste transportation vehicles are covered. DNN owns all these vehicles/equipment. About 80% of the vehicles are operative whereas the remaining 20% are either defunct or under repair. DNN claims that about 70 percent of the waste generated is removed everyday. There is no facility for weighing the loaded vehicles before disposal for assessment of the quantity of solid waste disposed everyday. The assessment is based on the number of trips each vehicle makes per day and the loading capacity of the vehicle. DNN has a small workshop for minor repair works of its vehicles. Major vehicle repair works are carried out through outside agencies.

Uttarakhand Urban Development Project
Dehradun City Development Plan Page 67
Waste Disposal
The existing solid waste disposal site is located at Dateda Lakhond on Sahashradhara Road and at a distance of about 7 km from the town. The site (area approx. 4 ha) is being used for last 3 years.
Figure 3.4.1 Existing Solid Waste Figure 3.4.2 Pre-Excavated Trench Disposal Site for Disposal of Solid Waste
Solid waste brought to the site, is disposed into pre-excavated trench and covered with a layer of soil (Refer Figure 3.4.2). DNN has identified 15 acres of land at Selaqui, located at a distance of about 22 km from the city for future solid waste disposal. The locations of existing and proposed solid waste disposal sites are shown in Map 3.4.5.
Disposal of Carcass: At present the dead animals are disposed in two places namely Bhandari Bagh and Kargi. These localities are getting populated day by day. Shifting of the carcass disposal site therefore becomes essential to avoid further environmental degradation of these areas. Uttarakhand Government has already taken initiatives by identifying four alternative sites at different locations outside the city limits for future disposal of dead animals.
Institutional Setup
Public Health Department (PHD) of DNN is responsible for solid waste management of the city. The Senior Health Officer heads the department and Zonal Sanitary Officers, Chief Sanitary Inspectors, Inspectors and Supervisors support him. The Organization Structure of the PHD is furnished in Figure 3.4.3.
DNN has divided the 45 municipal wards into 5 SWM Circles for better management of solid waste. Wards covered under each SWM Circles are presented in Table 3.4.12.
Table 3.4.12: Wards Covered Under Different Solid Waste Management Circles
S. No. SWM Circle Total Wards Municipal Wards
1 Circle-1 16 1 to 13,40,42 and 45 2 Circle-2 06 14,15,16,29 to 31 3 Circle-3 10 19 to 24, 35,41,43 and 44 4 Circle-4 09 17,18,25 to 28 and 32 to 34 5 Circle-5 04 36 to 39
Source: Dehradun Municipal Corporation
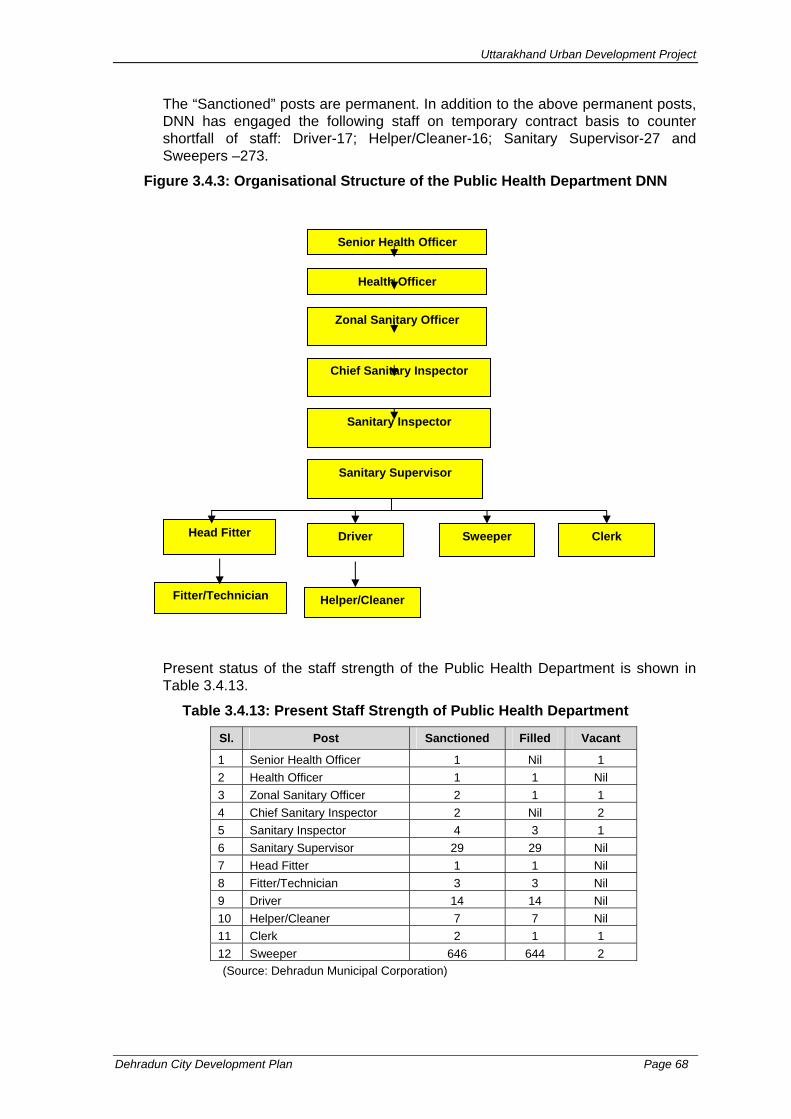
Uttarakhand Urban Development Project
Dehradun City Development Plan Page 68
The “Sanctioned” posts are permanent. In addition to the above permanent posts, DNN has engaged the following staff on temporary contract basis to counter shortfall of staff: Driver-17; Helper/Cleaner-16; Sanitary Supervisor-27 and Sweepers –273.
Figure 3.4.3: Organisational Structure of the Public Health Department DNN
Present status of the staff strength of the Public Health Department is shown in Table 3.4.13.
Table 3.4.13: Present Staff Strength of Public Health Department
Sl. Post Sanctioned Filled Vacant
1 Senior Health Officer 1 Nil 1 2 Health Officer 1 1 Nil 3 Zonal Sanitary Officer 2 1 1 4 Chief Sanitary Inspector 2 Nil 2 5 Sanitary Inspector 4 3 1 6 Sanitary Supervisor 29 29 Nil 7 Head Fitter 1 1 Nil 8 Fitter/Technician 3 3 Nil 9 Driver 14 14 Nil 10 Helper/Cleaner 7 7 Nil 11 Clerk 2 1 1 12 Sweeper 646 644 2 (Source: Dehradun Municipal Corporation)
Health Officer
Zonal Sanitary Officer
Chief Sanitary Inspector
Sanitary Inspector
Sanitary Supervisor
Head Fitter Driver Sweeper Clerk
Fitter/Technician Helper/Cleaner
Senior Health Officer

D
D
D
DD
D
D
D
")!(
^
To M
usso
orie
To Sah
astrad
hara
To Raipur
To GurudwaraTo Haridwar
To Haridwar
To Saharanpur
CANTT AREA
To Chakrata
KARGI
MAJRA
RAJPUR
HARIPUR
KARANPUR
SALAWALA
DALANWALA
ADHOIWALA
DHARAMPUR
KAULAGARH
KAILASHPURI
PATEL NAGAR
KRISHNANAGARINDIRA COLONY DILARAM BAZAR
DEFENCE COLONY
CONNAUGHT PLACE
HATHIBARKALA ESTATE
DEHRADUN CANTTAREA
GHANTAGHAR
km1 0 1 2 3
UTTARANCHAL URBAN DEVELOPMENT PROJECTGOVERNMENT OF UTTARANCHAL
Data Source
Base Map prepared from Dehradun Guide Map (Survey of India) and Dehradun Nagar Nigam Map
M A P 3 . 4 . 5 : - L O C A T I O N O F S O L I D W A S T E D I S P O S A L S I T E S
Dehradun Nagar Nigam & Field Visits!
: D E H R A D U NCITY DEVELOPMENT PLAN
Legend
Municipal Boundary
National Highway
State Highway
Major City Road
Railway Line
River / Drain
!(
")
Existing Solid Waste Disposal Site
Proposed Solid Waste Disposal Site
Approx 10 km
D

Uttarakhand Urban Development Project
Dehradun City Development Plan Page 70
Key Issues and Current Deficiencies
The major issue of the SWM is non-compliance of the Municipal Solid Waste (Management and Handling) Rules, 2000 by the DNN. DNN has failed to comply with the rules in all aspects of SWM i.e. Collection, Storage, Transportation, Processing, Disposal of MSW of the city and Institutional Reform. DNN has prepared an Action Plan for SWM for Dehradun City to comply with an order of the Honourable Supreme Court, but implementation of the action plan is still awaited. Other important issues along with the deficiencies in the present SWM system are enumerated as follows:
• Solid Waste Quantification and Characterization: Proper quantification of waste is an important factor for assessment of equipment, vehicles and manpower. Representative characterization of the city waste is essential for determining appropriate waste processing and disposal methods. Quantification of the city solid waste has not considered the factor such as waste generation from sources other than domestic source. Waste characterization is done on the basis of sampling of waste in few areas of the city for a single day. This may not give representative sample for the whole city.
• Segregation of Waste at Source: At present, there is no segregation of waste at source.
• Primary Collection of Waste: Present collection system is irregular, ineffective and inefficient. A significant part of the waste is left unattended. This waste not only degrades the environment but also block storm water drains.
• Community and Private Participation: Although DNN has initiated community involvement and private participation by forming MSS and outsourcing a small part of the city to private agencies for primary collection of waste, a lot of improvement is necessary in the level of services. According to the DNN the level of services of the private agencies is satisfactory whereas most of the MSS are failing to perform.
• Improvement in SW Transportation System: The present SW transportation system lacks the following: Proper routing of vehicles for transportation of waste to the
disposal site. Waste Transfer Station to minimize time and distance of travel of
the solid waste transport vehicles. This will reduce cost of transportation and increase efficiency of the vehicles.
Inadequate and upgraded vehicle and equipment Modern record keeping and communication facilities
• Safe Disposal of Waste: A part of the solid waste generated is disposed into open lands, streets, surface drains; hill slopes etc and sometimes burnt in open causing health hazards, public nuisance and degradation of environment and aesthetics. The existing disposal site at Dateda Lakhond has the following major shortcomings:
The disposal site was selected without fulfilling the site selection criteria

Uttarakhand Urban Development Project
Dehradun City Development Plan Page 71
Unsegregated waste is disposed in the site without any processing.
Bio-degradable wastes are not processed separately. No provision for gas venting and leachate collection. No monitoring of level of pollution at the disposal site. Lack of basic infrastructural facilities such as fencing, proper
road, office building, and vehicle/equipment shed etc.
The land identified at Selaqui as propose solid waste disposal site is located close to the river Sarna. A mental hospital is also situated adjacent to the disposal site. Overhead High Tension power line passes over the site. Necessary environmental approval is required for this site before its final selection is made as a disposal site. No environmentally approved site has so far been selected as future solid waste disposal site. The area of the site is also inadequate as a long term landfill site.
• Health and Hygiene of Sanitary Workers: Under the present SWM activities manual handling of waste is involved starting from collection up to the disposal of waste. During the process, the sanitary workers are exposed to the waste. No protective measures have been taken for safety, health and hygiene of these workers who are vulnerable to the health hazards.
• Public Awareness: No major initiatives have been taken so far by the DNN to educate people on the ill-effects of haphazard disposal of solid waste.
3.4.5 Roads and Transport
Road Network, Junctions and Traffic Management Existing situation – Road Network
The city is connected to other parts of the state through various radial roads. These roads are originating from the city core with Rajpur road, Haridwar road, Saharanpur road and Chakrata Road and forming the major travel corridors. NH-72 passes through the city connecting Rishikesh and Haridwar in the east to Himachal Pradesh in the western side. NH-72A connects the city with Saharanpur in the S-W and Roorkee in the south. Other important roads in the city are Kaulagarh road, Raipur road, Sahastradhara road, Kanwli Road, New Cantonment Road, Subhas Road and East Canal Road. This city is also connected by rail with the other parts of the country. Dehradun city comprises of 463 km of roads of which 363 km are maintained by Municipal Corporation and 130 km are maintained by PWD. The traffic carrying capacities are low due to limited widths, intense land use and encroachments.
Junctions
It has been observed that junctions has not been designed properly, i.e.
• No proper channelisation for the free left turn
• Lack of footpath on approaches of the junctions
• No planned pedestrian zebra crossing

Uttarakhand Urban Development Project
Dehradun City Development Plan Page 72
• Haphazard parking on the approaches of the junction
• Lack of proper signalization system as per the requirement for the smooth traffic movement
Poor geometry at Vidhan sabha junction Poor geometry at Prince chowk
On the basis of observation, discussion with Traffic Police personnel, Municipal Corporation and PWD Engineers, mainly following junctions are having above short-comings: 1. Darshan lal chowk 2. Clock Tower chowk 3. Prince Chowk 4. Saharanpur Chowk 5. Balliwalla chowk 6. Karghi chowk 7. Vidhan Sabha twin junction 8. ISBT chowk 9. Junction near Bindal River on Chakrata road 10. Jogiwala chowk 11. Raja road junction on Gandhi road 12. Tehsil chowk on Gandhi road 13. Globe chowk near Premier motor 14. Araghar junction 15. Ballupur chowk 16. Ashley Hall Junction 17. Kishan Nagar Junction 18. Sahastradhara crossings 19. Employment office crossings 20. Dharampur chowk 21. Race course chowk 22. Junction near sabzi mandi on Saharanpur road 23. Buddha park chowk (Tri Murti Tiraha) 24. Lansdown chowk 25. Kanak chowk

Uttarakhand Urban Development Project
Dehradun City Development Plan Page 73
26. Dilaram chowk on Rajpur road 27. Junction near GMS extension at Shimla road. 28. Mathurowala chowk 29. Junction near Dwarka store on EC road 30. Y junction near Masjid Dharampur 31. St Jude School junction 32. Kamla palace junction on GMS road 33. Junction near M K P school on Subhash road 34. Baini bazaar chowk 35. Kaulaghar chowk
Traffic signal is not working properly on the following junctions:
• Raipur road-Sahastradhara road junction
• Saharanpur Chowk
• Ballupur chowk
Existing Situation - Traffic Flow, Congestion and Management
Following parameters which are observed causing congestion of traffic.
• Inadequate width of the road
• Encroachments
• Street hawkers
• unplanned on-street parking
• Heterogeneity of traffic
• Pedestrian flow
• Improper turning of traffic
• Lack of median on important roads
• More no. of median gaps
• Lack of traffic signals, road markings, guard rails etc
• Lack of enforcement of traffic rules
• Similar timing of 2 cinema theatres on chakrata road
The intensity of daily traffic volume is observed as per Rites study (2004), 42200 pcu on Saharanpur road, 39000 pcu on Rajpur road, 38000 pcu on Ganhi road, 30300 pcu on Chakrata road. The average share of peak hour traffic on these roads is about 10%, but in the central part of the area the peak hour traffic is 11.5%.
Mostly all roads are having 2-way traffic movement barring a few exemptions. There is a large tempo attraction in the CBD area due to the presence of offices,

Uttarakhand Urban Development Project
Dehradun City Development Plan Page 74
commercial establishments. The tempos stop wherever passengers board/alight, thereby causing congestion and delay to other vehicles. It has been observed that areas like clock tower, railway station, paltan bazaar, Connaught place are having heavy pedestrian flows
On the basis of observation, discussion with Traffic Police personnel, Municipal Corporation and PWD Engineers, following stretches are having above short-comings:
• Saharanpur Road (Saharanapur chowk to Prince chowk)
• Gandhi Road (Prince Chowk to clock Tower)
• Haridwar Road(Prince Chowk to Rispana bridge)
• Rajpur Road (Clock Tower to Eucalyptus Road)
• Chakrata Road(Clock Tower to till near cinema Hall)
• Tehsil Crossing to Doon Hospital Crossing and Amrit Kaur Road.
• Cross Rod from Darshan Lal Chowk to EC Road.
• Convent Road.
• Ugrasen Road (Rajpur Road to survey Chowk)
• Pant road – Shift the existing on street tempo parking to parade Ground temporarily.
• Parking at intersection to be strictly banned at least 20 m on all arms from junction. This specifically applies to the prominent inter sections and cross roads of Saharanpur Chowk, Prince Chowk , Tehsil Chowk , Darshan Villa Chowk , Clock Tower, Ashlay stall, Survey Chowk , Araghar junction, Ballupur Junction, Salawala and ISBT Junction.
Major Accident Prone Areas/Stretches
On the basis of past accident record and discussion with traffic police personnel, following stretches are the major accident prone areas.
• Rajpur road
• Shahranpur road
• Haridwar road
• Gandhi road
• Sahashtradhara road
• Raipur road
• Canal road
• Chakrata road

Uttarakhand Urban Development Project
Dehradun City Development Plan Page 75
• Near Ashirward petrol pump
• Near patel nagar mandi
Transport System Characteristics Existing Situation - Registered motor vehicles in the city (2006)
The number of registered motor vehicles in the city for the year 2005 and 2006 are given in Table 3.4.14
Table: 3.4.14: Number of Registered Motor Vehicles in Dehradun
M-A
xle
Truc
ks a
nd
Lorr
y
4-w
h go
ods
vehi
cle
Util
ity v
an
Del
iver
y va
n
Rec
over
y va
n
Petr
ol ta
nker
Wat
er/m
ilk
tank
er
Stag
e-ca
rria
ge
Con
trac
t ca
rria
ge
Scho
ol b
us
Year
1 2 3 4 5 6 7 8 9 10 11
2005 0 6315 1520 611 1894 0 114 0 1454 142 220
2006 0 5360 1704 679 2087 0 88 0 1083 186 246
Gov
t./Se
mi
Gov
t. bu
ses
Am
bula
nce
UTC
Bus
es
Taxi
Max
i
Aut
o ric
ksha
w
Vikr
am
Scoo
ter
Mop
ed
Mot
or c
ycle
Car
Year
12 13 14 15 16 17 18 19 20 21 22
2005 120 196 422 3785 1861 1700 2081 104039 24079 56417 33228
2006 121 105 918 3354 2280 1674 1911 109310 24155 71077 38617
Jeep Omni buses Tractor Trolly Others Total Growth
rate Year
23 24 25 26 27 28
2005 2235 83 485 210 1733 244944
2006 2160 503 493 302 1909 270322 10.36% Source: RTO, Dehradun

Uttarakhand Urban Development Project
Dehradun City Development Plan Page 76
As may be observed from the above figure that Car, motorised two-wheelers constitute more than 14% and 75% of the total vehicles in the city. Also from table 6.2.1, it can be revealed that there are about 2.7 lakh registered motor vehicles in Dehradun city in the year 2005-2006. During the year 2005-2006, the growth of vehicles is around 10.36%. Existing Situation – Public Transport system
Uttarakhand Transport Corporation has a fleet of 430 buses in Dehradun for intra-city and inter-city travels. UTC buses mainly serve long distance as well as medium distance inter-city trips from ISBT and few from near Railway Station.
Private Buses also make long and medium distance intercity trips from different parts of the city. Presently they operate from Parade Ground, near Clock Tower; the long distance private buses do not have any authorized off- Street parking, terminals. So they are seen to occupy the carriageway of roads causing problems to traffic movements.
In addition to this, more than 250 tourist buses also come to the city daily during the peak tourist season.
About 141 City Buses operate all around the city on 10 routes. These routes are fixed by RTO. 1. Rajpur Road- Clement Town. 2. D.L. Road- Defence Colony- Majri. 3. Parade – Shastradhara. 4. Prem Nagar – Gular Ghati – Bhawal. 5. Banjarawala – Gular Ghati – Nehru gaon. 6. Parade Ground – Panwal. 7. Purkul Gaon – Mothronwala 8. Nabada Majra – Rispana pul.
Composition of Registered vehicle in 2006
05000
100001500020000250003000035000400004500050000550006000065000700007500080000850009000095000
100000105000110000115000
M-A
xle
Truc
ks &
Lor
ry
4-w
h go
ods
vehi
cle
Utili
ty v
an
Del
iver
y va
n
Rec
over
y va
n
Petro
l tan
ker
Wat
er/m
ilk ta
nker
Stag
e-ca
rria
ge
Con
tract
car
riage
Scho
ol b
us
Gov
t./Se
mi G
ovt b
uses
Ambu
lanc
e
UTC
Bus
es
Taxi
Max
i
Auto
rick
shaw
Vikr
am
Scoo
ter
Mop
ed
Mot
or c
ycle
Car
Jeep
Om
ni b
uses
Trac
tor
Trol
ly
Oth
ers
Category of vehicles
No.
of R
egis
tere
d Ve
hicl
es

Uttarakhand Urban Development Project
Dehradun City Development Plan Page 77
9. Thana Central – Ballupur. 10. Prem Nagar – Dhonlas ki Chakki.
The above routes are also operated by mini buses. Insufficient and lack of public Transport has led to operation of Intermediate Public Transport (Pvt. Vehicles) which operate from different parts in the city. IPT consists of
• 141 City buses
• 1911 Tempos / Vikrams
• 1674 Auto rickshaws.
Mini buses and Tempos / Vikrams operate on a fixed route and fixed fare basis (fixed by RTO) for short distance intra- city trips within the city, while auto rickshaws operate on free route pattern without any fixed rate. Mini buses and tempos do not have proper terminal facilities or amenities for passengers. The city also lacks designated stops for public transport operation. Besides these, 5634 taxis and maxis operate within the city for intra and inter city trips.
Per Capita Trip Rate and Travel Demand
The growing population and increase in the spending power of the residents has resulted in greater demand for travel. This is very well indicated by the per capita trip rate (PCTR) observed by RITES study in 2004 which is 1.27 in the study area. There were about 9.24 lakh intra-city passenger trips performed daily in and around the city, out of which 2.6 lakh trips were walk trips.
As per the study, vehicular trips reveals that the modal share of two-wheelers is highest at about 39%, car-jeep account for 5%, while buses account for 15 % of the total trips. Tempos account for 24% of the vehicular trips while 5% of the trips are performed by auto-rickshaws.
The distribution of trips reveals that work purpose accounts for 39%and education accounts for 31% of the trips and remaining for other purposes.
Key Issues
• Absence of road hierarchy and traffic carrying corridors. Most of the internal city roads are 1-2 lanes, being a new capital of the state rapid growth in vehicles and population has resulted in exceeding the carrying capacity on the road network.
• Improper utilization of the city road network and lack of enforcement measures has further deteriorated the situation Encroachment on streets by shops owners and vendors further reduce the width of carriageway.
• Basic problem of traffic movement along major arterial road network is the absence of alternative road network.
• Hindrance to pedestrian movement because of absence of foot paths.
• Ineffective traffic control and management measures.
• Absence of adequate parking lots leading to haphazard on-street parking reducing road capacity thereby causing traffic congestion.

Uttarakhand Urban Development Project
Dehradun City Development Plan Page 78
AMBIENT AIR QUALITY STANDARDS IN RESPECT OF NOISE
Limits in dB (A) Leq Category of Area/Zone Day Time Night Time
Industrial Area 75 70 Commercial Area 65 55 Residential Area 55 45 Silence Zone 50 40
Note: 1. Day time shall mean from 6 am to 10 pm. 2. Night time shall mean from 10 pm to 6 pm. 3. Silence zone is an area comprising not less than 100 metres around hospitals, educational institutions, courts, religious places or any other area which is declared as such by the competent authority. 4.Mixed categories of areas may be declared as one of the four above mentioned categories by the competent authority. dB(A) Leq denotes the time weighted average of the level of sound in decibels on scale A which is relatable to human hearing. A “decibel” is a unit in which noise is measured. “A”, in dB(A) Leq, denotes the frequency weighting in the measurement of noise and corresponds to frequency response characteristics of the human ear. Leq: It is an energy mean of the noise level over a specified period
• Sustainable solution to addressing these frequent traffic congestions coupled with parking is one of the major issues of concern.
• The mode split of two-wheelers is about 75% of the total motorised vehicles on the roads indicate the intensity of the traffic issue. Corresponding vehicle density is 584 vehicles per km of the road which is very high.
• Lack of Public Transport system in the city has resulted in improper operation of Intermediate Public Transport vehicles causing traffic congestion.
• Heterogeneity of traffic- hand carts are commonly used for carrying goods within the city area. This obstructs the traffic flow and causes congestion on major roads
• Inadequate Road Infrastructure and Safety measures.
3.5 Environmental Management
Unlike other important cities in the country, Dehradun does not have major environmental problems. But, after becoming the state capital, population, transportation and development activities of the city is increasing rapidly. It is therefore, important to formulate suitable environment policy, laws, rules and regulations to safeguard environment of the city against degradation. Uttarakhand Environment Protection and Pollution Control Board (UEPPCB) is mainly responsible for advising the state government in environmental pollution related issues and monitoring of environmental pollution of the state. In addition to its head office at Dehradun, UEPPCB has established two regional offices at Haldwani and Dehradun to regulate environmental issues.
3.5.1 Status of Pollution – Air, Water and Noise
Air Pollution
The National Ambient Air Quality Standards in respect of noise for different areas/zones are provided in the adjoining text box. It reveals from the above Table that the noise level exceeds the ambient standard in all categories of areas/zones. Vehicular Traffic is the major source of air pollution of the city. Under the National Ambient Air Quality Monitoring (AAQM) Programme, UEPPCB is regularly monitoring the ambient air quality parameters SO2, NO2, and Suspended particulate Matter of the city.

Uttarakhand Urban Development Project
Dehradun City Development Plan Page 79
In Dehradun AAQM is done at two locations namely Clock Tower and Rajpur Road. The status of air pollution of the city during the period of 2005-2006 is furnished in Table 3.5.1.
Table 3.5.1: Status of Air Pollutants during the year 2005-06
Month SO2 (μg/m3) NOx (μg/m3) RSPM (μg/m3) SPM (μg/m3)
Apr, 05 24.55 26.23 232.34 618.26 May, 05 21.39 27.25 125.44 397.73 Jun, 05 19.09 24.9 147.05 370.73 Jul,05 22.07 25.97 132.49 278.27 Aug, 05 22.49 26.05 130.02 303.07 Sep, 05 29.33 28.57 118.42 291.35 Oct, 05 - - - - Nov, 05 - - - - Dec, 05 21.44 25.22 182.55 366.46 Jan, 06 23.53 26.71 149.94 324.46 Feb, 06 21.25 24.29 165.57 370.18 Mar, 06 21.55 18.59 148.00 351.03 National Standard 90 91 200
(Source: Uttarakhand Environment Protection and Pollution Control Board) Note: RSPM: Respiratory Suspended Particulate Matter, SPM: Suspended Particulate Matter
The National Ambient Air Quality Standard for SO2 and NOX and SPM are 90 µg/m3, 91 µg/m3 and 200 µg/m3 respectively. From the above table it is observed that the SO2 and NOX values are well within the National Standard whereas the SPM values exceed the National Ambient Air Quality Standard. In the last three years i.e. from 2003 to 2005 the level of SO2 and NOX of the city has not changed much but the concentration of SPM has increased from 250 µg/m3 to 400 µg/m3.
Pollution of Water Bodies
No major river flows through the city. There are no perennial rivers within the city limits. Seasonal rivulets such as Bindal, Rispana flow during the monsoon. In the rest of the year these rivulets mostly remain dry or carry wastewater. Quality monitoring of these rivulets is not done. There is encroachment along the river bed over a long stretch of the river within the city limit. The major causes of pollution in the river are:
• Dumping of garbage into the rivers on a routine basis
• Encroachment due to Malin Bastis along the water way of the river causing discharge of human excreta directly into the river
• Illegal discharge of sewage and sullage into the river
As a matter of fact the rivers are more of an eye sore and health hazard due to the above reasons.
Noise Pollution
UEPPCB has conducted monthly sound level monitoring at various locations of the city during the year 2005-2006. The result of the noise monitoring is furnished in Table 3.5.2.

Uttarakhand Urban Development Project
Dehradun City Development Plan Page 80
Table 3.5.2: Noise Monitoring Result (All values are in dB)
Month/Year Race Course
Near MLA House (Res
area)
Doon Hospital (Silence Zone)
Clock Tower (Commercial
area)
Gandhi Park
(Silence Zone)
Survey Chowk
(Commercial Area)
C.M.I. Hospital (Silence Zone)
May, 2005 63.59 60.9 75.9 62.7 74.4 - June,2005 - 60.8 75.4 65.1 73.2 61.7 July,2005 64.1 66.0 80.8 54.3 - 66.1 August,2005 71.5 59.9 90.8 62.8 76.2 65.4 September,2005 60.68 64.87 77.5 62.8 76.72 63.2 October,2005 - - - - - - November,2005 - - - - - - December,2005 62.36 60.7 73.29 52.0 76.04 64.9 January,2006 65.74 64.27 88.85 67.56 79.5 64.57 February,2006 66.96 63.52 87.7 66.84 76.9 64.81 March,2006 70.51 68.14 91.62 68.46 84.5 73.2 (Source: Uttarakhand Environment Protection and Pollution Control Board)
Forest Areas
Forest areas exist outside the Municipal Area but within the planning area of Dehradun. These areas are mainly located between Rajpur road and Mussourie road (Reserve Forest Areas). The areas lying on the north and the north-east and partly lying in the south have forest areas. Clearly these areas could be under perceived threat from growing urbanization and dispersion of pollutants from the urban areas. The immediate threat is on the Reserve Forest Area between Rajpur road and Mussourie Diversion road.
Key Environmental Management Issues
Following are the major environmental management issues of the city:
• Pollution due to Increased Vehicular Traffic: With rapid increase of population and urbanization, there is a significant increase in vehicular traffic in the city. This includes public, private and other type of vehicles. Registered vehicles of the city are increased by 362 % over the last ten years. Total number of vehicles on road has increased from 2,44,944 to 2,70,322 during the period from 2005 and 2006. Emission from these vehicles is mainly responsible for the air pollution of the city.
• Treatment of Sewage: At present the city is partially covered by sewerage network. There is no sewage treatment plant to treat the sewage of the city. This results in discharge of untreated or semi-treated sewage (about 32 mld) into Rispana and Bindal rivers and for sewage farming.
• Collection, Transportation and Safe Disposal of Solid Waste: The city has failed to comply “Municipal Solid Wastes (Management and Handling) Rules, 2000” under the umbrella act “The Environment (Protection) Act, 1986”.
• As Dehradun has substantial vegetation with fruit orchards, flowering trees and large number of ornamental and other plants these constitute an interesting floral bio-diversity. With growing pressure of land, these vegetation is under intense pressure without any restoration or reforestation programme.

Uttarakhand Urban Development Project
Dehradun City Development Plan Page 81
4. Urban Governance and Institutional Setup “Institutions are the rules of the game, organizations are the players”.
Douglass C. North
‘Governance’, as internationally acknowledged, stands for ‘the manner in which power is exercised in the management of a country’s social and economic resources for development’. Applied to local institutional analysis, governance has to be related to the management of a city or town’s social and economic resources for planned urban development.
4.1 Components of Governance
Four basic elements of ‘good governance’ have been identified as (a) accountability, (b) transparency, (c) predictability in terms of stable, open and widely understood ‘rules of the game’, and (d) participation. Governance and capacity-building have, at least, three interrelated dimensions: (i) a strong public sector management component, (ii) the role of government in creating and fostering an enabling environment for private sector growth, and (iii) strengthening civil society which would include participation of stakeholders and beneficiaries in development policies and projects. An analysis of governance would thus focus on both formal and informal actors involved in decision-making and implementation.
Government, in the formal sense, is one of the many actors involved in the act of governing. Other actors would vary depending on the level or site chosen for the analysis of governance. In urban areas, for example, other actors may include the parastatals agencies involved in sectoral (eg. Water supply, sewerage etc.) management or in the overall planning and development of the urban area. Other candidate organizations would be the various associations working in the city, NGOs, finance institutions, political parties, etc. Figure 4.1 presents a picture of interconnections among multiple actors involved in urban governance.
Figure 4.1: Interconnections among actors involved in Urban Governance

Uttarakhand Urban Development Project
Dehradun City Development Plan Page 82
4.1.1 Role of State Government
It needs emphasizing that local (urban) institutional development issues are closely linked up with macro policy postures of Central and State Governments. Obvious examples are 74th Constitutional Amendment and JNNURM, both emanating from Central Government’s concern respectively with constitutionalizing local self-government and promoting planned urban development. The role of the State Government would be reflected in drafting ‘conformity legislation’ in terms of 74th CAA with consequences for both ULBs and Para-statals. A new pattern of inter-institutional functional realignment is likely to emerge only on the basis of State’s well-thought-out policy design in respect of functional redistribution between the ULBs on one hand and the Para-statals on the other. To be specific, functions such as ‘urban planning’, ‘building regulations’, ‘water supply’ etc. which are listed in the 12th Schedule for transfer to the ULBs are presently in the hands of Para-statals and State agencies in Uttarakhand. How and when the State Government would be deciding to transfer all or any of these functions to the ULBs are going to be crucial for the future shape of institutional development in Uttarakhand.
Planned urban development in Uttarakhand, in the context of current initiatives impels a fresh look at the Secretariat-level set-up of the Urban Development Department. This is addressed as part of the ongoing work for the Uttarakhand Urban Development Project, but preliminary broad-brush analysis suggests that the future shape of UDD could develop as presented here graphically, although this structure will be further refined based on further analysis of the current situation. Imaginative policy guidelines and time-bound monitoring and evaluation of large programmes, as well as guiding and assisting the municipal bodies (in their new role as vibrant local self-government) would require a refined organisation structure for the Urban Development Department in the coming years.
Possible Future Shape of UDD
It is commonplace to argue that a city or town evolves over time under certain socio-cultural and legal-institutional imperatives. As the city or town grows demographically and socio-economically, there is bound to be commensurate growth in the scale and complexity of urban problems that would have to be addressed through governmental re-engineering. This would require an efficient and effective governance framework to suit the complexities of urban management.
Urban Development Department
Project Management Unit
Central Valuation Authority
Planning and Development
D U D
Training Municipal Engineer
Town and Country Planning Organisation
Development Authority

Uttarakhand Urban Development Project
Dehradun City Development Plan Page 83
4.2 JNNURM and Urban Governance
Against this backdrop, major highlights of the JNNURM relevant to institutional analysis are presented as under:
4.2.1 Goal ‘Creating economically productive, efficient, equitable and responsive cities’
4.2.2 Focus ‘On efficiency in urban infrastructure/services delivery mechanism, community participation and accountability of ULBs / parastatals towards citizens’
4.2.3 Objective ‘To implement projects on mission mode’
The inference one can draw from these guidelines is that a city or town, in terms of JNNURM vision, must set its goals right, fix the focus of activities clearly, and spell out its operational objectives (mission mode) unambiguously. The ‘goals’, ‘focus’, and ‘objectives’, once clearly set, would be helpful in refashioning the management of a city or town, bringing about, in the process, a new paradigm shift in urban governance.
4.2.4 Multi-Institutionality
The phenomenon of multi-institutionality in a city situation has been admitted in JNNURM Guidelines which are worth our quotation in this context: “The city is managed and governed by a number of institutions and organizations. In this respect, a city is a complex entity….Often, responsibilities overlap, and also often, there may exist fragmentation of responsibilities without any platform for coordination”.
What is significant to note is that the Guidelines talk of ‘fragmentation’ and ‘overlap’ of functions and responsibilities, and pointedly refer to the absence of ‘any platform for coordination’.
It is helpful to recount, in this context, some other important guidelines of JNNURM: • Identification of institutions and organizations that have direct and indirect
responsibilities for infrastructure provision • Identification of areas of fragmentation or overlap • Its impact assessment on infrastructure delivery and management, and • Review of the role of private sector in service delivery and the potential of
public-private partnership in the development and management of infrastructural service.
Uttarakhand Urban Development Project
Dehradun City Development Plan Page 84
4.2.5 Urban Reforms Agenda
Discussions on the issues relating to strengthening urban governance and institutional development need to be linked to the ‘urban reforms’ agenda as incorporated in the JNNURM guidelines.
The suggested ‘reforms’ cover a wide gamut of items involving two levels: State and the ULBs.
ULB-level
• Accrual-based, double-entry accounting system
• E-governance with IT applications like GIS, MIS etc.
• Property Tax reform to achieve 85% efficiency within 7 years
• User charges to recover O&M cost
• Budget-earmarking for basic services to the poor
• Basic services to the poor and security of tenure at affordable prices
State-level
• Decentralization measures as per 74th Constitutional Amendment
• Repeal of Urban Land Ceiling and Regulation Act
• Reform of Rent Control Laws
• Rationalization of Stamp Duty to bring it down to 5%
• Enactment of (i) Public Disclosure Law and (ii) Community Participation Law
• City planning function to be assigned to ULBs
4.3 Institutional Profile
Keeping these broad JNNURM guidelines in view, the institutional profile of Dehradun can be presented in some details below.
Even before its capital city status, Dehradun had been a major urban node in the Garhwal region. After the formation of the Uttarakhand State in 2000, the City has risen to further prominence in politico-administrative parlance. Different kinds of institutions and organisations, belonging to various levels, are functioning in the city for the provision of infrastructure and services.
Broadly, the institutions involved in infrastructure/service provision in the city are:
• Dehardun Nagar Nigam(commonly known as Dehradun Nagar Nigam)
• Mussourie-Dehradun Development Authority

Uttarakhand Urban Development Project
Dehradun City Development Plan Page 85
• Uttarakhand Pey Jal Nigam
• Uttarakhand Jal Sansthan
• Town and Country Planning Organisation
• Public Works Department
• Regional Transport Office
• Uttarakhand State Electricity Board
• Uttarakhand Environment Protection and Pollution Control Board
• Uttarakhand State Urban Development Agency
• Uttarakhand Transport Corporation
• Uttarakhand Power Corporation
Owing to the fact that Dehradun is the capital city of the state, various state level agencies are operating here and are responsible for some of the major infrastructures/services provision for the city. The responsibility often is limited to the planning, designing and execution of the projects, which are then transferred to the agencies directly responsible for the provision of infrastructure facilities.
Table 4.3.1 below provides the details of the responsibilities of the various agencies.
Table 4.3.1: Institutional-Functional Matrix (DNN)
S. No.
Functions under Schedule XII of 74th CAA
Agencies responsible for Planning and
Design Execution Operation and
Maintenance
1 Urban planning including Town Planning
MDDA and TCPO MDDA and TCPO
MDDA and TCPO
2 Regulation of land use and construction of buildings
MDDA MDDA MDDA
3 Planning of economic and social development
Planning, and Social Welfare Departments
Different Government Departments
Different Government Departments
4 Roads and bridges PWD, MDDA PWD, MDDA, DNN
PWD, MDDA, DNN
5 Water supply for domestic, industrial and commercial purposes
UPJN, UJS (for small projects)
UPJN, UJS (for small projects)
UJS
6 Public health, sanitation, conservancy and solid waste management
DNN DNN DNN
7 Fire service State Police Deptt. State Police Deptt.
State Police Deptt.
8 Urban forestry, protection of environment and promotion of ecological aspects
Forest Department, UEPPCB,DNN
Forest Department, MDDA, DNN
Forest Department, MDDA, DNN
9 Safe guarding of interests of weaker sections of society, including handicapped and mentally retarded
Planning, and Social Welfare Departments
Different Government Departments, SUDA, DNN
Different Government Departments DNN
10 Slum improvement and up-gradation MDDA, DNN, SUDA DNN, DNN 11 Urban poverty alleviation SUDA, DNN DNN, SUDA DNN 12 Provision of urban amenities, and
facilities such as parks, gardens and play grounds
Sports Deptt, DNN
Sports Deptt., DNN
Sports Deptt., DNN

Uttarakhand Urban Development Project
Dehradun City Development Plan Page 86
S. No.
Functions under Schedule XII of 74th CAA
Agencies responsible for Planning and
Design Execution Operation and
Maintenance
13 Provision of cultural, educational and aesthetic aspects
Department of Culture, DNN
Department of Culture, DNN
Department of Culture, DNN
14 Burial and burial grounds; cremations, cremation grounds and electric crematorium
DNN DNN DNN
15 Cattle ponds; prevention of cruelty to animals
DNN DNN DNN
16 Vital statistics including registration of births and deaths
DNN DNN DNN
17 Public amenities including street lighting, parking lots, bus stops and public conveniences
UPC, DNN, MDDA UPC, DNN DNN
18 Regulation of slaughter houses and tanneries
DNN DNN DNN
MDDA: Mussouri Dehradun Development Authority; TCPO: Town and Country Planning Organization; DNN: Dehradun Nagar Nigam; UPJN: Uttarakhand Pey Jal Nigam; UJS: Uttarakhand Jal Sansthan; PWD: Public Works Department; UEPPCB: Uttarakhand Environment Protection and Pollution Control Board; UPC: Uttarakhand Power Corporation; SUDA: State Urban Development Agency.
The organisational detail of Dehradun Nagar Nigam (commonly known as Dehradun Nagar Nigam) is provided below.
4.3.1 Dehradun Nagar Nigam (DNN)
The Dehradun Nagar Nigam (DNN/DNN) was established in the year 2000 under the Uttar Pradesh Nagar Nigam Act, 1956. However the state is in the process of drafting a bill for Uttarakhand. The organisation structure of the authority is as provided below:
Organisational Structure
The governance structure of DNN is divided into two wings viz., elected wing and administrative wing. Under Section 5 of the Uttar Pradesh Nagar Nigam Act, 1959, the authorities of the Corporation have been specified as:
1. Corporation
2. Ward committees
3. Executive Committee
4. Mayor
5. Development Committee
6. Chief Executive Officer of the Corporation, and
7. Any other committees that would be constituted by the Corporation with State’s prior approval.
The Corporation consists of 45 elected members from 45 wards. The Mayor, who is elected directly by the people at large of Dehradun, is the Chairperson of the whole body – the Corporation. The Deputy Mayor is elected by the elected members of the Corporation.
The committee system has not developed fully in DNN. The Executive Committee broadly oversees the entire corporation administration. This is the focal point of corporation management, from the political point of view. The Development

Uttarakhand Urban Development Project
Dehradun City Development Plan Page 87
Committee has just been set up but its terms of reference are yet to be clearly defined. The Ward Committees have been constituted on the basis of 1:9 electoral wards. That means the Corporation has presently 5 (five) ward committees. This concept of large ward committee runs counter to the spirit of the 74th CAA, as it is too large to be effective as local participative forum for grassroots people’s engagement in civic administration.
The Mukhya Nagar Adhikari is one of the statutory authorities of the Corporation. He is appointed by the State Government and heads the administrative wing of the Corporation. All employees of the Corporation function under his supervision and control. He is assisted by an Up-Nagar Adhikari.
The Chief Executive Officer is not statutorily placed under the control of the Mayor. Hence, the relationship between the political and the professional sides depends more on mature understanding and willing cooperation than the rules of the statute. Because of local recruitment of clerical and other lower level staff, there is a tendency to develop dual loyalty. The truth is that at the lower level the loyalty is more toward the ‘benefactors’ than the statutory superiors. Working within extremely limited functional domain, DNN does neither have a forward looking political executive nor a dynamic, professionally committed, skill group that can together move the DNN toward a new era of planned city development as envisaged in the JNNURM.
A broad outline of the organisational structure of the DNN is presented below.
Figure 4.2: Nagar Nigam Political Wing
Figure 4.3: Organisational Structure of DNN
Corporation
Ward Committees
Development Committee
Mayor
Dy. Mayor
Mukhya Nagar Adhikari
E xecutive Commitee
Administrative Departments
Mukhya Nagar Adhikari
Up Nagar Adhikari Ex. Engineer Mun. Health Officer
Accounts Officer
Sahayak Nagar Adhikari
Office Suprientendent
Municipal Engineer
Junior Engineer
Zonal Sanitary Officer
Inspectors
Supervisor
Accountant
Accounts Clerk
Mukhya Nagar Lekha Parikshak

Uttarakhand Urban Development Project
Dehradun City Development Plan Page 88
As mentioned earlier, only a few committees have been set up in the corporation (see Table 4.3.2 below).
Table 4.3.2: Functions of Committees in DNN
S. No.
Committee Functions
1. Executive Committee Responsible for overall decision making in the corporation Financial decisions of the corporation Approval of projects and schemes in the corporation jurisdiction General coordination
2. Development Committee (recently set up)
Responsible for the development work in the corporation jurisdiction (tasks not clear yet)
3. Ward Committees (not in terms of 74th CAA)
Greater public participation in local level municipal functioning Awareness generation among citizens
4. Mohalla Swachata Samiti (set up under Govt. Order)
Door-to-door collection of garbage Street sweeping Fixing and collection of charges from households
The total strength of corporation employees stood at 1950, including those engaged in the Mohalla Swachata Samitis, when a count was last made recently.
As per the present policy of the State Government, there are five kinds of officers and staff in the corporation:
1. State appointees
2. Officers belonging to Unified/Integrated cadres
3. Locally recruited staff
4. Staff recruited on contractual basis, and
5. Staff recruited on purely ad hoc basis.
In view of the new and challenging responsibilities of the corporation as envisaged under the JNNURM, State Government has urgently to examine de novo its traditional (on-going) policy toward municipal personnel in order that municipal professional administrative strength can be substantially enhanced.
Nagar Nigam Functions
The functions of DNN are listed in Uttar Pradesh Nagar Nigam Act, 1956. It provides for mandatory functions as well as discretionary functions of DNN. The major functions of DNN are: city cleanliness, solid waste management, maintenance of gardens/dividers/circles, street light, bio-medical waste, slaughter house, flood control, encroachment removal, stray cattle management, community toilets, community halls, all stormwater and wastewater drainage, parking lots, development works, advertisement, sale of land, house tax, and licensing. Although the act lists water supply and wastewater management as ULB responsibilities these have been adopted by the State through Jal Nigam and Jal Sansthan
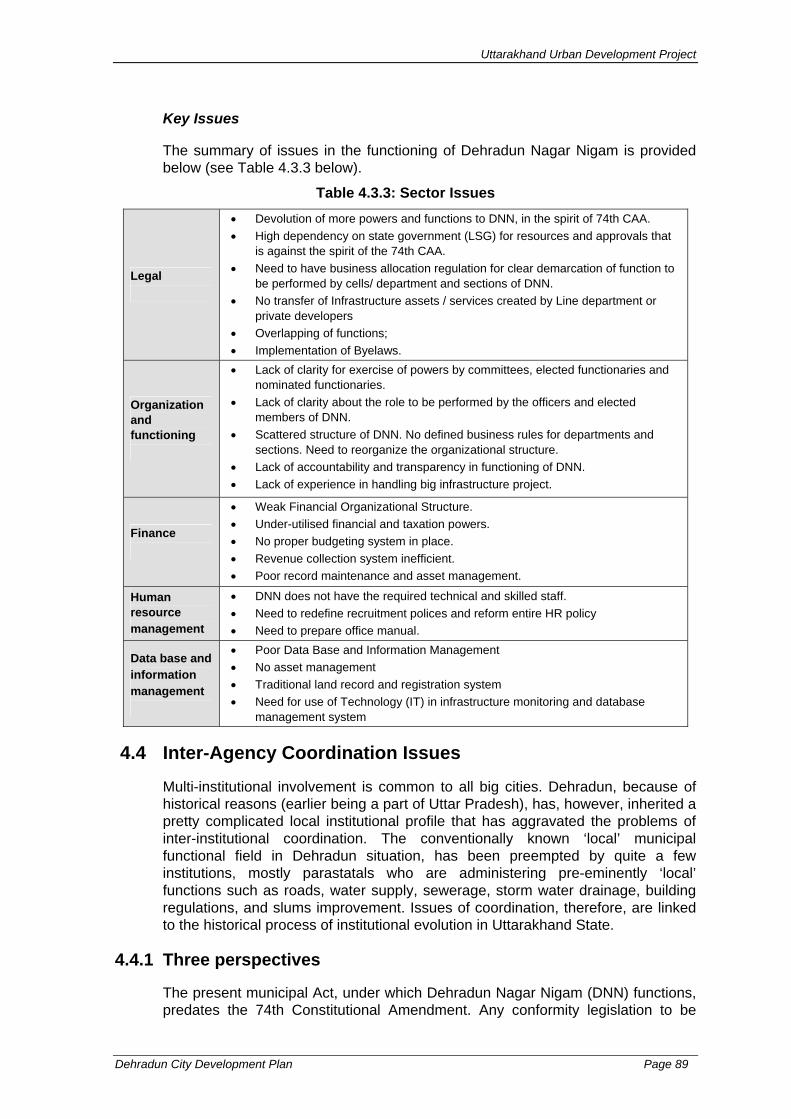
Uttarakhand Urban Development Project
Dehradun City Development Plan Page 89
Key Issues
The summary of issues in the functioning of Dehradun Nagar Nigam is provided below (see Table 4.3.3 below).
Table 4.3.3: Sector Issues
Legal
• Devolution of more powers and functions to DNN, in the spirit of 74th CAA. • High dependency on state government (LSG) for resources and approvals that
is against the spirit of the 74th CAA. • Need to have business allocation regulation for clear demarcation of function to
be performed by cells/ department and sections of DNN. • No transfer of Infrastructure assets / services created by Line department or
private developers • Overlapping of functions; • Implementation of Byelaws.
Organization and functioning
• Lack of clarity for exercise of powers by committees, elected functionaries and nominated functionaries.
• Lack of clarity about the role to be performed by the officers and elected members of DNN.
• Scattered structure of DNN. No defined business rules for departments and sections. Need to reorganize the organizational structure.
• Lack of accountability and transparency in functioning of DNN. • Lack of experience in handling big infrastructure project.
Finance
• Weak Financial Organizational Structure. • Under-utilised financial and taxation powers. • No proper budgeting system in place. • Revenue collection system inefficient. • Poor record maintenance and asset management.
Human resource management
• DNN does not have the required technical and skilled staff. • Need to redefine recruitment polices and reform entire HR policy • Need to prepare office manual.
Data base and information management
• Poor Data Base and Information Management • No asset management • Traditional land record and registration system • Need for use of Technology (IT) in infrastructure monitoring and database
management system
4.4 Inter-Agency Coordination Issues
Multi-institutional involvement is common to all big cities. Dehradun, because of historical reasons (earlier being a part of Uttar Pradesh), has, however, inherited a pretty complicated local institutional profile that has aggravated the problems of inter-institutional coordination. The conventionally known ‘local’ municipal functional field in Dehradun situation, has been preempted by quite a few institutions, mostly parastatals who are administering pre-eminently ‘local’ functions such as roads, water supply, sewerage, storm water drainage, building regulations, and slums improvement. Issues of coordination, therefore, are linked to the historical process of institutional evolution in Uttarakhand State.
4.4.1 Three perspectives
The present municipal Act, under which Dehradun Nagar Nigam (DNN) functions, predates the 74th Constitutional Amendment. Any conformity legislation to be

Uttarakhand Urban Development Project
Dehradun City Development Plan Page 90
drafted in future is expected to ‘municipalise’ in near future many of the functions which are presently outside the ambit of municipal administration (in terms of 12th Schedule).
There are three interrelated ways of looking at the Coordination issues: • For practical reasons (since change in governmental system takes time), the
present multi-institutional scenario, with minor adjustments, would be continuing for some more time,
• Even if ‘big changes’ would take time, some ad interim compromise measures have to be adopted, possibly meeting half way some limited functional transfers as per the 74th CAA to work out coordination solutions for the time being, pending longer term solutions, and
• In view of national policy of constitutionalization of local self-government reinforced by the JNNURM Guidelines, ‘big’ changes have to be brought about through enactment of ‘conformity legislation’ incorporating the essential mandate of the 74th Constitutional Amendment involving large scale functional realignment coupled with corresponding institutional overhaul.
4.4.2 Bold Initiatives
Institutional changes are more talked about than really achieved at one go. It, however, goes to the credit of Uttarakhand Government that quite a few decisive steps have been taken in recent times to bring about some radical reforms that are surely to have salutary impact on urban governance as well. More important among these are Multi-Purpose Household Survey (MPHS), Central Data Vault (CDV), Citizen-Centric Delivery of Services (CCDS), Complaint Management System (CMS), and Human Development Study (HDS).
It is noteworthy that Uttarakhand has made considerable progress in the matter of drafting a Local Self-Government Bill in conformity with the 74th CAA. A review of the Bill reveals that it has some important features that go beyond the 74th CAA. For instance, to deal with local level corruption, a statutory Municipal Vigilance machinery has been provided for. Another innovative institution that has been conceived is a State Municipal Regulatory Commission on the lines of Telecom Regulatory Authority of India and similar other institutions elsewhere to guard against arbitrary municipal decisions, say in respect of fees and user charges.
When completed, these State level initiatives will have to be linked to urban governance reforms processes that are now underway.
At this stage, it is also useful to summarise the other reforms initiatives taken by the State Government directly in the urban governance sphere, following the Guidelines of JNNURM. The suggested ‘reforms’, under JNNURM, cover a wide gamut of items involving two levels – State and the ULBs.
The balance sheet of actions so far under implementation is presented in summary below:

Uttarakhand Urban Development Project
Dehradun City Development Plan Page 91
Balance Sheet of Actions: ULB-level
1.Accrual-based, double-entry accounting system 2. E-governance with IT applications like GIS, MIS etc. 3. Property Tax reform to achieve 85% efficiency within 7 years 4. User charges for O&M cost recovery 5. Budget-earmarking for basic services to the poor 6. Basic services to the poor and security of tenure at affordable cost
1. Being introduced along with planned training programmes 2. Process started, GIS in selected towns. Computers in ULBs but requires training plan 3. Under consideration, to be taken up with wider Property Tax reforms considerations. 4. Govt. order issued in this regard, under implementation 5. New budget exercise needed with training back-up (linked to I above) 6. Needed ULB and Para-statal level interventions. (linked to 1 above)
Similarly, status of state-level reforms in terms of JNNURM guidelines is shown in the table below:
Balance Sheet of Actions: State-level
1. Decentralization measures as per 74th Constitutional Amendment 2. Repeal of Urban Land Ceiling and Regulation Act 3. Reform of Rent Control Laws 4. Rationalization of Stamp Duty to bring it down to 5% 5. Enactment of Public Disclosure Law 6.Enactment of Community Participation Law 7. City planning function to be assigned to ULBs
1. Under active consideration with new draft Bill 2. Since repealed 3. Being examined 4. Under consideration within constraints of State’s revenue situation 5. Disclosure Law can be part of new Municipal Bill now being drafted 6. Participation Law is in place, but needs broadening 7. Provision made in the draft Municipal Bill
4.4.3 Institutional Changes in Dehradun Context
The issue of strengthening of Dehradun’s urban governance is closely linked up with wide-ranging reforms agenda, as mentioned above, cutting across horizontal and vertical levels of governance. Institutions are usually embedded in deeply entrenched organizational history, political culture and inter-organizational power relationships. Any change programme is thus likely to raise suspicions and even face opposition from no-changers. The immediate impulse for institutional change can be traced to (i) national ideological exhortation to bring about ‘decentralization’ in terms of the mandate of the 74th Constitutional Amendment and (ii) the recently released JNNURM Guidelines with special reference to:
• Implementation of decentralization initiatives as per the Constitution (74th) Amendment Act, 1992 (the point already mentioned)
• Enactment of community participation law, and
• Assigning or associating municipalities with the city planning function.
Against this backdrop, four kinds of change scenarios are being drawn up in this report (acknowledging that there can be many permutations and combinations of the different options. (Refer Figure 4.4). Out of these four typologies, the inter-institutional ‘network’ scenario seems practically achievable in the short term. The ultimate objective should, of course, be to move towards the constitutionally mandated ‘decentralization’ initiatives, as per the guidelines of the JNNURM.

Uttarakhand Urban Development Project
Dehradun City Development Plan Page 92
In Figure.4.4 explanations have been briefly provided within each box – (i) Vision-Existing Situation, (ii) Journey-First Step, (iii) Intermediate Step, (iv) Full-Scale Adoption of 74th CAA Model. Existing situation in (i) is just descriptive presentation. Journey-First Step is the major first step toward institutional reform involving (a) limited transfer of functions from Para-statals to DNN, and (b) more importantly, constitution of a strong Standing Coordination Committee to be headed by the Minister-in -charge of Urban Development. If the State Government notifies a properly delineated Greater Dehradun Area (GDA), a Metropolitan Planning Committee can be constituted for this area in terms of the 74th CAA. Being the state capital and in view of future planned growth of Dehradun area, it might be helpful to go for the notification and formation of the MPC. Intermediate Step in (iii), is a further advance on First Step envisioning (a) amalgamation of cognate Para-statals and transfer of some more functions from Para-statals to DNN at the second phase. Full-scale Adoption of 74th CAA model as shown in (iv) is self-explanatory.
4.5 Role of Private Sector in Urban Infrastructure Provision
Private sector participation in infrastructure provision in Dehradun city is still at a nascent stage in its development. The new ISBT of Dehradun has recently been constructed on a Build Operate and Transfer Model by Ramky Infrastructure Company, and is functional. This is the lone example of any real and successful PPP in this region. However, there are quite a few potential areas where the PPP model may be applicable along the lines of similar efforts successfully made in many other cities in India. Selective references, in this context are:
• Solid waste management, especially transportation, disposal and composting
• Maintenance of parks and gardens
• Infrastructure creation such as off-street parking, roads and flyovers, bus stands (as ISBT here)
• Street lighting etc.
4.6 Role and Responsibilities of the ULB under the 74th CAA
The 74th Amendment to the Constitution was enacted to give constitutional recognition to local government institutions in the country. It makes it obligatory on the part of the state government to constitute in every state Nagar Panchayats, Municipal Councils and Nagar Nigams as per the criteria provided under it. The Amendment empowers the state legislatures to endow them through law necessary powers, to function as institutions of self government and also to provide for the devolution of powers and responsibilities upon them with respect to preparation of plans for economic development and social justice and for implementation of the schemes including those listed in the Twelfth Schedule to the Constitution. The functions enumerated in the 12th Schedule include urban planning including town planning, planning for economic and social development, public health, sanitation, conservancy and solid waste management, protection of environment and promotion of ecological aspects and slum improvement and upgradation. It is expected that the provisions enunciated in the Constitution would be incorporated in the existing municipal laws by suitable amendments.

Uttarakhand Urban Development Project
Dehradun City Development Plan Page 93
Figure 4.4: Change Scenarios
The Vision
Slight alteration in the existing organisational profile of DNN is in the offing with SJSRY being transferred to DNN. This will neccessitateformation of a poverty eradication cell within DNN
Dehradun Mun. Corporation
Uttarakhand Pey Jal Nigam Uttarakhand Jal Sansthan Public Works Department
Existing functioning in an autarchic
fashion(Selective Presentation)
Existing Situation Copybook adoption of 74th CAA
Note: Already, there is a move to transfer SJSRY to DNN
Dehradun Mun. Corporation(Functions)
Water Supply
Sewerage
Roads Urban Poverty
Urban Planning
Responsible for1. Planning and designing of the infrastructure/services2. Execution of the infrastructure/services as envisaged3. Operation and maintenance of the infrastructure/services
The Journey
Formation of Standing Coordination Committees with Minister, UD in the Chair.
Nominee from each organisationCommittee on the model of MPC can be applied to Dehradun
Institutional Restructuring - First Step towards the VISION Functional Restructuring - Intermediate Step towards the VISION
DNN MDDA UPJN UJS PWD (Roads)
Minister, UD
Members from:Dehardun Muncicipal Corp. Mussourie Dehradun Development AuthorityUttarakhand Pey Jal NigamUttarakhand Jal Sansthan
Uttarakhand Pey Jal Nigam Uttarakhand Jal Sansthan
Single Entity responsible generation functions
Mussourie Dehradun Development Authority
Empowered Dehradun Nagar Nigam
Transfer of Urban Planning and Building Regulation function in relation to Dehradun
Transfer of functions related to Water (Production, Distribution and OandM)
and Sewerage (OandM)
The networking arrangements shall continue even after the institutional changes (mergers etc) with restructuring of the set up.
Members from:Town and Country Planning OrganisationUttarakhand Transport Corp.Uttarakhand Housing BoardCity Police

Uttarakhand Urban Development Project
Dehradun City Development Plan Page 94
With the enormous increase in the responsibilities and functions of the municipal bodies as envisaged under the constitutional Amendment, one expects corresponding increase in their financial resources also. Does the Amendment provide for sufficient finances for these bodies to undertake the additional responsibilities? A cursory reading of the Amendment indicates that it is not the case. The Amendment only empowers the state legislature “to authorise a municipality to levy, collect and appropriate such taxes, duties, tolls and fees in accordance with such procedure and subject to such limits; to assign to a municipality such taxes, duties and tolls and fees levied and collected by the state government for such purposes and subject to such conditions and limits; to provide for making such grant-in-aid to the Municipalities from the Consolidated Fund of the state and to provide for the constitution of such funds for crediting all moneys received, respectively by or on behalf of the Municipalities and also for the withdrawal of such moneys therefrom” (emphasis added). Discretion is writ large in the state’s financial allocation to municipal bodies.
4.6.1 Municipal Executive Structure
A democratically elected body at any level of governance is led by a political executive. Dehradun Nagar Nigam does not have any such focal executive body. Mayor’s direct election gives a false impression of a strong mayor of the American City Manager Council type (modelled on the American Federal Presidential System). DNN’s political centre of attraction is the Executive Committee, a collective body of equals without definitive leadership focus. Deputy Mayor’s tenure of two and a half years provides for rotational opportunity without much administrative/managerial significance.
A cabinet type of mayor-in-council has been introduced in West Bengal and for sometime Mumbai also had adopted the same system (since abrogated). All India Mayors’ Conference has been urging for the Mayor-in-Council’s adoption for all large Nagar Nigams. DNN would in that case have a Mayor as the leader of a definitive political executive of which, besides Mayor, a few other elected members chosen by Mayor would together constitute a cabinet type of political executive.
The other option is to have a strong Municipal Standing Committee as the focal executive body, assisted by a number of portfolio-based multi-member Subject Committees (eg on Solid Waste, Drainage and Sewerage, Water, etc.). In either case, Mayor-in-Council or Integrated Standing Committee, the executive body will be accountable to the whole corporation.
DNN’s present arrangement of the political executive needs to be reformed to bring in a degree of certainty, determination and decisive action which is of paramount importance for enhancing managerial strength of the city government. If some more functions like sewerage, drainage, water distribution (O&M) and building regulations would be transferred to DNN in near future (refer Figure 4.5), the corporation would have to rebuild its political and managerial structure. Right now, as per the directive of the Hon’ble Supreme Court, a Public Health Engineer can be appointed in the corporation for taking care of the Solid Waste Management functions.

Uttarakhand Urban Development Project
Dehradun City Development Plan Page 95
Figure 4.5 Transfer of functions to DNN
4.6.2 Management Upgradation
The devolution of functions may not happen overnight, but a process of ‘municipalisation’ of the above functions has to start in a phased manner. This will necessitate rebuilding the DNN’s administrative-managerial set-up with appropriate departmentalisation and organisational redesign.
All these are conventional municipal functions but internal managerial strength of DNN would then have to be augmented in a planned manner. In other words planned capacity building of DNN must precede any scheme of ‘municipalisation’ as might happen in future to conform to the constitutional (74th Amendment).
4.6.3 Community Participation
Citizens have conventionally been looked at as ‘electors’ and ‘beneficiaries’ and rarely as participant actors in civic management. The concept of ward(s) committee in the 74th Constitutional Amendment is a revolutionary idea with the objective of deepening city democracy by making the citizens active participants in local area civic administration (eg local SWM, maintaining civic infrastructure such as street lights, parks and playgrounds, etc.).
DNN’s present system of Ward Committee on the basis of the ward committee per nine wards, on an average having about 90,000 population, is unsuitable for promotion of participative civic administration. Smaller ward committees, possibly on the basis of 2 to 3 electoral wards per Ward Committee, need to be constituted for effective citizen’s participation. The composition of a Ward Committee will then have to be differently conceived, making it an amalgam of elected ward councillors and a cross-section of nominated local citizens: doctors, engineers and other professionals, some women members and SC/ST members etc. DNN has to evolve a system of local community participation to harness the energy and support of the civil society and create, in the process, a sense of ownership of municipal institution among the citizen. SJSRY, now being transferred to DNN would have to be integrated with the scheme of Ward Committee (especially in slum areas).
Municipalisation of the functions
Functions now with other Agencies
Sewerage (UJS)
Storm Water Drainage (UPJN)
Building Regulation (MDDA)
Water Supply O&M* (UJS)
Functions likely to be transferred to DMC
Sewerage
Storm Water Drainage
Building Regulation
Water Supply O&M

Uttarakhand Urban Development Project
Dehradun City Development Plan Page 96
Community participation can be functionally organised. Almost all the existing municipal functions and those that might be transferred to the corporation in terms of the 12th schedule can have advisory/consultative committees with lay citizens and experts as members. Ward committee for every ward will allow room for more active citizen participation. There can also be constituted area/zonal committees with appropriate citizens’ participation to consider and advise on issues involving wider area level problems, say, an open space or a large park or water body.
4.7 Training and Capacity Building Initiatives
‘Urban Development’ is a multi-disciplinary subject involving a cross-section of institutions and organisations. State-wide policy needs to be framed to take into account this macro issue. Uttarakhand does not have any training institution with exclusive focus on Urban Management, Planning and Development. If the current trend towards planned urban and municipal development would be continuing in the years to come, Uttarakhand will have to plan for the establishment of a Urban Planning and Management Institute at the earliest.
Pending establishment of such an institution, which may take time, a Training Cell may be constituted within the office of the Director of Local Bodies. Its task will be two-fold: (i) to build on the current initiative to carry out a training needs assessment (TNA) exercise in ULBs across the state, may be with some expert help, to ascertain with some precision the diverse training needs of ULBs; and (ii) to identify appropriate training modules, prepare a list of training institutions which offer such modules. And make arrangements for sending employees on these specific types of training programmes.
Within the State Administrative Training Institute, there is already a Centre for Urban Development. Its capacity can be enhanced with appropriate faculty induction. The technical expertise of IIT, Roorkee, Dehradun Institute of Technology, engineering colleges in the State and other existing institutions can be harnessed and these institutions mobilized for conducting specialized training programmes related to urban management.
So far as the Dehradun urban scene is concerned, the institutions that are directly involved in the planning and management of the urban area have to be more dynamic, forward looking and ‘management’ oriented. Also a culture of ‘networking’, not one of insular tunnel vision, has to be developed to bring about ‘convergence’ among sister/allied organisations. Common training schedules can be worked out for a cross section of staff and officers of different organisations. For instance DNN’s Solid Waste Management wing can sit together with the Jal Sansthan’s officers involved in Sewerage and Drainage works. Similarly, Town Planning Directorate can have joint programme with DNN’s Public Works Engineer and SWM Officer (Health Officer). There can be many such inter-institutional joint trainings/workshops focussed on Dehradun’s planned development.
During discussions held with DNN officers and the officers of UPJN and UJS, imperative need for training in many disciplines was emphasised by each and all. Training has to be properly designed and executed. A precondition can be to do an exhaustive Training Need Assessment exercise to find out the exact nature of ‘training needs’ of each organisation (Figure 4.6).

Uttarakhand Urban Development Project
Dehradun City Development Plan Page 97
Figure 4.6: Focus of Training Policies
Training is likely to be of cosmetic value unless it is done on the basis of rigorous training needs assessment and tied up with placement, promotion and career development policies of the involved organisations (refer Figure 4.7). It must also be sequenced in such a way that municipal staff are able to immediately apply the techniques and approaches leaned to their every day working practice. A tentative training profile is presented below.
4.7.1 Political Leadership
Capacity Building for political leadership is of paramount importance. Municipal Laws (and other institutional statutes), rules and regulations need to be clarified in easy language for proper understanding of the ‘formalities’ that are often not known to the politicians (leading to misgivings and apprehension and even conflict).
In a democracy, it is the capacity of political leadership to ’vision’ the future, ‘understand’ the present and ‘guide’ future development that makes or mars development management at any level. Specially for DNN leadership, following programmes (Training/workshop/seminars) can be imaginatively organised (refer Figure 4.8).
An able, understanding and sensitive political leadership, cutting across political lines, is an asset to municipal management and this kind of leadership is hardly ever self made; it has to be groomed through appropriate training programmes.
Training Need Assessment for the Organisations
POLICY
Placement
PromotionCareer Development

Uttarakhand Urban Development Project
Dehradun City Development Plan Page 98
Figure 4.7: Training Needs for Organisations
Figure 4.8: Training/Workshops for DNN’s Political Leadership
Type of EmployeesContents of TrainingType of Training
Secretarial
Technical
Taxation & Finance
Managerial
Citizen Administration Interface
Office Management, File keeping etc.
Creation and Management of Database, Repair/upkeep of vehicles, water supply system, tubewells, Planning and Design
of facilities both at local and city level etc.
Taxation system administration from valuation to collection, Finance revenue mobilisation, accounts, book-keeping, audit
Human resource management, supply management, IT development, e governance etc.
Grievance redressal system, right to information, citizen's charter, information edcation and communication
Clerical
Cutting edge level technicians
Officers/Staff dealing w ith Taxation & Financial Management
Departmental Off icers
Staff/Off icers dealing w ith citizens
ParticipantsContentsThemes
Meetings Management
Portfolio Management
Management Information System
Agenda Setting, facilitating time bound discussions, etc.
Understanding; broadly the problems of sectors such as SWM, Public Works, Parks & gardens, Finance & Taxation, etc.
Understanding and using multi tier management information system (MIS) in day-to-day work and periodic review work
For both ruling group and opposition
For ruling group particularly but also for opposition
For all councillors
Citizen Municipality Interface
Listening to citizens, directing them to appropriate department/agency, help solve citizen's problems, etc.
For all councillors

Uttarakhand Urban Development Project
Dehradun City Development Plan Page 99
5. Financial Profile of Dehradun Nagar Nigam (DNN) and Other Agencies
5.1 Towards a City Development Plan – Financial Aspects
This chapter on the financial aspects of the City Development Plan (CDP) of Dehradun is anchored onto the primarily goal of the Jawaharlal Nehru National Urban Renewal Mission (JNNURM), namely, creating economically productive, efficient, equitable and responsive cities. It is divided into the following sections: Section 5.2 gives a review and analysis of the existing fiscal and financial situation of the city in terms of trends in revenues and expenditures of the concerned agencies. Section 5.3 aims to the financial analysis of Dehradun Nagar Nigam (DNN). Section 5.4 deals with the financial analysis of Mussourie Dehradun Development Authority (MDDA). Section 5.5 deals with the financial analysis of the Uttarakhand Jal Sansthan, Dehradun Division.
5.2 Review of Existing Fiscal and Financial Situation
The purpose of this stage is to review and analyse the existing financial situation in terms of trends in the revenues and expenditures of the authorities concerned with the development of the city.
The urban services are provided by multiple agencies in Dehradun (see Chapter 4). These are:
• Mussourie Dehradun Development Authority (MDDA),
• Dehradun Nagar Nigam, (DNN),
• Uttarakhand Jal Sansthan (UJS),
• Public Works Department (PWD),
• Irrigation Department (ID),
• Police Department - Fire Services (PD)
• Uttarakhand Power Corporation (UPC)
DNN, UJS, and MDDA are the three most important agencies responsible for the urban finance in Dehradun. DNN’s revenue receipts (own) mainly comprises of Property / House tax, rentals and advertisement. UJS’s revenue receipts are mainly water tax and water charges. MDDA’s revenue receipts mainly arise out of urban assessment, interest and miscellaneous receipts, deposits and loan recoveries while capital receipts comprise of capital loan recoveries and grants from state and central governments. Its revenue expenditure is due to establishment, operation and maintenance, interest and debt servicing as also due to refund of deposits. Its capital expenditure comprise of land acquisition, development works, construction as also grants to DNN and Panchayats and acquisition of other assets.

Uttarakhand Urban Development Project
Dehradun City Development Plan Page 100
5.3 Overview of DNN Finances
DNN has been assigned a range of functions related to the provision of the public services. They strive to meet the costs of constructing and maintaining urban facilities and services. The revenue receipts comprise own sources (taxes and non-taxes) of the Nigam and grants. Capital receipts comprise revenues earned from sale of land, general grants from state and central governments and various loans. Revenues are raised to cover capital investments and recurrent revenue expenditures. The raised revenues must be utilized to attain the needs of the public as well as enhance the development of the city as a whole. The revenue expenditure comprises salaries and wages, establishment, operations and maintenance and interest and debt servicing. Capital expenditure includes grants, equipment/assets, loan repayments and refunds. The accounts of the DNN are maintained presently on cash based single-entry system. The process of conversion into accrual based double entry accounting system has been initiated.
DNN is empowered to levy and collect taxes approved by the state government.
Figure 5.1: Structure of DNN Finances
Table 5.1: Summary financial profile of DNN FY 2001-02 to FY 2005-06 (INR million)
Items 2001-02 2002-03 2003-04 2004-05 2005-06 Avg. % Contribution
Revenue Receipts 112.3 158.4 173.6 135.5 180.6 152.1 76.1%
Capital Receipts 18.4 86.3 24.1 12.9 96.7 47.7 23.9% Total Receipts 130.7 244.6 197.7 148.4 277.3 199.7 100.0% Revenue Expenditure 107.0 115.1 126.6 114.6 132.9 119.3 72.4%
Capital Expenditures 43.7 29.7 53.9 48.0 51.6 45.4 27.6%
Total Expenditure 150.7 144.8 180.5 162.6 184.6 164.7 100.0%
Surplus/(Deficit) -20.1 99.8 17.2 -14.3 92.7 Source: DNN income statement
Municipal Finances
Receipts Expenditure
Revenue Receipts
Capital Receipts
Revenue Expenditure
Capital Expenditure
Own: Tax; Non Tax Grants
Sale of land; Grants; Loans; Others
Salaries and Wages; Establishment; Operation and Maintenance
Development; Grants; Equipments; Loans and Others

Uttarakhand Urban Development Project
Dehradun City Development Plan Page 101
Table 5.2 shows that there have surplus in every year excepting in the year 2001-02 and 2004-05. However, this does not take into account the unpaid liabilities towards dues to Uttarakhand Power Corporation (about Rs. 200 million). There is no definite growth trend in the case of revenue as well as capital receipts. However, revenue expenditure and capital expenditure have shown an increasing trend over the years.
Figure 5.2: Income and Expenditure DNN
-50.0
0.0
50.0
100.0
150.0
200.0
01-02 02-03 03-04 04-05 05-06
INR
Mill
ion
Revenue Receipts Capital Receipts Revenue Expenditure
Capital Expenditure Surplus / (Deficit)
Source: DNN income statement
5.3.1 Receipts Analysis
A. Revenue Receipts Own Sources
The revenues basically comprise of own tax and non-tax revenues, grants from the state government. As in the case of other municipal bodies, DNN’s tax revenue comprises the revenues from property/ house tax, advertisement hoardings tax, road/ market/ footpath tax and entertainment tax. They together contribute about 18 percent of the revenue receipts. Non-tax revenues in the form of fees, licenses, etc contributes hardly 4 percent. Grants from State Government constitutes substantial portion at 78% of total revenues on five year average basis.
Table 5.2: Summary Revenue by Source Categories, DNN FY 2001-06 (INR million)
Items 2001-02 2002-03 2003-04 2004-05 2005-06 Avg. % Contribution
Own Sources - Tax Income 24.7 26.5 26.4 25.6 27.8 26.2 17.7% Own sources - Non Tax Income 4.3 5.2 4.4 6.9 6.9 5.5 3.8% State Govt. Grants 80.5 122.0 139.8 98.0 139.6 116.0 78.5% Total Revenue Receipts 109.5 153.6 170.6 130.4 174.3 147.7 100.0% Source: DNN income statement

Uttarakhand Urban Development Project
Dehradun City Development Plan Page 102
Figure 5.3: Trends in Revenue receipts
Source: DNN income statement
Composition of Own Sources Taxes
DNN levies house tax and service– based taxes of different types against the services provided by it to the citizens and income from such sources is known as receipts under own sources. Of the tax revenues house tax is the most important tax, followed by the advertisement tax. Over the years the share of advertisement tax to total own tax income has steadily increased. House / Property tax is levied at uniform rate of 12.5% of the Annual Ratable Value (ARV). Basis of determining ARV is based on market rent in some cases and based on five percent of cost of land and construction cost in other cases.
Figure 5.4: Composition of Own Sources Taxes Source: DNN income statement
0.020.040.060.080.0
100.0120.0140.0160.0180.0200.0
01-02 02-03 03-04 04-05 05-06
INR
Mill
ion
Own - Tax Income Own - Non Tax Income State Govt Grants
75.0%
80.0%
85.0%
90.0%
95.0%
100.0%
105.0%
01-02 02-03 03-04 04-05 05-06
House Tax Advertisements Tax Other Taxes

Uttarakhand Urban Development Project
Dehradun City Development Plan Page 103
Advertisement tax rates are as under:
Advertisement hoardings and posters - Rajpur Road 18150 - Chakrata Road 11000 - Gandhi Road 6500 - Saharanpur / Haridwar Road 5500 - Private Buildings 5500 - On internal roads 5500 Source: DNN house tax department
Non-Tax Sources
Non-Tax income from revenue sources comprises various components like fess under municipal acts, penalties and other miscellaneous charges fro provision of certain services. The income from non-tax revenue receipts has increased from INR 7.041 million in FY 2001–02 to INR 9.903 million in FY 2005 –06 (Table 5.3).
Table 5.3: Composition of Non-tax revenues, DNN FY 2001-02 to FY 2004-05 INR million
Items 2001-02
2002-03
2003-04
2004-05
2005-06
Avg. % Contribution
Ground Rent 0.609 1.081 1.191 0.862 0.640 0.877 8.9% Open Land (Parking Contr.) 1.668 0.765 0.972 1.084 1.272 1.152 11.6%
Rent of Town Hall 0.108 0.089 0.139 0.162 0.220 0.144 1.5% Health Centres Fees 0.015 0.008 0.007 0.005 0.007 0.008 0.1% Bazaar / Meet Market 0.013 0.013 0.018 0.017 0.017 0.016 0.2% Slaughter House 0.035 0.036 0.041 0.274 0.441 0.165 1.7% Photocopy charges 0.169 0.231 0.268 0.265 0.325 0.252 2.5% Teli License 0.143 0.149 0.132 0.046 0.206 0.135 1.4% Oil License 0.005 0.005 0.004 0.007 0.003 0.005 0.0% Hotel Licence 0.091 0.108 0.024 2.392 1.237 0.770 7.8% Fruit / Vegetables Licence 0.006 0.006 0.006 0.006 0.023 0.009 0.1%
Wheat Flour Mills Licence 0.006 0.007 0.007 0.004 0.004 0.006 0.1%
Loudspeaker Licence 0.003 0.003 0.005 0.001 0.001 0.003 0.0% Registration Charges 0.207 0.127 0.137 0.128 0.101 0.140 1.4% Sale of Stock 0.286 0.204 0.169 0.377 0.447 0.297 3.0% Fines and Penalties 0.146 0.301 0.307 0.295 0.355 0.281 2.8% Road Cutting Charges 0.816 1.957 0.520 0.892 1.551 1.147 11.6% Cozy House 0.012 0.126 0.447 0.036 0.093 0.143 1.4% Interest on Investment 1.174 0.349 0.569 0.632 1.512 0.847 8.6% Sale of Waste 0.013 0.044 0.020 0.037 0.009 0.024 0.2% Rent of Tankers 0.008 0.031 0.001 0.002 0.006 0.010 0.1% Hearse Rental Charges 0.015 0.008 0.006 0.002 0.012 0.009 0.1% Others 1.493 4.276 2.399 4.430 4.722 3.464 35.0% Total 7.041 9.924 7.389 11.957 13.204 9.903 100.0%
Source: DNN income statement
State Government Grants
The most important source of revenue receipts is the grants from the State government. Over the years, there has been a steady increase in the grants. Grants from the state government have increased from Rs. 80.5 million in the year 2001-02 to Rs. 116 million in 2005-06 (Table 5.2).

Uttarakhand Urban Development Project
Dehradun City Development Plan Page 104
B. Capital Receipts
Capital receipts of DNN mainly comprise sale of land, general grants and loans. They have increased from INR 18.5 million in FY 2001-02 to INR 96.7 million in FY 2005-06 with lowest figure of Rs. 12.9 million in 2004-05. Capital receipts also declined in FY 2003-04 (Table 5.4).
Table 5.4: Composition of Capital Receipts, DNN FY 2001-02 to FY 2005-06 INR million
Items 2001-02 2002-03 2003-04 2004-05 2005-06 Natural Calamity Relief Grant 0.000 0.000 0.000 0.300 0.000
Eleventh Finance Commission 0.000 3.601 7.021 7.201 0.000
Contractors' Deposits 0.010 0.000 0.000 0.019 0.006 Sale of Land / immovable properties 18.397 18.921 15.786 1.717 1.253
Stamp Duty 0.000 0.000 0.000 0.000 69.289 Revolving Fund – Loan 0.000 47.738 1.109 0.722 0.000
Integrated Development Plan (IDSMT)
0.000 16.008 0.147 2.894 0.495
Grants under twelfth finance commission 0.000 0.000 0.000 0.000 15.654
Grants under National Slums Develop Program
0.000 0.000 0.000 0.000 10.000
Total 18.407 86.268 24.063 12.853 96.697
Source: DNN Income Statement
5.3.2 Expenditure Analysis
As regards the expenditure of DNN, total expenditure has risen from INR 150.7 million in FY 2001-02 to INR 184.6 million in FY 005-06 that is at about 5.2 percent per annum (Table 5.1).
Figure 5.5 suggests that more than 70% of the expenses are incurred under revenue expenditure and the remaining goes to the capital expenditure side.
Figure 5.5: Share in Expenditure (%)
Source: DNN income statement
0.0%20.0%40.0%60.0%80.0%
100.0%120.0%
01-02 02-03 03-04 04-05 05-06
Revenue Expenditure Capital Expenditure

Uttarakhand Urban Development Project
Dehradun City Development Plan Page 105
C. Revenue Expenditure
Revenue expenditure comprising salaries and wages, establishment, operation and maintenance and interest payments, has been rising faster than the capital expenditure.
Table 5.5: Composition of Revenue expenditure, DNN FY 2001-02 to FY 2005-06 INR million
Items 2001-02 2002-03 2003-04 2004-05 2005-06 Avg. % Contribution Salaries and Wages 83.3 87.7 100.5 96.0 109.2 95.4 80.0%
Establishment 8.8 13.8 18.5 11.9 13.2 13.2 11.1% Operation and Maintenance
15.0 13.6 7.5 6.7 10.5 10.6 8.9%
Others 0.0 0.0 0.0 0.0 0.0 0.0 0.0% Total 107.0 115.1 126.6 114.6 132.9 119.3 100.0% Source: DNN Income Statement
Figure 5.6 depicts the wide gap between the various components of revenue expenditure. The wage bill has been growing at 7 percent per annum accounts for 80% of the total revenue expenditure. Establishment is growing at nearly 11 percent per annum. Establishment expenditure accounts to almost 11% of the total revenue expenditure (Table 5.5). Operation and Maintenance is showing a decreasing trend.
D. Capital Expenditure
Capital expenditure comprises of development expenditure, grants expenditure, assets, loan repayments and various refunds. It has more or less remained constant (Table 5.1).
Table 5.6: Composition of capital expenditure, DNN FY 2001-02 to FY 2005-06 INR million
Items 2001-02 2002-03 2003-04 2004-05 2005-06 Avg. % Contribution Development Fund Expenditure
27.5 9.1 23.8 7.2 4.8 14.5 31.9%
Grant Expenditure 8.6 11.3 23.9 39.3 37.1 24.0 53.0%
Equipment / Assets 7.5 9.3 6.3 1.5 9.8 6.9 15.1%
Total 43.7 29.7 53.9 48.0 51.6 45.4 100.0% Source: DNN income statement
0.0%20.0%40.0%60.0%80.0%
100.0%120.0%
01-02 02-03 03-04 04-05 05-06
Salaries & Wages Establishment Operation & Maintenance

Uttarakhand Urban Development Project
Dehradun City Development Plan Page 106
Figure 5.7 suggests that development expenditure has been showing an decreasing trend over the last five FYs indicating decline in impetus on development. Grant expenditure has shown a constant increasing trend. Expenses on purchase of equipment / assets have decreased in years 2003-04.
Figure 5.7 Development Expenditure
5.3.3 Key Indicators
This section gives the financial indicators which helps in analysing the efficiency and operational performance. These have been calculated as an average over a period of five years, which provides a more realistic picture. The fiscal health of the DNN is brought out clearly by the fiscal indicators in Table 5.7.
Table 5.7: Fiscal health indicators, DNN FY 2001-02 to FY 2005-06
Fiscal Health Indicators - DNN 01-02 to 05-06 Average %
Resource Mobilisation
Share of Own Revenue in Revenue Income 21.5%
Growth in Revenue Income 12.3%
Growth in Own Resources of Revenue Income 4.6%
Share of Non Tax in Revenue Income 3.8%
Share of House Tax in Revenue Income 16.1%
Expenditure Management
Share of Expenditure on Salaries and Wages in total Revenue Expenditure 80.0%
Share of Expenditure on Salaries and Wages in total Revenue Income 64.6%
Performance Assessment
Revenue Account Balance (Rs. Million) 32.8
Capital Account Balance (Rs. Million) 2.3
Operating Ratio (Rev Expenses/ Income) 0.81
Establishment Cost / Revenue Receipts 0.09
Capital Utilisation Ratio 0.95
Source: DNN income statement
DNN’s performance with respect to resource mobilization and expenditures has not been good during the last years as the growth rate of the income is not enough to meet the revenue expenditure. Moreover the share of salaries and wages in the total revenue expenditure is 80% on an average, which is very high, especially in view of the fact that the revenue expenditure is approximately 70% of the total expenditure.
0 . 0 %
2 0 . 0 %
4 0 . 0 %
6 0 . 0 %
8 0 . 0 %
10 0 . 0 %
12 0 . 0 %
0 1- 0 2 0 2 - 0 3 0 3 - 0 4 0 4 - 0 5 0 5 - 0 6
D e v e l o p m e n t E x p e n d i t u r e G r a n t E x p e n d i t u r e E q u i p m e n t / A s s e t s
Uttarakhand Urban Development Project
Dehradun City Development Plan Page 107
House tax contributes only 16% in the total revenues, which is very low as compared to the contribution of the same in other states of the country.
The Operating Ratio, which is defined as the ratio of revenue expenditure to revenue income, is an indicator of profitability of the operations of a local body. For DNN, it is less than unity indicating that the revenue expenditure is fully met by revenue income.
Capital Utilization Ratio is the ratio of capital expenditure to the capital income. This ratio indicates the performance of the local body in terms of utilization of capital income – it also serves as an indicator of the local bodies’ capacity to utilize capital resources. Capital utilization ratio of greater than unity indicates that revenue account surplus has been utilized for capital works, which is a positive feature. A capital utilization ratio below unity indicates that either capital income is being diverted for revenue expenditure (when operating ratio is above unity) or that part of capital income is unspent during the FY under consideration. In case of DNN, the capital utilization ratio is lesser than unity.
5.3.4 Dehradun Nagar Nigam – Key Issues
Overall, there appears to be lack of experience in handling big infrastructure projects. DNN still depends substantially on state government grants for meeting its revenue expenditure.
Efforts are under way for converting the accounts into accrual system of accounting. There is a need to provide suitable training on double-entry accounting/accrual system of accounting.
The arrears (accounts receivable) need to be reduced by streamlining the collection machinery. The revenue collection system is inefficient and the asset management and maintenance is inadequate. There is lack of financial and taxation powers, the DNN cannot borrow from the market. There is considerable room for review and revision of the current tax rates. The data base and information management is poor and there is a lack of use of technology in infrastructure monitoring.
All properties have to be brought in the books of DNN for property / house tax assessment. The last survey conducted in the year 2004 was not completed in entirety. Newly developed areas have yet to be brought under property / house tax assessment coverage. At present the number of properties assessed as per DNN records are about 50,250. As per discussions and information available the number of additional properties could be as much as 30,000 to 35,000.
DNN has also disputed property tax demands outstanding from central government, state government and public sector entities owned properties. As on 31st March 2006, such outstanding property tax dues are about Rs. 4.65 million.
The demand, collection and balance details of DNN in respect of house/ property tax are given in Table 5.8.

Uttarakhand Urban Development Project
Dehradun City Development Plan Page 108
Table 5.8: Demand, Collection and Balance INR Million
2002-03 2003-04 2004-05 2005-06 Opening Balance 10.439 13.122 16.315 16.394 Current Demand 28.688 26.149 25.038 24.394 Total Demand 39.127 39.271 41.353 40.788 Total Collections 26.005 26.251 24.736 27.000 Out of which: against current demand 22.200 22.825 21.747 220.00 against arrears 3.805 3.426 2.989 5.000 Closing Balance 13.122 13.020 16.617 13.788 Collection Recovery trends (%) Collections against current demand (%) 77.4% 87.3% 86.9% 90.2% Collections against arrears demand (%) 36.4% 26.1% 18.3% 30.5% Total Collections against Total Demand (%) 66.5% 66.8% 59.8% 66.2%
The tax collection efficiency needs to be improved.
5.4 Overview of Mussourie Dehradun Development Authority (MDDA) Finances
MDDA finance structure comprises income and expenditure (Figure 5.8). The income sources of MDDA may be categorized as development charges, compounding fees, conversion charges, supervision and stacking charges, interest received etc. The expenditure comprises salaries and allowances, development charges, office maintenance and other expenses, interest paid and depreciation.
Figure 5.8: Income and Expenditure of MDDA
-50.0
0.0
50.0
100.0
150.0
200.0
250.0
300.0
01-02 02-03 03-04 04-05
INR
Mill
ion
Income Expendit ure Prof it / (Loss)
Source: Audited accounts
From the above figure it can be seen that the over the years both income and expenditure have shown an increasing trend. MDDA earned small profits in 2001-02, 200-03 before posting a loss of Rs. 14.3 million in 2003-04. However, this trend was reversed in 2004-05 and MDDA earned a profit of Rs. 21.5 million in 2004-05.
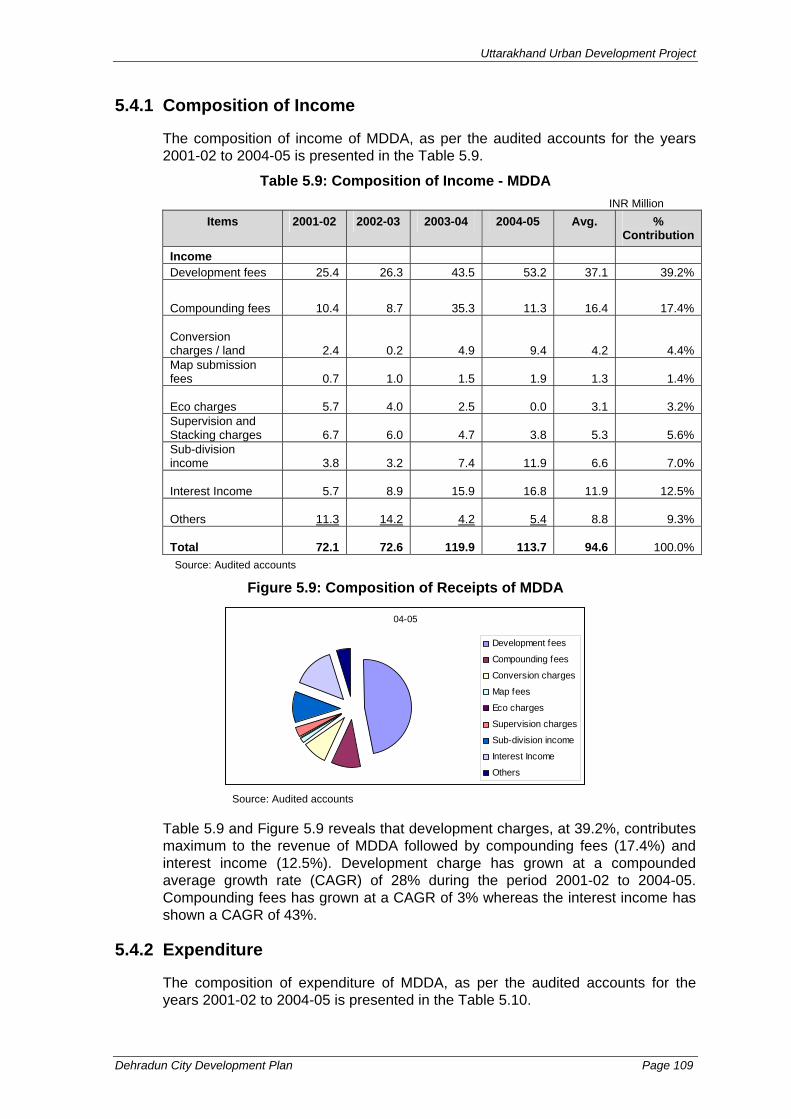
Uttarakhand Urban Development Project
Dehradun City Development Plan Page 109
5.4.1 Composition of Income
The composition of income of MDDA, as per the audited accounts for the years 2001-02 to 2004-05 is presented in the Table 5.9.
Table 5.9: Composition of Income - MDDA INR Million
Items 2001-02 2002-03 2003-04 2004-05 Avg. % Contribution
Income Development fees 25.4 26.3 43.5 53.2 37.1 39.2%
Compounding fees 10.4 8.7 35.3 11.3 16.4 17.4%
Conversion charges / land 2.4 0.2 4.9 9.4 4.2 4.4% Map submission fees 0.7 1.0 1.5 1.9 1.3 1.4%
Eco charges 5.7 4.0 2.5 0.0 3.1 3.2% Supervision and Stacking charges 6.7 6.0 4.7 3.8 5.3 5.6% Sub-division income 3.8 3.2 7.4 11.9 6.6 7.0%
Interest Income 5.7 8.9 15.9 16.8 11.9 12.5%
Others 11.3 14.2 4.2 5.4 8.8 9.3%
Total 72.1 72.6 119.9 113.7 94.6 100.0% Source: Audited accounts
Figure 5.9: Composition of Receipts of MDDA
04-05
Development fees
Compounding fees
Conversion charges
Map fees
Eco charges
Supervision charges
Sub-division income
Interest Income
Others
Source: Audited accounts
Table 5.9 and Figure 5.9 reveals that development charges, at 39.2%, contributes maximum to the revenue of MDDA followed by compounding fees (17.4%) and interest income (12.5%). Development charge has grown at a compounded average growth rate (CAGR) of 28% during the period 2001-02 to 2004-05. Compounding fees has grown at a CAGR of 3% whereas the interest income has shown a CAGR of 43%.
5.4.2 Expenditure
The composition of expenditure of MDDA, as per the audited accounts for the years 2001-02 to 2004-05 is presented in the Table 5.10.

Uttarakhand Urban Development Project
Dehradun City Development Plan Page 110
Table 5.10: Composition of Revenue Expenditure INR Million
Items 2001-02 2002-03 2003-04 2004-05 Avg. % Contribution
Expenditure Salaries, allowances etc. 9.4 10.6 13.4 11.4 11.2 12.2%
Development expenses 30.1 30.1 66.7 30.0 39.2 42.9%
Office maintenance and other expenses 16.2 14.2 16.3 15.5 15.5 17.0%
Interest and finance charges paid 12.1 15.2 36.8 34.7 24.7 27.0%
Depreciation 0.7 0.8 1.1 0.7 0.8 0.9%
Total 68.5 70.9 134.2 92.2 91.5 100.0%
Source: Audited accounts
Figure 5.10: Composition of expenditure of MDDA
04-05
Salaries, allow ances etc.
Development expenses
Office maintenance &other expenses
Interest & f inancecharges paid
Depreciation
Table 5.10 and Figure 5.10 reveals that, out of the total expenses, development expenses forms the largest portion at 42.9% followed by interest and finance charges at 27% and salaries and allowances at 12.2%. Development expense has remained more or less constant except for the year 2003-04. Interest and finance charges, however, has gone up significantly in absolute terms with a CAGR of 42%.
5.4.3 Financial Position of MDDA
A study of the audited balance sheet as at 31st March 2005 reveals that apart from Seed Capital / Loan from UP Government – Rs. 175 million, there are loans from Hudco (Rs. 635 million), banks (Rs. 146 million) and advances from customers (Rs. 458 million). The funds have been invested in land (Rs. 811 million), capital projects under hire purchase schemes (Rs. 406 million) and in fixed deposits with banks (Rs. 137 million). There is a debit balance in working capital fund amounting to Rs. 51 million.

Uttarakhand Urban Development Project
Dehradun City Development Plan Page 111
5.5 Assessment of Financial Performance of Uttarakhand Jal Sansthan (Dehradun Division)
Summarised financial position of Dehradun division of Uttarakhand Jal Sansthan is presented in Table 5.11 and Figure 5.11. In this table the income does not include operational grant received from State Government. The expenses figures for the years 2003-04 and 2004-05 does not include Electricity / Power charges. A review of past five years’ power charges shows that average annual electricity / power charges /bill for this division comes to about Rs. 65 to 70 million. Considering this in the expenses of 2003-04 and 2004-05 there is really no operating surplus.
Table 5.11: Financial Summary INR Million
Financial Summary 2003-04 2004-05 2005-06 Income (without grant) 78.911 99.949 98.042 Expenses 51.497 52.504 129.591 Surplus / (Deficit) 27.414 47.445 -31.549 Source: accounts statement
Figure 5.11: Financial Summary
-50.000
0.000
50.000
100.000
150.000
200.000
250.000
2003-04 2004-05 2005-06
INR
Mill
ion
Income (without grant) Expenses Surplus / (Deficit)
Source: accounts statement
As per the information available all the power dues have been settled this year with grants received from the State Government.
Composition of Income of Dehradun Division of Jal Sansthan is given in the Table 5.12.
Table 5.12: Composition of Income – DDN Division INR Million
Income Composition 2003-04 2004-05 2005-06 Water tax 26.346 27.451 26.771 Water charges 41.028 56.384 55.704 Sewer tax 3.385 3.898 3.099 Sewer seat charges 0.332 1.130 1.916 Other charges 7.819 11.085 10.552 Grant from State Government (power) 0.000 0.000 39.653
Total Income 78.911 99.949 137.695 Source: accounts statement

Uttarakhand Urban Development Project
Dehradun City Development Plan Page 112
Composition of expenses of Dehradun Division of Jal Sansthan is given in Table 5.13.
Table 5.13: Composition of Expenses – DDN Division INR Million
Expenses Composition 2003-04 2004-05 2005-06 Operational expenses 2.370 1.568 72.552 Operation and maintenance 14.747 11.005 12.342 Establishment 32.184 37.079 40.871 Office expenses 2.197 2.852 3.826 Total 51.497 52.504 129.591 Source: accounts statement
Collection efficiency of the Dehradun Jal Sansthan is 36% of total demand. This needs to be improved upon. The table depicting the demand, collection and balance in respect of various items of revenue of this division for the year 2005-06 is given in Table 5.14.
Table 5.14: Demand, Collection and Balance Statement INR Million
Income Head Opening balance
Current Demand
Total Demand
Collections Balance 31.3.2006
Water tax 33.032 29.426 62.458 26.771 35.687 Water charges 95.726 86.955 182.681 55.705 126.976 Sewer tax 6.800 3.742 10.542 3.100 7.442 Sewer seat charges 1.010 2.292 3.302 1.917 1.385 Other charges 0.804 9.985 10.789 9.985 0.804 Total Income 137.372 132.400 269.772 97.479 172.294 Source: accounts statement
5.5.1 Key Issues
Jal Sansthan (Dehradun Division) is not able to generate revenue on its own to meet its revenue / operational expenses. The Division I still is dependent on the State Government grants for meeting portion of its operational expenses.
Collection efficiency needs to be substantially improved from the present level of 36% in respect of various charges levied by the Jal Sansthan, Dehradun Division.

Uttarakhand Urban Development Project
Dehradun City Development Plan Page 113
6. The City and its Vision 6.1 Introduction
Dehradun is at a crossroad at this point in its long history. From a city with a legacy of British Raj, carrying an image of abode of famous institutions (like the Survey of India, Forest Research Institution, Oil and Natural Gas Commission etc..), the city has suddenly become capital of a new state. Being a new state it has the energy to expand, grow and become prosperous in the immediate future. This energy and sudden growth is very evident. The peace and serenity may give rise to a bustling new capital with a vibrant economic activity. The question that is uppermost in the minds of its citizens is how to preserve its noble man like character with a dignified way of living in the midst of peace and quiet. Clearly, the city needs a vision for the future in which it can retain its character yet provide space for a dynamism that is required for a capital of a new state. The dreams of a newly formed state must find its expression in its capital, coveted by its citizens. Before proceeding towards preparation of its vision, it is imperative to have an overview of its strength, weaknesses, opportunities and threats. Accordingly, SWOT analyses were carried out for the city and various sectors as detailed in the subsequent paragraphs.
6.2 SWOT Analysis The existing situation analysis were carried out first by using all available information from various departments and agencies concerned with urban services and functions. Data gaps were identified and these information gaps were bridged and supplemented by conducting a city-wide survey. The survey was carried out to supplement information and data available from various departments and agencies. Further, first-hand information about citizens’ satisfaction and opinion about urban services, priorities, willingness to participate in development were also obtained from the survey. Simultaneously, extensive participatory consultation with all stakeholders were carried out. Based on the analysis of existing situation, extensive participatory consultation with primary and secondary stakeholders, city’s Strengths, Weaknesses, Opportunities and Threats (SWOT) were assessed. SWOT analysis were also carried out for individual sectors. Table 6.1 presents the SWOT analysis done at city level and Table 6.2 presents the SWOT analysis for individual sectors.

Uttarakhand Urban Development Project
Dehradun City Development Plan Page 114
Table 6.1: City Level SWOT Analysis
STRENGTHS
Interim capital of the new State An important tourist town in
north India nestled in Doon Valley
Rich in natural resources, forests, orchards, scenic beauty
Proximity to National Capital Good connectivity by train and
road to important cities in North India
Presence of many institutions of national importance including defence
Gateway to pilgrim towns of State
WEAKNESSES
Lack of economic base other than tourism
Poor urban infrastructure and services
Lack of development controls Poor public transport and
inadequate road network Inability to meet the growing
demand for affordable housing Growing environmental pollution,
particularly air and water Ad hoc and unplanned urban
development
OPPORTUNITIES
Fast growing city Tourism development –
particularly eco-tourism in and around Dehradun
Growing hotel industry Potential knowledge hub due to a
good institutional base Good opportunities for higher
education and research
THREATS
Neglect of heritage areas could weaken tourism potential of the city
Disaster prone area Lack of effective disaster
management mechanisms Demand for economic growth
and high expectation from the new interim capital
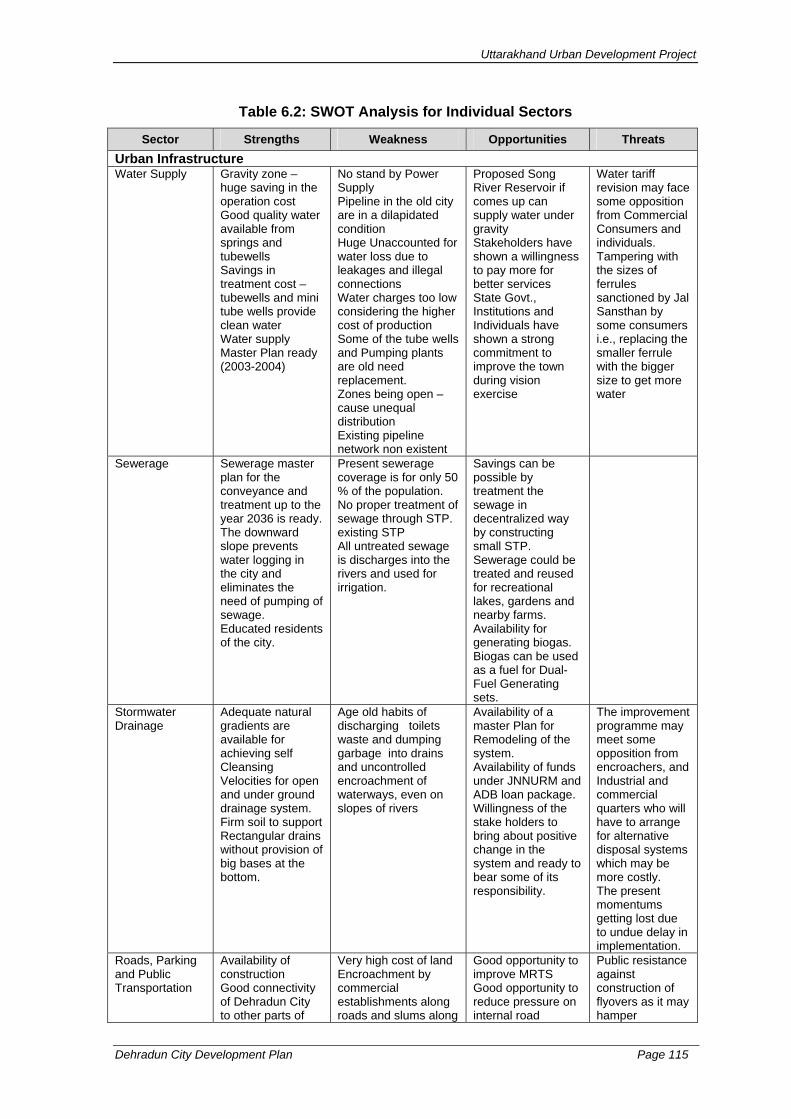
Uttarakhand Urban Development Project
Dehradun City Development Plan Page 115
Table 6.2: SWOT Analysis for Individual Sectors
Sector Strengths Weakness Opportunities Threats Urban Infrastructure Water Supply Gravity zone –
huge saving in the operation cost Good quality water available from springs and tubewells Savings in treatment cost – tubewells and mini tube wells provide clean water Water supply Master Plan ready (2003-2004)
No stand by Power Supply Pipeline in the old city are in a dilapidated condition Huge Unaccounted for water loss due to leakages and illegal connections Water charges too low considering the higher cost of production Some of the tube wells and Pumping plants are old need replacement. Zones being open – cause unequal distribution Existing pipeline network non existent
Proposed Song River Reservoir if comes up can supply water under gravity Stakeholders have shown a willingness to pay more for better services State Govt., Institutions and Individuals have shown a strong commitment to improve the town during vision exercise
Water tariff revision may face some opposition from Commercial Consumers and individuals. Tampering with the sizes of ferrules sanctioned by Jal Sansthan by some consumers i.e., replacing the smaller ferrule with the bigger size to get more water
Sewerage Sewerage master plan for the conveyance and treatment up to the year 2036 is ready. The downward slope prevents water logging in the city and eliminates the need of pumping of sewage. Educated residents of the city.
Present sewerage coverage is for only 50 % of the population. No proper treatment of sewage through STP. existing STP All untreated sewage is discharges into the rivers and used for irrigation.
Savings can be possible by treatment the sewage in decentralized way by constructing small STP. Sewerage could be treated and reused for recreational lakes, gardens and nearby farms. Availability for generating biogas. Biogas can be used as a fuel for Dual-Fuel Generating sets.
Stormwater Drainage
Adequate natural gradients are available for achieving self Cleansing Velocities for open and under ground drainage system. Firm soil to support Rectangular drains without provision of big bases at the bottom.
Age old habits of discharging toilets waste and dumping garbage into drains and uncontrolled encroachment of waterways, even on slopes of rivers
Availability of a master Plan for Remodeling of the system. Availability of funds under JNNURM and ADB loan package. Willingness of the stake holders to bring about positive change in the system and ready to bear some of its responsibility.
The improvement programme may meet some opposition from encroachers, and Industrial and commercial quarters who will have to arrange for alternative disposal systems which may be more costly. The present momentums getting lost due to undue delay in implementation.
Roads, Parking and Public Transportation
Availability of construction Good connectivity of Dehradun City to other parts of
Very high cost of land Encroachment by commercial establishments along roads and slums along
Good opportunity to improve MRTS Good opportunity to reduce pressure on internal road
Public resistance against construction of flyovers as it may hamper

Uttarakhand Urban Development Project
Dehradun City Development Plan Page 116
Sector Strengths Weakness Opportunities Threats state and other states Good momentum of road construction work in the present ADB has agreed to extend loan for road construction
rivers Non availability of Labour
network by constructing byepasses and elevated road through rivers
accessibility to shops Rehabilitation of slums Removal of encroachments from roadside Acquisition of land for construction of proposed bypasses
Solid Waste Management
Bio medical waste is already handled separately High literacy of citizens make them amenable to awareness to adopt better practices
Non availability of suitable disposal site in close proximity to city Little segregation at source Poor primary collection Low density development over wide geographical area Indiscriminate dumping of waste in Stormwater drains and nallas
Scope for segregation of bio degradable waste Scope for decentralisation of waste collection and treatment Collect and treat organic waste from the decentralized fruit and vegetable markets and slaughter houses
Widespread use of polythene Present disposal site on Sahastradhara Road alongside the river
Physical Growth and Built Environment
Scenic beauty of hills, mountains and green areas Good connectivity with other important cities Strong administrative, educational and institutional base creating opportunities for urban growth Good climatic conditions attract people to settle down in Dehradun Home to many retired defence and administrative services personnel Lower land costs compared with other state capitals
Physical growth constraints such as Forests, Cantonment areas and other institutions such as Survey of India, IMA, FRI Rapid and unplanned development in the last decade Congested old city areas Encroachments in commercial areas Non conforming land uses especially in the old city areas Inadequate planning efforts for provision of parking places Lack of developed land for affordable housing
Suitable terrain and better accessibility in the south and southwest of Dehradun for future expansion Scope for infill development due to Scattered development with low density Scope for eco tourism based activities Untapped tourism potential in Dehradun Development of Dehradun as a regional tourist hub
Conversion of orchards and green areas for urban development Physical expansion of existing old buildings affecting aesthetics and leading to increased pressure on existing physical network of services Increasing noise and water pollution Rapid unplanned development along major transport corridors creating traffic congestion
Urban Poor Basic services of water supply, sanitation, drainage, waste management are available in many slums, however, there are shortfalls Desire to form community organizations
Inadequate housing provision Inadequate level of services Nonfunctional streetlights Lack of regular maintenance of facilities Lack of clear policy with regard to land
Scope for reactivation of existing community groups and formation of new ones Willingness to participate and pay for services
High level of encroachment along drains and nallas Insecurity of uprooting of squatter settlements Unsanitary conditions leading to poor
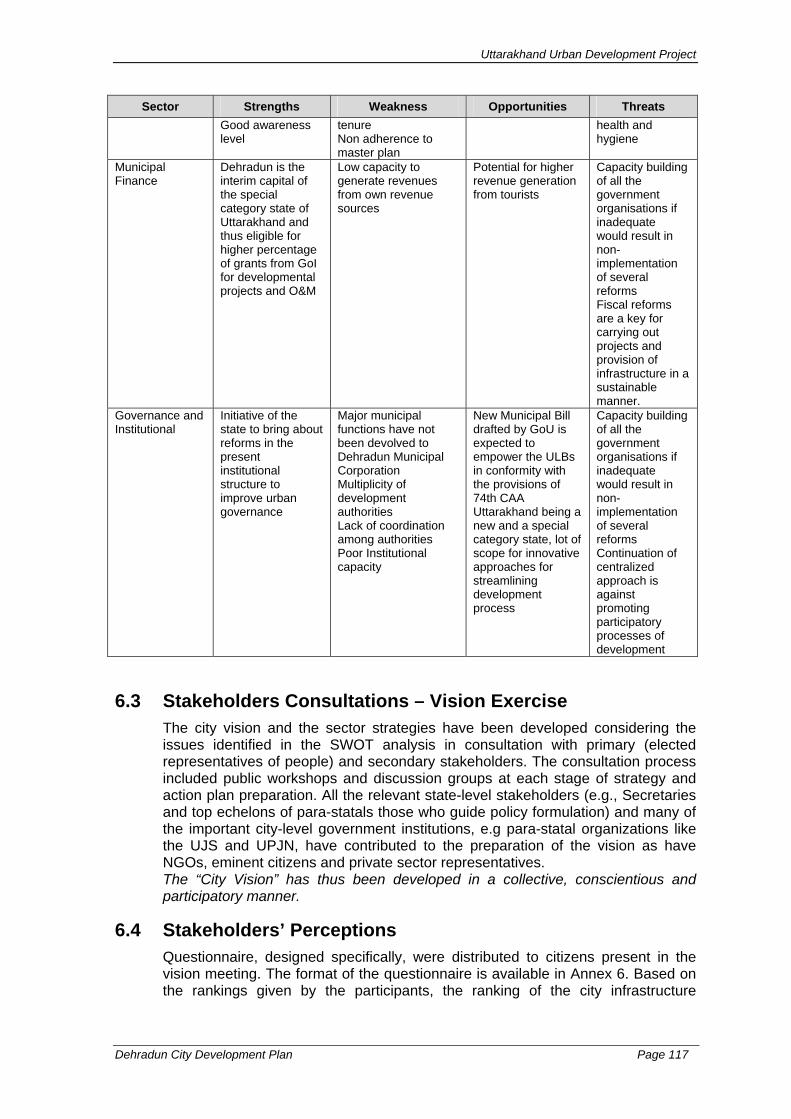
Uttarakhand Urban Development Project
Dehradun City Development Plan Page 117
Sector Strengths Weakness Opportunities Threats Good awareness level
tenure Non adherence to master plan
health and hygiene
Municipal Finance
Dehradun is the interim capital of the special category state of Uttarakhand and thus eligible for higher percentage of grants from GoI for developmental projects and O&M
Low capacity to generate revenues from own revenue sources
Potential for higher revenue generation from tourists
Capacity building of all the government organisations if inadequate would result in non-implementation of several reforms Fiscal reforms are a key for carrying out projects and provision of infrastructure in a sustainable manner.
Governance and Institutional
Initiative of the state to bring about reforms in the present institutional structure to improve urban governance
Major municipal functions have not been devolved to Dehradun Municipal Corporation Multiplicity of development authorities Lack of coordination among authorities Poor Institutional capacity
New Municipal Bill drafted by GoU is expected to empower the ULBs in conformity with the provisions of 74th CAA Uttarakhand being a new and a special category state, lot of scope for innovative approaches for streamlining development process
Capacity building of all the government organisations if inadequate would result in non-implementation of several reforms Continuation of centralized approach is against promoting participatory processes of development
6.3 Stakeholders Consultations – Vision Exercise The city vision and the sector strategies have been developed considering the issues identified in the SWOT analysis in consultation with primary (elected representatives of people) and secondary stakeholders. The consultation process included public workshops and discussion groups at each stage of strategy and action plan preparation. All the relevant state-level stakeholders (e.g., Secretaries and top echelons of para-statals those who guide policy formulation) and many of the important city-level government institutions, e.g para-statal organizations like the UJS and UPJN, have contributed to the preparation of the vision as have NGOs, eminent citizens and private sector representatives. The “City Vision” has thus been developed in a collective, conscientious and participatory manner.
6.4 Stakeholders’ Perceptions Questionnaire, designed specifically, were distributed to citizens present in the vision meeting. The format of the questionnaire is available in Annex 6. Based on the rankings given by the participants, the ranking of the city infrastructure

Uttarakhand Urban Development Project
Dehradun City Development Plan Page 118
Ranking of Infrastructure Development Areas - Summary of Citizen's Perception
0
1
2
3
4
5
6
7
8
9
10
WS SS SWM SWD Road PT ST TM P
City infrastructure Development Areas
Rank
ing
development areas have been carried out. Table 6.3 provides the details and the result is depicted in Figure below.
Table 6.3: Summary of Citizen’s Perceptions
City Infrastructure and Development Areas Ranking (1-most important, 9-least important .)
Summary / Average
Water Supply 1 2.5 Sewerage and Sanitation 2 3.3 Solid Waste Management 3 4.0 Storm Water Drainage 8 6.5 Road 4 4.1 Public Transport (Bus, Vikram, 3 wheeler, cycle Rickshaw, other) 6 5.9 Street lighting 7 6.3 Traffic Management 5 5.6 Parking 9 7.3
Recorded notes of Stakeholders meeting of 21st June and Mayor’s letter available in Annexure 6 .

Uttarakhand Urban Development Project
Dehradun City Development Plan Page 158
6.5 Contextual Framework for the Dehradun City Vision
The contextual framework for the Dehradun City vision is diagrammatically explained in Figure 6.1 below:
Figure 6.1: Contextual Framework for the Dehradun City Vision
High Rate of Economic and Demographic Growth
Further Burden on the Services and Reduction in the Quality of Life
INCREASED PRESSURE
ON LAND and EXISTING SERVICES
"DO NOTHING" SCENARIO
"PRO-ACTIVE APPROACH"
UNPLANNED and UNCONTROLLED
GROWTH
LACK OF SECTOR
CO-ORDINATION IN PLANNING and
DEVELOPMENTAL ACTIVITIES
DEHRADUN 2025 - THE VISION “A WELL-MANAGED, CLEAN, GREEN, ENVIRONMENT-FRIENDLY CITY
WITH A CHARACTER OF ITS OWN DEFINED BY SCENIC BEAUTY, INTELLECTUAL CAPITAL, ECO-FRIENDLY TOURISM THROUGH SUSTAINED ECONOMIC GROWTH FOR ALL OF ITS CITIZENS”
STRATEGIC OBJECTIVES MAKE DEHRADUN A MORE ENVIRONMENTALLY SUSTAINABLE CITY
through:
Planned Urban Development for Controlled Growth Sustained Economic Growth Reduced Service Deficiencies and Urban Poverty Alleviation Developed Community Awareness and Trust in Government
DEHRADUN BEYOND 2006?

Uttarakhand Urban Development Project
Dehradun City Development Plan Page 159
The particular economic and social goals of the city area are: • Improved safety and security • Improving life expectancy and health of the population • A literate, educated and skilled population with a strong entrepreneurial base • Strong and sustainable economic growth with better employment
opportunities • Increasing prosperity through higher quality jobs and better distribution of
wealth (incomes and assets) • Reducing levels of poverty and increasing personal and household incomes • Improving levels of environmental quality and sustainability • Responsive, people-centred governance through:
Higher rate of civic participation; and efficient and effective administration for universal access to services
Photos of individual stockholder’s workgroups
Institution and Finance Work Group Consultation
Summary of discussions in Annex 6
Solid Waste Management and Environment Work
Group Consultation Summary of discussions in Annex 6

Uttarakhand Urban Development Project
Dehradun City Development Plan Page 160
Roads, Traffic and Transport Work Group
Consultation Summary of discussions in Annex 6
Water, Sewerage and Sanitation Work Group
Consultation Summary of discussions in Annex 6
Urban Planning, Tourism and Industries Work Group
Consultation Summary of discussions in Annex 6

Uttarakhand Urban Development Project
Dehradun City Development Plan Page 161
6.6 Sector Strategies
The sector strategies have been prepared in consultation with primary and secondary stakeholders. The “vision” for the City, as agreed with the primary and the secondary stakeholders, is to be realised through a more specific range of infrastructure and economic sector strategies and land use transformations. The sector strategies are discussed in the Chapter 7.
Urban Poor and Slum Development Work Group
Consultation Summary of discussions in Annex 6

Uttarakhand Urban Development Project
Dehradun City Development Plan Page 162
7. Sector Strategies and Identification of Projects and Programme Interventions Within the framework of the long-term vision set out in Chapter 6, and sector strategies presented in this section, the projects and programme interventions are identified. The interventions are to be implemented in two phases – Phase 1 will take care of the city’s needs till the year 2021 and phase 2 will cater to the needs beyond 2021 till the year 2036. Consequently phase 1 is proposed to be implemented during 2007-13 and phase 2 implemented during 2014-2025. The City Investment Plan (CIP), presented in Chapter 8 includes corresponding investment needs in these two phases.
7.1 Physical Growth and Built Environment
Based on the key issues identified and analysed in Chapter 3 and the city vision formulated in Chapter 6, the strategies to promote sustainable physical growth and the built environment are summarized in Table 7.1.1.
Table 7.1.1: Sector Vision, Key Issues and Strategies
Vision Key Issues Strategies
Physical Growth City Core Redevelopment / renewal and beautification
of city core areas Shifting of non-conforming activities from the
city core area. Provision of parking places in congested
areas Growth Directions Encourage urban growth towards south
where terrain is plain and accessibility is easier.
Controlled urban growth in north-east direction to preserve green areas
Restricted urban growth on hilly terrain Manage growth towards west direction
Growth Management Re-densification and infill development in
newly developed areas where development is scattered.
Ribbon development should be contained through development of nodes at key strategic locations.
Planned Sustainable Urban Development with housing and access to services for all
Over crowding, haphazard development without proper infrastructure in city core area
Extension or redevelopment of structures in congested areas without proper infrastructure facilities including SWM and parking spaces
Scattered development with low density in newly developed areas
Rapid unplanned development along major transport corridors creating traffic congestion
Inadequate planning efforts for provision of parking places
Lack of developed land for affordable housing
Lack of multipurpose community halls
Inadequate slaughter house and stray cattle pounds
Inadequate burial and cremation grounds
Non-conforming land uses in city area
Housing and Area Development Provision of affordable housing and serviced
land for urban poor Consolidate development on land already
subdivided and planned for expansion Densification of identified low density areas
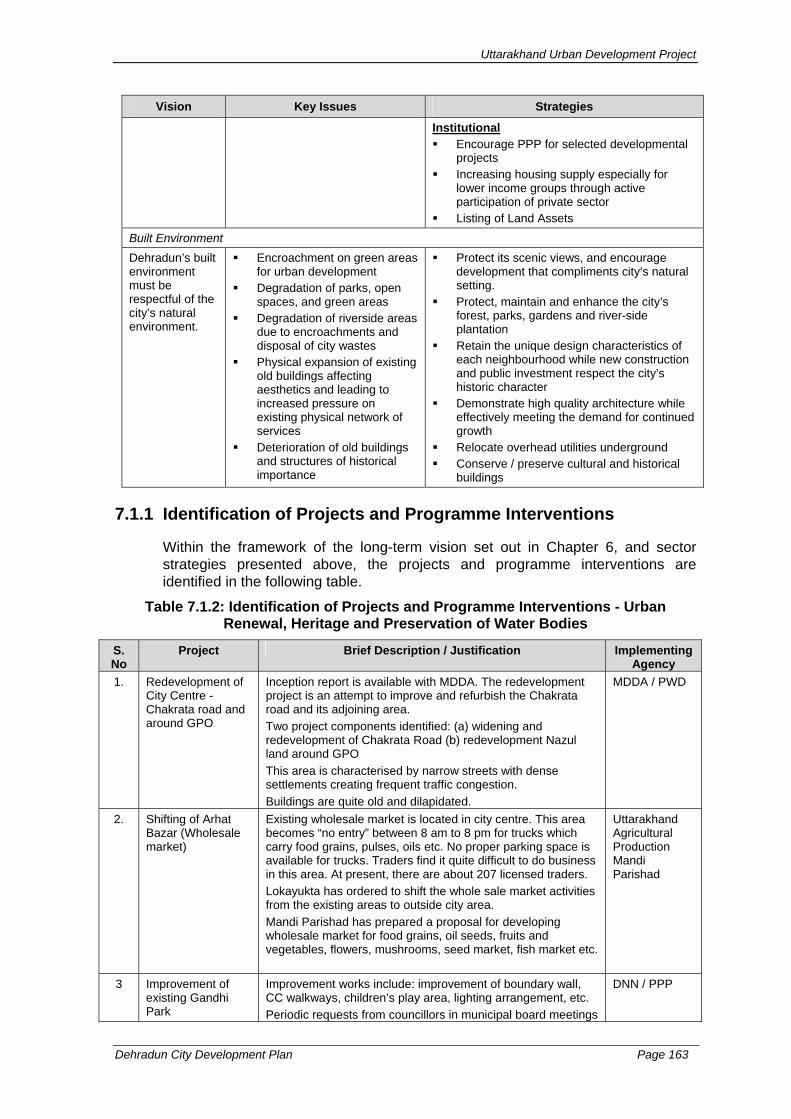
Uttarakhand Urban Development Project
Dehradun City Development Plan Page 163
Vision Key Issues Strategies
Institutional Encourage PPP for selected developmental
projects Increasing housing supply especially for
lower income groups through active participation of private sector
Listing of Land Assets Built Environment Dehradun’s built environment must be respectful of the city’s natural environment.
Encroachment on green areas for urban development
Degradation of parks, open spaces, and green areas
Degradation of riverside areas due to encroachments and disposal of city wastes
Physical expansion of existing old buildings affecting aesthetics and leading to increased pressure on existing physical network of services
Deterioration of old buildings and structures of historical importance
Protect its scenic views, and encourage development that compliments city’s natural setting.
Protect, maintain and enhance the city’s forest, parks, gardens and river-side plantation
Retain the unique design characteristics of each neighbourhood while new construction and public investment respect the city’s historic character
Demonstrate high quality architecture while effectively meeting the demand for continued growth
Relocate overhead utilities underground Conserve / preserve cultural and historical
buildings
7.1.1 Identification of Projects and Programme Interventions
Within the framework of the long-term vision set out in Chapter 6, and sector strategies presented above, the projects and programme interventions are identified in the following table.
Table 7.1.2: Identification of Projects and Programme Interventions - Urban Renewal, Heritage and Preservation of Water Bodies
S. No
Project Brief Description / Justification Implementing Agency
1. Redevelopment of City Centre - Chakrata road and around GPO
Inception report is available with MDDA. The redevelopment project is an attempt to improve and refurbish the Chakrata road and its adjoining area. Two project components identified: (a) widening and redevelopment of Chakrata Road (b) redevelopment Nazul land around GPO This area is characterised by narrow streets with dense settlements creating frequent traffic congestion. Buildings are quite old and dilapidated.
MDDA / PWD
2. Shifting of Arhat Bazar (Wholesale market)
Existing wholesale market is located in city centre. This area becomes “no entry” between 8 am to 8 pm for trucks which carry food grains, pulses, oils etc. No proper parking space is available for trucks. Traders find it quite difficult to do business in this area. At present, there are about 207 licensed traders. Lokayukta has ordered to shift the whole sale market activities from the existing areas to outside city area. Mandi Parishad has prepared a proposal for developing wholesale market for food grains, oil seeds, fruits and vegetables, flowers, mushrooms, seed market, fish market etc.
Uttarakhand Agricultural Production Mandi Parishad
3 Improvement of existing Gandhi Park
Improvement works include: improvement of boundary wall, CC walkways, children’s play area, lighting arrangement, etc. Periodic requests from councillors in municipal board meetings
DNN / PPP

Uttarakhand Urban Development Project
Dehradun City Development Plan Page 164
S. No
Project Brief Description / Justification Implementing Agency
to beautify the existing City Garden
4 Revitalisation of old village pond near Defence Colony
Revitalisation of old pond off Haridwar road for recreational purpose. Rainwater runoff from surrounding areas gets collected in the pond. DNN proposed the scheme to develop the pond as a tourist spot which could generate revenues for DNN
DNN / PPP
5 Improvement of Simritivan at Rajpur Road
Near Saibaba temple, Land ownership is with DNN. River side plantation through public involvement
DNN / PPP
6 Revitalisation of Old Village Pond at Niranjanpur
Development of Water Park at Niranjanpur DNN proposed the scheme to develop the pond as a tourist spot which could generate revenues for DNN.
DNN / PPP
7 Shifting of Slaughter houses from city area
Municipal function of DNN. Town and Country Planning Dept has earmarked areas for development of slaughter houses at four locations: (i) Raipur road - River side of Song river
(ii) Chakrata road - river side of Tons river
(iii) Saharanpur road, Chandrbani road
(iv) Side of Bindal river Immediate need of DNN. Informal slaughter house exist in city areas (at Bhandari Bagh and Kargi riverside) creating urban environmental problems. These are located in densely populated areas.
DNN / PPP
8 Shifting of Milk Dairies from the city area
Town and Country Planning Department earmarked 6 areas to shift diaries from the existing areas. Total 128 dairies exist in urban area creating environmental problems.
DNN / PPP
9 Development of Localised Fruit and Vegetable Markets
98 sites (2 nos in each municipal ward) for decentralised fruit and vegetable market. Localised fruit and vegetable markets
DNN / PPP
10 Shifting of Government’s offices out of city
During stakeholders consultation it was suggested that govt. offices should be shifted from city to outside areas. e.g. Greater Doon Stakeholders perceptions.
State Govt. / MDDA
11 Improvement of city core areas (i) Chakrata
Road
(ii) Paltan Bazar
(iii) Dilaram Chowk
Gandhi Road
Dispensary Road
Faltu Lane
Rajpur Road (iv) Shifting of Kabadi Market
Over crowding, haphazard development without proper infrastructure in city core area Physical expansion of existing old buildings affecting aesthetics and leading to increased pressure on existing physical network of services. Stakeholder’s perceptions and Master Plan 2001 also recommended the shifting of Kabadi Market. Improvement of city core areas by: Widening of existing roads and streets
Removing encroachments
Underground cabling.
Creating and enhancing open spaces, parks and parking spaces.
Characteristic of old city needs to be retained.
MDDA / PWD / DNN
12 Multipurpose Community Halls in City
To provide affordable community space for public and private gatherings. MDDA may guide development of such multi purpose community halls.
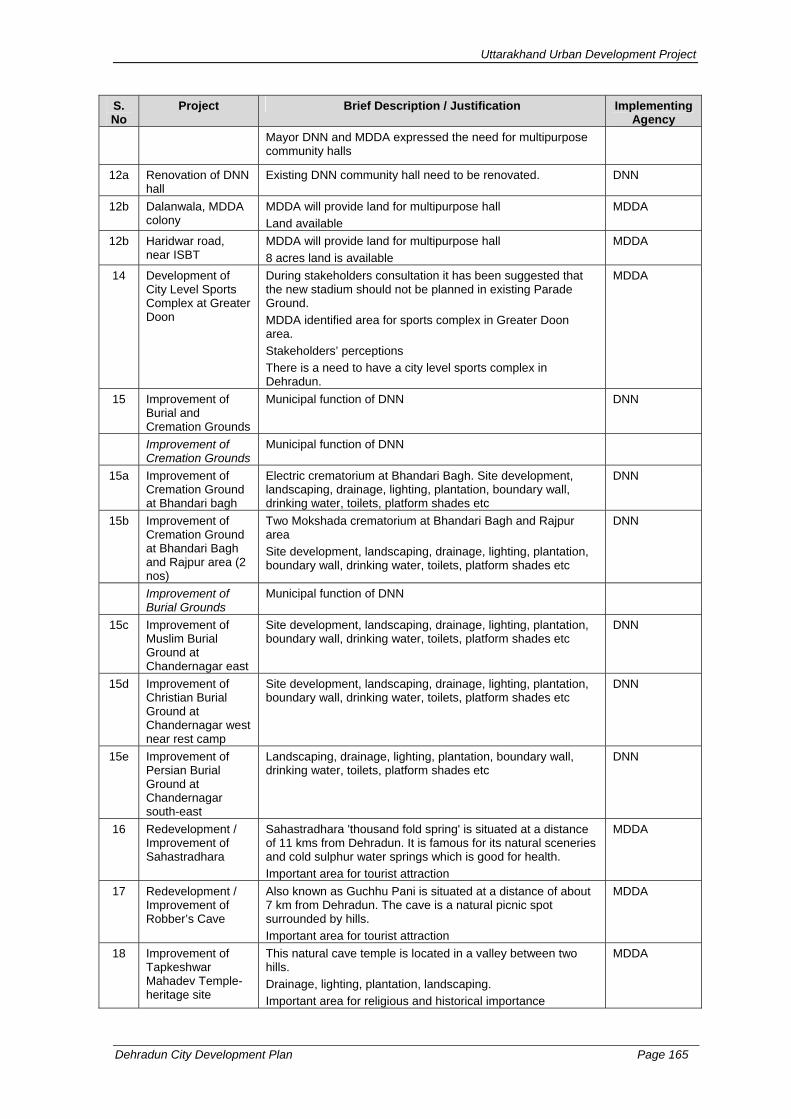
Uttarakhand Urban Development Project
Dehradun City Development Plan Page 165
S. No
Project Brief Description / Justification Implementing Agency
Mayor DNN and MDDA expressed the need for multipurpose community halls
12a Renovation of DNN hall
Existing DNN community hall need to be renovated. DNN
12b Dalanwala, MDDA colony
MDDA will provide land for multipurpose hall Land available
MDDA
12b Haridwar road, near ISBT
MDDA will provide land for multipurpose hall 8 acres land is available
MDDA
14 Development of City Level Sports Complex at Greater Doon
During stakeholders consultation it has been suggested that the new stadium should not be planned in existing Parade Ground. MDDA identified area for sports complex in Greater Doon area. Stakeholders’ perceptions There is a need to have a city level sports complex in Dehradun.
MDDA
15 Improvement of Burial and Cremation Grounds
Municipal function of DNN DNN
Improvement of Cremation Grounds
Municipal function of DNN
15a Improvement of Cremation Ground at Bhandari bagh
Electric crematorium at Bhandari Bagh. Site development, landscaping, drainage, lighting, plantation, boundary wall, drinking water, toilets, platform shades etc
DNN
15b Improvement of Cremation Ground at Bhandari Bagh and Rajpur area (2 nos)
Two Mokshada crematorium at Bhandari Bagh and Rajpur area Site development, landscaping, drainage, lighting, plantation, boundary wall, drinking water, toilets, platform shades etc
DNN
Improvement of Burial Grounds
Municipal function of DNN
15c Improvement of Muslim Burial Ground at Chandernagar east
Site development, landscaping, drainage, lighting, plantation, boundary wall, drinking water, toilets, platform shades etc
DNN
15d Improvement of Christian Burial Ground at Chandernagar west near rest camp
Site development, landscaping, drainage, lighting, plantation, boundary wall, drinking water, toilets, platform shades etc
DNN
15e Improvement of Persian Burial Ground at Chandernagar south-east
Landscaping, drainage, lighting, plantation, boundary wall, drinking water, toilets, platform shades etc
DNN
16 Redevelopment / Improvement of Sahastradhara
Sahastradhara 'thousand fold spring' is situated at a distance of 11 kms from Dehradun. It is famous for its natural sceneries and cold sulphur water springs which is good for health. Important area for tourist attraction
MDDA
17 Redevelopment / Improvement of Robber’s Cave
Also known as Guchhu Pani is situated at a distance of about 7 km from Dehradun. The cave is a natural picnic spot surrounded by hills. Important area for tourist attraction
MDDA
18 Improvement of Tapkeshwar Mahadev Temple- heritage site
This natural cave temple is located in a valley between two hills. Drainage, lighting, plantation, landscaping. Important area for religious and historical importance
MDDA
Uttarakhand Urban Development Project
Dehradun City Development Plan Page 166
7.2 Municipal Infrastructure Development
7.2.1 Water Supply
National Water and Sanitation Policies
Water is a prime natural resource; a basic human need and national asset. Planning and development of water resources must therefore be governed by national perspectives.
The Government of India accordingly formulated a national water policy in 1987 prioritising water allocation in the planning and operation of systems in the following order:
• Drinking
• Irrigation
• Hydropower
• Navigation
• Industrial and other uses
These priorities can, however, be suitably modified for any particular area with reference to its area-specific considerations. According to the national water policy, adequate drinking water facilities should have been provided to the entire population both in urban and rural areas by 1991 and all irrigation and multipurpose projects should invariably include a drinking water component wherever there is no alternative source of drinking water and also, the drinking water needs of human beings and animals should be the first priority for exploitation of any available water source.
According to the constitution of India, the states can enact any legislation on water supply, irrigation, canal, drainage, embankments, water storage and water power concerning the state excepting the regulation and development of interstate rivers and river valleys. The national parliament has no legislative competence in the matter.
The state policy of Government of Uttarakhand is in preparation. It is understood that the GoU, keeping in view the difficult hilly terrain and low per capita income, is working on an appropriate policy to provide clean, potable water in adequate quantity for all in the whole of rural and urban areas of Uttarakhand. This generally follows the national policy.
The sector vision for water is “Economic Activities shall be commensurate with excellence and supported by efficient urban services like……Water Supply…….for all its citizens”. Clearly this cannot be achieved overnight and requires adequate strategies to be in places. Based on key issues identified and mentioned in Chapter 3, such strategies are:
• To prepare an adequate and reliable data base on water supply system
• To ensure equitable distribution of water at sufficient pressure

Uttarakhand Urban Development Project
Dehradun City Development Plan Page 167
• To provide good quality water at all times
• To ensure economy in operation and maintenance cost
• To reduce UFW progressively and to achieve minimum wastage of water.
Obviously, these strategies need adoption of sound Planning Strategy. A Planning Strategy based on Least Cost Water Supply System is discussed in Annex 7.2.1.
Suggested Interventions to Achieve Sectoral Vision in Water Supply
Essential works, along with the immediate needs as estimated by UJS for proper running and maintenance of the water supply system and to cater to the vision of stakeholders up to the year 2036 have been included in this plan after discussions with UJS officers, stakeholders and peoples representatives. The provision of water has been made @ 135 lpcd keeping an allowance of 15% for wastage. Annex 7.2.2 shows the growth in demand upto the year 2036. Sourceworks
In order to meet the demand on the above basis it is suggested to continue with the present source i.e. Tubewells until the year 2036. The suggested areas for the proposed Tubewells upto 2021 (i.e., Phase 1) are given below.
1. Matawala Bagh, 2.Circuit House, 3. Sachivalaya, 4. Jakhan, 5. Trans Bindal, 6. Lakhi Bag, 7. Canal Road, 8. Kishanpur, 9. Chidowali, 10. Sahastradhara Road, 11. Badrish Colony, 12. Trans Bindal – 2 Nos., 13. D.L. Road, 14. Vijay Colony, 15. Curzon Road, 16. Tagorevilla, 17. Yamuna Colony, 18. Khurbuda, 19. Jhanda Mohalla, 20. Kaonligaon, 21. Gandhi Gram, 22. Laxman Chowk, 23. Patel Nagar, 24. Green Park, 25. Majra Upper , 26. Pathribagh, 27. Vidya Vihar, 28. Rest Camp, 29. Race Course, 30. Mothrowala, 31. Adhoiwala. Replacement of Pipeline
Replacement work of pipelines, which have come under the middle of Road due to Road widening are estimated and presented in the following table.
S.No. Name of Place Diameter of pipeline in mm Length in km
1 From Rajpur to Hathi Barkala 200 6.0 2 From Sahastradhara
Crossing to Aman Vihar. 200 250 3.0
2.0 3 From Survey Chowk to Deal
Office. 200 250 2.0
1.0 4 Saharanpur Road 200 4.0 5 E.C Road 150 4.0 Total 22 Km
Replacement of Old and damaged distribution Mains in old town
The following areas in which such replacement is required are listed below. The range of diameter varies from 65 mm to 200 mm. Map 7.1 indicates locations of areas requiring replacement of pipelines. For the sake of estimation, an average diameter of 100 mm has been considered. The total length estimated is 65 km. average cost considered is Rs. 610 per metre on the basis of PVC pipes. The total estimated cost is Rs 6.85 crores.

D
D
D
DD
D
D
D
^
To M
usso
orie
To Sah
astrad
hara
To Raipur
To GurudwaraTo Haridwar
To Haridwar
To Saharanpur
CANTT AREA
To Chakrata
KARGI
MAJRA
RAJPUR
HARIPUR
KARANPUR
SALAWALA
DALANWALA
ADHOIWALA
DHARAMPUR
KAULAGARH
KAILASHPURI
PATEL NAGAR
KRISHNANAGARINDIRA COLONY DILARAM BAZAR
DEFENCE COLONY
CONNAUGHT PLACE
HATHIBARKALA ESTATE
DEHRADUN CANTTAREA
GHANTAGHAR
km1 0 1 2 3
UTTARANCHAL URBAN DEVELOPMENT PROJECTGOVERNMENT OF UTTARANCHAL
Data Source
Base Map prepared from Dehradun Guide Map (Survey of India) and Dehradun Nagar Nigam Map
M A P 7 . 1 : - R E P L A C E M E N T O F W A T E R P I P E L I N E S
: D E H R A D U NCITY DEVELOPMENT PLAN
Legend
Municipal Boundary
National Highway
State Highway
Major City Road
Railway Line
River / Drain
Replacement of Pipeline
Uttaranchal Jal Sansthan & Field Studies!

Uttarakhand Urban Development Project
Dehradun City Development Plan Page 169
1. Karanpur, 2. D.L Road, 3. Chukhuwala, 4. Dhamawala, 5. Darshan Gali, 6. Lunia Mohalla, 7. Dandipur, 8. Mannuganj, 9. Khurbura, 10. Hanuman Chowk, 11.Arhat Bazaar, 12. Lakhi Bagh, 13. Subhash Road etc.
The summary of intervention is given below:
S. No.
Project Components Phase 1 Phase 2
1. Construction of tube well, including Land, Pump house, Pumping Plant, rising main etc. and all woks needed for the Commissioning of Tubewells to augment supply by:.
50 mld 60 mld
2. Construction of OHT of various Capacities (Av. 15 m Staging at 42 Localities) to augment capacity by: .
28,233 kl 25,113 kl
3. Reorganistion of distribution system in the newly included areas where previously water supply was made @ 40-70 LPCD (110-200 mm Dia. Av. 140mm. dia. PVC.)
58.5 Km
4. Installation of SCADA system on Tubewells As in item 1
As in item 2
5. Replacement of Damaged /Old Pumping Plants (Av.100 H.P.) 30 Nos.
6. Leak detection and water and power Audit. Y 7. Up gradation of Treatment plants 20 MLD and 14 MLD,
Constructed in 1936 and 1980 (Change of filter media, Change of valves and gauges and building repairs).
Y
8. Procurement of Silent Mobile Diesel generator set (AV. 125 KVA)
10 Nos.
9. Supply and installation of mechanical bulk water meters 150 mm to 250 mm, 163 Nos.Sluice valves 80mm to 250mm for separation of zones.
100 Nos.
10. Establishment of a fully equipment water testing Laboratory with Equipment and building.
Y
11. Replacement of old and damaged distribution mains (65mm to 200mm Dia.) in the old city.
65 km
12. Replacement of Bandal Raw Water main at Rajpur road From Bandal to water works (out of 28 Km laid in 1936 (350mm 4 Km, 250 mm 3 Km).
7 Km.
13. GIS based on Pipeline network mapping in Dehradun. Y 14. Replacement of pipeline which have come under road
Widening. 22Km
15. Cost of building works Office of Planning and construction unit U.P Jal Nigam Revenues collection offices and staff quarters Jal Sansthan
Y
16. Installation of India mark – II H.P Y 17. Fully equipped work Shop Y 18. Independent Power feeder mains Y 19. Carrying out Hydro – geological study to ascertain water
balance and determination of safe aquifer yield in view of water Demand till year 2036.
Y
20. Economic viability studies of song Dam as a source in comparison with groundwater source to meet Long-term water demand.
Y
21. Detailed Technical studies for integration of song dam Supply, conveyance, treatment, master balancing storage, Distribution and switchover from tubewells sources for Urban system within Nagar Nigam Area.
Y

Uttarakhand Urban Development Project
Dehradun City Development Plan Page 170
Alternative Source of Surface Water Song River Dam Project
Uttarakhand Jal Sansthan is concerned about the long term availability of ground water over the next 30 years or so. The concern arises from the failure of some tubewells. The Department of irrigation GOU, on the advise of UJS has prepared a DPR amounting to Rs. 560.0 Crore for a dam on song river located at 25 Km from Dehradun. The reservoir is intended to supply 256 mld or 2.96 cumecs of water. The Dam primarily is to serve as a source for drinking water, for Dehradun as well as for peripheral areas.
The dam is also intended to generate electricity for mini hydro project, with a capacity of 6.0 MW and 35.45 million unit annually, and make available 1980 cusecs of water for irrigation from 1st July to 31st Oct.
However, before going for the construction of the dam following studies are essential to be carried out for which provision under immediate requirement to this plan has been made.
1. Carrying out Hydro geological study to ascertain water balance and determination of safe aquifer yield in view of water demand till year 2036.
2. Economic viability studies of song dam as a source in comparison with groundwater source to meet long-term water demand.
3. Detailed Technical studies for integration of song dam supply, water conveyance, treatment, master balancing storage, distribution and switchover from tubewells sources for urban system within Nagar Nigam area.
4. Full Environmental and Social Impact Assessments including detailed analysis of impacts on flora and fauna, detailed mitigation programs, relocation and resettlement requirements asset surveys etc.
This component is proposed to be considered during phase 2, depending on the outcome of studies mentioned above.
7.2.2 Sewerage and Sanitation
The Sector Vision for sewerage and sanitation is to promote “economic activities with excellence in service delivery and to ensure a clean environment commensurate with urban growth”. To achieve this, the following strategies should be in place:
• Treatment of sewage to control water pollution of natural water bodies
• Implementation of a package treatment systems for new residential and industrial establishments in peri-urban or scattered areas as applicable
• 100 % treated sewage and sludge reuse for agriculture (where appropriate)
• Expansion of sewerage system progressively to achieve at least 95 % population coverage
• Prevention of the entering of municipal solid waste into the sewer line
• Adoption of an Action plan for proper O and M of STPs
Uttarakhand Urban Development Project
Dehradun City Development Plan Page 171
• Power generation from biogas produced by anaerobic sludge digestion.
• Eradicate conditions for waterborne diseases
• Improve and ensure access to sanitary services for the urban poor and slum dwellers
• Encourage pay and use category of public conveniences with community involvement in the maintenance of the same
Action Plan for Sewerage
To bridge the current service gap as well as medium term needs of the estimated population by 2021, an additional 363.3 km of sewerage network is proposed to be put in place during Phase 1. Some extension work will also be required during phase 2, although of a lesser magnitude.
In addition, two large sized STP at Kargi and Daudwala, one medium sized STP for Indira Nagar and three small sized STP for Vijay Colony, Salawala and Doon Vihar area are proposed for complete treatment of entire sewage collected in the city. Land is already acquired for Kargi, Vijay colony and Doon Vihar STPs. Provisions are made for acquisition of land for Daudwala, Indira Nagar and Salawala STP’s. In this manner the total capital investment of Rs 28413 Lacs is proposed by Phase 1. During Phase 2, new STPs will be implemented for Zone J and K. Further, capacity additions will be made to Kargi, Daudwala, Vijay colony, Doon Vihar, Indira Nagar and Salawala STP’s. in Phase 2 to cater to population growth during 2022-36. Map 7.2 shows the sewerage network and proposed STPs.
7.2.3 Storm Water Drainage
The Sector vision clearly states that “Economic Activities shall be commensurate with excellence in Higher Education, Health, Information Technology and Tourism supported by adequate and efficient urban services”. The GoU is aware of this sector goal to have a problem free storm water drainage system in the whole of the town. In this regard, consultants have been appointed by the UPJN to prepare a comprehensive Drainage Master Plan including the remodelling and reconstruction of drains. The strategies that ought to be in place are:
1. Strict control against Dumping of Garbage in the drains
2. Awareness Campaign to educate the masses
3. Regular Cleaning and maintenance of drains
4. Banning the use of plastic bags
5. Discontinue the practice of connecting the toilet outlets to the drains
6. Implementation of the comprehensive plan for remodeling of the drainage system, starting from the tail ends and not from head or middle as is the currently adopted practice sometimes

!
!
!
!
!
!
^
M
K
LI5
B
CH
I4
I1
A3
D
A1
J
I2
E2
A8
E1
G1
I3
E3
A7
A4
A6
A2
F1
F2
A9
A10
A5
Kargi STP (56 mld)
Salawala STP (3 mld)
Daudwala STP (28 mld)
Indranagar STP (8 mld)
Vijay Colony STP (1mld)
Doon Vihar STP (1.5 mld)
GHANTAGHAR
Base Map prepared from Dehradun Guide Map (Survey of India) and Dehradun Nagar Nigam Map
km1 0 1 2 3
UTTARANCHAL URBAN DEVELOPMENT PROJECTGOVERNMENT OF UTTARANCHAL
Data Source
M A P 7 . 2 : - P R O P O S E D S E W E R A G E & S T P ' s
Uttaranchal Pay Jal Nigam!
: D E H R A D U NCITY DEVELOPMENT PLAN
Legend
Municipal Boundary
River / Drain
Sewerage Network
Zone 1
Zone 2
Zone 3
Zone 4
Zone 5
Zone 6
Proposed Sewage Treatment Plant !
Uttarakhand Urban Development Project
Dehradun City Development Plan Page 173
The consultants have recently prepared and submitted a preliminary design report for storm water drainage of Dehradun. These were reviewed with UJS and DNN.
The following main proposals are recommended as part of the Action Plan:
1. Roadside surface masonry drains 110 km 2. Rehabilitation of existing drains by conversion to RCC. Drains 10 km 3. Box culvers for main roads 70Nos. 4. Slab Culverts for internal roads 650 Nos. 5. Precast covers over the drains 10 km 6. Laying of under ground 450mm pipes in small lengths 6km 7. Provision of manholes of 900mm dia where existing drains have been permanently covered and other Misc. works 400 Nos.
Major portion of these works will be covered in Phase1. Only extension/addition will be made during Phase 2.
Planning and Design Criteria
The UPJN consultants have broadly used the CPHEEO recommended criteria except for minor deviations. Comments, suggestions and recommendations with respect to planning and design criteria are given below:
The Run Off formula Q = 10 CIA, Imperviousness Coefficients for various types of areas and use of following storm frequencies for tertiary drain design are in tune with the CPHEEO manual.
Once in 2 year for commercial and high priced areas.
Once in 1 year for residential areas
Once in 6 month for peripherals areas.
Mentioned in the consultants report the Intensity Duration curve has been prepared on the basis of 15 years record of rainfall data. Data of a bigger span would have been more realistic.
The rainfall data collected or available was on hourly basis and not for shorter duration, which could provide more accurate results.
Consideration of once in six months for peripherals areas may also prove too short, as the faster growth of town may convert these areas into high value residential areas of the town. (e.g. Noida once was a peripheral area of Delhi, now an important town by itself). These points may be borne in mind while carrying out the detailed designs.
The broad cost Estimates have been prepared for two cases
Case I - Considering storm frequency as once in two years for commercial and high priced areas, once in a year for residential areas and once in a year for residential areas and once in six months for peripheral areas.
Case II – Considering storm frequency as once in a year for commercial and highly populated areas and once in six months for lower and medium populated areas and undeveloped areas.

Uttarakhand Urban Development Project
Dehradun City Development Plan Page 174
Case II has been recommended by the Consultants on the basis of it being economical and a greater number of existing drains could be retained as their present sectional area are sufficient to carry the estimated discharge.
However there is hardly a difference of 10 % between the two costs; as such the cost may not be taken as the sole deciding factor for adoption of the case number II.
7.2.4 Solid Waste Management
In order to achieve the vision in the Solid Waste Management sector, DNN may adopt the following strategies: • Conduct long term campaign to propagate the concept of segregation of
waste at the household level, waste minimization and advocating the method of home composting and dispensation of waste generation habits
• Carry out detailed waste quantification and characterization study for scientific and representative assessment of quality and quantity of MSW
• Improvement in the primary waste collection by extension of door-to-door waste collection system to cover the entire city including the slums. This can be implemented in the following way: Restricting the formation of MSS within the slums areas (i.e. about 25% of
the city population) and make them responsible for collection of waste and street sweeping within the “Mohalla” and transfer the waste to nearby community container or load to the DNN’s solid waste transportation vehicle for onwards transportation to the disposal site. In slum areas the service charge may be subsidized.
Contracting out the primary collection system in phases for bulk portion (about 50% of the city population) of the city to private agencies or NGOs and DNN shall act as a monitoring agency. This can be implemented by imposing service charges to the households to make the system self sustainable. DNN may decide on a uniform service charge for this purpose and earmark areas for the private agencies or NGOs.
DNN workers may be engaged to cover the remaining portion of the city. Existing ‘rag pickers’ may be organized and NGOs/ Private agencies may
be involved for collection and transportation of the recyclable wastes for further processing.
The following benefits are expected from the above primary collection system: • Segregation of waste will reduce its quantity to be transported to the disposal
site, thus reducing land requirement for disposal of waste. It will also help in better processing of waste.
• Encourage more community and private involvement • Reduce financial and manpower burden of the DNN • Improve revenue generation of the DNN • More organized system of waste collection, and improvement of the
environment • Reduction in multiple handling of waste thus minimizing risk of exposure of
the workers to health hazards
An outline for primary collection of MSW from various sources of generation is provided in Annexure 7.2.3.
Uttarakhand Urban Development Project
Dehradun City Development Plan Page 175
1. Improvement of present solid waste transportation system by:
Efficient route planning of the MSW transport vehicles and increasing number of daily trips of the vehicles.
Effective covering of the vehicles to avoid exposure of waste and its littering during transportation.
Providing Transfer Station to increase vehicle efficiency and minimize cost
Replacement of old vehicles and equipment by new one.
Providing vehicle depot and workshop facilities for better O&M of the vehicles and equipment.
Outsourcing part of the transportation activities to private agencies.
2. The existing solid waste disposal site at Dateda Lakhond on Sahashradhara Road may be continued for land filling provided the site is properly developed as a sanitary landfill site. DNN should develop this site which is likely to continue for another 5-6 years. DNN needs to identify suitable alternative land for future solid waste disposal. About 24 hectare of land is required for future land filling and composting of MSW of the city. DNN may consider the following for improvement of the present MSW disposal system:
Selection of disposal site based on selection criteria, conduct EIA study followed by environmental approval from the concerned authority.
Providing facilities for both Compost Plant and Sanitary Landfill for composting of segregated organic wastes and land filling of the inorganic part of the waste respectively at the disposal site.
Provision for treatment and safe disposal of leachate.
Contracting out the Compost Plant on Built-Owned and Operate (BOO) basis.
Disposal of Recyclable waste through recyclable waste processing units.
Providing following facilities at the MSW disposal site:
Access and internal roads for movement of vehicles and equipment.
Weighbridge for keeping day to day record of waste.
Earthmoving equipment for leveling of waste and soil covering.
Workshop facilities for cleaning and maintaining of vehicles and equipment.
Staff Office including waste monitoring facilities.
Fencing the disposal site to prevent entry of unauthorized persons, rag pickers and cattle.
Leachate and landfill gas collection and treatment facilities
3. The present SWM Circles have wide disproportion in terms of area and population coverage. DNN should reorganize the SWM Circles to have more uniformity for better management.
4. At present there is only one centralized office of the DNN. DNN should decentralize the MSW operations by providing additional offices at the Circle level. This will facilitate people to lodge complaints besides helping the DNN staff to deliver better and timely services to the citizens.

Uttarakhand Urban Development Project
Dehradun City Development Plan Page 176
5. In addition to manage the city solid waste the existing Public Health Department (PHD) of DNN are also responsible for functions such as death and birth registration, monitoring of public water supply, food inspection and sampling and control of communicable diseases. DNN should set up a cell which will exclusively manage the city solid waste activities, including the identification and sanctioning of persons responsible for fly-tipping.
6. DNN should avail training programs to upgrade the knowledge and skill of the DNN staff.
7. State Government should frame bye-laws to comply with the MSW (Handling and Management) Rules, 2000 and empower the DNN to strictly implement the same to the offenders.
8. DNN should take Adequate protective measures for the workers against health and hygienic risk caused due to exposure to the waste.
The institutional and organisational aspects mentioned in items 3, 4, 5 and 6 are dealt with in detail in Chapter 4.
Preparation of a comprehensive Solid Waste Management Master Plan for the city is essential before implementation of the above mentioned strategies.
7.2.5 Roads and Transportation
Strategies
“Economic activities shall be commensurate with excellence….and supported by efficient ……..Roads and Public Transport……… for all citizens”. Arising from this sector vision, the following strategies ought to be in place:
• Ensure free flow of traffic through junction improvement, signalization, and traffic control and management measures.
• To provide alternate routes, parallel roads, link roads, slip roads, ROBs for decongesting the traffic on the major traffic corridors in the city.
• To provide high capacity mass transport system.
• To improve conditions for all road users – and particularly for pedestrians.
Based on above strategies, following projects are identified:
Major Initiatives/Projects
Map 7.3 shows location of major initiatives / projects generally.
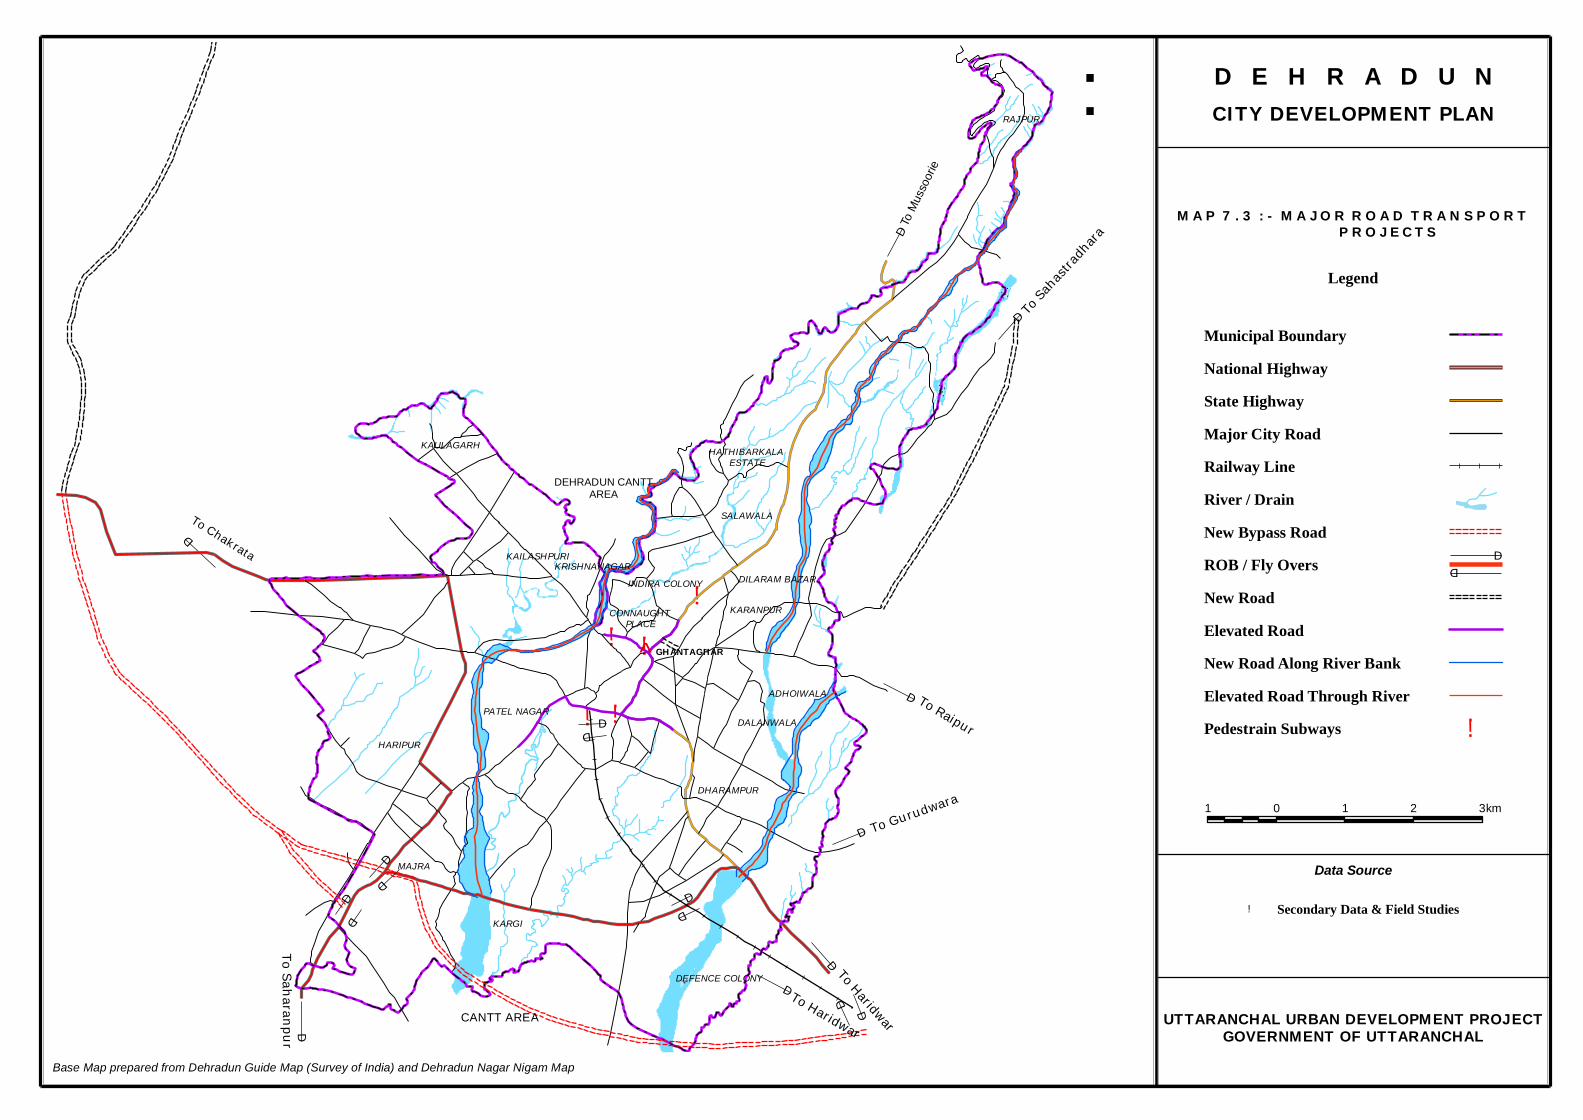
!!
!!
!!!!
!!
D
D
D
D
D
D
D
D
D
D
D
D
D
D
D
D
D
D
^
To M
usso
orie
To Sah
astrad
hara
To Raipur
To Gurudwara
To Haridwar
To Haridwar
To Saharanpur
CANTT AREA
To Chakrata
KARGI
MAJRA
RAJPUR
HARIPUR
KARANPUR
SALAWALA
DALANWALA
ADHOIWALA
DHARAMPUR
KAULAGARH
KAILASHPURI
PATEL NAGAR
KRISHNANAGARINDIRA COLONY DILARAM BAZAR
DEFENCE COLONY
CONNAUGHT PLACE
HATHIBARKALA ESTATE
DEHRADUN CANTTAREA
GHANTAGHAR
km1 0 1 2 3
UTTARANCHAL URBAN DEVELOPMENT PROJECTGOVERNMENT OF UTTARANCHAL
Data Source
Base Map prepared from Dehradun Guide Map (Survey of India) and Dehradun Nagar Nigam Map
M A P 7 . 3 : - M A J O R R O A D T R A N S P O R T P R O J E C T S
Legend
Municipal Boundary
National Highway
State Highway
Major City Road
Railway Line
River / Drain
: D E H R A D U NCITY DEVELOPMENT PLAN
New Bypass Road
ROB / Fly Overs
New Road
Elevated Road
New Road Along River Bank
Elevated Road Through River
Pedestrain Subways !!
D
D
Secondary Data & Field Studies!

Uttarakhand Urban Development Project
Dehradun City Development Plan Page 178
Junction Improvement
Following junctions are proposed for the improvements on the basis of requirement and in consultation with Traffic Police, Dehradun city.
Priority 1 Priority 2 Priority 3
1. Darshan lal chowk 2. Clock Tower chowk 3. Prince Chowk 4. Saharanpur Chowk 5. Balliwalla chowk 6. Karghi chowk 7. Vidhan Sabha twin junction 8. ISBT chowk 9. Junction near Bindal River on
Chakrata road 10. Jogiwala chowk 11. Raja road junction on Gandhi
road 12. Tehsil chowk on Gandhi road 13. Globe chowk near Premier
motor
1. Araghar junction 2. Ballupur chowk 3. Ashley Hall Junction 4. Kishan Nagar Junction 5. Sahastradhara crossings 6. Employment office crossing 7. Dharampur chowk 8. Race course chowk 9. Junction near sabzi mandi on
Saharanpur road 10. Buddha park chowk (Tri Murti
Tiraha) 11. Lansdown chowk 12. Kanak chowk 13. Dilaram chowk on Rajpur road
1. Junction near GMS extension at shimla road.
2. Mathurowala chowk 3. Junction near Dwarka
store on EC road 4. Y junction near Masjid
Dharampur 5. St Jude School
junction 6. Kamla Palace junction
on GMS road 7. Junction near M K P
school on Subhash road
8. Baini bazaar chowk 9. Kaulaghar chowk
Markings should be considered in the design stage prior to taking up construction work. Any location having merging diverging or crossing maneuvers of two vehicles is a potential conflict point. The main objective of the intersection is the design should be minimizing conflict points. The improvements measures normally include: • Proper channelisation for the free left turn • Footpath on approaches of the junctions • Planned pedestrian zebra crossing (or subways where necessary) • Shifting of electric poles and where absolutely necessary cutting of trees • Land acquisition/removing structures • No parking on the approaches of the junction for at least 50m.
Besides the geometric improvement of the above mentioned junctions, the following needs signal improvement.
a) Proposal to make traffic signals function properly: • Raipur road-Sahastradhara road junction • Saharanpur Chowk • Ballupur Chowk
b) Proposed new signals: • Vidhan Sabha twin junction • ISBT Junction • Saharanpur Road – Turner Road junction • Junction near Yamuna colony • T- Junction near premier motor. • T- Junction near Kamla palace on GMS road. • Guru Nanak School crossing in Race course

Uttarakhand Urban Development Project
Dehradun City Development Plan Page 179
• Bannu school crossings in Race course • Jogiwala Chowk on Haridwar road. Traffic Improvement Plan and Traffic Enforcement
As it is observed that there is haphazard on-street parking which reduces road capacity causing traffic congestion and placing pedestrians at danger. Following areas are proposed for no parking zone: • Saharanpur Road (Saharanapur chowk to Prince chowk) • Gandhi Road (Prince Chowk to clock Tower) • Haridwar Road(Prince Chowk to Rispana bridge) • Rajpur Road (Clock Tower to Uklyptes Road) • Chakrata Road(Clock Tower to till near cinema Hall) • Tehsil Crossing to Doon Hospital Crossing and Amrit Kaur Road. • Cross Rod from Darshan Lal Chowk to EC Road. • Convent Road. • Ugrasen Road (Rajpur Road to survey Chowk) • Pant road – Shift the existing on street tempo parking to parade Ground
temporarily. • Parking at intersection to be strictly banned at least 20 m on all arms from
junction. This specifically applies to the prominent inter sections and cross roads of Saharanpur Chowk, Prince Chowk , Tehsil Chowk , Darshan Villa Chowk , Clock Tower, Ashlay hall, Survey Chowk , Araghar juncutin, Ballupur Junciton, Balliwala and ISBT Junction.
Proposed one-way, Clockwise Traffic Movement • Subhash marg from lansdown chowk to kanak chowk • Ugrasen marg from Kanak chowk to Convent road junction • Convent road from Ugrasen junction to Pant road junction • Pant road from Convent road to Tibetan market • one way on Cross road from teen murthi junction to darshan lal chowk,
jhanda bazaar road, • Clock-wise one way scheme around the area bounded by kanak chowk,
Ashley hall junction, globe chowk and pacific T junction. • One- way scheme form Balliwala chowk to Sahranpur chowk, in this case
heavy vehicle can move via GMS road and light vehicles road starting from Punjab bhusa store and Hindu college to Kanwli road
Banning of Right Turning • From Nardev Shashtri Marg (katchery road to Haridwar road • From Ansari road to Chakrata road • From Subhash road to Amrit Kaur road Closure of Median Gaps • On Gandhi road except at tehsil chowk • On Rajpur road.
Proposed speed restriction barrier near RTO crossings, hotel Great Value on Rajpur road to avoid accidents.
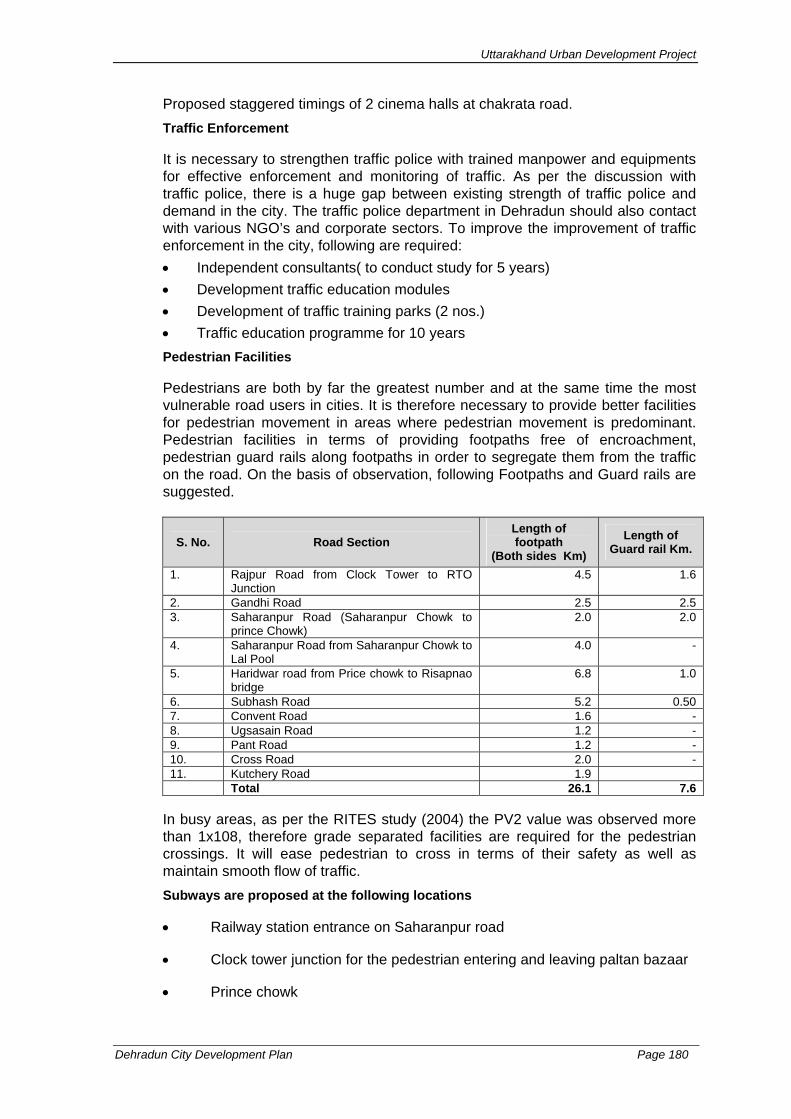
Uttarakhand Urban Development Project
Dehradun City Development Plan Page 180
Proposed staggered timings of 2 cinema halls at chakrata road. Traffic Enforcement
It is necessary to strengthen traffic police with trained manpower and equipments for effective enforcement and monitoring of traffic. As per the discussion with traffic police, there is a huge gap between existing strength of traffic police and demand in the city. The traffic police department in Dehradun should also contact with various NGO’s and corporate sectors. To improve the improvement of traffic enforcement in the city, following are required: • Independent consultants( to conduct study for 5 years) • Development traffic education modules • Development of traffic training parks (2 nos.) • Traffic education programme for 10 years Pedestrian Facilities
Pedestrians are both by far the greatest number and at the same time the most vulnerable road users in cities. It is therefore necessary to provide better facilities for pedestrian movement in areas where pedestrian movement is predominant. Pedestrian facilities in terms of providing footpaths free of encroachment, pedestrian guard rails along footpaths in order to segregate them from the traffic on the road. On the basis of observation, following Footpaths and Guard rails are suggested.
S. No. Road Section Length of footpath
(Both sides Km) Length of
Guard rail Km.
1. Rajpur Road from Clock Tower to RTO Junction
4.5 1.6
2. Gandhi Road 2.5 2.5 3. Saharanpur Road (Saharanpur Chowk to
prince Chowk) 2.0 2.0
4. Saharanpur Road from Saharanpur Chowk to Lal Pool
4.0 -
5. Haridwar road from Price chowk to Risapnao bridge
6.8 1.0
6. Subhash Road 5.2 0.50 7. Convent Road 1.6 - 8. Ugsasain Road 1.2 - 9. Pant Road 1.2 - 10. Cross Road 2.0 - 11. Kutchery Road 1.9 Total 26.1 7.6
In busy areas, as per the RITES study (2004) the PV2 value was observed more than 1x10⁸, therefore grade separated facilities are required for the pedestrian crossings. It will ease pedestrian to cross in terms of their safety as well as maintain smooth flow of traffic. Subways are proposed at the following locations
• Railway station entrance on Saharanpur road
• Clock tower junction for the pedestrian entering and leaving paltan bazaar
• Prince chowk

Uttarakhand Urban Development Project
Dehradun City Development Plan Page 181
• Chakrata Road
• Rajpur Road Off- Street Parking Lots
The phenomenal growth of the use of private vehicles (motorcycles and private cars) has led to increased demand for parking.
As per the RITES study (2004), the highest demand of parking, about 1650 equivalent car spaces (ECS) is observed on Rajpur road from Clock tower to Dilaram bazaar. A demand of about 650 ECS is observed on Chakrata road upto Connaught place. The problem has been further aggravated by the absence of adequate off-street parking facility in the proximity of traffic generators and attractors.
Following off-street parking lots (Multi level) is proposed, in combination with establishment and strict enforcement of no parking zones along the streets identified above:
• Old Bus stand (Gandhi Road)
• RFC Gowdown Premises
• Vetenary Hospital premises at Dispensary road (by shifting hospital)
• Jail building premises near Prince chowk at Haridwar road
• Tehsil premises
• Land in front of Balika Inter college at Rajpur road
• Jal Sansthan premises at Raipur road (by shifting office)
• Near railway station
• On vacant land in front of Bindal police chowki near Bindal Bridge on Chakrata road.
• In the premises of Power corporation office for collecting electric bills in front of Meedows shopping complex on Rajpur road by shifting the office.
• Near railway station towards Lakkar mandi side on railways land in consultation with railway authorities.
• Cost of shifting of above offices is to be beared therefore lump sum provision has been made in estimate
• Note: The above mentioned proposals for off-street parking may be taken up on Public – Private Partnership (PPP) basis.
Widening and Strengthening of Roads
Based on traffic observed and present capacity of the road, following corridors are to be widened to cater the traffic demand at the desired level of service.
Uttarakhand Urban Development Project
Dehradun City Development Plan Page 182
National Highways • NH-72 (11.6 km) including Saharanpur- Haridwar bypass and excluding
GMS road- proposed to 4-laning • NH-72A (4.2 km) proposed to 4-laning Major Arterial and Sub-Arterial Roads • Rajpur road from Prince Chowk to Mussurie diversion – widening by adding
1 additional lane. • Raipur road from Bindal Rao to ring road junction from 2-lane to 4-lane. • Sahastradhara Road from 2-lane to 4-lane • Ring road except part of Raipur road and Sahashtaradhara road from 2-lane
to 4-lane • Race course and internal roads of race course from 3-lane to 4-lane • Chakrata Road from Clock Tower to Picture Halls (within this reach lot of
building are to be acquired for that lump sum provision for acquisition of buildings including cost of widening have been kept in estimate)
Bypasses and New Roads
The development of new road network in the city will also require specific attention in order to gain connectivity based on: • Tourism • New residential and institutional areas planned on bypass, Chakrata road
and Shahtradhara road • Institutional areas and transport terminal infrastructure on Haridwar road
Following corridors have been identified for new construction. Bypasses • East west Section of city from near IIP on Haridwar Road to existing
Saharanpur- Haridwar bypass near ISBT. • From near chanderbani link on Saharanpur Road to Nanda–ki-Chowki on
Chakrata Road. • Connecting ISBT to proposed western – bypass New Roads • New Road from Nanda-ki-chowki on Chakrata road to Mussoorie near Hathi
Panw. • Missing link between Tapovan road and Sahastradhara Road. • New road from Dhara chowki (Rajpur road) to Lansdown chowk (2 lane with
footpath) New Road along River Banks
Following roads are proposed along the river bank: • New road on Bindal river bank from Bindal pul on Chakrata road to new
cantonment • New road on Bindal rao river bank from Patel nagar to Saharanpur- Haridwar
bypass via HDC • New road on Rispanao riverbank from Sahashtradhara bypass at Nagal to
Raipur road near Old Dhalanwala • New road on Rispanao riverbank from Raipur road near the junction of
Uttarakhand Urban Development Project
Dehradun City Development Plan Page 183
Tapovan Ashram road to Haridwar road near Vidhan Sabha junction via Danonwala crossing kidduwala – Dharampur road
Elevated Roads above River beds
a) Through Bindal Rao River • Saharanpur- Haridwar bypass to Saharanpur near Patel nagar • Saharanpur road to Kanwli road • Kanwli road to Chakrata road • Chakrata road to Cantt. road
b) Through Rispana Rao/ Nalla Pani Road
• Haridwar road to Raipur road near Tapovan Road Over Bridges/ Flyovers/Elevated roads
Road over Bridges (Railway level Crossings)
Considering the future developments on both sides of existing bypass road, a 4 lane ROB is proposed to be constructed at following locations. • On existing Saharanpur – Haridwar Bypass (NH-72) • On NH- 72 near Mohkhampur Railway level crossing • On new PWD Road constructed from Haridwar Road to Railway Station,
Race course and then connect it to Kargi road near Guru Ramrai College which leads to Saharanpur Road. Saharanpur, Haridwar bypass road
Flyovers
To reduce conflicts at the junction, following Flyovers are proposed at the following locations. • On Saharanpur Road near ISBT Junction. • At junction of Saharanpur road and proposed bypass (south- western) Elevated Roads
With the increased traffic flow, it is anticipated that the saturation capacity of many junctions is going to impede smooth traffic flow at respective locations. As per the earlier pre-feasibility study at problematic locations for short- term perspective, it was found that though the traffic conditions may stabilise with grade separation but the scope is rather limited due to dense built-up areas along major road corridor, elevated road is proposed in the longer-term connecting the following:
• From Saharanpur Road near SBI along Gandhi Road, via Prince Chowk, Darshan Lal chowk, Clock Tower till before Ashley hall junction on Rajpur Road.
• From Prince Chowk to Haridwar Road till Roadways work shop.
• From Clock tower till Tagore Villa on Chakrata Road.
This will aid smooth dispersal of traffic and avoid intermixing of traffic to Mussourie with urban traffic.
The above proposals for the Flyovers, subways, elevated roads, and elevated roads above rivers should be undertaken only after the detailed technical, financial

Uttarakhand Urban Development Project
Dehradun City Development Plan Page 184
and economic feasibility study, modelling study and environmental impact assessment has been undertaken – particularly for elevated roads, and elevated roads over rivers.
Public Transport System
Presently Intermediate Public Transport (IPT) systems of the city are providing services except a little share of city buses to short and medium distance trips. With the expansion of the city and increase in its population, it becomes difficult for IPT alone to meet the demand. There is a need to gradually eliminate the IPT mode and replace them with the better public transport systems, i.e. better quality buses which are both affordable and also to meet the city’s travel demand. Minimum infrastructure such as bus bays, bus stands, and terminal facilities should be provided. The existing intra-city public transport system is being operated by private operators through bus and tempos (Vikram). The private buses are operating on 10 routes having a fleet of about 141 buses. About 10 main tempo routes are operating with as many as 1,900 tempos.
As per the RITES study, the number of intra-city public transport trips forecast in the year 2011 is 5.8 lakh per day. To cater this demand urban bus service is proposed as the major mode of public transport with tempos as feeder services. Some of the recommendations are given as follows: Increasing the Fleet of Bus
As per the standards of Govt of India, a city should have at least 100 city buses per lakh of population. This is also supported by the prevailing over crowded buses specifically in peak hours.
Hence a fleet of 100 buses per annum should be introduced for the four consecutive years beginning from commencement of the investment project. Dedicated Bus corridors, Bus bays and Terminals
Frequent busy movements of buses in busy corridors have a significant effect on the speed of traffic. Further, stopping buses at the face of traffic at bus stops tends to block the traffic moving on the left lane. Most of the roads in the city are less than 2 lanes, bus bays to improve traffic movement are required at designated places. Dedicated bus corridors and construction of new terminals at major hubs will ease the traffic flow, significantly increase the share of public transport, and will also improve the comfort of the passengers.
The following two corridors are proposed as MRTS corridors.
• Haridwar road- E C Road as North- South corridor
• Chakrata road as East – West corridor
• Bus terminal near parade ground, clock tower and railway station to be shifted and proposed at Nand ki chowki and Raipur (0.4 ha) each.
MRTS corridors of about 15 km length are suggested in a long term improvement to cater for likely future demand. A detailed study would be needed to work out this plan. However, while light rail transits, or monorail systems are very expensive, in the longer-term these will be the only alternatives to cater to urban travel demand.

Uttarakhand Urban Development Project
Dehradun City Development Plan Page 185
A detailed study would be required for the implementation of light rail or monorail system. Such single line systems have the capacity to carry 10,000 – 12,000 passengers per hour. In most cases light rails or monorails are elevated, but they can also run at grade, or below grade.
A few monorail systems are shown below
Various Monorail systems
7.2.6 Street Light
Street lighting is required for two purposes. Firstly, street lights are regarded as important for personal security – particularly by women who may be involved in shift work etc. Secondly street lighting is intended to enable the road users (motorists, cyclists and pedestrians) to see accurately and easily the carriageway and the immediate surroundings in the darkness. In city streets, therefore, there is a need to illuminate the carriageway and its immediate surroundings so that the use of head- lights can be avoided or minimized. A large no. of road accidents are caused in the night due to poor and unsatisfactory street lighting.
Improved visibility at night by means of artificial lighting improved personal safely and lessens the strain on driving and ensures comfort and also speed of traffic improves with better lighting and hence improve traffic flow conditions. Favourable headway and lateral placements vastly improve the traffic movements and reduce accidents.
The mounting height of the street light in general is 7.5 – 12.0 m for traffic routes. In general, the spacing of street lightings should not exceed 55m and should

Uttarakhand Urban Development Project
Dehradun City Development Plan Page 186
preferably be 35-45 m on important traffic routes. Generally it is 3 to 5 times the mounting height of light. The existing situation of street lights is:
As per the standards, to cover 463 km of road network of the city, total no. of street light should be 22,500 i.e. only 70 - 75 % of the road area is covered by light. This means about 3,000 new lights are required to cover the entire area. Also as per the observation, around 10-12% (say 2,000 no.) of the existing street lights needs replacement. All works envisaged under this component is proposed to be implemented in Phase 1.
7.3 Environmental Management
The environment of a city is a critical determinant of the health of its inhabitants and consequently productivity. The environmental pollution in the city is becoming a major concern due to increase of population, urbanization and transportation in the recent years. To protect environment and mitigate urban environmental pollution the following strategies are suggested:
• Conservation of existing parks, open spaces and mature trees.
• Adequate provisions for parks, green belts and plantation of trees at the planning stage for development schemes within city limits and outside area.
• Protection of environmental resources such as forest, water body etc.
• Conservation and plantation of appropriate tree species on the existing roadsides to mitigate the level of air pollutants. A regular tree census should be undertaken, which would provide information on species diversity and number of trees and change in these parameters over a period of time.
• Government of Uttarakhand (GoU) should frame bylaws to incorporate environmental protection laws.
• GoU should take necessary measures to make it mandatory for use of alternative fuels (i.e. CNG) for public transport vehicles and improve traffic management system of the city for mitigation of air pollution.
• Compliance of the MSW (Management and Handling) Rules, 2000 including identification and selection of alternative landfill sites and composting for safe disposal of MSW of the city.
• Wider coverage of the city by sewerage network and house connections and providing treatment facilities of the sewage for its safe disposal.
• Proper maintenance of the existing sewers and water supply pipelines to
Existing street lights Nos.
No. of 70 watt sodium fittings 10,304 No. of 150 watt sodium fittings 4,364 No. of tube light points 4,000 No. of high mass 400 watt points 120 Total 18,788
Uttarakhand Urban Development Project
Dehradun City Development Plan Page 187
ensure minimum leakage.
Central Pollution Control Board (CPCB) has sponsored a project titled “Preparation of Action Plan for Pollution Control in Dehradun City’. Pollution Control Research Institute (PCRI), an institute set up by Bharat Heavy Electrical limited (BHEL) is implementing this project. The major objectives of the project are:
• To study the existing environmental status of the city with respect to air, water, noise and land environment and assessment of contribution made by the domestic, industrial transport sector to the environmental quality of the region
• To prepare action plans for pollution control for Air (Vehicular and Industrial), water (Drinking and wastewater), Noise (Domestic, vehicular and Industrial) and Solid waste( Domestic, Industrial and Medical) and
• To prepare Environmental Management Plans (EMPs) with clear responsibilities of various agencies to execute action plan for the pollution control of Dehradun city.
7.4 Urban Poverty Reduction
As per National Slum Policy 2001, “Slums are an integral part of urban areas and contribute significantly to their economy both through their labour market contributions and informal production activities. This Policy, therefore, endorses an upgrading and improvement approach in all slums.
It also says that, “The ULBs should de-list those settlements which have been provided with a sustainable level of basic services and where socio-economic indicators have reached defined acceptable norms”.
Cities without slums should be the goal and objective of all urban planning for social and economic development. To reach this goal, it will be necessary to re-vision our urban development processes to make towns and cities fully democratic, economically productive, socially just, environmentally sustainable, and culturally vibrant.
One of the main objectives of the National Slum Policy is to establish a framework for involving all stakeholders for the efficient and smooth implementation of the Policy objectives.
Keeping in view the above Policy, the suggested strategies for poverty reduction are: 1. Community Organisation
• Meaningful and effective community participation involves decision making which results in a shift in the existing power relations between community and organisations. This also empowers marginalised groups in turn
• Implementation of 74th Constitutional Amendment Act in terms of community participation
Community driven programmes need to be designed so that all subgroups in the community have a voice in decision making and management, and have entitlement to the benefits. Specific gender sensitive approaches are needed to

Uttarakhand Urban Development Project
Dehradun City Development Plan Page 188
ensure inclusion of both women and men. To ensure maximization of benefits to the poor, the issues of social inclusion and gender must be considered as central element and of prime importance. The Kerala model of Kudumbashree could be adopted for organizing the poor in the city. This model is as follows-
Kudumbashree Community Based Organisations (CBOs) called Community Development Societies (CDS) have a three-tier structure. At the grassroots level every poor family in a neighbourhood, each represented by a woman, is organized into a Neighbourhood Group (NHG), covering about 20 to 40 households. A team of five barefoot organisers, consisting of Community Health Volunteer, Community Infrastructure Volunteer, Community Income Generation Volunteer, Secretary and President are at the helm of every NHG. The NHGs are federated at the Municipal Ward as Area Development Societies (ADSs) and then further networked into Community Development Societies (CDSs) at Municipalities. The CDSs Mission are registered NGOs under Charitable Societies Act.
The NHGs act as open forum for poor women to share their concerns, reflect on their state, analyse their situation, discuss issues and options, prioritise their needs and shape an anti-poverty development plan called micro-plan. Micro plans are integrated as mini plans at ADS level and the mini plans are integrated as CDS plan at Municipal level, for which about one third of the development resources of the Municipality are earmarked. Under the local government level CDS is empowered to identify the beneficiaries of anti-poverty programmes and take up community contracting of local development works. Thus the CDS system has the right of voice, the power of choice and the entitlement of action– that is, real empowerment.
The urban CDS system of Kudumbashree of Kerala teaches the planners’ world over that the poor women are capable of shaping their own development if they are given sufficient and necessary support. It has contributed a new model for poverty reduction through collective action by women.
It has been found that similar community structures already exist in the city. So it is essential to reactivate those and channelise all community development activities through them.
2. Income Generation Activities • Initiate various income generating activities for the urban poor
One of the guiding principles of the City Development Plan is reduction of urban poverty - both quality of life poverty and income poverty through enhanced opportunities for economic development.
It was evident from various consultations in the city that unemployment is an emerging concern of the citizens. It was communicated that many unemployed youth contribute to the city’s public transport system by introducing vikram, a three wheeler. But the plying of these vehicles results in the slowing down of the traffic system.
In view of this a project of vocational training for local youth is being proposed under this project. Young men and girls from slums could be trained in various vocational trainings with the help of DUDA/SUDA/DNN in order to provide gainful employment to the urban unemployed or underemployed poor through self-employment or wage employment. If priority is given to the youth group who run vikram and train them first, they will be able to start own enterprises. This will ultimately lend a hand in doing away with the vikrams.
Uttarakhand Urban Development Project
Dehradun City Development Plan Page 189
3. Community Participation
• Participatory planning by participatory problem identification and analysis is required. It also helps in designing Information Education and Communication (IEC) activities.
The citizens need to be mobilised and sensitized towards the need for their participation. This in turn will empower the local community who does not have access to basic services. This could also be achieved through the CDS structure of SJSRY programme.
• Positive Deviance (PD) approach Identify good practices Use PD people as change initiator
In every community there are certain individuals (the "Positive Deviants") whose special practices/ strategies/ behaviors enable them to find better solutions to prevalent community problems than their neighbors who have access to the same resources. Positive deviance is a culturally appropriate development approach that is tailored to the specific community in which it is used. For using PD approach to bring about a change in the community practices the current community groups under SJSRY programme could be used.
• Launching of awareness programme Participatory Hygiene and Sanitation Transformation (PHAST). Child-Child education Child-Adult education Women-Women education
It is necessary to use PHAST approach to help poor people of Dehradun to feel more confident about themselves and to improve their ability to take action and make improvements in their communities. It has been felt that feelings of empowerment and personal growth are as important as the physical changes, such as cleaning up the environment or building latrines.
Housing components are covered under Phase 1. Basic urban service provision is provided for in both phases. Further details are provided in Chapter 8.
7.5 Economic Development
The economic development strategy will focus primarily on: 1. Developing physical infrastructure including power. 2. Developing civic infrastructure like water supply, drainage, sewerage, waste
management etc 3. Creating infrastructure to facilitate development of Technology Park for
promotion of IT industry 4. Active promotion of public- private partnership (PPP) for development and
operation of infrastructure and utilities 5. Making available serviced land for industries, and real estate development. 6. Promotion of food processing industry 7. Creating amusement parks and other entertainment facilities especially for
local citizens, company executives and tourists 8. Encourage private sector to develop shopping malls and multiplexes to meet
the growing demands of the expanding middle class in the region 9. Promote non-polluting small scale and cottage industries

Uttarakhand Urban Development Project
Dehradun City Development Plan Page 190
10. Encourage development and growth of housing complexes in the private sector or joint venture
11. Creating infrastructure including making availability of land to attract educational and research institutes.
Among the above listed areas of economic development, initiatives have been already taken in respect of some of them. For example, a number of power projects are being implemented and some others are in the pipeline; infrastructure for development of a IT Park at Sahastradhara road and a Pharma-city in Selaqui are under implementation; real estate development including housing complexes in public and private sectors is progressing at a faster rate than before; shopping malls and multiplexes are coming up; SIDCUL has been created to provide single window facilities to the potential investors in industry in the State; and the Integrated Industrial Estate in Selaqui, which will accommodate large number of small scale industries, will generate economic impact on Dehradun also. This is not an exhaustive, but rather an indicative list of initiatives of the State that will contribute towards strengthening the economic base of Dehradun. The urban and civic infrastructure development proposed in the CDP of Dehradun will provide the essential support to the process of economic development of Dehradun, and will ensure sustainability of the envisaged economic growth of the city.
7.6 Strengthening Urban Governance and Institutional Development
Discussions on the issues relating to strengthening urban governance and institutional development need to be linked to the ‘urban reforms’ agenda as incorporated in the JNNURM guidelines. In Chapter 4, the current and on-going ‘reforms’ programmes undertaken by the Uttarakhand State Government have been highlighted in some details.
7.6.1 Dehradun Context
Let us now gather together the salient issues that need to be addressed while discussing the prospect of ‘reforms’ or ‘changes’ in the foreseeable future.
As things stand today, conventional municipal functions such as water supply, sewerage, roads, etc. are in the hands of either para-statals or state agencies.
• Dehradun Nagar Nigam (DNN) has very few functions in direct municipal domain. In fact, Solid Waste Management is the main function of DNN. Unlike city corporations elsewhere in India, DNN has very limited role to play in the city’s planning, development and infrastructure provision.
• Even among the parastatals, UPJN and UJS, there is lack of coordination. For instance, it is not uncommon to see newly built water works have not been taken over by UJS and therefore UPJN would be engaged in O&M activities by default. Separate reports on the UPJN and UJS need to be taken into account, while considering the point raised in this section
• Solid Waste Management, the only important function in DNN’s charge, remains poorly managed. There is urgent need to post a public health engineer to head the department. DNN’s manpower deployment for SWM needs proper planning to keep the city clean. The entire process including primary collection, transfer stations, transport and dumping has to be more

Uttarakhand Urban Development Project
Dehradun City Development Plan Page 191
carefully planned and made cost effective. Dehradun has to urgently find out a site for a second dumping ground, as the first one in use is almost saturated. The report on ‘sewerage’ separately prepared has to be studied along with this section
• DNN has not yet adopted the national scheme of SJSRY for urban poverty amelioration. Slum improvement and poverty amelioration should in future be taken up more methodically by DNN.
• Community participation in DNN is faintly discernible in the Mohalla Swachata Samiti, which is also not functioning well since local contribution has not been regular and willing.
• Ward Committee as constituted now on the basis of one committee for as many as nine electoral wards, is too large and unwieldy to make for effective local level participative civic governance
• In the absence of institutionalization of citizens’ involvement through smaller ward committees and other mechanisms, city management has remained virtually an ‘outsiders’ job and not a participative civic management exercise.
• Despite considerable scope for PPP (say, in solid waste or street lighting), as of today there is hardly any evidence of PPP in respect of any municipal infrastructure provision.
• Municipal management improvement in Dehradun has three interrelated aspects: (i) improving the skill and changing attitudes of municipal political leaders, (ii) exposing the departmental heads and other employees to ‘best practices’ elsewhere in India, and designing, appropriate action-oriented, problem-solving training programmes for them a (iii) reviewing State’s municipal personnel recruitment policy including policy on creating appropriate cadres, transfer policy, and constitution of a suitable recruitment commission/committee.
• After the passage of the national public disclosure law – Right to Information Act – many states in India (for instance, Kerala) have included provisions in their municipal law to ‘empower’ citizens to make use of statutory provisions for seeking out information on municipal decisions and actions. Uttarakhand municipal law is due for radical change to conform to the 74th Constitutional Amendment. Appropriate provisions may be made in the new Act for the exercise of the right to information by citizens.
• Last but not the least, Dehradun being the capital city of the State, needs a strong municipal government, and this essential requirement needs to be acknowledged at the highest level in state administration. Besides functional transfer in terms of 74th CAA, all-round municipal capacity building (preferably after an OD exercise and a TNA exercise) would be of paramount necessity. Dehradun needs a strong municipal political executive as the key driver of change management. Alongside this, upgradation of Dehradun’s professional management should receive top priority. For instance, an officer of the all-India service may head the corporation administration, as is the practice in Calcutta and Mumbai. Also State’s imaginative municipal personnel policy including training in urban management has to be concurrently formulated to usher in a new

Uttarakhand Urban Development Project
Dehradun City Development Plan Page 192
generation of urban management practice.
In the specific context of Dehradun, the problems relating to strengthening of urban governance and institutional development can at this stage be considered in terms of three complimentary sectors:
• Municipal;
• Para-Statal; and
• Civil Society A. Municipal
JNNURM envisages mission-driven reforms. Municipal government of Dehradun, as it has evolved over the years, has remained on the margins of city governance with extremely narrow municipal functional domain, limited resources, and weak organizational and personnel structures. If the city government of Dehradun has to play a lead role in the city’s planned development as envisaged in the JNNURM, it has to be urgently ‘modernized’ (in terms of the Guidelines) from at least three perspectives: • Legislative: The municipal law, rules and regulations need to be updated in
conformity with the 74th Constitutional Amendment Act, as also by adopting/adapting some of the best features of other corporations elsewhere in India
• Financial: Resource mobilization has to be more rationally and aggressively undertaken to enhance substantially the corporation’s own sources of revenue (particularly, property tax) thereby reducing ‘overdependence’ on transfers from state.
• Managerial: Even with existing functional load, DNN has to have more skilled personnel. Additional functions, as per 74th CAA can be transferred to DNN but capacity building of DNN must precede such functional transfers.
Action-oriented problem solving ‘training’ programmes need to be designed and introduced to create a cadre of efficient municipal employees. ‘Management’ culture needs to be inculcated among both political leadership and technical-professional staff. B. Parastatals
Three parastatals in particular, UPJN, UJS and MDDA, have to have more interactions amongst themselves as well as with DNN. Even if some functional shuffling could be done on the basis of 74th CAA, Dehradun’s planned development would depend overly on ‘networking’ capacity and inter-institutional convergent action, a dire need that has to be looked into by State Government. Guessing that wholesale transfer of functions from parastatals to DNN, on an orthodox view of 74th CAA, is not going to happen immediately, the succession of scenarios presented in Fig. 4.3 (Chapter 4) needs to be followed within definitive time lines. Suggested road map would be as under: • Scenario I: Formation of a strong Standing Coordination committee within
three months of acceptance of the present report (this does not rule out, during this phase, limited transfer of functions from the para-statals to the DNN).
• Scenario II: Functional Restructuring (with more transfer of functions to DNN

Uttarakhand Urban Development Project
Dehradun City Development Plan Page 193
in terms of 74th CAA) within six months of acceptance of the present report. • Scenario III: Full-scale transfer of functions in terms of the 74th CAA model of
reforms after one year (from acceptance of this report) of careful observation of real-life institutional functioning in terms of Scenario I and Scenario II.
C. Civil Society
Due to inordinate fragmentation of authorities in Dehradun, the citizen of Dehradun does not seem to ‘own’ the city. Any meaningful city governance and development should place the citizens at the centre of things. Harnessing social energy (citizens, chambers of commerce, NGOs, etc.) in aid of ‘development’ should therefore be a major quest in days to come. For this purpose, the idea of planning and development needs to be widely publicized in local language for the understanding of the lay and informed citizens.
Citizen-administration interface needs to be sedulously cultivated through a variety of methods such as strengthening Ward Committees, forming area level consultative committees, media publicity, grass roots level meetings and workshops involving everyone who has a stake in city’s development. Involving the active NGOs in the city (which Dehradun should have in plenty) in social development generally and slum improvement and other welfare activities in particular would help synergizing and creating social capital. Urban governance, in today’s context, offers considerable scope for mobilization of voluntary activities. To the extent the city would be successful in achieving such synergy it will be able to endear itself to its citizens as well as to sufficiently minimize its administrative costs.
The approach calls for an integrated building of broad coalitions of local stakeholders and development partners around various themes as shown in Figure 7.6.1. The coalition partners have to work in concert to develop a joint strategy for a particular city/urban area that reflects a broadly shared understanding of the city’s socioeconomic structure, constraints, and prospects and the shared ‘vision’ of goals, priorities, and the requirements (the strategic plan of action).

Uttarakhand Urban Development Project
Dehradun City Development Plan Page 194
Table 7.6.2 below summarises the AIM of Good Urban Governance in Dehradun’s context and the various TOOLS that can be used to achieve the same.
Table 7.6.2: Achieving Good Urban Governance
AIM TOOLS
Greater local participation and involvement
• Promotion of city identity and a sense of citizenship for all • Public meetings, participatory planning and budgeting • City referenda and public petitioning • Better democratic structures and culture • Involvement of marginalised groups in the city systems.
Efficient urban management
• Taking account of all interests in promoting efficiency and better services
• Efficient investment in infrastructure • Delegation of decision taking to the lowest appropriate level • Collaboration and partnerships, rather than competition • Appropriate training to improve capacity of city officials • Using information technology to best advantage • Environmental planning and management carried out in co-operation
with the citizens • Disaster preparedness and crime control for safer environments.
Accountability/ transparency
• Monitoring of government activities by coalitions of organisations • Rigorous accounting procedures • Clear guidelines on conduct for leaders and officials that are enforced • Open procurement and contracting systems • Transparency in financial arrangements • Disclosure of information • Fair and predictable regulatory frameworks • Independent and accessible complaints procedures • Regular flow of information on key issues • A wide range of suppliers
Accessibility • Regular and structured consultation with representative bodies from all sectors of society including individuals in the decision making processes
• Access to government by all individuals and organisations • Access to economic opportunity • Protection of the rights of all groups
7.6.2 Major Recommendations
• Recommendations in course of institutional analysis have been made in specific parts in italics in Chapter 4. By way of highlighting, some major recommendations are hand-picked here for the sake of emphasis:
• Among the many ‘reforms’ agenda items listed in JNNUM guidelines, conformity legislation on the basis of 74th CAA is of crucial importance. A new Municipal Bill has been drafted, and this should be finalized and given full legal form at the earliest possible time.
• The Dehradun Nagar Nigam, in its present form, is too weak even to manage its very limited functional load. DNN’s political and executive-professional structure needs overhauling to enable it to cope with large development projects in future. An All-India Service Officer should be posted as its chief executive, following the system in other big cities in India.

Uttarakhand Urban Development Project
Dehradun City Development Plan Page 195
• Two important legislations are still due: one on public disclosure, and another on community participation. These can be made parts of the new Municipal legislation on the anvil.
• Training and capacity building need to be taken up both for political leadership and the professional staff in the municipalities and the para-statals. For this purpose, a Training Cell may be set up in the Urban Development Directorate. TNA exercise to ascertain training needs and identification of specific training institutions may be done at the earliest. Meanwhile, the urban Centre within ATI may be suitably strengthened.
• Community participation, to start with, may be initiated with the help of ‘ward committees’ by issuing govt. order, specifying the tasks of the Ward committee. Other forms like citizen’s charter may have to be evolved through workshops and training programmes. Plans and programmes need to be widely publicized to let the people know and ‘own’ these.
• Reforms at the municipal level need to be initiated by the State. For this purpose, the State’s secretariat needs to be reorganized to enable the policy level to come out with more holistic and integrative view of things on the ground. UDD should have under it the DAs and the TCPO. Its Directorate dealing with ULBs needs to be strengthened to help the modernization processes in the ULBs that are under way now.
• In the Dehradun urban situation, there are too many institutions that have grown up under historical circumstances (being a successor state, Uttarakhand inherited these). Keeping in view the needs for coordinated development and institutional strengthening, a well-thought-out institutional planning is of crucial importance. This is not going to be a one-shot exercise and needs to be taken up on phased basis. The process of institutional re-engineering has been graphically shown in Chapter 4. Rough time lines have been indicated to bring about institutional changes within a time frame. Four scenarios have been depicted as shown below.
• Scenario I: Formation of a strong Standing Coordination committee within three months of acceptance of the present report (this does not rule out, during this phase, limited transfer of functions from the para-statals to the DNN).
• Scenario II: Functional Restructuring (with more transfer of functions to DNN in terms of 74th CAA) within six months of acceptance of the present report.
• Scenario III: Full-scale transfer of functions in terms of the 74th CAA model of reforms after one year (from acceptance of this report) of careful observation of real-life institutional functioning in terms of Scenario I and Scenario II.
• Change management of this scale and complexity would require a specialized cell within the UDD which may be called PMU (project management unit).
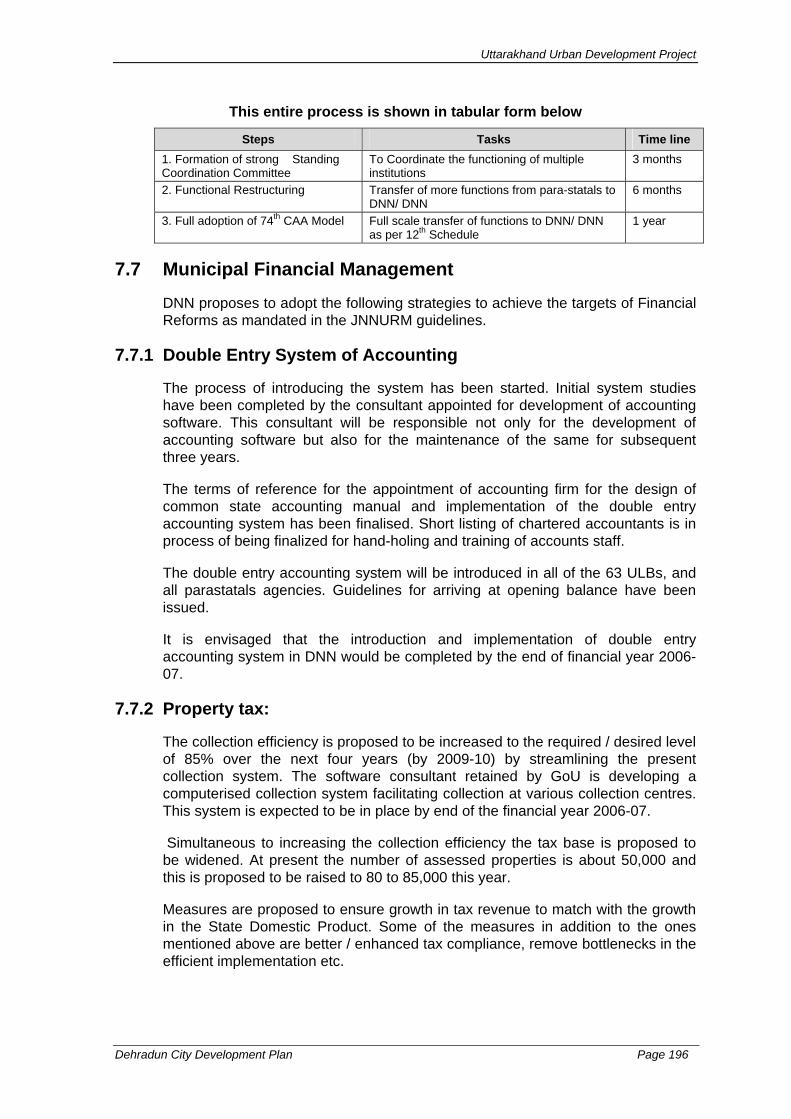
Uttarakhand Urban Development Project
Dehradun City Development Plan Page 196
This entire process is shown in tabular form below
Steps Tasks Time line 1. Formation of strong Standing Coordination Committee
To Coordinate the functioning of multiple institutions
3 months
2. Functional Restructuring Transfer of more functions from para-statals to DNN/ DNN
6 months
3. Full adoption of 74th CAA Model Full scale transfer of functions to DNN/ DNN as per 12th Schedule
1 year
7.7 Municipal Financial Management
DNN proposes to adopt the following strategies to achieve the targets of Financial Reforms as mandated in the JNNURM guidelines.
7.7.1 Double Entry System of Accounting
The process of introducing the system has been started. Initial system studies have been completed by the consultant appointed for development of accounting software. This consultant will be responsible not only for the development of accounting software but also for the maintenance of the same for subsequent three years.
The terms of reference for the appointment of accounting firm for the design of common state accounting manual and implementation of the double entry accounting system has been finalised. Short listing of chartered accountants is in process of being finalized for hand-holing and training of accounts staff.
The double entry accounting system will be introduced in all of the 63 ULBs, and all parastatals agencies. Guidelines for arriving at opening balance have been issued.
It is envisaged that the introduction and implementation of double entry accounting system in DNN would be completed by the end of financial year 2006-07.
7.7.2 Property tax:
The collection efficiency is proposed to be increased to the required / desired level of 85% over the next four years (by 2009-10) by streamlining the present collection system. The software consultant retained by GoU is developing a computerised collection system facilitating collection at various collection centres. This system is expected to be in place by end of the financial year 2006-07.
Simultaneous to increasing the collection efficiency the tax base is proposed to be widened. At present the number of assessed properties is about 50,000 and this is proposed to be raised to 80 to 85,000 this year.
Measures are proposed to ensure growth in tax revenue to match with the growth in the State Domestic Product. Some of the measures in addition to the ones mentioned above are better / enhanced tax compliance, remove bottlenecks in the efficient implementation etc.

Uttarakhand Urban Development Project
Dehradun City Development Plan Page 197
8. City Investment Plan, Strategies And Implementation Plan City Investment Plans in line with the identified vision for Dehradun have been prepared through: (i) a comprehensive process of assessment of the status of physical and social infrastructure sectors, (ii) stakeholder consultations, and (iii) preliminary analysis of demand and supply. This assessment has also led to the identification of sector-specific strategies, implementation actions and associated reforms. Investment Plan is distributed over 2 phases – Phase 1 (2007-13) and Phase 2 (2014-25).
The strategies adopted primarily have three dimensions; improving the service delivery by efficiency measures, improving service delivery by creating infrastructure assets and improving the governance aspects of DNN and para- statals. This section summarises the capital investments required for creating infrastructure assets and various strategic interventions required in the implementation of such sub-projects. It is based on the analyses presented in the foregoing chapters, and sector-wise interventions identified in Chapter 7.
8.1 City Investment Plan (CIP)
The City Investment Plan is the multi-year scheduling of identified and prioritized investments. The scheduling or phasing of the plan has been developed keeping in mind likely fiscal resources availability (for new investments and O and M), technical capacity for construction and O and M, and the choice of specific improvements to be carried out for a period of six years, and in subsequent phases.
The need for the CIP is on account of:
• Assessment of city growth and infrastructure needs (to be carried out once every five years)
• Preliminary outline feasibility and engineering studies carried out for new projects
• Scheduling of investments of ongoing and committed projects with funding from other sources
• Assigning of priorities within the constraints of available financial resources
8.1.1 Institutionalising the CIP Process
The City Investment Plan is an important element of, and is significant in terms of, the city’s management process and sustainability with regard to the delivery of basic services. The city investment plan also provides a framework for the annual budget cycle for DDN and parastatals for the nest 6-10 years period and thereafter for subsequent investment phases.
As a part of the process of CIP preparation for the CDP, DNN and para statals have:
• Analysed and discussed with the stakeholders, the existing applicable

Uttarakhand Urban Development Project
Dehradun City Development Plan Page 198
norms and standards for infrastructure services;
• Agreed and recommended a reasonable and realistic option;
• Justified and provided rationale if the chosen option is not within the existing service level standards; and
• Identified the roles and responsibilities of various stakeholders in the implementation of identified projects.
8.2 Capital Facilities, Investment Phasing and Implementation
The City Investment Plan involved the identification of public capital facilities to cater to the demand of the city populace in two phases - by the year 2013 and by 2025 according to the infrastructure needs.
The project identification has been done through a demand-gap analysis of the services and reconciliation of the already identified projects as part of various outline, preliminary and in some cases detailed engineering studies. The analysis has also built on recently completed technical studies where these are available (e.g. for stormwater drainage and traffic management).
Further project prioritisation and strategising of the investments, and phasing of this investment will be carried out at the DPR preparation stage based on the strategies listed out under each service sector as identified by DNN through stakeholder consultations. The projects derived are aimed at ensuring the optimal and efficient utilisation of existing infrastructure systems and enhancing the capacity of the systems and services to cater to the demands of future population additions. Certain other projects listed as part of the CIP include developmental projects other than those addressing the core service sectors viz. system modernisation, river conservation etc. Such projects are also based on lists and or reports prepared by and for DNN by others.
The City Investment Plan and forecast of future needs for provision of capital facilities under each identified sector is presented below. These assets will help DNN and para statals universalise services for the current population as well as accommodate the expected increase in population. In sectors where long-term planning is required (for example, source development for water supply), a 30-year planning horizon (till the year 2036) is considered. Assets created in such sectors consider the projected population in this horizon. DNN expects that these infrastructure assets would not only guarantee services to its citizens, but also signal a proactive commitment to potential investors considering the Dehradun region.
8.2.1 Summary of Investments
The total estimated capital investment required for providing efficient services to the present population and future population of DNN by the year 2025 is Rs. 6,580.4 crores at constant prices.
The planning horizon for the projects identified in sectors of urban poor slum improvements, land development planning and other similar sub-projects is 2021. The planning horizon for core service sectors of water supply, sewerage, drainage, solid waste management is 2036. However, investments are proposed
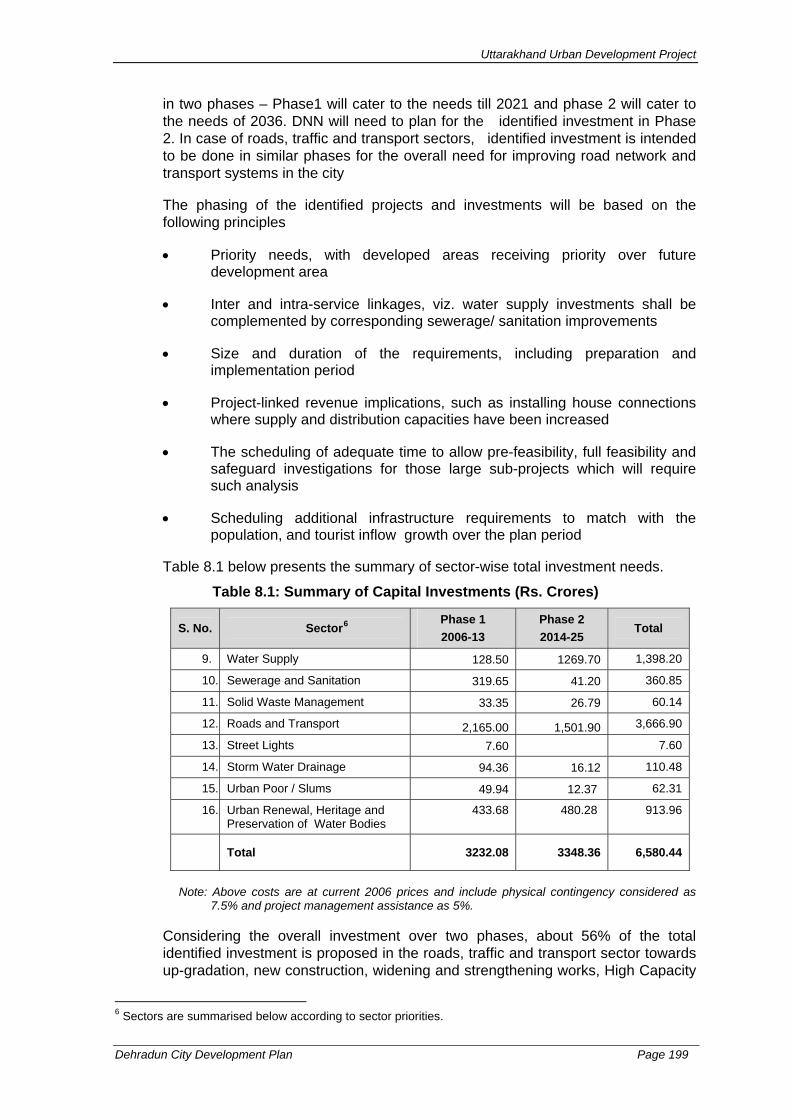
Uttarakhand Urban Development Project
Dehradun City Development Plan Page 199
in two phases – Phase1 will cater to the needs till 2021 and phase 2 will cater to the needs of 2036. DNN will need to plan for the identified investment in Phase 2. In case of roads, traffic and transport sectors, identified investment is intended to be done in similar phases for the overall need for improving road network and transport systems in the city
The phasing of the identified projects and investments will be based on the following principles
• Priority needs, with developed areas receiving priority over future development area
• Inter and intra-service linkages, viz. water supply investments shall be complemented by corresponding sewerage/ sanitation improvements
• Size and duration of the requirements, including preparation and implementation period
• Project-linked revenue implications, such as installing house connections where supply and distribution capacities have been increased
• The scheduling of adequate time to allow pre-feasibility, full feasibility and safeguard investigations for those large sub-projects which will require such analysis
• Scheduling additional infrastructure requirements to match with the population, and tourist inflow growth over the plan period
Table 8.1 below presents the summary of sector-wise total investment needs.
Table 8.1: Summary of Capital Investments (Rs. Crores)
S. No. Sector6 Phase 1 2006-13
Phase 2 2014-25
Total
9. Water Supply 128.50 1269.70 1,398.20
10. Sewerage and Sanitation 319.65 41.20 360.85
11. Solid Waste Management 33.35 26.79 60.14
12. Roads and Transport 2,165.00 1,501.90 3,666.90
13. Street Lights 7.60 7.60
14. Storm Water Drainage 94.36 16.12 110.48
15. Urban Poor / Slums 49.94 12.37 62.31
16. Urban Renewal, Heritage and Preservation of Water Bodies
433.68 480.28 913.96
Total 3232.08 3348.36 6,580.44
I Note: Above costs are at current 2006 prices and include physical contingency considered as
7.5% and project management assistance as 5%.
Considering the overall investment over two phases, about 56% of the total identified investment is proposed in the roads, traffic and transport sector towards up-gradation, new construction, widening and strengthening works, High Capacity
6 Sectors are summarised below according to sector priorities.

Uttarakhand Urban Development Project
Dehradun City Development Plan Page 200
Mass Transit works, other public transport systems, bridges and junction improvements.
This is followed by 21.3% in the water supply sector, including significant source works in the medium to long term. After this comes the investments in urban renewal, heritage, and water bodies forming 13.9% of investment proposed for land use planning and other non-core sectors for programs like river conservation, inner city revitalisation, restoration of heritage, relocation of markets and economic infrastructure, system modernization, year-to-year minor capital works etc. 1% of the investment is proposed for various urban poor/ slum development programmes. 5.5% and 1.7% respectively of the investment is proposed in the sewerage and drainage sectors. Finally, 1% of the total investment is proposed for Solid Waste Management system
8.3 Sectoral Investment Plan
Sector wise details of the City Investment Plan, capital facilities identified to be created, supportive actions and implementation aspects and strategies are discussed in the following sections in detail. Component-wise details of capital investment phasing under each sector is as follows.
8.3.1 Water Supply
Proposed component wise investments given in Table 8.2 would meet the immediate requirements of rehabilitation of the existing system as well as augmentation leading to assured supply of water to the residents of Dehradun. Geo hydrological studies, as well as, full technical, economic, and financial studies have to be carried out for the Song Dam Project as alternative source over a longer time horizon.
Table 8.2: Water Supply Sub-Projects Investments
S. No Water Supply Projects
Phase 1 2006-13
Phase 2 2014-25
Total (Rs.Crores)
1. Construction of tube well, including Pump house, Pumping Plant rising main etc. and all works needed for the commissioning (total 120 Nos.)
24.0 29.0 53.0
2. Construction of OHT of various Capacities (at 42 Localities) 36.00 33.0 69.0
3.
Reorganisation of distribution system in the newly included areas where previously water supply was made @ 40-70 LPCD (110-200 mm Dia. Av. 140 mm. Dia. PVC 6, 58.5 Km. )
4.53 4.53
4. Installation of SCADA System on Tube Wells (total 142 Nos. @ Rs. 2.0 Lacs/ each) 1.14 1.7 2.84
5. Replacement of Damaged / Old Pumping Plants (Av. 100 H.P.) 30 Nos. 3.0 3.0
6. Leak detection and water and power Audit 0.50 0.50
7.
Up gradation of Treatment plants 20 MLD and 14 MLD, Constructed in 1936 and 1980 (Change of filter media, change of valve and gauges and building repairs).
1.1 1.1
8. Procurement of Silent Mobile Diesel generator set (Av. 125 KVA) 10 Nos. 1.8 1.8

Uttarakhand Urban Development Project
Dehradun City Development Plan Page 201
S. No Water Supply Projects
Phase 1 2006-13
Phase 2 2014-25
Total (Rs.Crores)
9. Supply and installation of mechanical bulk water meters 150 mm to 250 mm, 163 Nos. sluice valves 80 mm to 250 mm 100 Nos. for separation of zones
2.25 2.25
10. Establishment of a fully equipment water testing laboratory 0.75 0.75
11. Replacement of old and damaged distribution mains (65 mm to 200 mm Dia.) in the old city 6.6 6.6
12. Replacement of Bandal Raw water main at Rajpur road from Bandal to water works 7 Km. (Out of 28 Km) laid in 1936 (350mm 4 Km, 250 mm 3 Km)
7.0 7.0
13. GIS based pipeline network mapping in Dehradun 1.0 1.0
14. Replacement of pipeline which have come under road widening 22 Km 14.10 14.10
15.
Cost of Building works a. Office of Planning & Construction unit U.P Jal
Nigam. b. Revenue collection offices & Staff quarters Jal
Sansthan.
1.40 1.40
16. Installation of India mark-II H.P. 1.80 1.80
17. Fully equipped workshop. 1.0 1.0
18. Independent Power feeder main. 4.5 4.5
19. Carrying out Hydro - geological study to ascertain water balance and determination of safe aquifer yield in view of water Demand till year 2036.
0.50 0.50
20. Economic viability studies of song Dam as a source in comparison with groundwater source to meet long-term water demand.
0.25 0.25
21.
Detailed Technical studies for integration of song Dam supply, water conveyance, treatment, master balancing storage, distribution and switchover from tubewells sources for urban system within Nagar Nigam area.
1.0 1.0
22. Construction of Song Dam as per estimate of irrigation Department. 560.00 560.0
23. Construction of intake work, water treatment plant (240 mld) Gravity main, clear water main and protection works as per estimate of UPJN.
504.92 504.92
Total 114.22 1128.62 1242.84
Physical Contingency @ 7.5 % 8.57 84.65 93.22
Project Management Assistance @ 5 % 5.71 56.43 155.36
Grand Total 128.50 1269.70 1398.20
8.3.2 Sewerage
The component-wise investments proposed in Table 8.3 will involve the rehabilitation and augmentation of sewerage systems and construction of sewage treatment plants (STPs). These investments are in line with the investments in water supply system augmentation.

Uttarakhand Urban Development Project
Dehradun City Development Plan Page 202
Table 8.3: Sewerage Sub-Projects Investments
S. No. Sewerage Projects
Phase 1
2006-13
Phase 2
2014-25 Total
(Rs.Crores)
1. Augmentation of present sewerage Systems. 209.43 5.9 215.33
2. Construction of Large new Sewage Treatment Plants. Kargi and Daudwala STP 50.40 20.64 71.04
3. Construction of Medium sized STP Indira Nagar STP. 4.8 1.92 6.72
4. Construction of small/decentralized STP. Salawala, Vijay colony and Doon Vihar STP. Total
5.5 1.96 7.46
5. New STP for Zone J and K 5.2 5.2 6. Land acquisition for Sewage Treatment plants. 14.0 1.0 15.0
Total 284.13 36.62 320.75 Physical Contingencies - 7.5 % 21.31 2.74 24.05 Project Management Assistance - 5 % 14.21 1.83 16.03 Grand Total 319.65 41.2 360.83
8.3.3 Roads and Transport
Proposed component-wise investments are given in Table 8.4 which would meet the city’s requirements over the next 25 years by widening of existing roads, construction of new bypasses to reduce traffic congestion, and construction of elevated roads above the beds of two rivers. Provision has been for a limited mass rail transport system – light rail or monorail system has been proposed.
Table 8.4: Roads and Transport Sub-Projects Investments
S. No. Projects
Phase 1 2006-13
Phase 2 2014-25
Total (Rs.Crores)
A. Traffic Management
1 Traffic singh board (L S) 0.17 0.17
2 Road Marking (L S) 0.63 0.63
3 Reflectors 0.18 0.18
4 Guard rail 25.87 25.87
5 Footpath (with covered drain) 0.60 0.60
5A Road Furniture 1.52 1.52
6 Traffic Education Awareness Programme 2.00
2.00
B Off-street Parking ( 3 storey) 95.15 95.15
C Junctions 2.10 2.10
D Signal 0.80 0.80
E Widening and strengthening of existing roads (Arterial and Sub arterial) 41.45 41.45
F New Bypasses 132.00 132.00
G Construction of new roads (Arterial/Sub Aterial) 5.50 39.00 44.50
H New Road along River Banks 70.20 70.20

Uttarakhand Urban Development Project
Dehradun City Development Plan Page 203
S. No. Projects
Phase 1 2006-13
Phase 2 2014-25
Total (Rs.Crores)
I Grade Separators
1 Subways 10.08 8.19 18.27
2 ROBs /Flyovers/Elevated Roads 15.44 17.64 33.08
3 Elevated Roads 105.84 105.84
J Elevated road along the river 285.18 285.18
K Monorail/ Metro 1200.00 1200.00 2400.00
Total 1924.5 1335.0 3259.50
Physical contingency – 7.5% 144.3 100.1 244.40
Project Management Assistance – 5% 96.2 66.8 163.0
Grand Total 2165.0 1501.9 3666.90
8.3.4 Storm Water Drainage
The proposed component-wise investments given in Table 8.5 would meet the immediate requirements for rehabilitation of existing Nalas including lining and provision of surface drains. Completion of these investments will go a long way in reducing the water logging and flooding of city areas, especially during the rainy season.
Table 8.5: Storm Water Drainage Sub-Projects Investments
S. No. Projects
Phase 1 2006-13
Phase 2 2014-25
Total (Rs.Crores)
1. Surface Drains 62.10 6.00 68.10
2. Box Culverts 6.13 0.60 6.73
3. Slab culverts 0.65 0.06 0.71
4. Precast covers 1.04 0.10 1.14
5. Outfall Structures 0.38 0.38
6. Rehabilitation of existing Nala and lining (10 Km) 7.33 7.33 14.66
7. Laying of under ground 450 mm pipes in small Lengths 6.00 6.00
8. Manholes 900mm where existing drains are permanently covered. 0.25 0.25 0.50
Total 83.88 14.34 98.22
Physical Contingency - 7.5 % 6.29 1.07 7.36
Project Management Assistance 5 % 4.19 0.71 4.91
Grand Total 94.36 16.12 110.49
8.3.5 Street Lighting
The investments envisaged for street lighting would fulfill the immediate requirements.

Uttarakhand Urban Development Project
Dehradun City Development Plan Page 204
Table 8.6: Street lighting Sub-Projects Investments
Projects Phase 1 2006-13
Phase 2 2014-25
Total (Rs.Crores)
Street Lights 6.74 6.74 Physical contingency - 7.5% 0.51 0.51
Project Management Assistance - 5.0% 0.34 0.34
Grand Total including contingencies 7.59 7.59
8.3.6 Solid Waste Management
Proposed component-wise investments given in Table 8.7 would meet the immediate requirements for an efficient system of collection and disposal of the entire solid waste generated in the city of Dehradun. Some major replacement and/or maintenance of the systems are proposed as long term investments.
Table 8.7: Solid Waste Management Sub-Projects Investments
S. No. Projects
Phase 1 2006-13
Phase 2 2014-25
Total (Rs.Crores)
1 Procurement of Equipment and Vehicles
Containerised Handcarts 1.30
2.9 4.20 Containerised Cycle-rickshaw 2.16 6.7 8.86 Seamless Handcart for desilting of drains 0.32 0.9 1.22 Container liftable by tractors (4.5 m3) 0.97 0.3 1.27 Dumper Placer Containers (4.5 m3 capacity) 1.36 0.9 2.26 Dumper Placer Machine 0.03 0.5 0.53 Tractor 0.19 0.2 0.39 Pickup Vehicles (1-2 m3 Capacity) 0.85 1.9 2.75 Tipper Truck (10-12 m3 Capacity) 2.1 2.7 4.80 Vaccum Sweeping Machine 0.5 0.8 1.30 Refuse Compactor 0.6 0.8 1.40 Refuse Compactor Bin 0.8 2.0 2.80 Drain Cleaning Machine 0.5 0.9 1.40 Bull Dozers (Land Levelling) 2.88 2.30 5.18 2 Construction of Circle Offices 0.32 0.32 3 Construction of SW Transfer Station 0.20 0.20
4 Construction of Vehicle Depot with Workshop Facility 0.25 0.25
5 Development of Existing Disposal Site 1.60 1.60
6 Development of new disposal site (After Identification and Selection) 3.50 3.50
7 Compost Plant (400MT)* 0 7 Public Awareness 2.00 2.00 8 Training and Capacity Building 0.50 0.50 1.00 Preparation of SWM Master Plan 0.30 0.30 EIA Study for SW Disposal sites 0.10 0.10 Land Cost Circle Office (4nos) 0.15 0.15 Vehicle Depot 1.00 1.00

Uttarakhand Urban Development Project
Dehradun City Development Plan Page 205
S. No. Projects
Phase 1 2006-13
Phase 2 2014-25
Total (Rs.Crores)
Transfer Station (4 nos) 0.17 0.17 Disposal Site (New) 5.00 5.00 Total 29.65 23.8 53.45 Physical Contingency - 7.5% 2.22 1.8 4.02 Project Management Assistance - 5% 1.48 1.19 2.67 Grand Total 33.35 26.79 60.14 Note: *The Compost Plant has been proposed to be handed over on Built-Own-Operate basis.
8.3.7 Urban Poor
The proposed component-wise investments given in Table 8.8 would meet the immediate requirements for housing of slum populations, sewerage and drainage in identified slums as well as the rehabilitation and resettlement of slum settlements along the river banks. The requirements in respect of water supply and solid waste management system in the slum settlements have been provided for in the overall city investment plan for respective sector.
Table 8.8: Urban Poor Sub-Projects Investments
S. No. Project
Phase 1 2006-13
Phase 2 2014-25
Total (Rs.Crores)
1. Housing [email protected],000* 12 12 Infrastructure provision 2. Water Supply
Uniform supply Awareness Programme
Uniform supply Awareness Programme
0.02
Uniform supply Awareness Programme
0.01
0.03
3. Drainage (New- 7500mtr, Repairing- 4300 mtr)) 3.75 1.08 4.83
4. Sewerage
16.82
Linkage with overall sewer
system 9.00
25.82
5. Solid Waste
Is included in the overall city development plan
6. Access Road 10,000mtr
1.80 0.90 2.70
7. LCS 5 community Latrines (5+5 seater) Rs.3500 each 0.002 0.002 0.004
8. Street Light Convergence with DNN and power corporation 9. Rehabilitation/Resettlement of
river side slum dwellers 10.00
Total 44.39 10.99 55.38 Physical contingency - 7.5% 3.33 0.83 4.16 Price contingency - 5.0% 2.22 0.55 2.77 Grand Total 49.94 12.37 62.31 * A minimum of 12% (10% in case of SC/ST and other weaker section) beneficiary contribution with bank loan would be added.
7 As per the estimated population of 2006 there are about 106863 houses in Dehradun (household size being 5.1). Out of these 15.9 percent (about 17,000) are either kutcha or semi-pucca. Of these only the poorer section has been considered as being eligible for EWS housing scheme.

Uttarakhand Urban Development Project
Dehradun City Development Plan Page 206
8.3.8 Urban Renewals and Redevelopment
Table 8.9 provides the details of various urban renewal and redevelopment sub-components proposed for investment. Some of the major proposals are shifting of the entire government offices to new site, shifting of arhat bazaar, improvement of city core areas, development of milk dairies, development of slaughter houses, development of fruit and vegetable markets and development of city level sports complex.
Table 8.9: Urban Renewals, Cultural Heritage and Preservation of Water Bodies
S.No. Projects Phase 1 2006-13
Phase 2 2014-25
Total (Rs.Crores)
1 Redevelopment of City Centre-Chakrata Road and around GPO 12.80 19.20 32.00
2
Redevelopment / Improvement of City Core Areas (Paltan bazar, Dilaram bazar, Gandhi road, Dispensary road, Faltu Lane, Rajpur road including shifting of Kabadi market)*
24.00 36.00 60.00
3 Shifting of Arhat Bazar (Whole sale market) from the city center
55.82 36.81 92.63
4 Improvement of Gandhi Park 0.60 0.60
5 Revitalisation of Old Village Pond at Defense Colony 1.55 1.55 6 Improvement of Existing Simrirtivan at Rajpur Road 0.50 0.50
7 Revitalisation of Old Village Pond at Niranjanpur 0.88 0.88
8 Development of Slaughter House at 4 locations outside city area
7.00 7.00 14.00
9 Development of Milk Diaries at 6 places 9.00 6.00 15.00
10 Development of Decentralised Fruit and Vegetable Markets at 98 places
7.50 21.90 29.40
11 Shifting of Government offices from the city centre to outside city
200.00 300.00 500.00
12 Development / Renovation of Multipurpose Community Halls (3 nos)
4.00 4.00
13 Development of City Level Sports Complex (Indoor and Outdoor)*
52.00 52.00
14 Modernisation of Cattle Pounds 1.00 1.00
15 Improvement of Burial and Cremation Grounds 3.6 3.60
16 Redevelopment / Improvement of Sahastradhara area 2.50 2.50
17 Redevelopment / Improvement of Robber's Cave 2.50 2.50
18 Improvement of Tapkeshwar Mahadeo temple 0.25 0.25 Total 385.5 426.91 812.41 Physical Contingencies 7.5% 28.91 32.02 60.93 Project Management Assistance – 5% 19.28 21.35 40.63
Total 433.68 480.28 913.97
* Includes provision for Urban Afforestation / Plantation
8.4 Financing Plan
As per the guidelines of JNNURM, Dehradun is eligible for 80% of the total project cost as grant finance from the Government of India. 10% of the total project cost will be financed through grants from State Government. DNN and Para Statals would be contributing the balance 10% of the total project cost.

Uttarakhand Urban Development Project
Dehradun City Development Plan Page 207
As per the same guidelines, in case any JNNURM project is also approved as Externally Aided Project (EAP), the EAP funds can be passed through as ACA to the State Government as funds contributed by State/ULBs/FIs and JNNURM funds can be used as GoI contribution. Urban infrastructure investments in respect of Haridwar are also being taken up for the proposed Asian Development Bank (ADB) urban sector loan for Uttarakhand. The GoU is in negotiation with ADB and it is anticipated that significant ADB funds could be leveraged for Haridwar and other urban centers in Uttarakhand. The application of JNNURM funds to the city’s investment proposals contained within this CDP and associated CIP will be appropriately adjusted during preparation of DPRs in sub-sectors where application of ADB funds will be involved.
8.5 Financial and Operating Plan
8.5.1 Cost Estimates and Financing Plan
Cost Estimates. The total cost of the CDP, during the JNNURM period, is estimated at Rs.3885.44 crores (Rs.38, 854.4 million) including duties, taxes and contingencies (physical and price). Base cost of sub-project components were determined based on prevailing Schedule of Rates and compared with costs of similar nature projects – where designs / detailed reports were available, costs were counterchecked and incorporated into the CDP. Physical and price contingencies are included in investment program cost. Costs on Investment Program Management are estimated at the overall program level and is also included in the CDP sub-project cost. CDP cost summary is indicated in Table 8.10.
Financing Plan. Based on discussions held with GoU, 80 percent (Rs.3108.4 crores) of the CDP is proposed to be financed by Government of India as grant, 10% (Rs. 388.5 crores) by GoU, Dehradun MDDA and Dehradun NN as equity, and 10 percent (Rs.3,88.5 crores) of the CDP is proposed to be financed by grant from GoU.
Table 8.10: Investment Program Component Programme Distribution.
Rupees million % Part A: Urban Infrastructure Improvement
Water Supply 1,285.0 4.0% Sewerage and Sanitation 3,196.5 9.9% Solid Waste Management 333.5 1.0% Urban Drainage 943.6 2.9% Urban Transport and Roads 21,650.6 67.0% Sub total - Part A 27,409.2 84.8%
Part B: Slum Improvement Community Infrastructure 499.4 1.5% Street Lighting 75.8 0.2% Sub total - Part B 575.2 1.8%
Part C: Civic Infrastructure
Urban Renewals 4,336.8 13.4% Sub total - Part C 4,336.8 13.4%
Cost including physical contingencies 32,321.2 100.0% Price Contingencies 6,533.2 Sub total – Contingencies 6,533.2
Total Cost 38,854.4 Source: Analysis.

Uttarakhand Urban Development Project
Dehradun City Development Plan Page 208
8.5.2 CDP Sustainability
Basic Assumptions for Projections
In order to determine the financial viability of the CDP, two instruments were used – the internal rate of return (FIRR) and the Financial Operating Plan (FOP). The FIRR determines the rate of return based on surplus cash flows from sub-project account. The FOP is a cash flow stream of Dehradun Jal Sansthan / NN / MDDA based on regular revenues, expenditures, and applicability of surplus funds to support sub-project sustainability. The FOP horizon is determined to assess the impact of full debt servicing liability resulting from the borrowings to meet the identified interventions/sub-projects. The proposed capital investments are phased over a five-year period from FY2008 to FY2012.
Revenue Income. The assumptions for forecasting revenue income comprise:
(i) Taxes and Charges. In cases like property related taxes, water charges and sewerage charges, where the base and basis of revenue realization are known and predictable, the likely revenue is forecast based on certain assumptions regarding growth in number of assessments, revision in ARV (in case of property-related taxes), revision in charges/tariffs and improvement in collection efficiencies.
a. Property Tax: projected based on ARV per property; number of assessments to grow at a nominal 1 percent per annum; ARV for properties assumed to grow at 3 percent per annum; ARV for all properties revised once in five years beginning 2006-07 at 30 percent; and collection performance assumed at 80 and 86 percent against arrears and current demand respectively.
b. Water Charges: no new connections envisaged in the base case scenario and increase in water connections is a result of the availability of additional water for distribution – it is assumed that 90 percent of the properties would have water connections by FY 2028; the current rate of water charge is revised at 5 percent annually; collection performance is assumed at 85 percent of total demand; and new (one-time) connection charges are adopted at Rs.1,000 per domestic connection, Rs.2,000 per commercial connection and Rs. 3,000 per industrial connection.
c. Sewerage Charges: it is assumed that 43 percent of the properties under this phase would have sewer connections by FY 2028; an average surcharge rate of 50 percent of the water charges per property is assumed for FY2012 and increase is assumed annually in proportion to water charges; collection performance is assumed at 85 percent of the demand; and new (one-time) connection charges are adopted at Rs.1,500 per domestic connection, Rs.3,000 per commercial connection and Rs.4,500 per industrial connection.
(ii) Other revenue income from own sources. All revenue income from own sources other than property-related taxes, and water and sewerage charges, where the base and basis is not clearly defined, are forecast based on the observed trend during the past five years/assessment period (2001-02 to 2005-06). Non-tax Own Sources and Tax Own Sources are expected to grow at 10 percent annually.

Uttarakhand Urban Development Project
Dehradun City Development Plan Page 209
(iii) Grants and Contributions Revenue income in the form of grants and contributions are also forecast based on the observed trend during the last five years (2001-02 to 2005-06), to meet the operational deficits.
(iv) Additional Revenue Income due to Sub-Projects. The sub-projects – in case of water and sewerage projects – are expected to secure additional revenue by way of increase in number of assessments and levy of user charges. Water charge is adopted at Rs.4.1/kl ( average) (FY2008) with an annual revision of 5 percent; the sewerage charge is adopted at 50 percent of the water charges with corresponding annual revision, and the conservancy charge is adopted at Rs.40 per month from FY2012 with an annual revision of 10 percent. The additional revenue income due to water supply, sewerage and solid waste management sub-projects is computed based on the proposed number of properties, new connections, proposed tariffs and assumed collection performance (at 85 percent of demand).
Revenue Expenditure. Key assumptions for forecasting revenue expenditure comprise:
(i) Expenditure on Municipal Services. Expenditure on municipal services including general administration, revenue collection and service delivery are forecast based on the observed trend during the past five years (2001-02 to 2005-06), and is expected to grow at 8 percent annually. General Administration expenditure is expected to increase at 8 percent annually and increase in staff salary is assumed at 8 percent of the current employee related expenses.
(ii) Outstanding Non-debt and Debt Liabilities. Currently, Dehradun NN does not have any outstanding non-debt liabilities like payments due to employees, Uttarakhand Power Corporation (UPC), etc. Hence, it is assumed that future non-debt liabilities will not occur. Dehradun Jal Sansthan has no outstanding loans.
(iii) Additional O&M Expenditure due to Sub-Projects. While each sector identifies the O&M costs applicable for asset maintenance (manpower, consumables, power charges, etc.), a proportion of the capital cost was derived for projections. Table8.11 presents the assumptions regarding O&M expenditure on new assets.
Table 8.11: Assumed O&M Expenditure
Sector O&M as % of Capital Cost
Water Supply 3.00 Sewerage & Sanitation 2.00 Urban Drainage 2.00 Solid Waste Management 15.00 Urban Transport and Roads 2.00 Community Upgrading 2.00 Urban Development 2.00
Capital Account. In case of capital account, no capital transactions are considered and sub-project cash flows are loaded onto the FOP and their impact on Jal Sansthan, Development Authority and municipal finances tested. Key
Uttarakhand Urban Development Project
Dehradun City Development Plan Page 210
assumptions regarding capital account are investment phasing and sub-project financing/funding structures.
(i) Capital Expenditure. The estimated expenditure for implementing sub-projects is phased over 2008-12 and expenditure ascertained adopting a physical contingency of 7.5 percent (for civil works) and a price contingency of five percent per annum. Base costs are determined based on 2006-07 prices.
(ii) Capital Income. Capital income is forecast based on actual requirement to meet proposed capital expenditure. This Phase of CDP assumes 20 percent grant / equity financing from Government of Uttarakhand, Dehradun NN and Dehradun Development Authority and 80 percent grant financing from Government of India under JNNURM.
Sustainability
Sustainability Analysis. Sustainability analysis assumes that GoU and parastatal agencies like Dehradun Jal Sansthan and Dehradun NN will carry out minimum reforms indicated as assumptions for financial projections. The financial and operating plan (FOP) for Dehradun Jal Sansthan and Dehradun NN evaluates the Jal Sansthan / Municipal fund status for the following scenarios:
(i) Base Case Scenario. In the base case scenario, the finances of Dehradun Jal Sansthan / NN are forecast in a “do nothing” or “without CDP” scenario. The revenue deficit indicates Dehradun Jal Sansthan / NN incapacity to service capital expenditure.
(ii) Investment Scenario. The investment scenario is based on investments identified under the CDP and the requirement for upgrading the city’s infrastructure is estimated and phased based on construction activity. Implications of this investment in terms of additional operation and maintenance expenditure are worked out to ascertain sub-project cash flows. Revenue deficits from the Base Case Scenario and sub-project cash flows emerging from implementable investments – the cash flow net surpluses indicates the Dehradun NN’s and Dehradun Jal Sansthan’s ability to generate operating surplus. FY 2013 is assumed as the reference year to determine the net surpluses and whether Dehradun Jal Sansthan / NN maintain a debt/revenue surplus ratio as an indication of the Dehradun Jal Sansthan / NN ability to sustain investments.
Based on the aforesaid sustainability analysis, the sub-project cash flows were applied onto Dehradun Jal Sansthan / NN Revenue Account cash flows to determine the Operating Surplus/Closing Balance. Summary figures are indicated in Table 8.12 and Table 8.13 below.

Uttarakhand Urban Development Project
Dehradun City Development Plan Page 211
Table 8.12: CDP Sustainability – Dehradun Jal Sansthan
2007 2013 2021 2032 Item
Rs. million
Revenue Account
Opening Balance (5.5) 0.6 0.9 0.0
Revenue Income 153.1 404.6 731.8 1,810.6
Revenue Expenditure 147.5 404.5 731.8 1,809.8
Closing Balance 0.1 0.7 0.8 0.8
Source: Analysis.
Table 8.13: CDP Sustainability – Dehradun NN
2007 2013 2021 2032 Item
Rs. million
Revenue Account
Opening Balance - 0.1 0.3 0.7
Revenue Income 142.7 370.8 619.8 1,324.5
Revenue Expenditure 142.7 370.8 619.9 1,324.5
Closing Balance 0.0 0.1 0.2 0.7
Source: Analysis.
8.6 Investment Sustenance Plan
Steps are being initiated to meet the requirements of mandatory reforms and optional reforms, institutional and financial, at the ULB / Para Statal level in order to strengthen the financial system and improve financial management in these bodies (see Chapter 4). Modalities for meeting the minimum requirement of 50% of the operation and maintenance costs, as per the JNNURM guidelines, would be worked out and implemented towards full cost recovery in a phased manner.

Uttarakhand Urban Development Project
Dehradun City Development Plan Page 212
Table 8.14: Financial Improvement Action Plan
Item / Current Situation FY 2006-07
FY 2007-08
FY 2008-09
FY 2009-10
FY 2010-11
FY 2011-12
FY 2012-13 Remarks
A. Water Supply • Connection Fee Revision
- - - 20% of fee in FY 2007
- - 20% of fee in FY 2010
Water connection fee is assumed as Rs.1000 for domestic connections in FY 2007.
• Increase in monthly water charge per connection
- 5% 5% 5% 5% 5% 5% The monthly charge for domestic connection is Rs. 4.1 per Kilo Litre (KL) in FY 2008. 85% collection performance.
• Properties covered by water connections
76%
80%
85% 90% 90% 90% 100% coverage
B. Sewerage • Connection Fee Revision
- - - 20% of fee in FY 2007
- 20% of fee in FY 2010
Sewer connection fee is assumed as Rs.1500 for domestic connections in FY 2007.
• Increase in monthly sewer charge per connection
same as in case of water Based on the size of investments and the priority for sewerage investments, sewer charges are proposed as monthly fees as a 50% surcharge on water. 85% collection performance.
• Properties covered by sewer connections
5%
20%
25%
50% coverage by FY 2028.
C. Solid Waste Management • Increase in monthly
conservancy charge per property
- - - - - 20% every three years from 2014-15
Conservancy tax/charge introduced from FY2011 Rs. 40 per month for domestic, Rs. 300 per month for commercial, and Rs. 500 per month for industrial. 85% collection performance.
• Properties covered by -

Uttarakhand Urban Development Project
Dehradun City Development Plan Page 213
Item / Current Situation FY 2006-07
FY 2007-08
FY 2008-09
FY 2009-10
FY 2010-11
FY 2011-12
FY 2012-13 Remarks
conservancy charge
60%
60%
70%
80% 100% 100% 100% coverage
C. Property Tax • ARV Revision
- - - 60% of ARV in FY 2012
- Revisions in ARV made once every three years @ 20%. Annual increase @1%.
• Collection Performance Demand
72% 76% 79% 82% 85% 85% 85% Achieve 85% collection of arrear and current demand.
Table 8.15: Financial and Operating Plan
Item Heads 2007 2008 2009 2010 2011 2012 2013 2021 2028 2032
as of March 31 (in INR Million) REVENUE ACCOUNT I Revenue Income A Tax- Own Sources 1 House Tax 29.8 31.6 33.6 35.9 58.7 64.5 70.3 151.9 266.6 364.0
2 Other Taxes & Charges (incl under spl law, acts) 4.56 5.01 5.52 6.07 6.7 7.4 8.1 17.3 33.8 49.39
Tax- Own Sources 34.3 36.6 39.2 41.9 65.4 71.9 78.4 169.2 300.4 413.4 B Non Tax- Own Sources
1 Income from Municipal Properties and Markets 2.35 2.58 2.84 3.12 3.43 3.78 4.2 8.91 17.36 25.42
2 Miscellaneous Income 10.5 11.6 12.7 14.0 15.4 16.9 18.6 39.9 77.8 113.9 Non Tax- Own Sources 12.9 14.1 15.6 17.1 18.8 20.7 22.8 48.8 95.2 139.4 C Revenue Grants / Transfers 1 State Finance Commission 87.5 139.6 147.5 155.9 164.8 174.2 184.2 266.6 265.6 240.1 2 Operational Grants 6.4 9.8 13.0 16.6 0.1 75.5 55.9 Revenue Grants 93.9 149.4 160.6 172.5 165.0 249.7 240.1 266.6 265.6 240.1 D Other Income 1 Income from Interest on Investments 1.6 1.7 1.8 1.9 2.0 2.1 2.3 3.6 5.4 6.9 Other Income 1.6 1.7 1.8 1.9 2.0 2.1 2.3 3.6 5.4 6.9 Revenue Income 142.7 201.9 217.1 233.5 251.2 344.5 343.5 488.2 666.6 799.7

Uttarakhand Urban Development Project
Dehradun City Development Plan Page 214
Financial and Operating Plan (contd….) Item Heads 2007 2008 2009 2010 2011 2012 2013 2021 2028 2032
II Revenue Expenditure A General Administration 1 Staff Salary and Employee Related Expenses 112.8 170.6 184.2 199.0 214.9 232.1 250.7 464.0 795.2 1,081.8 2 Office - Contingency expenses 14.3 15.4 16.7 18.0 19.4 21.0 22.7 42.0 71.9 97.8 Establishment 127.1 186.0 200.9 217.0 234.3 253.1 273.3 505.9 867.1 1,179.6 B Operation & Maintenance 1 Public Safety and Health and others 15.5 15.9 16.2 16.5 16.8 17.2 17.5 20.5 23.6 25.5 Operation & Maintenance 15.5 15.9 16.2 16.5 16.8 17.2 17.5 20.5 23.6 25.5 C Debt Servicing 1 Debt Servicing- Old - - - - - - - - - - Debt Servicing - - - - - - - - - - Revenue Expenditure 142.6 201.9 217.1 233.5 250.3 270.3 290.8 526.4 890.6 1205.1
Financial and Operating Plan
CASH FLOW STATEMENT - Dehradun Municipal Corporation
(Rs. Million) Item Heads 2007 2008 2009 2010 2011 2012 2013 2021 2028 2032
Opening Balance 0.0 0.0 0.0 0.1 0.1 0.1 0.1 0.3 0.5 0.7 Revenues Tax and other revenues 142.7 201.9 217.1 233.5 251.2 344.5 343.5 488.2 666.6 799.7 Solid Waste Management 0.0 0.0 0.0 0.0 0.0 4.4 27.4 131.5 332.8 524.8 Sub-total Revenues 142.7 201.9 217.1 233.5 251.2 348.8 370.8 619.8 999.3 1324.5 Expenditure Existing revenue expenditure 142.7 201.9 217.1 233.5 251.2 270.2 290.8 526.4 890.6 1205.1 Solid Waste Management 0.0 0.0 0.0 0.0 0.0 62.1 62.7 67.9 72.8 75.8 Community Upgrading & Civic Infrastructure 0.0 0.0 0.0 0.0 0.0 16.4 17.2 25.5 35.9 43.6 Sub-total Expenditure 142.7 201.9 217.1 233.5 251.2 348.8 370.8 619.9 999.3 1324.5 Closing Balance 0.0 0.0 0.1 0.1 0.1 0.1 0.1 0.2 0.5 0.7

Uttarakhand Urban Development Project
Dehradun City Development Plan Page 215
CASH FLOW STATEMENT – Operation and Maintenance Costs - GoU / MDDA
(Rs. Million)
Item Heads 2007 2008 2009 2010 2011 2012 2013 2021 2028 2032
Opening Balance - - - - 0.0 643.2 6026.0 11100.6 14163.1 Transport Planning 0.0 0.0 0.0 0.0 0.0 512.1 517.2 560.1 600.5 624.8 Urban Development 0.0 0.0 0.0 0.0 0.0 107.7 108.8 117.8 126.3 131.4 Storm Water Drainage 0.0 0.0 0.0 0.0 0.0 23.4 23.7 25.6 27.5 28.6 Closing Balance - - - - - 643.2 1292.9 6729.5 11854.9 14948.0
Note: Operation and Maintenance costs would be met from State Government grants for above along with for ongoing projects. CASH FLOW STATEMENT - Dehradun Jal Sansthan
(Rs. Million) Item Heads 2007 2008 2009 2010 2011 2012 2013 2021 2028 2032
Opening Balance -5.5 0.1 0.2 0.3 0.4 0.5 0.6 0.9 0.2 0.0 Water Supply Revenues 119.0 132.4 143.9 158.8 174.9 193.2 310.0 664.3 1,173.4 1,622.8 Expenditures 142.5 156.8 172.5 189.7 261.8 283.1 306.8 606.5 1,143.6 1,638.7 Sewerage & Sanitation Revenues 34.1 29.5 33.7 36.0 92.0 186.3 94.6 67.5 130.2 187.8 Expenditures 5.0 5.0 5.0 5.0 5.0 96.3 97.7 125.3 160.0 171.1 Closing Balance 0.1 0.2 0.3 0.4 0.5 0.6 0.7 0.8 0.3 0.7
Financial and Operating Plan
PROPERTY TAX REVENUE SCHEDULE Item Heads 2007 2008 2009 2010 2011 2012 2013 2021 2028 2032
Demography Population 597,773 617,380 637,630 658,544 680,144 702,453 725,493 939,211 1,177,272 1,339,497 Approx. Households/Properties 125,319 129,430 133,675 138,060 142,588 147,265 152,095 196,900 246,808 280,817 Authorized Properties Domestic 92,920 93,849 94,788 95,736 96,693 97,660 98,636 106,809 114,514 119,164 Commercial 5,050 5,101 5,152 5,203 5,255 5,308 5,361 5,805 6,224 6,476

Uttarakhand Urban Development Project
Dehradun City Development Plan Page 216
Item Heads 2007 2008 2009 2010 2011 2012 2013 2021 2028 2032
Industrial 3,030 3,060 3,091 3,122 3,153 3,185 3,216 3,483 3,734 3,886 Authorized Customers 101,000 102,010 103,030 104,060 105,101 106,152 107,214 116,097 124,472 129,526 Property Tax Assessments Number of old assessments 50,250 55,275 58,039 60,941 63,988 67,187 70,546 89,231 99,456 103,496 Additional assessments annually 503 553 580 609 640 672 705 892 995 1,035 Assessments to increase Tax Base 4,522 2,211 2,322 2,438 2,559 2,687 2,822 3,570 - - Total number of assessments 55,275 58,039 60,941 63,988 67,187 70,546 74,074 93,692 100,451 104,531 Annual Ratable Value Avg. ARV (Old Assessment) 3,998 4,118 4,242 4,369 6,990 7,200 7,416 12,751 21,288 27,915 Avg. ARV (New Assessment) 4,118 4,242 4,369 4,500 11,185 11,520 11,866 21,646 38,336 51,777 ARV Rate & Periodic Revision 60% ARV Increase Per New Property Current Demand (INR Million) Old Assessments 25.1 28.5 30.8 33.3 55.9 60.5 65.4 142.2 264.7 361.1 New Assessments 2.6 1.5 1.6 1.7 4.5 4.8 5.2 12.1 4.8 6.7 Total Current Tax Demand 27.7 29.9 32.4 35.0 60.4 65.3 70.6 154.3 269.4 367.8 DCB Statement
Property Tax Demand (INR Million)
Arrear 13.8 11.7 10.0 8.8 7.9 9.6 10.4 24.0 43.7 59.6 Current 27.7 29.9 32.4 35.0 60.4 65.3 70.6 154.3 269.4 367.8 Total Demand 41.5 41.7 42.4 43.7 68.3 74.9 81.0 178.3 313.1 427.4 Property Tax Collection (INR Million) Arrear 4.8 4.7 4.5 4.4 4.3 5.7 6.7 19.2 34.9 47.7 Current 24.9 26.9 29.1 31.5 54.3 58.8 63.6 132.7 231.7 316.3 Total Collection 29.8 31.6 33.6 35.9 58.7 64.5 70.3 151.9 266.6 364.0 Property Tax Collection Performance 72% 76% 79% 82% 86% 86% 87% 85% 85% 85% Property Tax Coverage 55% 57% 59% 61% 64% 66% 69% 81% 81% 81%

Annexures

Uttarakhand Urban Development Project
Dehradun City Development Plan (Annex 3) Page 1
Annex 3.1.1: Year-wise Projection of Population up to the Year 2035
Year Assumed
annual growth rate (%)
Projected Population
(‘000)
Projected floating
population
Commuters Total
2001 4.0 448 448
2005 4.0 524 9 24 557
2006 545 10 25 580
2007 567 10 26 603
2008 590 11 27 628
2009 613 11 29 653
2010 3.5 635 14 36 685
2011 657 15 37 709
2012 680 16 39 735
2013 704 16 41 761
2014 728 17 42 787
2015 3.0 750 17 43 810
2016 773 18 45 836
2017 796 19 47 862
2018 820 19 49 888
2019 844 20 51 915
2020 2.5 865 21 53 939
2021 887 22 55 964
2022 909 23 56 988
2023 932 23 58 1013
2024 955 24 60 1039
2025 2.25 977 25 62 1064
2026 999 26 64 1089
2027 1021 26 66 1113
2028 1044 27 68 1139
2029 1068 28 70 1166
2030 2.0 1089 29 72 1190
2031 1111 29 74 1214
2032 1133 30 75 1238
2033 1155 31 77 1263
2034 1179 32 79 1290
2035 1202 33 81 1316
2036 1226 34 83 1343

Uttarakhand Urban Development Project
Dehradun City Development Plan (Annex 3) Page 2
Annex 3.1.2: List of Slum Population in Dehradun
SNo. Slum Population Household
1. Chukhuwala Nayee Basti 800 130 2. Indra Colony, Chukhuwala 5582 1000 3. Luniya Mohalla 300 50 4. Indresh Nagar 1900 250 5. Jatiya Mohalla 1700 220 6. New Khurbura 2900 400 7. New Kanwali 1500 200 8. Chhabeel Bagh 1800 280 9. Amroodwala Basti 300 40 10. Basti near Comet Bulb Factory 1100 205 11. East Patel Nagar 1150 195 12. West Patel Nagar 900 160 13. Race Course (Block A) 1500 260 14. Race Course (Block B) 1800 275 15. Race Course (Block C) 3200 430 16. Balbir Road, Teg Bahadur Road 2000 310 17. Arya Nagar 1550 290 18. Pathriyapeer I 1300 170 19. Pathriyapeer 2I 1830 208 20. Pathriyapeer 3 1200 180 21. Madrasi Colony 2000 240 22. Chandra Nagar, Sati Colony 1800 285 23. Maharshi Balmiki Colony, Chandranagar 1600 190 24. Adhoiwala 1050 140 25. Dandipur 400 60 26. Nalapani Road 1400 190 27. Ghas Mandi (Rajpur) 800 120 28. Beergirwali (Rajpur) 600 80 29. Vijay Colony 1200 170 30. Gandhigram 2818 410 31. Sanjay Nagar Guru Road 2000 320 32. Syyed Mohalla 1200 140 33. Kumhar Mandi 800 115 34. Dangwal Marg 646 90 35. Banjarawala, Lakhiwala 1200 160 36. Muslim Colony, Ritha Mandi 2378 320 37. Chandra Road, Raipur Road 4000 540 38. Rajeev Nagar, Rispana 2500 340 39. Shri Dev Suman Nagar (Ballupur) 2370 320 40. Aheer mandi 1270 215 41. Puran Basti, Indra Road 2650 370 42. Sanjay Colony, Mohini Road 2400 322 43. Gandhi Nagar, Chakrata Road 1200 180 44. Badrinath Colony, Neshvilla Road 1250 150 45. Arya Nagar, DL Road 696 102 46. Chiriya Mandi, DL Road 3700 517 47. Jawahar Colony, Ballupur 1500 160 48. Govind Garh, Rajeev Colony 800 90 49. Braj Lok Colony, Salawala 1700 215 50. Body Guard, Rajpur 2500 308 51. Bhatra Basti, Kanwali Road 2050 225 52. Suman Nagar, Ghas Mandi 350 50 53. Single Mandi 550 70 54. Kishan Nagar 460 62 55. Rispana Nagar 1500 190 56. Chandra Lok, Old Rajpur 400 70 57. Gabber Singh Basti, Kishanpur 250 30 58. Nayi Basti, Kathbangla 400 45 59. Vivek Vihar-I, Jakhan 800 90

Uttarakhand Urban Development Project
Dehradun City Development Plan (Annex 3) Page 3
SNo. Slum Population Household
60. Vivek Vihar-II, Jakhan 400 45 61. Vivek Vihar-III, Jakhan 400 80 62. Suman Nagar, Dharampur 400 40 63. Balliwala Malin Basti 300 31 64. Azad Colony, Govindgarh 2350 290 65. Mela Ram Colony, Sahasradhara Road 1800 270 66. Rishi Nagar, Adhoiwala 2000 290 67. Azad Colony Kabristan Sahasradhara Rd 2200 310 68. Sapera Basti near Haridwar Bypass 500 75 69. Kedarpuram Malin Basti 800 85 70. Brahmpuri, Niranjanpur 3500 495 71. Shastrinagar, Kanwali 4200 580 72. Shanti Vihar, MDDA Colony, Behind Dalanwala 700 107 73. Sapera Basti, Raipur Road 400 60 74. Ambedkar Colony under Sajwan Khere, Raipur
Road 1800 260
75. Rajeev Nagar, Kandoli 2500 310 76. Gandhigram, GMS Road 600 90 77. Chadrashekhar Azad Colony 500 70 78. Sati Colony, Kanwali 900 115 79. New Patel Nagar 3100 370
Total 120850 16917 Source- Document of Dehradun Nagar Nigam/SUDA (2001)
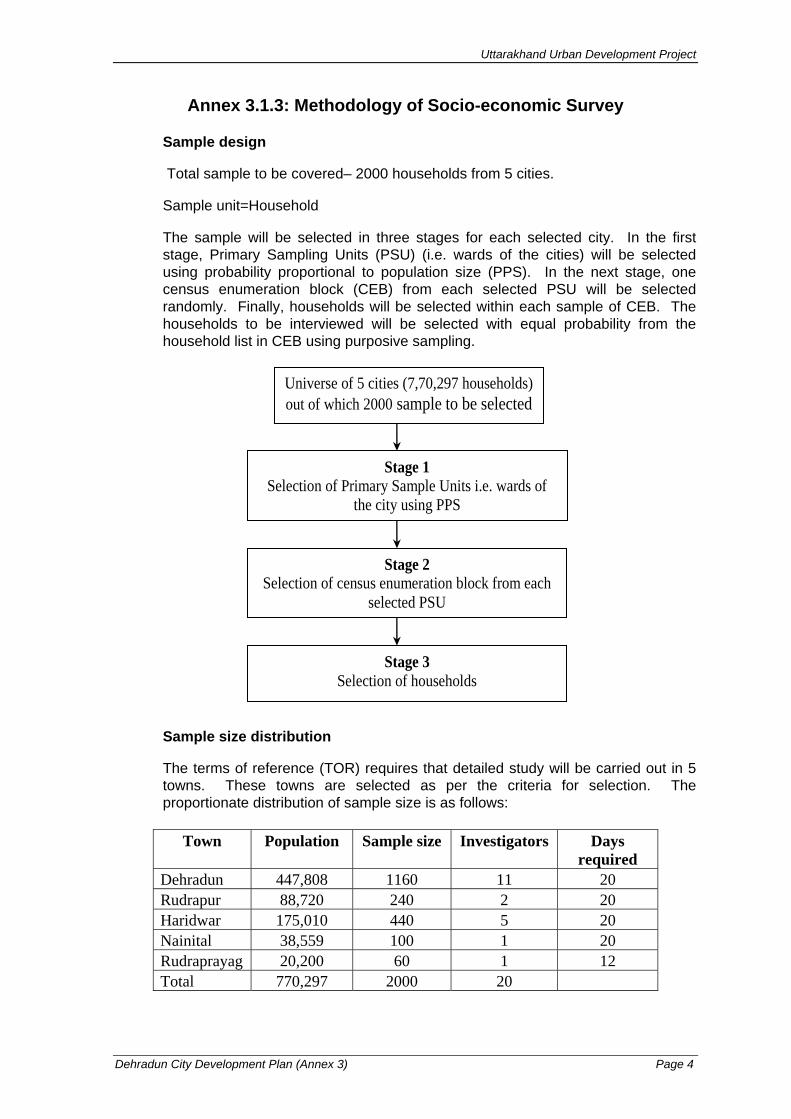
Uttarakhand Urban Development Project
Dehradun City Development Plan (Annex 3) Page 4
Annex 3.1.3: Methodology of Socio-economic Survey Sample design
Total sample to be covered– 2000 households from 5 cities.
Sample unit=Household
The sample will be selected in three stages for each selected city. In the first stage, Primary Sampling Units (PSU) (i.e. wards of the cities) will be selected using probability proportional to population size (PPS). In the next stage, one census enumeration block (CEB) from each selected PSU will be selected randomly. Finally, households will be selected within each sample of CEB. The households to be interviewed will be selected with equal probability from the household list in CEB using purposive sampling.
Sample size distribution
The terms of reference (TOR) requires that detailed study will be carried out in 5 towns. These towns are selected as per the criteria for selection. The proportionate distribution of sample size is as follows:
Town Population Sample size Investigators Days
required Dehradun 447,808 1160 11 20 Rudrapur 88,720 240 2 20 Haridwar 175,010 440 5 20 Nainital 38,559 100 1 20 Rudraprayag 20,200 60 1 12 Total 770,297 2000 20
Universe of 5 cities (7,70,297 households) out of which 2000 sample to be selected
Stage 1 Selection of Primary Sample Units i.e. wards of
the city using PPS
Stage 2 Selection of census enumeration block from each
selected PSU
Stage 3 Selection of households

Uttarakhand Urban Development Project
Dehradun City Development Plan (Annex 3) Page 5
Annex 3.1.4: Questionnaire for Baseline Socio-Economic Survey
Questionnaire No______
A. Background information City__________________ Ward______ Locality_______________ Street______________________ HH No.______ B. Demographic information Religion_________ Caste____________ Duration of stay_________
Occupation Sl.
No. Name Relation with HHH Sex Age Education
Primary Other
Approx income /month Approx expenditure/
month
Monthly savings
Remarks*
1
2
3
4
5
6
7
8
9
10
Note- Please mark the respondent (should be an adult) as "R" in the remarks column * Mention if there is any comment

Uttarakhand Urban Development Project
Dehradun City Development Plan (Annex 3) Page 6
C. HOUSING 1. How long has your family lived in this neighbourhood? __Months 2. If you have moved here in the last 5 years,
where have you moved from? 1. From another part of this city 2. From another city, 3. From a rural area 4. From other country 5. Not Applicable
3. Ownership of plot 1. Freehold Title 2. Lease 3. Patta 4. Joint patta 5. Other legal right 6. No legal right
4. Given better legal right to this land, would you use your own money to improve your house?
1. Yes 2. No
5. Ownership of house 1. Own 2. Rented 3. Others (Specify) 6. If on rent, the rent per month Rs. 7. House type 1. Kutcha 2. Semi pucca 3. Pucca 8. Does any other Family (With separate
kitchen) stay with you in this house? 1. Yes 2. No
9. Do you pay any tax to local body? If Yes, what for how much? Water tax_______ Water charge_______ Property tax______ Other service tax______
Total Rs.______
D. ENVIRONMENTAL SERVICES 10. How important are the following to your quality of life? (rank in order of importance) a. Water Highest 1. b. Sanitation 2. c. Drainage 3. d. Solid waste collection 4. e. Roads, street lighting 5. f. Proximity to public transport Lowest 6. Water 11. What is your primary source of water
supply? 1. House connection 2. Public stand post 3. Neighbour’s house 4.Municipal tanker 5. Private vendor 6. Tube well/Hand pump 7. Dug well 8. Pond/River 9. Others
12. If answer is 1; Do you have a water meter for house connection?
1. Yes 2. No
13. Do you sell piped water to others, e.g. neighbors?
1. Yes 2. No
14. If yes, how much per day? _________ 15. How many persons outside your household
use water through your connection? 1. One 2. 2-4 3. 5-9 4. 10+
16. If no house connection how much do you pay for water per month for purchasing water? 17. If water fetched from outside source; total
time spent by family members for collecting water per day?
1. <30 mins 2. 30-45 mins 3. 46-60 mins 4. 1+ hours
18. Average distance covered for collecting water per day
1. <50 mtrs 2. 51-100 mtrs 3. 100-150 mtrs 4. 151+ mtrs
19. Quality of water 1. Good 2. Medium 3. Poor 20. How do you judge this? 21. How is the water treated before use? 1. None 2. Boil 3. Filter 4. Others (Specify) 22. Hours of water supply through piped system
per day Morning______ Afternoon/Evening______ Total
hours 23. Who fills water? 1. Adult male 2. Adult female 3. Boy 4. Girl 24. If services available are you interested in
new connection 1. Yes 2. No
Sanitation

Uttarakhand Urban Development Project
Dehradun City Development Plan (Annex 3) Page 7
Men Women
25. Where do your family members go for defecation?
1. Latrine in this house 2. Neighbour’s latrine 3. Public toilet 4. Pay and use toilet 5. Open defecation Children
26. Why do they go to other place? 27. How the facility is maintained? 28. Who cleans it? 29. How often? 1. Daily 2. 2-3 times/week 3. Weekly
4. Longer than a week 5. Never
30. If you have a latrine in the house, type of it? 1. Pour flush 2. Twin pit latrine 3. Dry/ bucket latrine 4. Not Applicable
31. Is there any sewer? 1. Yes 2. No 32. Where does it discharge? 1. Sewer 2. Drain 3. River
4. Open land 5. Septic tank/soak pit
33. Are you satisfied with the facility? 1. Yes 2. No 34. If not, why? 35. Do you plan for something else? 1. Yes 2. No 36. Is there enough water for the latrine? 1. Yes 2. No 37. What is the source of that water 1. Tap 2. Hand pump 3. River/pond 38. How do you clean your hands after
defecation? 1. With mud 2. With water 3. With soap 4 Others (Specify)
39. If going out for defecation do you wear footwear?
1. Yes 2. No
Drainage 40. Do the locality has a rain water drainage? 1. Yes 2. No 41. Nature of drain a) 1. Pucca 2. Kutcha
b) 3. Covered 4. Open c) 5. Flowing 6. Clogged
a) b) c)
42. Does your neighbourhood suffer from water logging/flooding problems?
1. Yes 2. No.
43. If Yes, How many times a year? 1. <5 times a year 2. 5-10 times a year 3. 10+ times a year
44. If yes, for how long does it stay flooded? 1. <1 week in a year 2. 1week-1 month in a year 3. 1-3 months a year 4. 3+ months a year
45. If yes, do you suffer from damage to your home or loss of income as a result of flooding?
1. No 2. <5 times a year 3. 5-10 times a year 4. 10+ times a year
46. On average, what is the cost of the damage each time?
1. No cost 2. <Rs 500 3. Rs 500-1000 4. Rs 1000-5000 5. Rs 5000+
Solid Waste 47. How does your household dispose of solid
waste? 1. In private bin for house collection 2. In community bin 3. Burn 4. Throw outside on street or open area
48. Who disposes waste? 1. Adult male 2. Adult female 3. Boy 4. Girl
49. What is the approximate quantity/day? In gm 50. Is it segregated? 1. Yes 2. No 51. Who segregates? 1. Male 2. Female 52. If you put waste in either private or
community dustbin, how often is it collected?
1. Daily 2. 2-3 times/week 3. Weekly 4. Longer than a week 5. Never
53. Who collects garbage from collection point 1. Municipality 2. Private party 54. Is open burning in practice 1. Yes 2. No 55. Who burns? 1. Residents 2. Municipality

Uttarakhand Urban Development Project
Dehradun City Development Plan (Annex 3) Page 8
56. Do the streets get swept? 1. Yes 2. No 3. Don’t know 57. Is the road drain outside your house swept
clean regularly? 1. Yes 2. No 3. Don’t know 4. No Drains
58. Who sweeps? 1. Municipality 2. Private party 3. Residents 59. How frequently? 1. Daily 2. 2-3 times/week 3. Weekly
4. Longer than a week 5. Never
60. Do you pay any amount for garbage collection/sweeping
1. Yes 2. No
61. How much? 1. <Rs.10 2. Rs.10-20 3. Rs.20+ 62. What do you do with news paper, plastic,
glass, bottles, etc. 1. Sell 2. Reuse 3. Dispose openly
Electricity 63. Do you have an electric connection in your house? 1. Yes 2. No 64. Is there any electric meter in your house? 1. Yes 2. No Fuel 65. What do you use as fuel in kitchen? 1. Gas 2. Kerosene 3. Wood 4. Others Roads, Street Lighting & Access to Public Transport 66. Is the road in front of your house paved? 1. Yes 2. No 67. Condition of the road 1. Kutcha 2. Metalled 3. Painted 68. Do you have a street-light in your street? 1. No 2. Yes, within 50 m
3. More than 50m away
69. Is it functional? 1. Yes 2. No 70. Do you pay for it? 1. Yes 2. No 71. How far do you have to go to get public transport? 1. <100m 2. 100m to 1km
3. 1+ km
F. HEALTH 72. Has any household member suffered from
diarrhoea in the last six month? 1. Yes 2. No
73. Has any household member suffered from acute respiratory infection in the last six months?
1. Yes 2. No
74. 44. How many days of work were lost because of these illnesses in the last month?
1. None 2. Less than 5 days 3. 5-10 days 4. 10-20 days 5. More than 20 days
75. Has there been any death in the family in the last year?
1. Yes, child under 5 2. Yes, other 3. No
76. Probable cause of death 77. What is the average cost of treatment for the family
per month? 1. Nothing 2. Less than Rs 50 3. Rs 50-100 4. Rs 100-200 5. Rs 200 +
H. SOCIAL CAPITAL 78. Does any family member of the household have a
membership of any local groups? 1. Yes 2. No
79. Does any member of the household have a membership of Residents’ or Community Welfare Association?
1. Yes 2. No
80. Do you have a ration card? 1. Yes 2. No J. PERCEPTIONS & PRIORITIES 81. How do you rate the provision of services by the Government/Corporation in your area for: a) Water 1. Excellent 2. Good 3. Average 4. Fair 5. Bad b) Sanitation 1. Excellent 2. Good 3. Average 4. Fair 5. Bad c) Drainage 1. Excellent 2. Good 3. Average 4. Fair 5. Bad d) Solid Waste Collection 1. Excellent 2. Good 3. Average 4. Fair 5. Bad e) Roads & Street Lighting 1. Excellent 2. Good 3. Average 4. Fair 5. Bad f) Access to public transport 1. Excellent 2. Good 3. Average 4. Fair 5. Bad 82. How would you rate their overall
performance? 1. Excellent 2. Good 3. Average 4. Fair 5. Bad
83. Which do you think are the 3 most important services to improve?
1. Water 2. Sanitation 3. Drainage 4. Solid Waste Collection 5. Street Cleaning 6. Roads & Street Lighting 7. Public transport 8. Other? Please specify
Willingness to Pay
84. Would you be willing to pay more for a better quality of service for? * a) Water supply 1. Yes 2. No 3. Don’t know If yes, how much? b) New water connection 1. Yes 2. No 3. Don’t know If yes, how much?

Uttarakhand Urban Development Project
Dehradun City Development Plan (Annex 3) Page 9
b) Sanitation 1. Yes 2. No 3. Don’t know If yes, how much? c) Drainage 1. Yes 2. No 3. Don’t know If yes, how much? d) Solid Waste Collection 1. Yes 2. No 3. Don’t know If yes, how much? e) Roads & Street Lighting 1. Yes 2. No 3. Don’t know If yes, how much?
*Slabs for willingness to pay (1) <200 /month (5) <500 /month (2) <250 /month (6) <750 /month (3) <300 /month (6) >750 /month (4) <350 /month General Observation: Approach road- Streets/paths- Drains- Stand post- ∗ Post ∗ Platform ∗ Tap ∗ Cleanliness Cleanliness of locality Street lights 85. Possession:
∗ Television- Colour, B/W
∗ Air conditioner
∗ Air cooler
∗ Refrigerator
∗ Telephone
∗ Mobile
∗ Bicycle
∗ Motorbike
∗ Car
∗ Other assets

Uttarakhand Urban Development Project
Dehradun City Development Plan (Annex 3) Page 10
Annex 3.3.1: Deviations in Land Uses in the Master Plan
Land Use Changed to (in ha.) Land Use Changed
from Residential Commercial Industrial Park/ Green Areas
Agri Forest Traffic / Transport
Community Facilities
Undefined Total
Residential 126 125.53 4.58 334.64 590.75 (26.73%)
Commercial 21.89 0.90 16.89 39.68 (1.79%)
Industrial 116.61 168 20.50 15.36 12.64 333.11 (15.08%)
Community Facilities 8.50 8.50 (0.38%)
Institutions 37.74 37.74 (1.72%)
Parks & Recreation 6.00 8.00 24.00 38.00 (1.72%)
Transport 5..50 3.00 8.50 (0.38%)
Gardens / Orchards 41.50 9.00 4.00 54.48 108.98 (4.93%)
Agricultural 740.50 29.66 8.52 4.60 40.57 36.50 860.35 (38.93%)
Undefined 22.24 22.24 (1.01%)
Sewage Farm 19.60 19.60 (0.89%)
Forest 43.50 43.50 (1.97%)
Green Belt / Nalas 93.48 5.35 98.83 (4.47%)
Total 1157.06 (52.36%)
139.35 (6.31%)
165.09 (7.47%)
11.52 (0.52%)
355.14 (16.07%)
19.36 (0.88%)
21.49 (0.97%)
77.21 (3.49%)
90.98 (4.12%)
2209.78 (100%)
Source: Dehradun Master Plan 2025 (Draft)
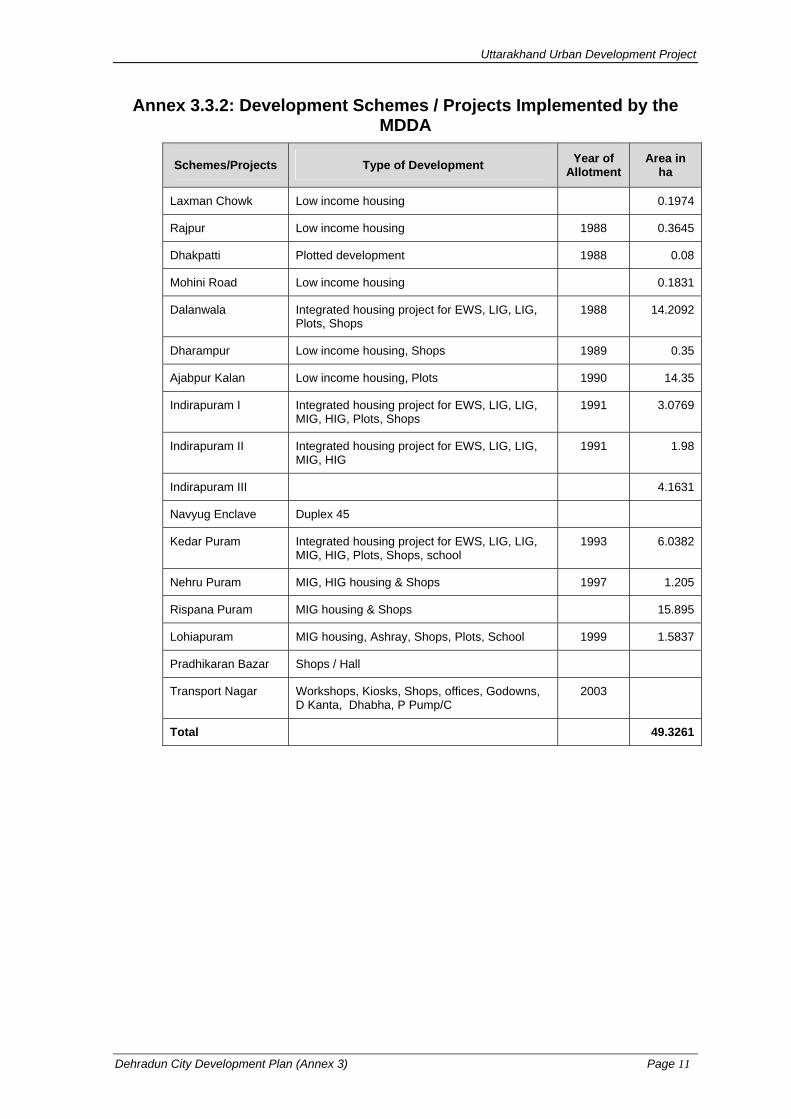
Uttarakhand Urban Development Project
Dehradun City Development Plan (Annex 3) Page 11
Annex 3.3.2: Development Schemes / Projects Implemented by the MDDA
Schemes/Projects Type of Development Year of Allotment
Area in ha
Laxman Chowk Low income housing 0.1974
Rajpur Low income housing 1988 0.3645
Dhakpatti Plotted development 1988 0.08
Mohini Road Low income housing 0.1831
Dalanwala Integrated housing project for EWS, LIG, LIG, Plots, Shops
1988 14.2092
Dharampur Low income housing, Shops 1989 0.35
Ajabpur Kalan Low income housing, Plots 1990 14.35
Indirapuram I Integrated housing project for EWS, LIG, LIG, MIG, HIG, Plots, Shops
1991 3.0769
Indirapuram II Integrated housing project for EWS, LIG, LIG, MIG, HIG
1991 1.98
Indirapuram III 4.1631
Navyug Enclave Duplex 45
Kedar Puram Integrated housing project for EWS, LIG, LIG, MIG, HIG, Plots, Shops, school
1993 6.0382
Nehru Puram MIG, HIG housing & Shops 1997 1.205
Rispana Puram MIG housing & Shops 15.895
Lohiapuram MIG housing, Ashray, Shops, Plots, School 1999 1.5837
Pradhikaran Bazar Shops / Hall
Transport Nagar Workshops, Kiosks, Shops, offices, Godowns, D Kanta, Dhabha, P Pump/C
2003
Total 49.3261

Uttarakhand Urban Development Project
Dehradun City Development Plan (Annex 3) Page 12
Annex 3.4.1.: Details Of Existing Sewerage Facilities And Proposed Sewage System And Sewage Treatment Plants
Table I: Existing Sewerage Facilities for different zones
Zone Zones Population Sewage
Generated Sewerage Coverage
Sewage at Outfall
Sewage in Soak Pits
UPJN p.e MLD % MLD MLD
A1-A9 204065.0 22.0 100.0 22.0 0.0
D 30090.0 3.2 0.0 0.0 3.2
E1-E2 33114.0 3.6 0.0 0.0 3.6
F1 10644.0 1.1 100.0 1.1 0.0
I Kargi
I 50570.0 5.5 40.0 2.2 3.3
Sub Total 328483.0 35.5 25.4 10.1
B 44221.0 4.8 100.0 4.8 0.0
C 56518.0 6.1 0.0 0.0 6.1
L 19427.0 2.1 0.0 0.0 2.1
II Daudwala
M 29388.0 3.2 0.0 0.0 3.2
Sub Total 149554.0 16.2 4.8 11.4
H 20946.0 2.3 0.0 0.0 2.3
A10 14545.0 1.6 0.0 0.0 1.6 III
Indira Nagar E3 7666.0 0.8 0.0 0.0 0.8
Sub Total 43157.0 4.7 0.0 4.7
IV Vijay Colony F2 6608.0 0.7 0.0 0.0 0.7
V Salawala A4 18481.0 2.0 0.0 0.0 2.0
VI Doon Vihar G 14623.0 1.58 50.0 0.8 0.8
J 3866.0 0.4 0.0 0.0 0.4 Others K 15228.0 1.6 70.0 1.2 0.5
Sub Total 19094.0 2.1 1.2 0.9
GRAND TOTAL 580000.0 62.6 32.1 30.6

Uttarakhand Urban Development Project
Dehradun City Development Plan (Annex 3) Page 13
Table II. Proposed Sewerage and Sewage Treatment Facilities
Zones Population Sewage
GeneratedSewerage Coverage
Sewage at
Outfall
On Site Sewage
New Sewer Lines
Cost New
Sewer
STP Req.
STPCost
STP Land Zone
UPJN p.e MLD % MLD MLD Km Lacs MLD Lacs Lacs
A1-A9 312901.0 33.8 100.0 33.8 0.0
D 46182.0 5.0 60.0 3.0 2.0 18.6 800
E1-E2 54983.0 5.9 100.0 5.9 0.0 46.0 1974.6
F1 21793.0 2.4 100.0 2.4 0.0
I Kargi
I 93617.0 10.1 100.0 10.1 0.0 120.9 7512
Sub Total I 529476.0 57.2 55.2 2.0 56 3360 0
B 69643.0 7.5 100.0 7.5 0.0
C 94387.0 10.2 100.0 10.2 0.0 23.9 1033.4
L 37674.0 4.1 100.0 4.1 0.0 55.2 4476.3
II Daudwala
M 55757.0 6.0 100.0 6.0 0.0 52.4 2297.6
Sub Total II 257461.0 27.8 27.8 0.0 28 16801000
(8.4 Ha)
H 39435.0 4.3 100.0 4.3 0.0 44.0 2748.6
A10 21752.0 2.3 100.0 2.3 0.0 III
Indira Nagar E3 13219.0 1.4 100.0 1.4 0.0
Sub Total III 74406.0 8.0 8.0 0.0 8 480200
(2.4 Ha)
IV Vijay Colony F2 10396.0 1.1 100.0 1.1 0.0 1 100 0
V Salawala A4 29823.0 3.2 100.0 3.2 0.0 2.3 100.0 3.0 300
200.0 (0.5 Ha)
VI Doon Vihar G 28075.0 3.03 50.0 1.5 1.5 1.5 150
J 7477.0 0.8 0.0 0.0 0.8 Others K 26941.0 2.9 70.0 2.0 0.9
Sub Total 34418.0 3.7 2.0 1.7
GRAND TOTAL 964055.0 104.1 98.9 5.2 363.3 20942.6 6070 1400

Uttarakhand Urban Development Project
Dehradun City Development Plan (Annex 3) Page 14
Fig. 1. Location and Site for proposed Kargi STP
Fig. 2. Location and Site for proposed Daudwala STP
Fig.. 3. Location & site of proposed Indira Nagar STP
ST

Uttarakhand Urban Development Project
Dehradun City Development Plan (Annex 3) Page 15
Fig. 4 STP site and Salawala Area
Fig. 5. STP Area and Site for Vijay Colony
Fig. 6. STP Area and site for DoonVihar STP
ST
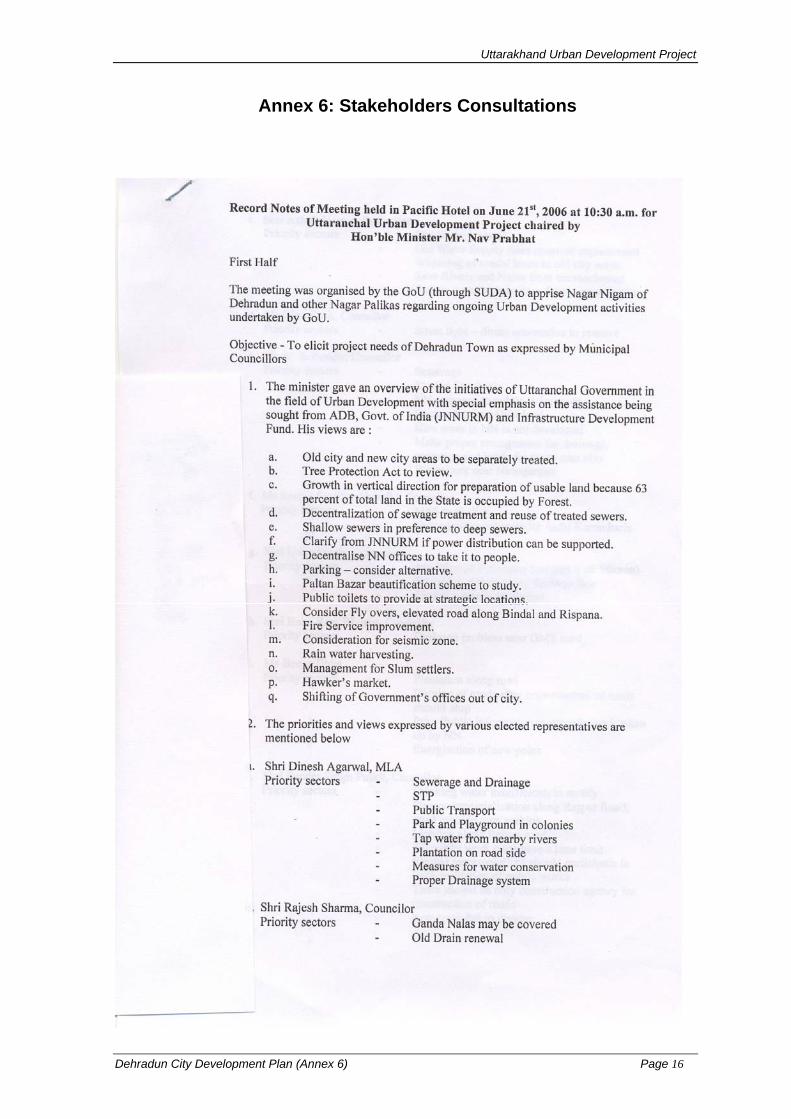
Uttarakhand Urban Development Project
Dehradun City Development Plan (Annex 6) Page 16
Annex 6: Stakeholders Consultations

Uttarakhand Urban Development Project
Dehradun City Development Plan (Annex 6) Page 17

Uttarakhand Urban Development Project
Dehradun City Development Plan (Annex 6) Page 18

Uttarakhand Urban Development Project
Dehradun City Development Plan (Annex 6) Page 19

Uttarakhand Urban Development Project
Dehradun City Development Plan (Annex 6) Page 20
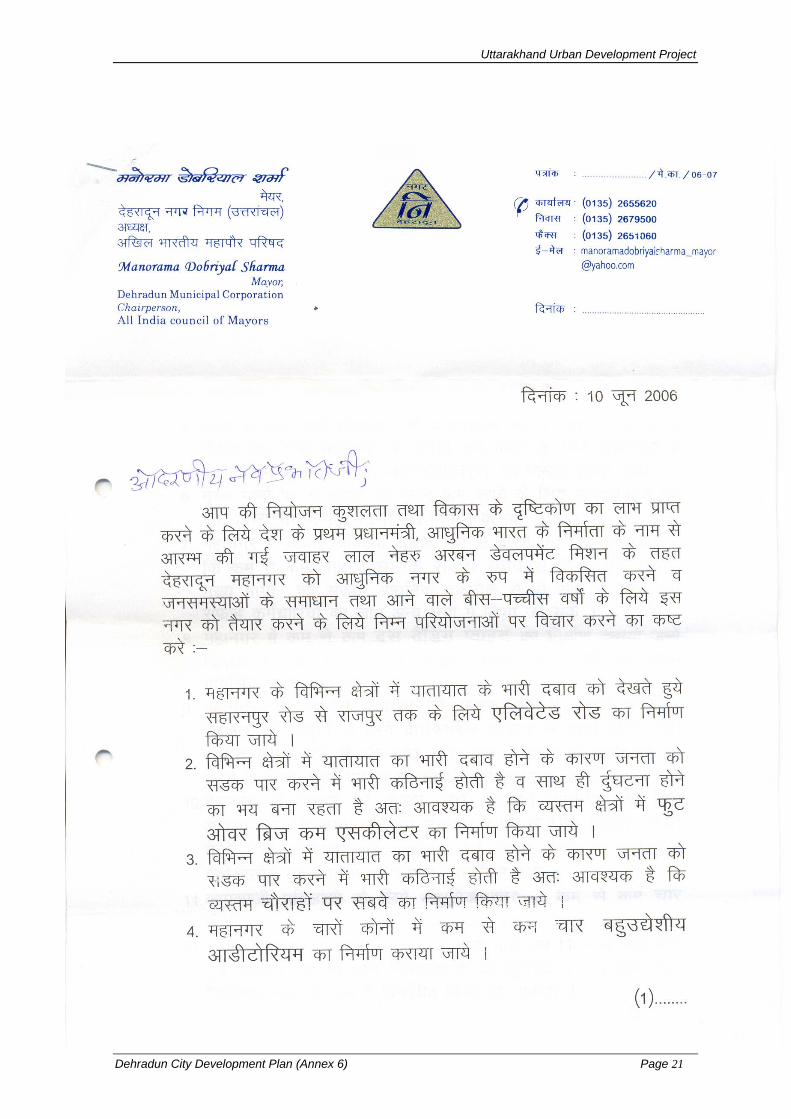
Uttarakhand Urban Development Project
Dehradun City Development Plan (Annex 6) Page 21

Uttarakhand Urban Development Project
Dehradun City Development Plan (Annex 6) Page 22

Uttarakhand Urban Development Project
Dehradun City Development Plan (Annex 6) Page 23
Uttarakhand Urban Development Project
Dehradun City Development Plan (Annex 6) Page 24

Uttarakhand Urban Development Project
Dehradun City Development Plan (Annex 6) Page 25

Uttarakhand Urban Development Project
Dehradun City Development Plan (Annex 6) Page 26

Uttarakhand Urban Development Project
Dehradun City Development Plan (Annex 6) Page 27
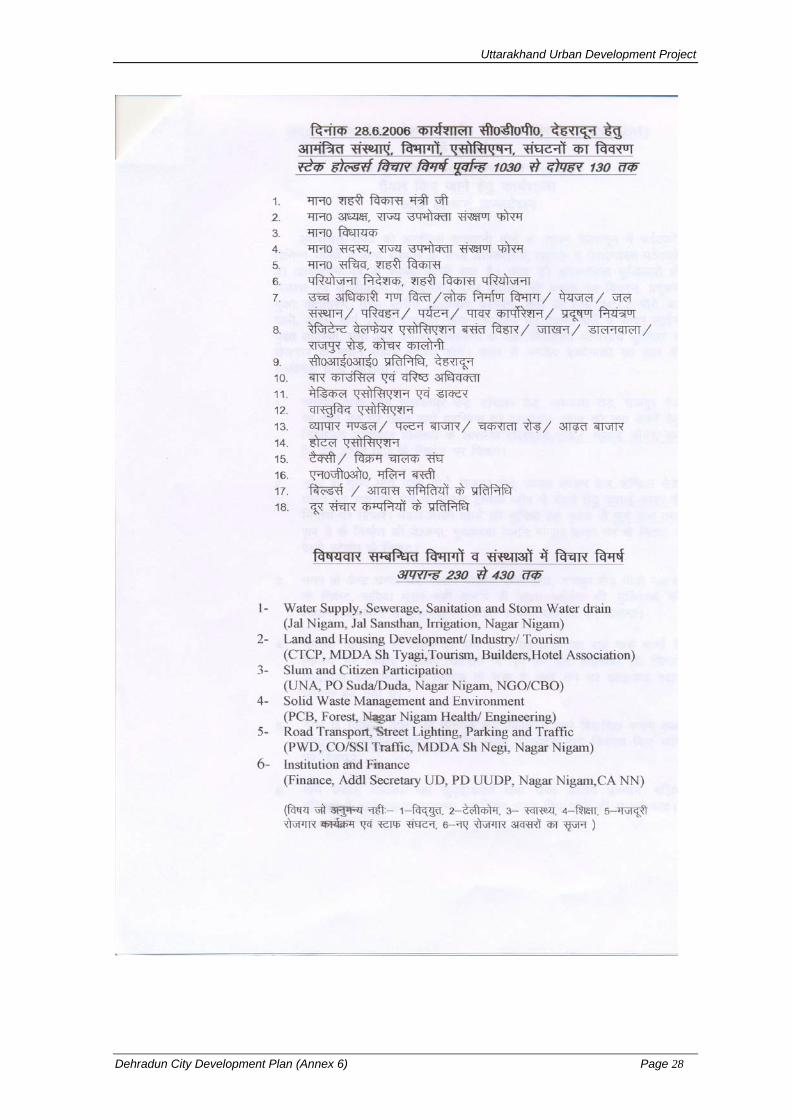
Uttarakhand Urban Development Project
Dehradun City Development Plan (Annex 6) Page 28

Uttarakhand Urban Development Project
Dehradun City Development Plan (Annex 6) Page 29

Uttarakhand Urban Development Project
Dehradun City Development Plan (Annex 6) Page 30
Stakeholders Vision Meeting – 28th June “Vision is a statement of where the city wishes to go, within a given time
frame and is often explained in terms of clear expectations.”
Group1: Water Supply, Sewerage, Sanitation & Storm
water Drainage Municipal Engg, UPJN, UJS, Sulabh International, GPB
Group 4: Solid Waste Management / Environment-
Health Officer, Sanitary Inspector, DFO, GPB, UPCB
Group 6: Institutions/Finance District Collector Vice Chairperson - DA Chairperson, Councillors, EO, Accounts Officer –Municipality
Group 3: Slums and Citizens Participation
Councillors, NGOs, CBOs, citizens
Group 5: Urban Transport and Street lighting
PWD, Municipal Engg, Traffic Police, Power Corporation
Group 2: Land & Housing, Industry, Tourism)
TCPD, UDA/SADA , SIDCUL, CII, Trade Associations, BHEL, Hotel Association, Rep from Ashrams, Ganga Sabha, Tourism deptt, Pvt Developers
Sector Vision and
Goals
Morning Session
Afternoon Session
CITY VISION Where the City wishes to go?
Minister, MLA, Chairperson, EO, DM, VC-MDDA/HDA, Other key decision makers
DEHRADUN 2025 - THE VISION “A WELL-MANAGED, CLEAN, GREEN, ENVIRONMENT-FRIENDLY CITY WITH A CHARACTER OF ITS OWN DEFINED BY SCENIC BEAUTY, INTELLECTUAL
CAPITAL, ECO-FRIENDLY TOURISM THROUGH SUSTAINED ECONOMIC GROWTH FOR ALL OF ITS CITIZENS”

Uttarakhand Urban Development Project
Dehradun City Development Plan (Annex 6) Page 31
Format of Questionnaire -Citizens Perception 1. How do you want to see your locality and city in the next 25 years?
2. What do you think should be done for achieving this? 3. If you think peoples participation is necessary then please tick your choice(s).
Planning for improvement of
your area
Supervision of Construction
works
Maintenance of Services (eg. Water Supply, etc)
Evaluation of Projects with
respect to quality, time, etc
Financial Contribution from you towards improvement works
4. Do you think the citizens’ are willing to pay more for better municipal services? (YES or NO)
5. What could be the constraints of citizens’ participation?
6. What are your expectations from the municipality?
7. We request citizens to give score from 1 to 9 in order of priority (1-most important, 9-least
important…….)
S.No. City Infrastructure and Development Areas
Priority Rating
Concerns/Remarks
1. Water Supply 2. Sewerage and Sanitation 3. Solid Waste Management 4. Storm Water Drainage 5. Road 6. Public Transport (Bus, Vikram, Three
wheeler, cycle Rickshaw, any other)
7. Street lighting 8. Traffic Management 9. Parking
Name: Name of the Locality:

Uttarakhand Urban Development Project
Dehradun City Development Plan (Annex 6) Page 32
STAKEHOLDERS’ CONSULTATION - INDIVIDUAL SECTOR-WISE Institutional and Finance Work Group – Summary of Discussions Participants:
1. Ms. Aparna Pandey, Programme Co-ordinator, Himalayan Action Research Centre, Dehradun
2. Mr. D.C.Lohani, Chief Accounts Officer, MDDA and Auditor, Dehradun Nagar Nigan 3. Mr. Subrata Biswas, Vice Chairman, MDDA 4. Mr. Indu Dhar, Mukhya Nagar Adhikary, Dehradun Nagar Nigam 5. Mr. P. Krishnan, Financial Analyst, UUDP (TA) 6. Mr. T.K.Banerjee, Economist, UUDP (TA)
Finance Double entry system of accounting:
• The process of introducing the system has been initiated; • Will be introduced in all of the 63 ULBs, and all parastatal agencies; • Guidelines for arriving at opening balance have been issued; • Short listing of chartered accountants being finalized for hand holding and
training of accounts staff • Electronic software for accounting is now being developed • Time frame for introduction of double entry system
• Piloting in Dehradun Nagar Nigam - 2006-07 • Introduction of the system in 25 ULBs
and all parastatal organizations - 2007-08 • Introduction of the system in all ULBs - 2008-09
Property tax: • Rate percentage should be reduced • Tax base to be widened • Tax compliances to be enhanced • Ratio of non-tax and tax revenue should be reduced • The growth in collection of tax revenue should match the growth of SDP • The percentage collection of property tax to reach 85% by 2009-10
Institutional
• E- governance is in the process of introduction • GIS based planning to be done • Registration of birth and death to be enforced • Profession licensing to be introduced • 74th CAA
The ULBs do not have the capacity to carry out whatever power already given to them. As they build up their capacity to perform, more functions may be delegated to them
A regional planning and development authority should be in place with adequate representation of the ULBs
The Peyjal Nigam may be corporatized with equity participation of the ULBs

Uttarakhand Urban Development Project
Dehradun City Development Plan (Annex 6) Page 33
• Water supply There may be a separate agency established on public-private
partnership basis or community based organization (CBO) for distribution of water and collection of water tax and charge. O%M of water supply system may be out sourced on contract basis. The ULBs may act as regulatory authorities.
• SWM Encourage resident welfare committees, mohalla swachhata samitiees,
CBOs and joint ventures to pick up performance linked contracts for collection and disposal of garbage
• Power bills of ULBs Electronic meters should be installed The Power Corporation should levy a cess of 2% on all bills to cover
the power bills of the ULBs • Poverty
In the municipal board, there should be at least one representative from the poor community
All urban poverty programmes should be implemented by the ULBs The SUDA should provide assistance to the ULBs on hand-holding
basis and facilitate their capacity building process The CO should manage the schemes addressed to the poor Contracts for implementing schemes for the poor should be routed
through CDS Poverty alleviation schemes should be formulated, implemented and
maintained by the poor themselves.
• There is need for scientifically addressing the institutional issues to develop efficient organizations
• What is known as citizens’ charter is the commitments of an institution to
provide or deliver services and a basis of redressal of grievances.

Uttarakhand Urban Development Project
Dehradun City Development Plan (Annex 6) Page 34
Solid Waste Management and Environment Work Group Summary of Discussions
Solid Waste Management and Environment: Data Sheet for Health Officer, Dehradun Municipal Corporation
Phasing of Recommendations Key Areas Problems/Key Issues Short term (5 yrs)
Medium term (10 yrs)
Long term (15-20 yrs)
Collection and Storage
No segregation Indiscriminate throwing Inadequate primary collection Insufficient storage facility
100 percent 100 percent 100 percent
Ongoing Ongoing Ongoing
Going Going Going
Transportation
Augmentation of transportation 100 percent Ongoing Going
Processing and Disposal
1. Availability of Land 2. Existing – improvement as per
rules 3. Proposed – Processing of MSW by
approved technology
100 percent 100 percent 100 percent
- - -
- - -
Organisational Issues (staff, infrastructure, etc)
Lack of staff Training and capacity building
To be supplemented by public/ private participation 100 percent
Ongoing process Ongoing process

Uttarakhand Urban Development Project
Dehradun City Development Plan (Annex 6) Page 35
Phasing of Recommendations Key Areas Problems/Key Issues Short term (5 yrs)
Medium term (10 yrs)
Long term (15-20 yrs)
Decentralized office 100 percent
Health and Hygiene (perception based on present water and sanitation facilities)
Tools and Protective implements 100 percent (regular requirement)
100 percent (regular requirement)
100 percent (regular requirement)
Public Participation (at any SWM stage)
Collection and Segregation 100 percent Ongoing process Ongoing process
Private Participation (at any SWM stage)
Collection, Transportation and Processing 50 percent 30 percent 20 percent

Uttarakhand Urban Development Project
Dehradun City Development Plan (Annex 6) Page 36
Traffic Work Group Summary of Discussions
Traffic: Data Sheet for Traffic Police Department
Key Areas Issues and Suggestions
Traffic Junctions, Traffic Signals
1. 25, simple junction
2. 75, T and Y junction
3. 1, Multi junction
4. 3, Rotary
Traffic lights has been used at 22 Four arm/ Three arm junction. It should be used at other Four arm/ Three arm junctions.
Traffic Flow
Traffic flow is slow due to narrow roads.
1. Make flyovers
2. Bridges
3. Sub-ways
4. Parking facility
Measures for Traffic Management
1. Enforcement
2. Traffic education and Traffic
Will be up by mass transportation
Occurrence of road accidents and reasons
1. The manufacturers and curve of roads not good
2. there are not proper sign boards
3. Due to threat proper challans of drivers
Cause of Accidents
1. Drunken drive
2. Over speeding
3. Rescue by drive
4. Wrong over taking
5. Over loading
Note: Please use additional sheet wherever required Name: Mr. Thakur Singh Rawat Designation, Department & Contact Number: C O T, Dehradun Signature: ____________________
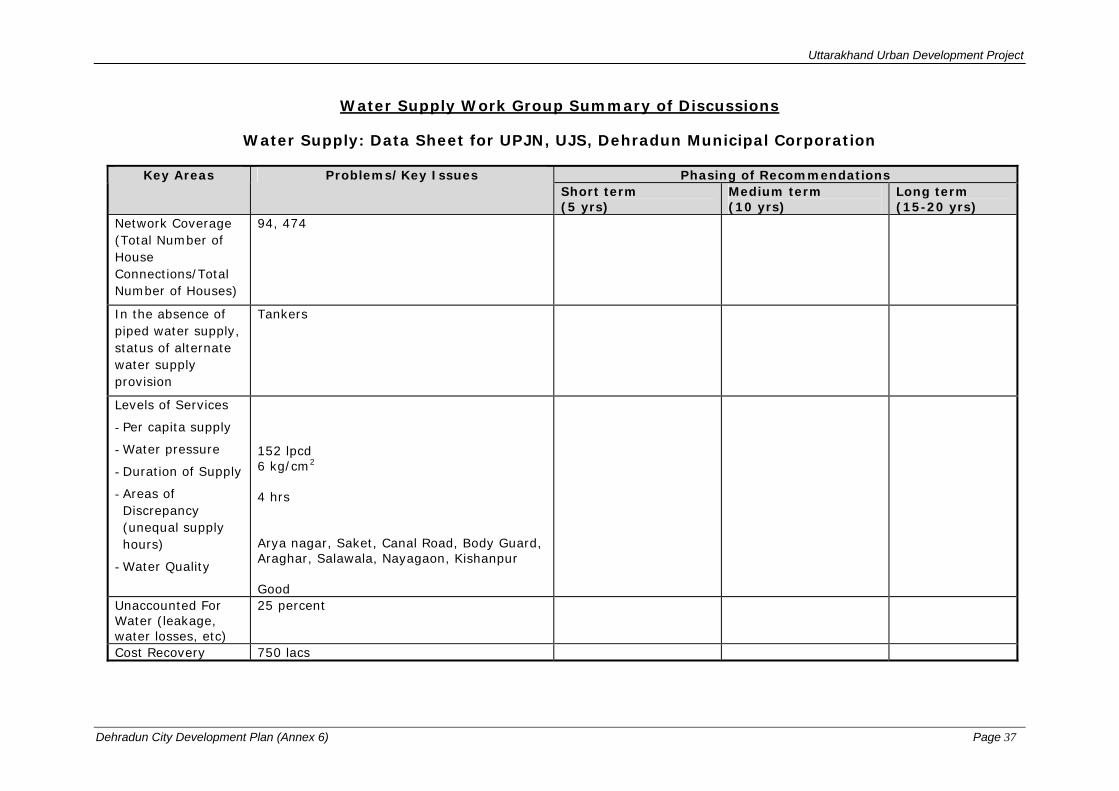
Uttarakhand Urban Development Project
Dehradun City Development Plan (Annex 6) Page 37
Water Supply Work Group Summary of Discussions
Water Supply: Data Sheet for UPJN, UJS, Dehradun Municipal Corporation
Phasing of Recommendations Key Areas Problems/Key Issues Short term (5 yrs)
Medium term (10 yrs)
Long term (15-20 yrs)
Network Coverage (Total Number of House Connections/Total Number of Houses)
94, 474
In the absence of piped water supply, status of alternate water supply provision
Tankers
Levels of Services
- Per capita supply
- Water pressure
- Duration of Supply
- Areas of Discrepancy (unequal supply hours)
- Water Quality
152 lpcd 6 kg/cm2
4 hrs Arya nagar, Saket, Canal Road, Body Guard, Araghar, Salawala, Nayagaon, Kishanpur Good
Unaccounted For Water (leakage, water losses, etc)
25 percent
Cost Recovery 750 lacs

Uttarakhand Urban Development Project
Dehradun City Development Plan (Annex 6) Page 38
Phasing of Recommendations Key Areas Problems/Key Issues Short term (5 yrs)
Medium term (10 yrs)
Long term (15-20 yrs)
O&M (Revenues, Maps and Information Systems)
Any other concerns or suggestions
For long term planning, continuation of dam on Song river is proposed which will provide 250 mld of water
Rain water harvesting should be done. MDDA should make it mandatory in house connection

Uttarakhand Urban Development Project
Dehradun City Development Plan (Annex 6) Page 39
Sewerage Work Group Summary of Discussions
Sewerage: Data Sheet for UPJN, UJS
Phasing of Recommendations Key Areas Problems/Key Issues Short term (5 yrs)
Medium term (10 yrs)
Long term (15-20 yrs)
Network coverage and O&M
20 percent of sewer line
Coverage of Septic Tanks and its O&M
80 percent
Sewage treatment and disposal
Sulllage farm i. Bhandari Bagh ii. Ajabpur, Mothrawala
i. Sewer treatment plants are needed ii. Recycling of sewerage is also needed
Cost r 250 lacs Adequacy of Public Toilets and its O&M
Sulabh Toilets are there. More of such toilets are required
By-products of Sewage Treatment– fertiliser/gas
Any other concerns or suggestions
Note: Please use additional sheet wherever required.

Uttarakhand Urban Development Project
Dehradun City Development Plan (Annex 6) Page 40
Planning and Urban Renewal Work Group Summary of Discussions
List of Participants
1) Dr. A.P.Ganguly, Director, Vedantic Research Centre (VRS); 2) Brigadier K.G.Behl, President, All India Consumers’ Council; 3) Mr. Vivek Singh Chauhan, District Tourism Officer, Dehradun; 4) Dr. Mahesh Bhandari, Educationist, Gen Secy Dalanwala Welfare Society; 5) Mr. Brij Ratan, Chief Town Planner, Uttarakhand Town & Country Panning Dept., Dehradun; 6) Ms. Archana Sharma Hinduja, Urban Planner, UUDP TA Consultants; 7) Ms. Urvi Mankad, Urban Planner, UUDP TA Consultants;
Physical Growth - Opportunities and Constraints: Data Sheet for MDDA
Key Areas Brief Description Problems/Key Issues
Suggestions/ Recommendations
Directions of urban growth (including peri urban areas)
Rajpur Road, Haridwar road, Saharanpur road, Chakarata road and Sahastradhara road.
Mainly in ribbon development form.
Haphazard and uncontrolled growth on corridors
Lack of coordination between MDDA and DNN resulting in unplanned growth.
Enforcement and land use controls Planning, Building permission and service provision should
be done by DNN. MDDA shall be made responsible for developmental
activities mainly outside DNN area. Carrying capacity should be keep in mind while giving
building plan permission Zonal / sector plans should be prepared by the
implementing agency Existing municipal law should be amended which shall include planning and building permission functions.
Development between Sahastradhara road and Rajpur road
Potential area for commercial activities as this area is close to Rajpur road. It might create some environmental threats to the
Restricted and controlled development in this area. It has been suggested that institutional and recreational (only eco-friendly) activities shall be encouraged in this area. It is also suggested that Vidhan Sabha and Secretariat shall be shifted in this area. One of the advantage would be easy access to the existing airport.
Proposed stadium at existing Parade Ground
This should be done because it will destroy
It has been suggested that the Stadium should be proposed in Raipur because of the better accessibility

Uttarakhand Urban Development Project
Dehradun City Development Plan (Annex 6) Page 41
Key Areas Brief Description Problems/Key Issues
Suggestions/ Recommendations
important public space of the city and create traffic management problem such as congestion etc..
Development on Mussoorie Road till about 12 km
Haphazard development along Mussoorie road
Construction activities should be banned on this road.
Development on Rajpur Road Uncontrolled fast commercialisation along Rajpur road creating traffic congestion
It has been suggested that there should not be high-rise buildings on the main Rajpur road. Construction of shopping malls and multiplexes shall be discouraged on this road. The areas for this type of development should be identified.
Large Institutional development Chakarata Road
Limited scope for further development.
Unplanned residential development on Haridwar by-pass and Haridwar road. Great potential for further growth in this area. MDDA has proposed large scheme (area 450 ha) of Greater Doon on Haridwar by-pass. MDDA has already acquired 88 ha land in this area.
Unplanned growth without proper services provision. Success of Greater Doon project will depend on acquisition of land.
Encourage planned development in this area by enforcing master plan zoning regulations and land use controls.
Residential development
Scattered development with very low density in city areas
Provision of Services becomes less feasible.
Densification should be addressed through infill development rather than going for high –rise buildings as land is a limited resource and also for optimisation of service coverage.
Constraints for physical growth such as forests, water bodies, agriculture land, cantonment area, etc
Forests cover in almost all directions especially in north and east. Natural drains Cantonment areas in the west
Organised green spaces within and outside city areas should be preserved.
Congested core areas for redevelopment
Paltan bazaar, dispensary road, Gandhi road, Parade ground, Pavillion ground,
Traffic congestion, encroachments, lack of parking places,
Areas should earmarked for conservation, rehabilitation, clearance of encroachments. Near Clock tower parking should be developed on the proposed

Uttarakhand Urban Development Project
Dehradun City Development Plan (Annex 6) Page 42
Key Areas Brief Description Problems/Key Issues
Suggestions/ Recommendations
site for mall. Multi-storeyed parking suggested but basement parking should be developed with necessary consideration of ground water table. Development of Gandhi Park Beautification of paltan bazaar as already proposed by the government. Integrated development of Parade ground area. Encroachment should be cleared around Parade ground and Pavillion ground. Provision should be made for informal sector (hawkers). Fly over required to reduce traffic congestion around Clock tower. Beautification of areas around Clock tower
Relocation of non-conforming land uses
Kabadi market, wholesale market (Arhat bazaar), Milk dairies, workshops on Rajpur road.
Whole market need to be shifted as per the master plan provision. Areas for shifting of diaries to be identified. Kabadi market to be shifted outside city centre.
Environmentally sensitive areas like rivers, other water bodies, green areas, etc including cultural and historical areas
Land Developed by MDDA in last 10-15 years (in Hectares)
Residential Development by MDDA in last 10-15 yrs - Total Area in Hectares - Type (EWS, LIG, MIG and HIG) and
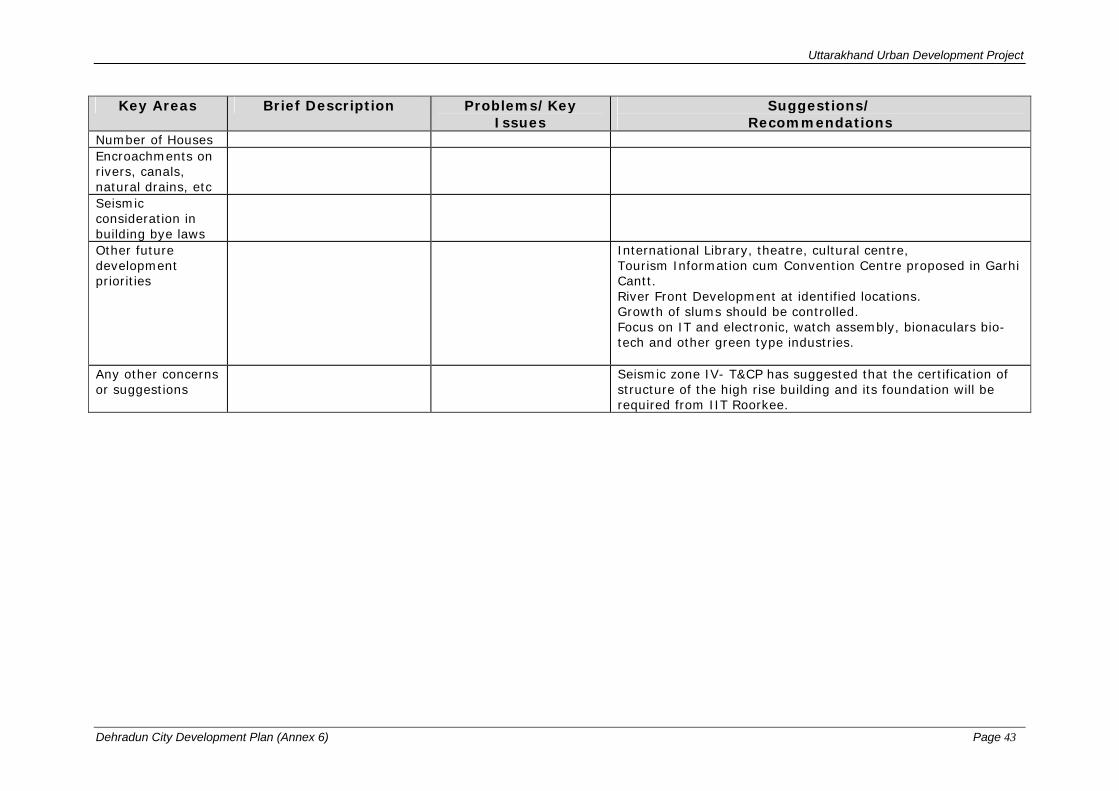
Uttarakhand Urban Development Project
Dehradun City Development Plan (Annex 6) Page 43
Key Areas Brief Description Problems/Key Issues
Suggestions/ Recommendations
Number of Houses Encroachments on rivers, canals, natural drains, etc
Seismic consideration in building bye laws
Other future development priorities
International Library, theatre, cultural centre, Tourism Information cum Convention Centre proposed in Garhi Cantt. River Front Development at identified locations. Growth of slums should be controlled. Focus on IT and electronic, watch assembly, bionaculars bio-tech and other green type industries.
Any other concerns or suggestions
Seismic zone IV- T&CP has suggested that the certification of structure of the high rise building and its foundation will be required from IIT Roorkee.

Uttarakhand Urban Development Project
Dehradun City Development Plan (Annex 6) Page 44
Tourism Development: For Hotel Association Please give your views and suggestions on the following areas of tourism development:
Tourism Development
What is the total capacity of hotel accommodation in Dehradun?
No No of Rooms Beds
No of Hotels 93 1821 3598
Guest Houses 19 196 437
Lodges 09 108 209
Please give the month-wise or seasonal occupancy rate in hotels.
Jan: Feb: Non A/C Rooms Mar: Min. Rs. 100 to Rs. 999/- Max Apr: Jun: A/C Rooms Jul: Min. Rs. 650 to Rs. 5000/- Max Aug: Sept: Oct: Nov: Dec: No fluctuations in tariff
Are you aware of tourism policy?
Yes
What are your expectations from Dehradun Municipal Corporation, MDDA and State Government?
Good cleanliness of city. Particularly around Tourist Places. Proper garbage disposal. Resident friendly Master Plan of MDDA. Develop Public Transport System. Smooth flow of traffic. Built flyovers etc.
Any other suggestions
Develop good Parks with in city. Make city greener. Built adequate public conveyances. Adequate parking place around market areas. Maintenance of old and Heritage buildings. Arrangement of light and sound show in FRI compound.

Uttarakhand Urban Development Project
Dehradun City Development Plan (Annex 6) Page 45
Record notes of the meeting organised to discuss the projects to be included in Dehradun CDP 20th July 2006, Uttarakhand Urban Development Project Office, ISBT
Complex Chairperson: Mr. Nav Prabhat, Minister, Urban Development Department, GoU Participants:
1. Mr. Amarendra Sinha, Secretary, Urban Development Department, GoU 2. Mr. Subrata Biswas, Project Director, UUDP 3. Mr. N K Joshi, Addl. Secretary, Urban Development Department, GoU 4. Mr. H P Uniyal, C G M, Uttarakhand Jal Sansthan 5. Mr. R N Verma, S E (IX), Uttarakhand Pey Jal Nigam 6. Mr. I D Burai, Mukhya Nagar Adhikari, Dehradun Nagar Nigam 7. Mr. S S Jain, Project Manager, GoU 8. Mr. Ravi Pandey, M E, Dehradun Nagar Nigam 9. Mr. C S Upreti, Ex Engineer, PWD 10. Mr. S K Agarwal, Ex Engineer, Uttarakhand Pey Jal Nigam 11. Mr. K K Ratog, A E, Uttarakhand Pey Jal Nigam 12. UUDP TA Consultants
The meeting began with a short presentation by Mr. B. Datta, Team Leader UUDP TA, on the process of preparation of the City Development Plan (CDP) of Dehradun City. This was followed by presentation of the projects identified by the consultants to be included in the CDP. The Team Leader informed the group that the projects have been identified after a series of consultation with the concerned line department and field visits by the sector experts in the team. All the sector projects were discussed in the meeting. The Minister UDD and the senior GoU officials took keen interest and discussed all the projects with the team. The UDD Minister and other senior GoU officials gave their opinion on further modification of the scope and extent of the identified projects and also suggested some new projects. Some of the key comments in each sector are presented in the following section. Population Secretary UDD asked the Team to take the population figures as projected by the Statistics Deptt. Mr. Sinha expressed his concern for the possible short fall in provisions if the population figures considered for the project were lower. Roads, parking and public transport ► For identifying road projects, the city should be divided into two parts – old city area and new
area. ► The old areas should have more number of subways. Ghantaghar area necessarily needs to
have an underpass. Minister UDD added that all the subways should have toilets which can be implemented with PPP.
► Synchronised traffic system. ► The footpaths in old and the new areas should have underground duct for services. ► The GoU officials expressed that options of ring road, mono rail / ring rail (MRTS) can be
explored for the new city area. These options of public transport should be planned at appropriate levels for railways, airport and ISBT. This will allow daily commuters and people residing in the fringe areas to park their vehicles and take rail routes for entering the city area.
► Project Director UUDP raised the issue of inclusion of street furniture ► Minister UDD asked the team to make use of GIS for broad calculation for project estimations.
Here it may be noted that Department of Urban Development has provided the TA team with digitised map of Dehradun for which GIS is yet to be developed.
► Project for streetlights should be upgraded to cover larger city area. However, streetlight projects should be included after referring to the JNNURM toolkits.
Water Supply ► It was decided that Song Dam should be included with provision for hydro-geological studies

Uttarakhand Urban Development Project
Dehradun City Development Plan (Annex 6) Page 46
Drainage ► Provision for Rain water harvesting should be included ► GoU officials opined that drains should be lined ► Nainital Model should be followed for drainage Sewerage ► GoU mentioned that there is no treatment given to sewage, which is discharged untreated to
rivers/ streams ► Treatment of sewage is a top priority and decentralized treatment should be adopted as
suggested by the TA Consultants ► UDD preferred Membrane Bio-reactor (MBR) technology in preference to FAB technology;
However, UUDTA Consultants mentioned that the former is the most expensive technology SWM ► Mechanised system for compost plant was proposed to be added by GoU officials ► Efforts need to be made for eliminating the secondary collection system, although it will be
done gradually ► Induction of containers to reduce manual handling of waste Basic Services to Urban Poor ► UDD officials felt that development of 1500 EWS houses is a slightly conservative figure and
this needs to be increased. This will also affect other infrastructure requirements ► Secretary UDD asked the team to consult the Statistics Deptt which has conducted a study on
slums in Dehradun ► Assumption of ‘ No longer Slum in 2025’ is not valid Urban Growth ► Minister UDD stressed on shifting of government offices to outer city area which was already
included in the list of projects. He said that cost estimate of Rs. 500 crores may be earmarked for this project
► Underground cabling and road widening projects needs to be expanded to other congested roads also
► Regarding decentralisation of vegetable, fruits markets and milk booths. Minister UDD stressed that number should be increased from 25 to more than 100 as every ward needs 2 such markets.
► Minister UDD pointed out that old city areas and new city areas should be considered separately for proposing development projects.
Other points ► The UDD officials suggested that Mr. Rakesh Sharma should be made coordinator for Nainital
CDP.

Uttarakhand Urban Development Project
Dehradun City Development Plan (Annex 7) Page 47
Annex 7.2.1: Water Supply
Planning Strategy : Least Cost Solutions for Water Supply System Design
The least cost solution for water and sewerage schemes is generally dependent on following considerations:
• For water supply the first consideration is the selection of water source. For economic reasons the source should be as near as possible to the consumers, but will be subject to a balance between the sustainable quantity and quality of source against treatment requirements.
• All schemes will use appropriate materials and technology for conveyance and treatment in terms of long-term quality assurance with least operation and maintenance (O&M) cost.
• Land requirement and least resettlement / compensatory impact for implementation of the scheme
• Least environmental impact
Water Supply Scheme comprises three major components which decides the project viability:
• Water source
• Treatment technology
• Transmission and distribution system Water Source
There is a dearth of surface water source around Dehradun due to non existence of Perennial River or water body nearby. There is a proposal of taping water from
Song River dam (Irrigation project) about 30 km from Dehradun under gravity line. The financial viability of this proposal in regard to availability of water in sufficient quantity is to be studied.
Dehradun is situated in a valley having comparatively low water demand vis-à-vis abundance in ground water in the region with high potential of recharge. Historically, the record of tubewell operation and performance is quite satisfactory as of date. Although there is no investigation conducted to assess ground water potential in the region its abstraction through deep tube wells have been proved to be quite successful from years without showing sign of depletion of the water table. It is therefore considered cheaper and much desirable source compared to surface water for Dehradun.
In view of this ground water is selected to be the most techno-economically desirable source for future water supply schemes of Dehradun at least over short and medium term. However an appropriate study should be conducted to determine the ground water potential of the region in consultation with Central Ground Water Board.

Uttarakhand Urban Development Project
Dehradun City Development Plan (Annex 7) Page 48
Water Treatment
The project proposes to augment the water supply from ground water source only which prima facie does not require any major treatment like in surface water source. However as the water is abstracted and conveyed through a pumping and piping system it is exposed to bacteriological contamination. To avoid this chlorination in the ground water is suggested. Design Criteria for Water Supply Schemes
The water supply scheme shall be designed in accordance with the guidelines of Central Public Health and Environmental Engineering Organisation (CPHEEO) of Government of India (GoI) and standards recommended by the Bureau of Indian Standards (BIS). Accordingly the basic design parameters for the proposed water supply scheme are listed out as follows: Coverage
It is envisaged to cover the town with piped water supply to the extent of at least 95% of the population leaving 5% located in and around green belt areas or areas unconnected by proper roads from the main town where extending pipeline will be uneconomical. Design Period
The recommended design period for an urban water supply scheme is generally 30 years for major civil works of permanent nature and 15/20 years for renewable mechanical and electrical works. Accordingly major civil works will be designed for 2036 and renewable items are designed for 2021. Per Capita Supply Rate
As per the guidelines of CPHEEO manual for hygienic living which ensures a scientific city sewerage system in a town of more than 0.2 million population like in Dehradun, the most reasonable norm of per capita supply rate of water is in the range of 135 litre per day which includes consumption other than drinking like cooking, bathing, utensil/cloth washing, etc. as well as a proportion of non-domestic uses. Dehradun being gateway of Himalayan tourism experiences a fare number of floating population staying in hotels, institutions or other public residential facilities who consumes water at the similar rate as its permanent residents. Fire Fighting Needs
The CPHEEO manual suggests reserving 1/3 of the fire fighting requirement in the service reservoirs and balance to keep in some static reservoirs located in strategic points. This aspect is considered in the scheme. Duration of Supply
The intermittent supply results damage of the pipeline due to water hammering and contamination of water from polluted sources around the distribution lines. It also results in large wastage of water by the consumer on psychological ground once by storing and then throwing out the unused water to collect fresh supply. In view of above round the clock supply is recommended by improving the distribution system and water management in addition to augmentation in the quantity.

Uttarakhand Urban Development Project
Dehradun City Development Plan (Annex 7) Page 49
Supply Pressure
The water pressure can be improved by plugging illegal connections and redesigning the distribution network for a loop system. A minimum pressure of 7 metre (up to 2 storied building) may be maintained in the network. For buildings above 7 metre water may be supplied in a ground sump constructed by the owner from where it may be pumped to the roof tank at his cost. Water Quality
It is proposed to upgrade the laboratory of the existing water treatment plant under the project with modern water testing equipment It is recommended that the ground water abstracted for supply is also tested in the same laboratory and monitored on a regular basis to determine and record its quality and based on the sample analysis the treatment requirements, if any, are effected. The quality of water supplied in the city distribution system shall broadly depict following characteristics:
• Clear, palatable and free from undesirable taste or odour
• Free from pathogenic organism
• Of reasonable temperature
• Non corrosive and non toxic
• Non scale forming, and
• Free from any mineral that may cause health hazard.
To achieve these characteristics the physical, chemical, radiological and bacteriological properties of the treated water in the distribution system should be as per the norms of CPHEEO.

Uttarakhand Urban Development Project
Dehradun City Development Plan (Annex 7) Page 50
Annex 7.2.2: Growth of Water Demand
Year Total Population including floating Population (000)
Water demand @ 135 lpcd +
allowance for 15% losses i.e. @
159 lpcd
Availability of water at current
level of production (MLD)
Surplus /Deficit
+/-
(MLD)
2006 580 92.8 MLD 102.51 +9.71
2011 709 112.7 MLD 102.51 -10.19
2016 836 132.9 MLD 102.51 -30.39
2021 964 153.2 MLD 102.51 -50.69
2035 1316 209.2 MLD 102.51 -106.69
2036 1343 213.5 MLD 102.51 -110.99
Assessment of Storage
Year Total Population
including Floating
Population
Water demand @ 159 lpcd
including 15% wastage (MLD)
Total Storage Capacity
Required @ 10 hours Storage
in (KL)
Total Storage Available (KL)
Surplus/ Short fall
+/-
(KL)
2006 580 92.8 38,666 35,600 +3,066
2011 709 112.7 46,958 35,600 -11,358
2016 836 132.9 55,375 35,600 -19,775
2021 964 153.2 63,833 35,600 -28,233
2035 1316 209.2 87,166 35,600 -51,566
2036 1343 213.5 88,958 35,600 -53,358

Uttarakhand Urban Development Project
Dehradun City Development Plan (Annex 7) Page 51
Annex 7.2.3: Proposed Outline for Primary Collection of MSW Collection system: Primary collection of MSW from different sources of waste generation may be improved in the following manners:
Source of MSW Generation
Primary Collection System
Mode of Collection Frequency of Collection
Domestic (Excluding Residential Complex, Housing Colonies, Slums etc.)
Door-to-Door collection of segregated (Bio-degradable & Non-Biodegradable) waste by DNN workers/ Private Agency followed by either temporary storage in the community bins/containers or direct loading to the MSW transport vehicles
Through covered containerized handcarts/ cycle rickshaws at a pre-determined time
Everyday round the year
Residential Complex & Housing Colonies
Door-to-Door collection of segregated (Bio-degradable & Non-Biodegradable) waste by RWA/Private Agency followed by either temporary storage in the community bins/containers or direct loading to the MSW transport vehicles
Through covered containerized handcarts/ cycle rickshaws at a pre-determined time
Everyday round the year
Slums Door-to-Door collection of segregated (Bio-degradable & Non-Biodegradable) waste by Mohalla Swachhata Samiti followed by either temporary storage in the community bins/containers or direct loading to the MSW transport vehicles
Through covered containerized handcarts/ cycle rickshaws at a pre-determined time
Everyday round the year
Shops & Commercial Establishments
Shop owners and Market Associations shall be held responsible for segregation, storage, collection and transfer of waste either to temporary storage community containers/bins or direct loading to the MSW transport vehicles
Individual shop shall store segregated waste within its premise and transfer the same either to the community containers/bins or directly load to the MSW transport vehicles
Everyday round the year except the days when the shops or markets are closed
Fruit & Vegetable Markets
Market Associations shall be held responsible for storage, collection and transfer of waste to temporary storage community containers/bins for further transportation by MSW transport vehicles
Individual shop shall store its daily waste and transfer the same to the community containers/bins
Everyday round the year except the days when the markets are closed
Hotels & Restaurants
Individual Hotel/Restaurant shall be held responsible for storage and transfer of waste to temporary storage community
DNN will provide vehicles for secondary collection and transportation of waste and charge to the respective hotel/restaurant for the service based on the quantity of waste
Everyday round the year

Uttarakhand Urban Development Project
Dehradun City Development Plan (Annex 7) Page 52
Source of MSW Generation
Primary Collection System
Mode of Collection Frequency of Collection
containers/bins or to the MSW transport vehicles. Shop Owner’s Association/ Market Association shall be overall responsible for primary collection of waste from their respective shops/markets
generated by these hotels & Restaurants.
Construction and Demolition Waste
Individual waste generators shall be held responsible for collection, temporary storage and transportation of the waste for safe disposal. DNN may provide vehicle for waste transportation and disposal against charges.
As and when required
Street Sweeping/ Drain Cleaning
Accumulation of wastes by sweeping of streets and roadside drains by DNN workers for further transportation to the waste disposal site
Using sweeping and drain cleaning tools and equipments and handcarts
Everyday round the year
All door-to-door collection of waste will be chargeable as ‘Service Charge’. In slum areas the service charge may be subsidized. NGOs/ Private agencies may be involved for collection and transportation of the re-cyclable wastes for further processing.