Embed Size (px)
Citation preview

City and County of San Francisco
Juvenile Probation Department
Monthly Report for February 2018
Allen A. Nance Chief Probation Officer
Prepared by Jose Luis Perla Information Technology Director
(415) 753-7686 [email protected]
Table of Contents
Section I Summary Reports
Juvenile Hall, Log Cabin Ranch Summary Statistics ..............................................1 Probation Services Summary and California Youth Authority Statistics................2 Active Cases by Unit and Special Services Statistics..............................................3
Section II Current Month General Detail
Probation Referrals, Juvenile Admissions And Average Daily Population ............4 Juvenile Hall Admissions and Average Daily Population.......................................5 Commitments to out-of-home placement ................................................................6 Log Cabin Ranch Admissions and Average Daily Population................................7 Probation Referrals ..................................................................................................8 Juvenile Hall Admissions ........................................................................................9 Juvenile Hall Detainees by Detention Reason.......................................................10 Juvenile Hall Average Daily Population by Rated Capacity.................................11 Juvenile Hall Average Length of Stay...................................................................12
Section III Demographics
Juvenile Hall Detainees by Sex and Race/Ethnic Origin.......................................13 Juvenile Hall Detainees by Age.............................................................................14 Juvenile Hall Detainees by Age and Sex ...............................................................15 Juvenile Hall Detainees by Geographic Residence of Youth ................................16 Juvenile Hall Detainees by Race/Ethnic Origin and Sex.......................................17

Section I Summary Reports

1
Summary Report for the Month of February 2018
Juvenile Hall January 2017
January 2018
February 2017
February 2018
YTD 2017
YTD 2018
Admissions 55 62 55 58 110 120Average Daily Population 41 43 48 44 45 44Average Length of Stay (Releases) 16.82 23.52 21.89 15.19 19.36 19.36Average Length of Stay (In Custody) 45.42 35.67 51.19 36.27 48.31 35.97Releases 50 64 61 52 111 116
Log Cabin Ranch Admissions: First Time Commitments 2 1 1 2 3 3Releases: Furlough 0 0 3 0 3 0 Escape 0 0 0 0 0 0 Other releases 1 1 0 1 1 2
Total Releases 1 1 3 1 4 2Average Daily Population 15 7 12 7 14 7

2
Summary Report for the Month of February 2018
Probation Services January 2018
February 2018
Year To Date2018
Probation Referrals 99 82 181Total Petitions including violation of probation 48 51 99 Selected Court Dispositions: Department of Juvenile Justice (DJJ) 1 0 1 Log Cabin Ranch 1 6 7 Out of Home Placement 4 3 7 Ward Probation 17 11 28 Non-Ward Probation (725a WI) 3 3 6 Informal Probation (654 WI) 4 5 9Violation of Probation Petitions Filed 10 3 13
California Youth Authority Monthly Count San Francisco County Juvenile Court Cases
February 28th, 2018
Category Institutions Parole Males White 1 0Hispanic 2 0African American 6 0Asian 0 0Native American 0 0Filipino 0 0Pacific Islander 0 0Other 0 0
Total 9 0
Females White 0 0Hispanic 0 0African American 0 0Asian 0 0Native American 0 0Filipino 0 0Pacific Islander 0 0Other 0 0
Total 0 0Grand Total 9 0

3
Summary Report for the Month of February 2018
Probation Services Active Cases by Units January
2018 February
2018 February
Average # Youth by PO
CARC 99 92 92Intake Green (Custody Screening Investigation) 99 94 19Intake Gold (Probation Services 1) 99 103 21Supervision (Probation Services 2 –FITS) 138 141 28Serious Offenders Program (Probation Services 3) 31 34 17Private Placement (Probation Services 4) 63 63 11Juvenile Collaborative Re-entry Unit (JCRU) 54 52 17
Total 583 579 29 Total Active Intake Cases 296 292 Total Probation/Supervision Cases 287 287
Total 583 579

Section II Current Month General Detail

4
San Francisco Juvenile Probation Department
Jan 18 Feb-18 Mar-18 Apr-18 May-18 Jun-18 Jul-18 Aug-18 Sep-18 Oct-18 Nov-18 Dec-18Probation Referrals 99 82JH Admissions 62 58JH Avg. Daily Pop. 43 44
2018 Comparison of Probation Referrals, Admissions to Juvenile Hall, and Average Daily Population in Juvenile Hall
0
20
40
60
80
100
120
Jan 18 Feb-18
Month
Tota
l
Probation Referrals
JH Admissions
JH Avg. Daily Pop.
5
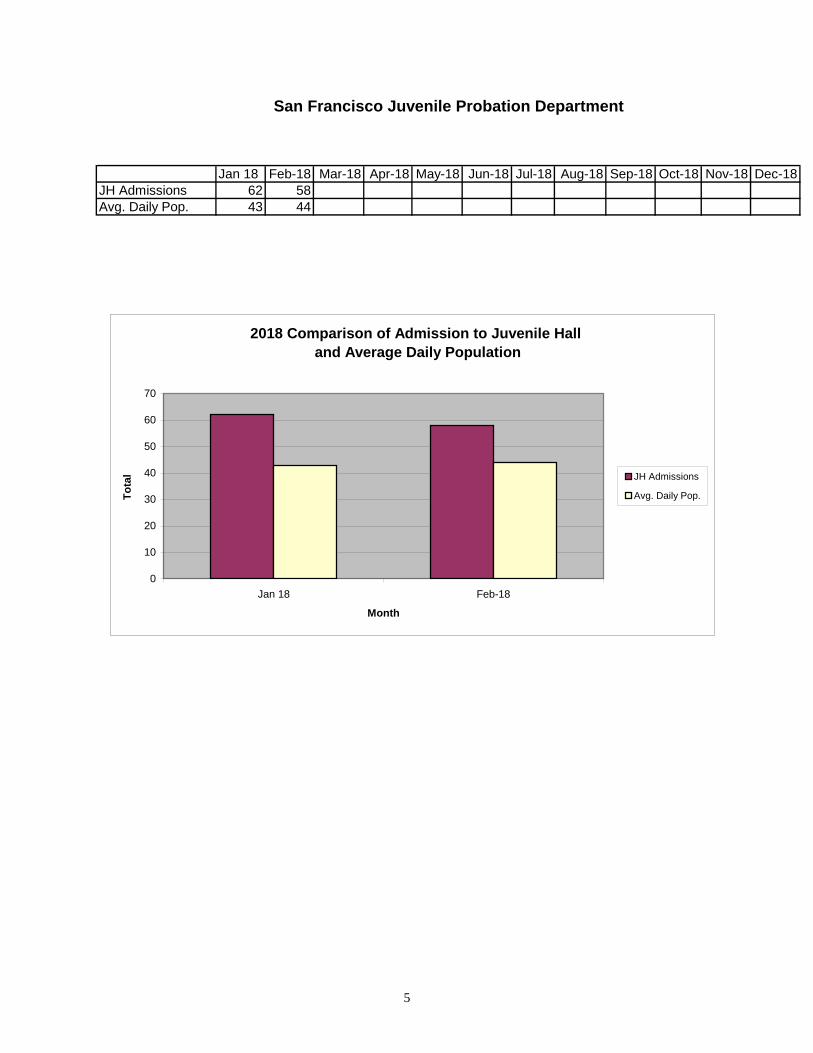
San Francisco Juvenile Probation Department
Jan 18 Feb-18 Mar-18 Apr-18 May-18 Jun-18 Jul-18 Aug-18 Sep-18 Oct-18 Nov-18 Dec-18JH Admissions 62 58Avg. Daily Pop. 43 44
2018 Comparison of Admission to Juvenile Hall and Average Daily Population
0
10
20
30
40
50
60
70
Jan 18 Feb-18
Month
Tota
l JH Admissions
Avg. Daily Pop.
6
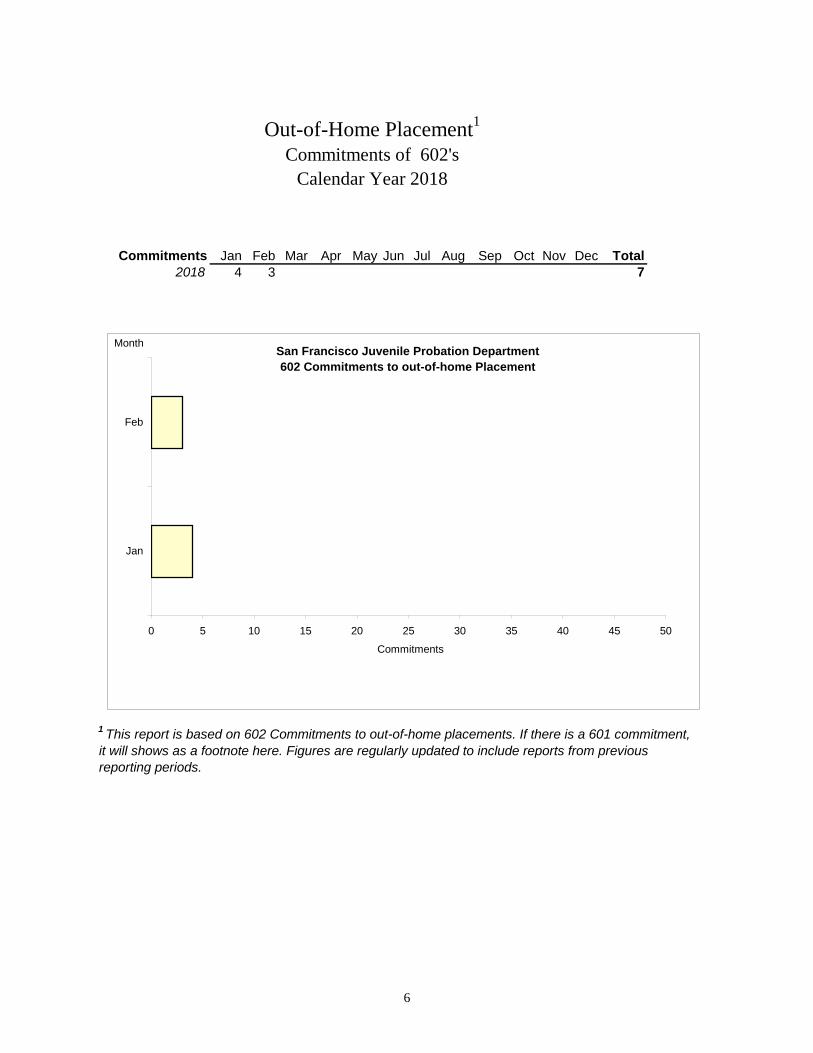
Out-of-Home Placement1
Commitments of 602'sCalendar Year 2018
Commitments Jan Feb Mar Apr May Jun Jul Aug Sep Oct Nov Dec Total2018 4 3 7
1 This report is based on 602 Commitments to out-of-home placements. If there is a 601 commitment,it will shows as a footnote here. Figures are regularly updated to include reports from previousreporting periods.
San Francisco Juvenile Probation Department602 Commitments to out-of-home Placement
0 5 10 15 20 25 30 35 40 45 50
Jan
Feb
Month
Commitments

7
San Francisco Juvenile Probation Department
Jan 18 Feb-18 Mar-18 Apr-18 May-18 Jun-18 Jul-18 Aug-18 Sep-18 Oct-18 Nov-18 Dec-18Admissions 1 2Avg. Daily Pop. 7 7
2018 Comparison of Admissions to Log Cabin Ranch and Average Daily Population
0
1
2
3
4
5
6
7
8
Jan 18 Feb-18
Month
Tota
l Admissions
Avg. Daily Pop.

8
Probation Referrals by MonthCalendar Year 2018
Probation Referrals (all sources) by Month(602 W&I)
Jan-18 99Feb-18 82Mar-18Apr-18
May-18Jun-18Jul-18
Aug-18Sep-18Oct-18Nov-18Dec-18
Probation Referrals (all sources) by Month
10 60 110 160 210 260 310 360
Jan-18
Feb-18
Month
Tota
l
9
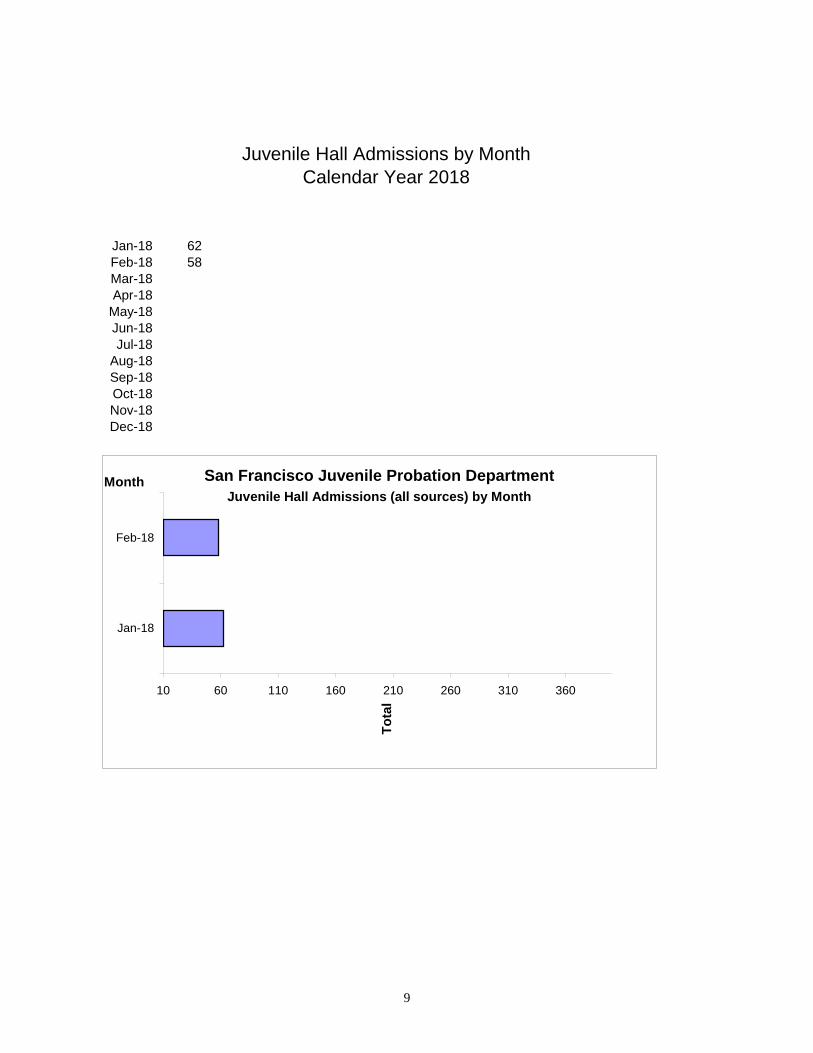
Juvenile Hall Admissions by MonthCalendar Year 2018
Jan-18 62Feb-18 58Mar-18Apr-18
May-18Jun-18Jul-18
Aug-18Sep-18Oct-18Nov-18Dec-18
San Francisco Juvenile Probation DepartmentJuvenile Hall Admissions (all sources) by Month
10 60 110 160 210 260 310 360
Jan-18
Feb-18
Month
Tota
l

10
Characteristics of Juvenile Hall Detainees on February 28th, 2018
Referral Reason MF* Literal Count %187 (A) PC F ATTEMPTED MURDER 4 8.16%215 (A) PC F CARJACKING 1 2.04%211 PC F ROBBERY 10 20.41%11352 (A) HS F TRANSPORT/SELL NARCOTIC/CONTROLLED SUBSTANCE 1 2.04%11351.5 HS F POSSESS/PURCHASE COCAINE BASE FOR SALE 2 4.08%459 PC F BURGLARY 2 4.08%626.9 (B) PC F HAVE FIREARM AT PUBLIC/ETC SCHOOL 1 2.04%245 (A)(1) PC F ASSAULT W/DEADLY WEAPON:NOT F/ARM 1 2.04%245 (A)(4) PC F ADW WITH FORCE:POSSIBLE GBI 1 2.04%496 D(A) PC F POSSESS STOLEN VEHICLE/VESSEL/ETC 1 2.04%25400 (A)(1) PC F CARRY CONCEALED WEAPON IN VEHICLE 1 2.04%242 PC F BATTERY 2 4.08%244.5 (B) PC F ASSAULT WITH STUN GUN OR LESS LETHAL WEAPON 1 2.04%422 PC F THREATEN CRIME W/INTENT TO TERRORIZE 1 2.04%459 PC F BURGLARY:SECOND DEGREE 1 2.04%10851 (A) VC F TAKE VEHICLE W/O OWNER'S CONSENT/VEHICLE THEFT 2 4.08%496 (A) PC F RECEIVE/ETC KNOWN STOLEN PROPERTY 1 2.04%242 PC M BATTERY 1 2.04%777 (A)(2) WI M FAIL TO OBEY ORDER OF JUVENILE COURT:602 WI 1 2.04%628.1 WI M VIOLATION(S) OF HOME SUPERVISION CONDITION 3 6.12%737 WI M CHANGE OF PLACEMENT/PLACEMENT FAILURE 2 4.08%WRNT602 ARREST WARRANT 7 14.29%WRNTOC WARRANT FROM ANOTHER COUNTY 1 2.04%CTORD 602 COURT ORDER 1 2.04%
Total 49 100.00%*M=Misdemeanor; F=Felony

11
San Francisco Juvenile Probation Department
Jan 18 Feb-18 Mar-18 Apr-18 May-18 Jun-18 Jul-18 Aug-18 Sep-18 Oct-18 Nov-18 Dec-18Rated Capacity 150 150Avg. Daily Pop. 43 44
Juvenile Hall Average Daily Population Compared to Rated Capacity
0
20
40
60
80
100
120
140
160
Jan 18 Feb-18
Month
Tota
l
Rated CapacityAvg. Daily Pop.

12
Juvenile Hall Average Length of StayFor the Month of February 2018
1Released
Range of Days 1-10 days 11-20 days 21-30 days 30 or more days Total
# of Youth Released 30 7 8 7 52
% of Population 57.69% 13.46% 15.38% 13.46% 100%
# of Days 114 95 208 373 790
% of Total Days 14.43% 12.03% 26.33% 47.22% 100%
Average Length of Stay 3.80 13.57 26.00 53.29 15.19
2In Custody
Range of Days 1-10 days 11-20 days 21-30 days 30 or more days Total
# of Youth Detained 18 10 5 16 49% of Population 36.73% 20.41% 10.20% 32.65% 100%
# of Days 104 154 120 1,399 1,777
% of Total Days 5.85% 8.67% 6.75% 78.73% 100%
Average Length of Stay 5.78 15.40 24.00 87.44 36.27
Notes: Less than one day of stay is calculated as one day. 1Length of stay is calculated according to release date for those who are released.2For those still in custody, length of stay is calculated at the last day of the month.

Section III Demographics

13
Gender Frequency Percent
Female 8 16.33%Male 41 83.67%
Total 49 100.00%
Race/Ethnic Origin Frequency PercentAfrican American 31 63.27%Hispanic 15 30.61%Other 1 2.04%Pacific Islander 1 2.04%White 1 2.04%
Total 49 100.00%
Demographic CharacteristicsOf Juvenile Hall Detainees on 2/28/18 by Gender
Female
Male
Demographic Characteristics of Juvenile Hall Detainees on 2/28/18 by Race
African American
Hispanic
Other
Pacific Islander
White

14
Age Frequency Percent
11 0 0.00%12 1 2.04%13 2 4.08%14 8 16.33%15 5 10.20%16 12 24.49%17 17 34.69%18 4 8.16%
Total 49 100.00%
Demographic Characteristics of Juvenile HallDetainees on 2/28/18 by Age
11
12
13
14
15
16
17
18

15
Demographic Characteristics of Juvenile Hall Detainees on 2/28/18
Age by Gender
Age Female Male Total11 0 0 0 0.00%12 0 1 1 2.04%13 1 1 2 4.08%14 2 6 8 16.33%15 2 3 5 10.20%16 1 11 12 24.49%17 2 15 17 34.69%
18 and over 0 4 4 8.16%Total 8 41 49 100.00%
16.33% 83.67% 100.00%
FemaleMale

16
Demographic Characteristics Of Juvenile Hall Detainees on February 28th, 2018
Geographic Residence of Youth Count %Richmond 0 0.0%Marina 0 0.0%North of Market/Downtown 2 4.1%Treasure Island/Yerba Buena Island 1 2.0%Western Addition 5 10.2%South of Market/Tenderloin 3 6.1%Sunset 1 2.0%Haight Ashbury/Castro/Upper Market 1 2.0%Inner Mission 3 6.1%Potrero 3 6.1%Parkside 1 2.0%Ingleside (West of Twin Peaks) 1 2.0%Outer Mission 5 10.2%Bayview 13 26.5%Non-San Francisco and Unavailable 10 20.4%
Total 49 100.0%
Non-San Francisco and Unavailable Count %Duncan 1 10.0%Oakland 2 20.0%Richmond 1 10.0%San Leandro 1 10.0%Stockton 2 20.0%Unavailable 3 30.0%
Total 10 100.0%

17
Demographic Characteristics Of Juvenile Hall Detainees on February 28th, 2018 Race/Ethnic Origin by Gender
Race/Ethnicity Female Male Total %African American 6 25 31 63.3%Hispanic 2 13 15 30.6%Other 0 1 1 2.0%Pacific Islander 0 1 1 2.0%White 0 1 1 2.0%
Total 8 41 49 100.0%
0
5
10
15
20
25
30
AfricanAmerican
Hispanic Other Pacific Islander White Female
Male