Embed Size (px)
Citation preview

Cohesion Research Statistical Release Number 16
1 Some figures are based on England and Wales; these are specifically referenced in the text.
Citizenship Survey: 2010-11 (April 2010 – March 2011), England1
This Release provides headline findings from the Citizenship Survey, covering 2010-11 (all four quarters of the 2010-11 survey) and updates those statistics released on the 14th April (covering the April-December 2010 period). The Release is divided into four sections covering community action; community spirit; harassment and discrimination; and attitudes to violent extremism. This release features findings on key topic areas within the Citizenship Survey and provides an evidence base for some of the Department for Communities and Local Government’s key interests.
1. Community action. . . . . . . .4
2. Community spirit. . . . . . . . 11
3. Harassment and discrimination. . . . . . . . . . . . .19
4. Experimental statistics: Attitudes to Violent Extremism. . . . . . . . . . . . . . . 26
Background notes. . . . . . . . . 27
List of tables. . . . . . . . . . . . . .31
Responsible Statistician:Emma Crowhurst
Public Enquiries:
Phone: 0303 444 [email protected]
Press Enquiries:
Phone: 0303 444 [email protected]
cohesion research

Community action
• In 2010-11, 38 per cent felt they could influence decisions in their local area. However, a higher proportion of people (74%) said it was important for them to be able to influence local decision making, and 44 per cent of people said they would like to be more involved in decisions made by Councils affecting their local area.
• Thirty-four per cent of people said that they had engaged in civic participation at least once in the 12 months prior to interview. This figure was unchanged on 2009-10 but lower than in any year before then (between 38% and 39%).
• Twenty-five per cent of people reported that they volunteered formally at least once a month in 2010-11, a lower rate than at any point between 2001 and 2007-08 (when it ranged between 27% and 29%), but unchanged on 2008-09 and 2009-10 levels.
• Thirty-six per cent of people trusted Parliament either ‘a lot’ or a ‘fair amount’, a rise since 2009-10 (29%) when the proportion had dropped relative to all previous years. Sixty-four per cent of people trusted their local council, higher than in all previous years.
Community spirit
• In 2010-11, 86 per cent of people thought their community was cohesive, agreeing that their local area was a place where people from different backgrounds got on well together. The level was higher than all previous years.
• Eighty-six per cent of adults in England were satisfied with their local area as a place to live, an increase on previous years: 82% in 2008-09 and 83% in 2009-10.
• Seventy-seven per cent of people thought that the number of immigrants coming to Britain should be reduced; whilst three per cent thought the number should be increased.
• More people said they were not at all worried about being a victim of crime in 2010-11 (22%) than in all previous years (between 10% and 20%).
• More people said they felt safe (‘very safe’ or ‘fairly safe’) walking alone in their neighbourhood after dark in 2010-11 (76%) than in all previous years (between 67% and 74%).
Cohesion Research 2

Harassment and discrimination
• In 2010-11, 7 per cent of adults in England felt racial or religious harassment was a ‘very’ or ‘fairly’ big problem in their local area. People from ethnic minority backgrounds were more likely than white people to feel that racial or religious harassment was a ‘very’ or ‘fairly’ big problem (13% compared with 6%).
• Forty-four per cent of people thought that there was more religious prejudice today than there was five years ago; this represents a year on year decline since 2008-09 (from 52% in 2008-09 to 46% in 2009-10).
• Twenty-two per cent of people thought that they would be treated worse than people of other races by at least one of the eight public service organisations measured. Nine per cent of people thought they would be treated worse than people of other races by at least one of the five Criminal Justice System organisations.
Experimental statistics: Attitudes to Violent Extremism
• In 2010-11, 87 per cent of people rejected general2 violent extremism.
2 General violent extremism is measured through the question ‘How right or wrong do you think it is for people to use violent extremism in Britain to protest against things they think are very unfair or unjust?’
Cohesion Research 3

1. Community action Influencing decisions In 2010-11, 22 per cent of people felt they could influence decisions affecting Britain. This was an increase on levels in 2009-10 (20%), but there was no clear trend across previous years. A greater proportion (38%) felt they could influence decisions in their local area. Levels on this measure were unchanged on all previous years apart from 2001 when it was higher (at 44%) (Figure 1).
Figure 1: Whether people feel able to influence decisions affecting their local area and Britain, 2001 to 2010-11
44
38 39 38 3937 38
25
2022
2022
2022
0
10
20
30
40
50
60
70
80
90
100
2001 2003 2005 2007-08 2008-09 2009-10 2010-11
Perc
enta
ge -
agre
eing
Local area Britain
• Table 1: Whether people feel able to influence decisions affecting their local area and Britain, 2001 to 2010-11.
• Table 2: Whether people feel able to influence decisions affecting their local area and Britain, by ethnicity, religious affiliation, sex and age, 2010-11.
Cohesion Research 4

In 2010-11, 74 per cent of people felt it was important for them personally to feel they could influence decisions in the local area; this was unchanged on 2009-10, but lower than in the years prior to that (Figure 2).
Figure 2: How important it is for people to feel they can influence decisions in the local area, 2007–08 to 2010-11
79 78
73 74
0
10
20
30
40
50
60
70
80
90
100
2007-08 2008-09 2009-10 2010-11
Perc
enta
ge -
'impo
rtan
t'
• Table 3: How important is it for you personally to feel you can influence decisions in your local area, 2007-08 to 2010-11.
Cohesion Research 5

In 2010-11, 44 per cent of people said they would like to be more involved in Council decisions affecting their local area, 39 per cent said they wouldn’t and 18 per cent said it would depend on the issue. The proportion of people saying they would like to be more involved was unchanged on 2009-10, but lower than in years prior to that (Figure 3).
Figure 3: Whether people would like to be more involved in decisions made by their local council, 2007–08 to 2010-11
50 49
44 44
0
10
20
30
40
50
60
70
80
90
100
2007-08 2008-09 2009-10 2010-11
Perc
enta
ge -
'yes
'
• Table 4: Whether people would like to be more involved in decisions made by their local council, 2007-08 to 2010-11.
Taking part The Citizenship Survey measures levels of participation in three broad strands of civic engagement: • Civic activism – which refers to involvement either in direct decision-making about local
services or issues, or in the actual provision of these services by taking on a role such as a local councillor, school governor or magistrate
• Civic consultation – which refers to active engagement in consultation about local services or issues through activities such as attending a consultation group or completing a questionnaire about these services; and
Cohesion Research 6

• Civic participation – which covers wider forms of engagement in democratic processes, such as contacting an elected representative, taking part in a public demonstration or protest, or signing a petition.
In 2010-11, 34 per cent of adults in England engaged in civic participation at least once in the 12 months prior to interview; unchanged on 2009-10 but lower than in any year before then (between 38% and 39%). Involvement in civic consultation at least once in the previous year was 17 per cent in 2010-11, lower than in all previous years (18%-21%). The percentage of people reporting that they had engaged in civic activism during the previous year was 10 per cent in 2010-11, unchanged upon all previous years (Figure 4).
Figure 4: Participation in civic participation, civic consultation and civic activism at least once in the last 12 months, 2001 to 2010-11
38 38 38 39 3834 34
20 21 20 18 17
9 10 10 10 10
0
10
20
30
40
50
60
70
80
90
100
2001 2003 2005 2007-08 2008-09 2009-10 2010-11
Perc
enta
ge -
part
icip
atin
g Civic participationCivic consultationCivic activism
Cohesion Research 7

Volunteering In 2010-11, 39 per cent of adults said that they had volunteered formally at least once in the 12 months prior to interview, a smaller proportion than in all years between 2003 and 2007-08 (between 42% and 44%) but unchanged on 2008-09 and 2009-10. Twenty-five per cent of people reported that they volunteered formally at least once a month in 2010-11, a lower level than all years between 2001 and 2007-08 but, like formal volunteering during the previous year, this level was unchanged on 2008-09 and 2009-10 (Figure 5).
Figure 5: Participation in formal volunteering, 2001 to 2010-11
27 28 2927 26 25 25
3942
44 4341 40 39
0
10
20
30
40
50
60
70
80
90
100
2001 2003 2005 2007-08 2008-09 2009-10 2010-11
Perc
enta
ge -
volu
ntee
ring
Once a month
At least once in the last year
Cohesion Research 8

In 2010-11, levels of informal volunteering, both in the previous year and on a regular basis, were higher than levels of formal volunteering. Fifty five per cent of people volunteered informally at least once in the 12 months prior to interview in contrast to 39 per cent who volunteered formally during this time. Twenty nine per cent of people said they volunteered informally at least once a month compared to 25 percent who said they volunteered formally at least once a month.
Levels of informal volunteering once a year (55%) were unchanged on 2009-10 but lower than in all years prior to that, following a particularly large decrease from 2008-09 to 2009-10 (from 62% to 54%). As with informal volunteering during the previous year, the level of monthly informal volunteering (29%) was also lower than in all years prior to 2009-10 (when levels ranged from 34% to 37%) (Figure 6). This also followed a notable decline between 2008-09 and 2009-10 (from 35% to 29%).
Figure 6: Participation in informal volunteering, 2001 to 2010-11
3437 37
35 35
29 29
6763
6864
62
54 55
0
10
20
30
40
50
60
70
80
90
100
2001 2003 2005 2007-08 2008-09 2009-10 2010-11
Perc
enta
ge -
volu
ntee
ring
Once a month
At least once in the last year
• Table 5: Participation in civic engagement and voluntary activities, 2001 to 2010-11.
• Table 6: Participation in civic engagement and formal volunteering at least once in the last year, by ethnicity, religious affiliation, sex, age and disability, 2007-08 to 2010-11.
• Table 7: Participation in voluntary activities, by ethnicity, age, employment status and Government Office Region, 2009-10 and 2010-11.
Cohesion Research 9

Trust in institutions In 2010-11, 36 per cent of people trusted Parliament either ‘a lot’ or a ‘fair amount’; a rise since 2009-10 (29%) when the proportion dropped relative to all previous years (34%-38%). One possible explanation of the dip in trust in 2009-10 was the parliamentary expenses revelations which began in May 2009. Sixty-four per cent of people trusted their local council, higher than in all previous years (52%-62%). Eighty-four per cent of people trusted the police, higher than in all previous survey years apart from 2008-09 (Figure 7).
Figure 7: Whether people trust institutions ‘a lot’ or ‘a fair amount’, 2001 to 2010-11
3638 37
35 34
29
36
5254
5760 61 62
64
80 80 7981 82 82
84
0
10
20
30
40
50
60
70
80
90
100
2001 2003 2005 2007-08 2008-09 2009-10 2010-11
Perc
enta
ge
ParliamentLocal councilPolice
• Table 8: Whether people trust institutions ‘a lot’ or ‘a fair amount’, 2001 to 2010-11.
Cohesion Research 10

2. Community spirit
Cohesion In 2010-11, 86 per cent of people thought their community was cohesive, agreeing that their local area was a place where people from different backgrounds got on well together. The level was higher than all previous years, when it increased from 80% in 2003 to 85% in 2009-10 (Figure 8).
Figure 8: Proportion of people who agree that their local area is a place where people from different backgrounds get on well together, 2003 to 2010-11
80 8082
84 85 86
0
10
20
30
40
50
60
70
80
90
100
2003 2005 2007-08 2008-09 2009-10 2010-11
Perc
enta
ge
• Table 9: Community cohesion, by ethnicity, religious affiliation, Government Office Region, sex and age, 2003 to 2010-11.
Belonging In 2010-11, 78 per cent of people felt they belonged strongly to their neighbourhood. This included 37 per cent of people who said they belonged very strongly to their neighbourhood. The proportion of people who said they belonged strongly to their neighbourhood was higher than in 2003 to 2007-08 (between 70% and 75%) but unchanged on 2008-09 (77%) and 2009-10 (76%) (Figure 9).
Cohesion Research 11

Figure 9: Proportion of people who feel they belong strongly to their neighbourhood, 2003 to 2010-11
2731 34 36 37
4343
40 41 41
37
41
0
10
20
30
40
50
60
70
80
90
100
2003 2005 2007-08 2008-09 2009-10 2010-11
Perc
enta
ge
Fairly stronglyVery strongly
7074
7775 76 78
In 2010-11, 88 per cent of people felt they belonged strongly to Britain, with 51 per cent saying they belonged very strongly. Levels of belonging strongly were higher than in 2003 to 2008-09 (between 84% and 86%) but unchanged on 2009-10 (87%). There has been no clear trend for belonging very strongly.
• Table 10: Whether people feel that they belong strongly to their neighbourhood and
Britain, 2003 to 2010-11.
• Table 11: Whether people feel that they belong strongly to their neighbourhood and Britain, by ethnicity, religious affiliation, sex and age, 2009-10 and 2010-11.
Meaningful interaction (mixing socially) with people from different backgrounds In 2010-11, 82 per cent of people mixed socially at least once a month with people from different ethnic or religious backgrounds in a range of settings (excluding at home) e.g. at work, at a place of education, through a leisure activity, at a place of worship, at the shops or through volunteering. The proportion of people who mixed socially at least once a month was higher than in 2007-08 (80%) and 2009-10 (80%) but unchanged from 2008-09 (81%).
Cohesion Research 12

In 2010-11, people were most likely to mix socially with people from different backgrounds at the shops (64%), followed by work, school or college (54%), and then a pub, club, café or restaurant (45%). Since 2009-10, there was an increase in the proportion of people mixing through a child’s crèche, nursery or school (from 11% to 17%), although this figure is not directly comparable to 2009-10 levels3, and mixing through shops (from 62% to 64%). (Figure 10).
Figure 10: Proportion of people who have mixed socially with people from different ethnic or religious backgrounds in the last month, 2009-10 and 2010-11
82
17
15
15
19
33
36
45
54
64
80
11
16
16
20
33
35
45
52
62
0 10 20 30 40 50 60 70 80 90 100
*Any mixing (excluding home)
*Child's creche, nursery or school
Place of worship
Informal volunteering
Formal volunteering
Group, club or organisation
Home or their home
Pub, club, café or restaurant
Work, school or college
*Shops
Percentage - mixing
2009-10
2010-11
*statistically significant change between 2009-10 and 2010-11
People from ethnic minority groups as a whole were more likely than White people to mix socially with people from different ethnic or religious backgrounds (95% compared with 80%). This was also true for all individual ethnic minority groups. Lower rates of mixing among White people compared with people from ethnic minority groups reflects, to some extent, the nature of the areas in which people live. For example, White people who lived in more ethnically diverse areas (where more than 5% of the population were from ethnic minority
3 The routing of this question was changed for the 2009-10 survey so that only responses from those households where a child lived were included; this may however have excluded some respondents who might legitimately have mixed in this way, for example, those with children living elsewhere. The routing for 2010-11 was changed back to that used in 2008-09 and earlier years, so that direct comparisons can be made between 2010-11 and all other years apart from 2009-10.
Cohesion Research 13

backgrounds4) were more likely than White people who lived in relatively homogenous areas to have mixed socially with people from different backgrounds (92% compared with 74%). • Table 12: Mixing with people from different ethnic or religious backgrounds by ethnicity,
religious affiliation, sex, age and area diversity (percentage mixing at least once a month), 2007-08 to 2010-11
• Table 13: Mixing with people from different ethnic or religious backgrounds (by sphere of mixing), by ethnicity, religious affiliation, age and sex, 2010-11
Satisfaction with local area In 2010-11, 86 per cent of adults in England were satisfied with their local area as a place to live, an increase on previous years: 82% in 2008-09 and 83% in 2009-10 (Figure 11).
Figure 11: Proportion of people who were satisfied with their local area as a place to live, 2008-09 to 2010-11
82 8386
0
10
20
30
40
50
60
70
80
90
100
2008-09 2009-10 2010-11
Perc
enta
ge
• Table 14: Satisfaction with local area, by ethnicity, sex and age, 2008-09 to 2010-11.
4 Based on the 2001 Census (Office for National Statistics).
Cohesion Research 14

In 2010-11, 66 per cent of people thought that their local area had not changed much over the past two years. Sixteen per cent of people thought that the area had got better, while 18 per cent thought it had got worse. Whilst the proportion thinking that their area had got better is higher than in 2009-10 (14%), it is unchanged on 2008-09 and 2007-08, when levels were 15 per cent and 17 per cent respectively. Since 2007-08 there has been a downward trend in the number of people thinking their area had got worse, from 27 per cent in 2007-08, to 25 per cent in 2008-09, 21 per cent in 2009-10 and 18 per cent in 2010-11 (Figure 12).
Figure 12: Proportion of people who think their local area has got better, worse or remained the same, 2007-08 to 2010-11
17 15 14
2725
18
5660
65 66
16
21
0
10
20
30
40
50
60
70
80
90
100
2007-08 2008-09 2009-10 2010-11
Perc
enta
ge
not changed muchworsebetter
• Table 15: Whether area has got better or worse, 2007-08 to 2010-11.
Cohesion Research 15
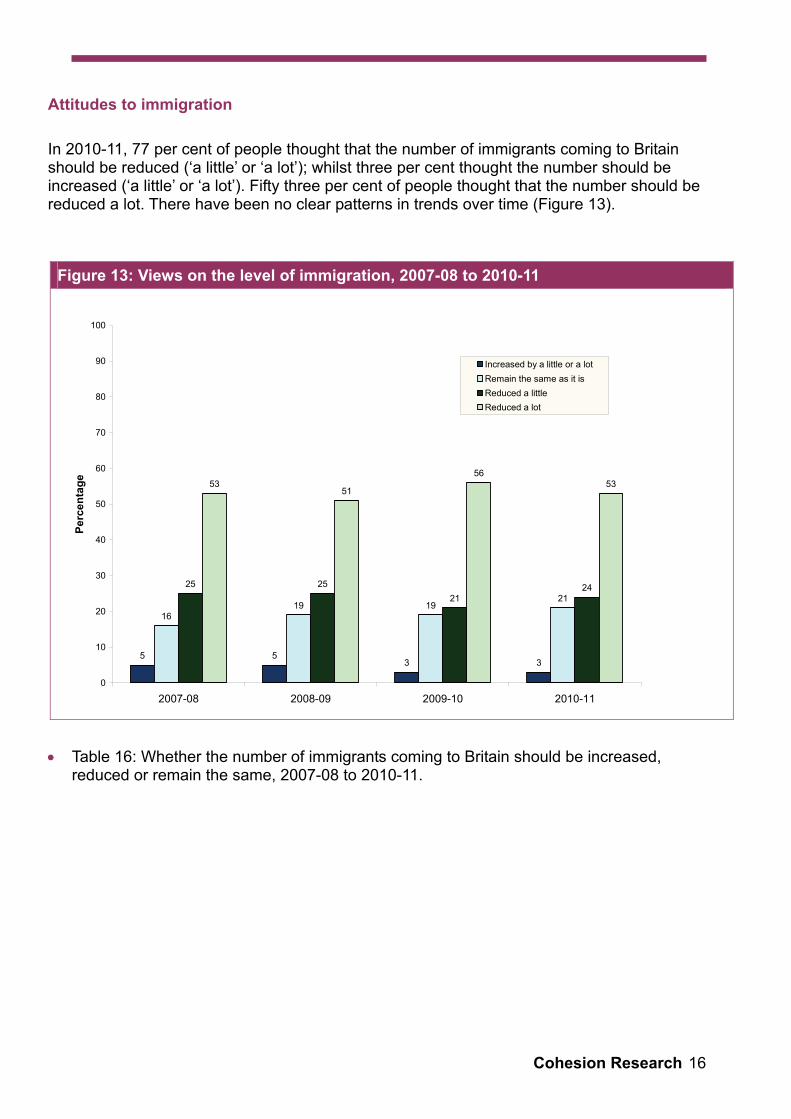
Attitudes to immigration
In 2010-11, 77 per cent of people thought that the number of immigrants coming to Britain should be reduced (‘a little’ or ‘a lot’); whilst three per cent thought the number should be increased (‘a little’ or ‘a lot’). Fifty three per cent of people thought that the number should be reduced a lot. There have been no clear patterns in trends over time (Figure 13).
Figure 13: Views on the level of immigration, 2007-08 to 2010-11
5 53 3
1619 19
2125 25
2124
5351
5653
0
10
20
30
40
50
60
70
80
90
100
2007-08 2008-09 2009-10 2010-11
Perc
enta
ge
Increased by a little or a lotRemain the same as it isReduced a littleReduced a lot
• Table 16: Whether the number of immigrants coming to Britain should be increased,
reduced or remain the same, 2007-08 to 2010-11.
Cohesion Research 16

Fear of crime In 2010-11, 64 per cent of people said that they were not worried (‘not very worried’ or ‘not at all worried’) about becoming a victim of crime. More people said they were not at all worried about being a victim of crime in 2010-11 (22%) than in all previous years (between 10% and 20%). (Figure 14).
Figure 14: Fear of crime, 2005 to 2010-11
139 10
8
31 3129 28
45 44 43 42 42
10
1715
2022
9
32
0
10
20
30
40
50
60
70
80
90
100
2005 2007-08 2008-09 2009-10 2010-11
Perc
enta
ge
Very worriedFairly worriedNot very worriedNot at all worried
• Table 17: How worried are people about becoming the victim of crime, 2005 to 2010-11.
In 2010-11, the majority of people (76%) said that they felt safe (‘very safe’ or ‘fairly safe’) when walking alone after dark in their neighbourhood, higher than in all previous years (between 67% and 74%). This was evenly split between those who said that they felt ‘very safe’ and those who said that they felt ‘fairly safe’ (each 38%). The proportion of people who said that they felt ‘very safe’ (38%) was higher than in all previous years. Fifteen per cent of people said they felt ‘a bit unsafe,’ although this figure is lower than in years between 2003 and 2008-09 (19% and 16%). There was, however, no change in the extent to which people felt ‘very unsafe’ when compared with 2009-10 and 2008-09, although the proportion of people was lower in the most recent period than in 2003 to 2007-08 (Figure 15).
Cohesion Research 17

Figure 15: Whether people feel safe walking alone after dark in the neighbourhood, 2001 to 2010-11
34
2830
35 353837
39 4038 39 38
13
1917 17 16 16 15
79 9 8
6 7 6
32
40
0
10
20
30
40
50
60
70
80
90
100
2001 2003 2005 2007-08 2008-09 2009-10 2010-11
Perc
enta
ge
Very safe
Fairly safe
A bit unsafe
Very unsafe
• Table 18: Whether people feel safe walking alone in their neighbourhood after dark, 2001 to 2010-11.
Cohesion Research 18
3. Harassment and discrimination
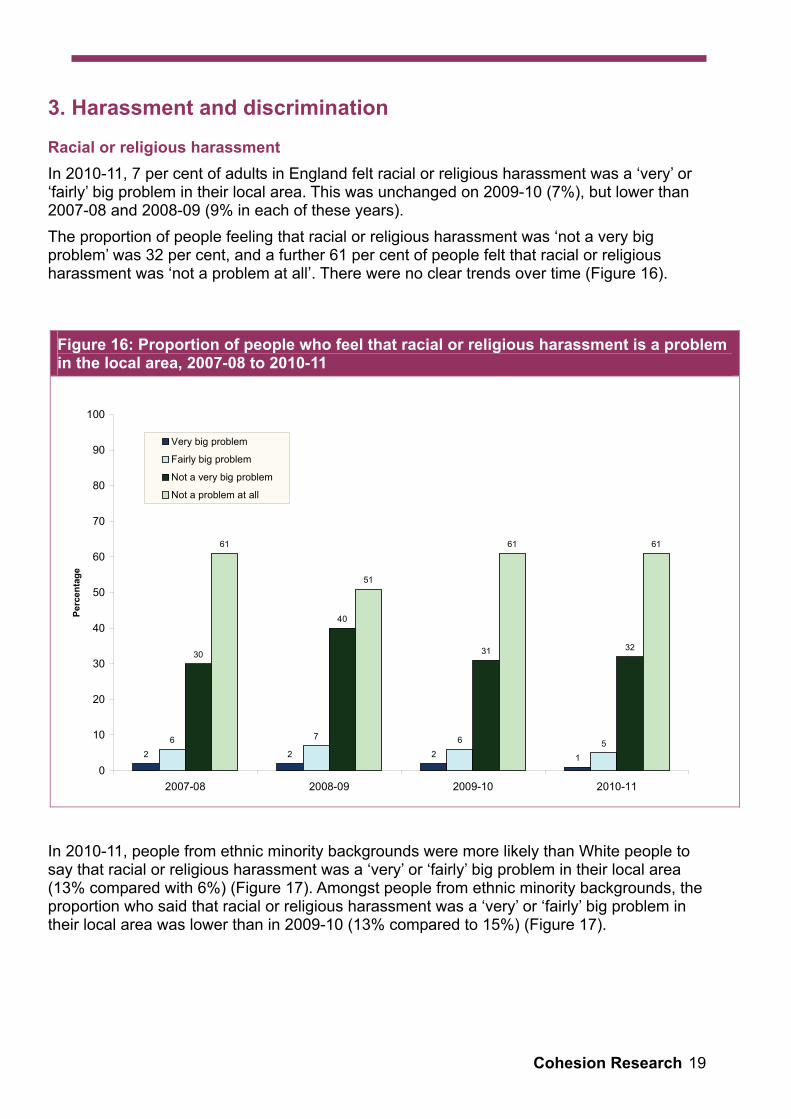
Racial or religious harassment In 2010-11, 7 per cent of adults in England felt racial or religious harassment was a ‘very’ or ‘fairly’ big problem in their local area. This was unchanged on 2009-10 (7%), but lower than 2007-08 and 2008-09 (9% in each of these years). The proportion of people feeling that racial or religious harassment was ‘not a very big problem’ was 32 per cent, and a further 61 per cent of people felt that racial or religious harassment was ‘not a problem at all’. There were no clear trends over time (Figure 16).
Figure 16: Proportion of people who feel that racial or religious harassment is a problem in the local area, 2007-08 to 2010-11
2 2 2 1
6 7 6 5
30
40
31 32
61
51
61 61
0
10
20
30
40
50
60
70
80
90
100
2007-08 2008-09 2009-10 2010-11
Perc
enta
ge
Very big problem
Fairly big problem
Not a very big problem
Not a problem at all
In 2010-11, people from ethnic minority backgrounds were more likely than White people to say that racial or religious harassment was a ‘very’ or ‘fairly’ big problem in their local area (13% compared with 6%) (Figure 17). Amongst people from ethnic minority backgrounds, the proportion who said that racial or religious harassment was a ‘very’ or ‘fairly’ big problem in their local area was lower than in 2009-10 (13% compared to 15%) (Figure 17).
Cohesion Research 19

Figure 17: Proportions of people from ethnic minority groups who feel that racial or religious harassment is a very or fairly big problem in the local area, 2009-10 and 2010-11
7
13
6
10
11
12
12
12
13
18
7
15
7
12
18
14
14
18
16
15
0 5 10 15 20 25 30
All
All ethnic minority groups
White
Chinese/Other
Black African
Indian
Black Caribbean
Pakistani
Mixed Race
Bangladeshi
Percentage
2010-11 2009-10
• Table 19: Whether racial or religious harassment is a problem in the local area, by ethnicity, religious affiliation, sex and age, 2007-08 to 2010-11.
Cohesion Research 20

Perceptions of prejudice (England and Wales)
In 2010-11, 44 per cent of people in England and Wales thought that there was more racial prejudice today than there was five years ago. This is lower than all levels from 2003 to 2009-10, and there has been a year on year decrease since the peak of 56% in 2007-08.
Forty-four per cent of people also thought that there was more religious prejudice today than there was five years ago. This represents a year on year decline since 2008-09 (from 52% in 2008-09 to 46% in 2009-10)5 (Figure 18).
Figure 18: Proportions of people saying there is more prejudice today compared with five years ago, 2001 to 2010-11
4347 48
56
5047
44
52
4644
0
10
20
30
40
50
60
70
80
90
100
2001 2003 2005 2007-08 2008-09 2009-10 2010-11
Perc
enta
ge
Racial prejudice
Religious prejudice
White people were more likely to think that levels of racial prejudice had increased than people from ethnic minority backgrounds (47% compared with 23%) and were also more likely to think that levels of religious prejudice had increased (45% compared with 33%).
• Table 20: Perceptions of racial and religious prejudice today compared with five years
ago, by ethnicity, 2001 to 2010-11.
5 This question was first asked in 2008-09
Cohesion Research 21

Organisational discrimination (England and Wales)
In 2010-11, 22 per cent of people thought that they would be treated worse than people of other races by at least one of eight public service organisations6. This was lower than levels from 2003 to 2008-09 (between 28% and 30%) but unchanged on 2009-10. Nine per cent of people thought they would be treated worse than people of other races by at least one of five criminal justice system organisations7, which was lower than in all previous years from 2001 to 2008-09 (between 11% and 13%) but unchanged on 2009-10. Of the eight public sector organisations, council housing departments or housing associations were most likely to be thought of as discriminatory on the basis of race in 2010-11 (18%). The police were second most likely (6%) (Figure 19).
Figure 19: Whether people feel they would be treated worse than people of other races by public service organisations, 2009-10 and 2010-11
22
9
2
3
3
3
5
5
6
18
23
10
2
3
3
3
5
5
6
18
0 10 20 30 40 50 60 70 80 90 100
At least one of of the eight organisations
At least one of the five CJS organisations
Local GP
Probation Service
Prison Service
Local school
Crown Prosecution Service
Courts
Police
Housing
Percentage
2010-11 2009-10
6 The eight organisations looked at were the police, the prison service, the courts, the Crown Prosecution Service, the probation service, a council housing department or housing association, a local GP and a local school. 7 The Criminal Justice System organisations are the police, the prison service, the courts, the Crown Prosecution Service and the probation service.
Cohesion Research 22

People from ethnic minority backgrounds were more likely than White people to feel that they would be treated worse by at least one of the five criminal justice system organisations (15% compared to 9%). However, white people were more likely to think they had been treated worse than people from ethnic minority organisations by at least one of the eight public service organisations (23% compared to 19%). This difference appeared to be driven largely by perceptions of discriminatory treatment by council housing departments or housing associations, as detailed below.
Of the individual organisations, only council housing departments or housing associations were more likely to be cited as discriminatory on the basis of race by White people than by people of ethnic minority backgrounds (20% compared with 6%). Organisations that were more likely to be cited as discriminatory by people from ethnic minority backgrounds than by White people were: the police (12% compared with 5%), the prison service (8% compared with 2%), the Crown Prosecution Service (6% compared with 5%) and the probation service (5% compared with 2%), explaining the overall finding on criminal justice system organisations described in the above paragraph. There were no significant differences by ethnicity for any of the other organisations. • Table 21: Whether people feel they would be treated worse than people of other races by
public service organisations, by ethnicity, 2001 to 2010-11.
Labour market discrimination (England and Wales)8
Experience of discrimination in being turned down for a job in the last five years9
In 2010-11, 6 per cent of people felt they had experienced discrimination in the labour market in the last five years by being refused or turned down for a job. This was unchanged on previous years.
One per cent of people felt they had been discriminated against when turned down for a job on the grounds of their gender, though there was no difference in the proportions of men and women who felt they had experienced this form of discrimination.
Two per cent of people felt they had experienced labour market discrimination in being turned down for a job because of their age. Levels were higher amongst those aged 50 years and over (4%) than for those aged 25 to 34 years (1%) and for those aged 35 to 49 years (2%). There was no different to levels reported by 16-24 year olds (3%).
Two per cent of people felt they had experienced labour market discrimination by being turned down for a job because of their race. People from ethnic minority backgrounds (6%) were more likely to have felt they had experienced this form of discrimination than White people (1%). One per cent of people felt they had experienced labour market discrimination by being turned down for a job because of their colour. People from ethnic minority
8 The questions used to measure labour market discrimination changed at the beginning of the 2008-09 Survey. 9 All percentages are expressed as a proportion of people who are currently, or have been, in paid work as an employee or who have looked for work as an employee in the last five years.
Cohesion Research 23

backgrounds (5%) were more likely to have felt they had experienced this form of discrimination than White people (less than 0.5%).
Fewer than 0.5 per cent of all people felt they had experienced labour market discrimination by being turned down for a job because of their religion or beliefs10.
One per cent of people overall felt they had been discriminated against when turned down for a job because of disability. Four per cent of people with a long-term limiting illness or disability felt they had experienced this form of discrimination, which was higher than for those without a disability (less than 0.5%).
Less than 0.5 per cent of people overall felt they had experienced labour market discrimination by being turned down for a job because of their sexual orientation10.
• Table 22: Reasons for being discriminated against when refused a job, by equality strands, 2008-09 to 2010-11.
Experience of discrimination in seeking promotion in the last five years11
In 2010-11, 6 per cent of all people in England and Wales who had worked as an employee in the last five years felt they had been discriminated against with regard to promotion or progression. This was unchanged on 2008-09 and 2009-10.
One per cent of people felt they had experienced discrimination because of their gender when being turned down for a promotion. A higher proportion of women felt they had experienced this form of discrimination than men (1% compared to less than 0.5%).
One per cent of people felt they had experienced discrimination because of their age when being turned down for a promotion. People aged 50 years and over (3%) were more likely to feel they had experienced discrimination due to their age when seeking promotion than those aged 25 to 34 years and those aged 35 to 49 years (both 1%). There was no difference to levels reported by 16-24 year olds (2%).
One per cent of people overall felt they had experienced discrimination due to their race when seeking promotion, which was higher than those reporting this kind of discrimination in 2009-10 (1%)12. A higher proportion of people from ethnic minority backgrounds (6%) felt they had experienced this form of discrimination than White people (1%). One per cent of people felt they had experienced discrimination because of their colour when being turned down for a promotion; a higher proportion of people from ethnic minority backgrounds (4%) felt they had experienced this form of discrimination than White people (less than 0.5%).
10 More detailed breakdown of these figures is not included because of small sample sizes. 11 All percentages are expressed as a proportion of people who are currently, or who have been, an employee in paid work in the last five years. 12 The percentage of people who felt they had experienced discrimination due to their race when seeking promotion was 1% in both 2009-10 and 2010-11, but statistical significance testing shows the 2010-11 figure was higher than the 2009-10 figure.
Cohesion Research 24

Less than 0.5 per cent of people overall felt they had experienced labour market discrimination by being turned down for a promotion because of their religion or beliefs13.
Overall, less than 0.5 per cent of people felt they had experienced discrimination because of their disability when being turned down for a promotion. Two per cent of people with a long-term limiting illness or disability felt they had experienced this form of discrimination, a higher level than for those without a disability (less than 0.5%).
Less than 0.5 per cent of people overall felt they had experienced labour market discrimination by being turned down for a promotion because of their sexual orientation14.
• Table 23: Reasons for being discriminated against with regards to promotion, by equality
strands, 2008-09 to 2010-11.
13 More detailed breakdown of these figures is not included because of small sample sizes. 14 More detailed breakdown of these figures is not included because of small sample sizes.
Cohesion Research 25

4. Experimental statistics15: Attitudes to Violent Extremism (England and Wales)
In 2010-11, the majority of people rejected (identified as “always wrong”) the four types of violent extremism16 covered in the survey. Eighty-seven per cent of people rejected general17 violent extremism, 96 per cent rejected the use of violent extremism in the name of religion (to protest or achieve a goal), 94 per cent of people rejected political campaigners writing and distributing leaflets that encouraged violence towards different ethnic groups and 84 per cent rejected using violence to protect animals. Levels of rejection were higher than in 2009-10 for all types of violent extremism covered in the survey.
• Table 24: Attitudes towards violent extremism, 2009-10 and 2010-11 (Experimental
statistics).
15 The violent extremism data are published here as experimental statistics in recognition of the fact that the statistics are new and subject to testing in terms of their volatility and ability to meet customer needs. Further information on the purpose and nature of experimental statistics is available from the Office for National Statistics. 16 Violent extremism is defined as taking actions to cause injury or death to people in order to make a political protest. 17 General violent extremism is measured through the question ‘How right or wrong do you think it is for people to use violent extremism in Britain to protest against things they think are very unfair or unjust?’
Cohesion Research 26

Background notes
Definitions of key terms
1. Community cohesion: The key community cohesion indicator used in the Statistical Release is the proportion of people who agree that their local area (defined as 15-20 minutes walking distance) is a place where people from different backgrounds get on well together.
Note: In the 2007 Spending Review period, Public Service Agreement 21 defined ‘community cohesion’ more broadly. It had three strands:
• Indicator 1 The percentage of people who believe people from different backgrounds get on well together in their local area.
• Indicator 2 The percentage of people who have meaningful interactions with people from different backgrounds (see definition below).
• Indicator 3 The percentage of people who feel that they belong to their neighbourhood.
2. Meaningful interaction: Respondents are asked how many times they have mixed
socially with people from different ethnic and religious groups to themselves in different areas of their lives. Mixing socially is defined as ‘mixing with people on a personal level by having informal conversations with them at, for example, the shops, your work or a child’s school, as well as meeting up with people to socialise’. However, it excludes ‘situations where you’ve interacted with people for work or business, for example just to buy something’.
3. Formal volunteering: Giving unpaid help through groups, clubs or organisations to
benefit other people or the environment.
4. Informal volunteering: Giving unpaid help as an individual to people who are not relatives.
5. Civic participation: Engaging in one of the following activities:
– contacting a local councillor, Member of Parliament, member of the Greater
London Assembly or National Assembly for Wales – contacting a public official working for a local council, central Government,
Greater London Assembly or National Assembly for Wales – attending a public meeting or rally; – taking part in a public demonstration or protest; or – signing a petition.
Cohesion Research 27

6. Civic activism: Involvement either in direct decision-making about local services or issues, or in the actual provision of these services by taking on a role such as a local councillor, school governor or magistrate.
7. Civic consultation: Active engagement in consultation about local services or
issues through activities such as attending a consultation group or completing a questionnaire about these services.
Content of report
8. The quarterly Statistical Releases are designed to report on the key topic areas
within the Survey and include data supporting the Department for Communities and Local Government’s and Other Government Department’s key priorities. However, the Citizenship Survey covers many other topics which cannot all be incorporated into a Release such as this, so the underlying data are made available through the University of Essex data archive (please see details below).
9. Anonymised data are available to download through the University of Essex Data
Archive (www.data-archive.ac.uk).
Data quality
10. The 2010-11 Citizenship Survey, run by Ipsos MORI and TNS-BMRB on behalf of the Communities Analysis Division within the Department for Communities and Local Government, is a household survey covering a representative core sample of 10,000 adults in England and Wales each year. There is also an ethnic minority boost sample of 5,000 and a Muslim boost sample of 1,200 each year, to ensure that the views of these groups are robustly represented. It asks about a range of issues including views about the local area, community cohesion, racial and religious prejudice and discrimination, values, interaction/mixing, political efficacy, civic engagement, volunteering and charitable giving.
11. The data are collected through face-to-face interviews. Since 2007-08, the survey
has moved to a continuous design, allowing the provision of headline findings on a quarterly basis. This Statistical Release is based on the 2010-11 survey (April 2010 to March 2011), which is made up of 10,307 core interviews, an additional 4,721 interviews with people from ethnic minority groups and an additional 842 interviews with Muslim people.
12. The contents of this Release are designated as 'National Statistics' which means that
they are judged to be fully compliant with the high professional standards set out in the Code of Practice for Official Statistics.
13. The data are weighted to correct for unequal sampling probabilities and non-
response by sub-group. The weighting ensures that the sample matches the 2001 census population figures in terms of their age, sex and regional distribution.
14. Data from the Citizenship Survey are not subject to a schedule of revisions. If any
revisions do occur any outputs based on this data will be updated as soon as possible and users will be notified of these changes.
Cohesion Research 28

15. The Citizenship Survey is measured against a set of quality standards. Details of
these quality indicators are available in the full technical report published for each year of the survey.
Notes on analysis and data presentation
16. For most measures, the core sample provides more robust estimates relating to the population as a whole, so data are based on the core sample. Data presented by ethnic group or religious affiliation are, however, based on the combined sample (including the core and sample boosts); used in order to look at robust estimates within ethnic and religious sub-groups.
17. The data relating to labour market discrimination, prejudice, organisational
discrimination and violent extremism refer to England and Wales, whereas the data on other topics relate to England only. This reflects the coverage of the Department for Communities and Local Government policy responsibilities.
18. Where changes over time have been reported in this statistical release, these reflect
the availability of data for individual questions. The Citizenship Survey was first carried out in 2001, but some questions covered by this release were not introduced until later. Those on cohesion were not introduced until 2003, those on civic consultation and activism until 2005 and those on meaningful interaction in 2007-08.
19. All reported differences (between groups or over time) in the release are
statistically significant at the 5 per cent level. The level of change required to observe a statistical significant difference varies depending on the number of respondents the percentage is based on; whether the core or combined sample is being used; and the observed percentage itself. A ‘ready reckoner’ is provided with the Excel tables, this can be used to test for statistical significance at the 95% level between percentages for other figures in the tables. For any testing that requires design factors, a standard 1.3 can be used for the core sample (or 1.2 prior to 2009-10) and 1.6 for the combined sample (or 1.4 prior to 2009-10). Further information on design factors can be found in the Citizenship Survey Technical Reports, which can be found at: http://www.communities.gov.uk/communities/research/citizenshipsurvey/technicalinformation/
20. Cells in a table based on a small number of respondents are more likely to breach
confidentiality; these cells are also likely to be unreliable. Confidentiality protection is provided by releasing only weighted estimates and by suppressing the values for unsafe cells. Previously this was done by suppressing figures based on a sample size of fewer than 30 and for individual cells based on fewer than 5 individuals; this is now done only on overall sample sizes of fewer than 30. This change has been made to allow greater data availability but will still maintain effective disclosure controls.
Cohesion Research 29

User consultation
21. Users’ comments on any issues relating to this statistical release are welcomed and encouraged. Responses should be emailed to the [email protected] e-mail account.
Future of the Citizenship Survey 22. Following the Secretary of State's consideration of the responses received to the
Department's technical consultation on the future of the Citizenship Survey, future surveys will be discontinued in order to make substantial cost savings. This means that the 2010-11 Survey is the final survey in the field. This is the final Quarterly Statistical Release covering the full 2010-11 period, the 2010-11 Citizenship Survey anonymised dataset also will be publicly available from the UK Data Archive website (in due course), however, 2010-11 annual topic reports will not be produced.
Further information
25. This Statistical Release can be accessed and all text, tables and charts downloaded electronically, from the Department for Communities and Local Government website: www.communities.gov.uk/statistics/
Further details are available from: Citizenship Survey Team Communities and Local Government, Zone 7/E8, Eland House, Bressenden Place, London, SW1E 5DU. Telephone 0303 444 1333 Email: [email protected]
Cohesion Research 30

List of tables
The full set of tables (Citizenship Survey: 2010-11) is available.
Community Action
Table 1: Whether people feel able to influence decisions affecting their local area and Britain, 2001 to 2010-11
Table 2: Whether people feel able to influence decisions affecting their local area
and Britain, by ethnicity, religious affiliation, sex and age, 2010-11 Table 3: How important is it for you personally to feel you can influence decisions in
your local area, 2007-08 to 2010-11 Table 4: Whether people would like to be more involved in decisions made by their
local council, 2007-08 to 2010-11 Table 5: Participation in civic engagement and voluntary activities, 2001 to 2010-11 Table 6: Participation in civic engagement and formal volunteering at least once in
the last year, by ethnicity, religious affiliation, sex, age and disability, 2007-08 to 2010-11
Table 7: Participation in voluntary activities, by ethnicity, age, employment status and
Government Office Region, 2009-10 and 2010-11 Table 8: Whether people trust institutions ‘a lot’ or ‘a fair amount’, 2001 to 2010-11
Community spirit
Table 9: Community cohesion, by ethnicity, religious affiliation, Government Office
Region, sex and age, 2003 to 2010-11 Table 10: Whether people feel that they belong strongly to their neighbourhood and
Britain, 2003 to 2010-11 Table 11: Whether people feel that they belong strongly to their neighbourhood and
Britain, by ethnicity, religious affiliation, sex and age, 2009-10 and 2010-11 Table 12: Mixing with people from different ethnic or religious backgrounds by
ethnicity, religious affiliation, age and sex (percentage mixing at least once a month), 2007-08 to 2010-11
Table 13: Mixing with people from different ethnic or religious backgrounds (by sphere
of mixing), by ethnicity, religious affiliation, age and sex, 2010-11 Table 14: Satisfaction with local area, by ethnicity, sex and age, 2007-08 to 2010-11 Table 15: Whether area has got better or worse, 2007-08 to 2010-11
Cohesion Research 31

Table 16: Whether the number of immigrants coming to Britain should be increased,
reduced or remain the same, 2007-08 to 2010-11 Table 17: How worried are people about becoming the victim of crime, 2005 to 2010-
11 Table 18: Whether people feel safe walking alone in their neighbourhood after dark,
2001 to 2010-11
Harassment and discrimination
Table 19: Whether racial or religious harassment is a problem in the local area, by ethnicity, religious affiliation, sex and age, 2007-08 to 2010-11.
Table 20: Perceptions of racial and religious prejudice today compared with five years
ago, by ethnicity, 2001 to 2010-11 Table 21: Whether people feel they would be treated worse than people of other races
by public service organisations, by ethnicity, 2001 to 2010-11 Table 22: Reasons for being discriminated against when refused a job, by equality
strands, 2008-09 to 2010-11 Table 23: Reasons for being discriminated against with regards to promotion, by
equality strands, 2008-09 to 2010-11 Experimental statistics: Attitudes to Violent Extremism Table 24: Attitudes towards violent extremism, 2009-10 and 2010-11 (Experimental
statistics)
Department for Communities and Local Government © Crown Copyright 2011 September 2011 ISBN: 978 1 4098 3170 9
Cohesion Research 32