Embed Size (px)
Citation preview

CITIZEN’S FINANCIAL
REPORT
2020
OFFICE OF THE CHIEF FINANCIAL OFFICERJohn A. Wilson Building1350 Pennsylvania Avenue, NW, Suite 203Washington, DC 20004tel 202.727.2476fax 202.727.1643cfo.dc.gov
YEAR ENDED SEPTEMBER 30, 2020
GOVERNMENT OF THE DISTRICT OF COLUMBIA
MURIEL BOWSER MAYOR
JEFFREY S. DEWITT CHIEF FINANCIAL OFFICER
GOVERNMENT OF THE DISTRICT OF COLUMBIA OFFICE OF THE CHIEF FINANCIAL OFFICER
YEAR ENDED SEPTEMBER 30, 2020
247954_DC_PAFR_saddlestitch.indd All Pages247954_DC_PAFR_saddlestitch.indd All Pages 1/20/21 3:17 PM1/20/21 3:17 PM

February 1, 2021
Dear Citizens of the District of Columbia:
We are pleased to present the Citizen’s Financial Report on the financial condition of the Government of the District of Columbia (District) for the fiscal year (FY) ended September 30, 2020. Though FY 2020 was filled with unique challenges due to the Coronavirus (COVID-19) global pandemic, we are happy to report that we were able to successfully close the city’s books and timely issue the FY 2020 audited financial statements and this report.
The purpose of this Citizen’s Financial Report, which is also referred to as the Popular Annual Financial Report (PAFR), is to summarize the financial information presented in the District’s FY 2020 Comprehensive Annual Financial Report (CAFR). The CAFR is prepared in accordance with U.S. generally accepted accounting principles (GAAP) and is independently audited. This PAFR is intended to simplify but not replace the CAFR.
As this PAFR shows, despite the unprecedented challenges of FY 2020, the District's finances remained strong. As such, we were able to provide essential services and support to residents and businesses during the global health crisis. As our economy continues to be impacted by COVID-19, we are committed to taking the necessary measures to ensure the District’s continued ability to sustain operations and provide necessary programs and services.
If you would like more information regarding the District of Columbia Government and its various departments and agencies, please visit the city's website at: www.dc.gov. Additional information regarding the city's finances may be found at: www.cfo.dc.gov.
Respectfully submitted,
Muriel Bowser Jeffrey S. DeWitt Bill Slack Mayor Chief Financial Officer Deputy CFO and Controller

The Government Finance Officers Association of the United States and Canada (GFOA) has given an Award for Outstanding Achievement in Popular Annual Financial Reporting to the District of Columbia for its Popular Annual Financial Report, for the fiscal year ended September 30, 2019. The Award for Outstanding Achievement in Popular Annual Financial Reporting is a prestigious national award recognizing conformance with the highest standards for preparation of state and local government popular reports.
In order to receive an Award for Outstanding Achievement in Popular Annual Financial Reporting, a governmental unit must publish a Popular Annual Financial Report, the contents of which conform to program standards of creativity, presentation, understandability, and reader appeal.
An Award for Outstanding Achievement in Popular Annual Financial Reporting is valid for a period of one year only. The District of Columbia has received this award for the last seventeen consecutive fiscal years. We believe our current report continues to conform to the Popular Annual Financial Reporting requirements, and it will be submitted to GFOA for consideration.
District of Columbia FY 2020 Citizen’s Financial Report 1
District of Columbia Citizen’s Financial Report
Fiscal Year Ended September 30, 2020
Table of Contents Introduction .......................................................2 Elected Officials ..................................................3 Population Trends ...............................................4 Employment Trends ............................................4 Minimum Wage ..................................................5 Tourism and Hospitality ......................................5 DC Major Tax Rates .............................................6 FY 2020 Financial Highlights ................................6 Where the Money Comes From ...........................7 Where the Money Goes ......................................9 Debt Management ..............................................10 Financial Statements ...........................................11 Coronavirus.dc.gov .............................................13 Martin Luther King Jr. Memorial Library Reopening ..........................................................14 The Arches Over the New Frederick Douglass Memorial Bridge .................................................15 District Wharf Phase 2 .........................................15 Operating Statistics .............................................16 Outlook for FY 2021 ............................................16 Glossary..............................................................17
This Popular Annual Financial Report (PAFR) is a report for the citizens of the District of Columbia. It provides information about the District’s financial condition without overwhelming detail and technical accounting terminology. The information provided is derived from the District’s Comprehensive Annual Financial Report (CAFR), which is prepared in accordance with U.S. generally accepted accounting principles (GAAP). A copy of the District’s Fiscal Year (FY) 2020 CAFR and PAFR may be obtained from: Office of the Chief Financial Officer Office of Financial Operations & Systems 1100 4th Street, SW, 8th Floor Washington, DC 20024 (202) 442-8200 The FY 2020 CAFR and PAFR may also be viewed on the District of Columbia’s Chief Financial Officer’s website at: www.cfo.dc.gov.
Welcome Xiao Qi Ji! The newest male giant panda cub born on August 21, 2020 at the Smithsonian National Zoo in Washington, DC.

2 District of Columbia FY 2020 Citizen’s Financial Report
Introduction Washington, District of Columbia, commonly referred to as Washington, D.C., the District or simply DC, is the capital of the United States (U.S.). It is in the Mid-Atlantic East Coast region of the U.S. with a total area of 68.3 square miles, of which 61.4 square miles are land and 6.9 square miles are water. It is bordered by Montgomery County, Maryland, to the northwest; Prince George’s County, Maryland, to the east; and Arlington County and Alexandria City, Virginia, to the south and west. The centers of all three branches of the federal government of the United States are in the District: the legislative branch (Congress), the executive branch (President), and the judiciary branch (Supreme Court). In 1973, Congress passed the District of Columbia Home Rule Act, which provides for a locally elected Mayor and a 13-member council. However, Congress maintains authority over the city and may overturn local laws. District residents also elect a non-voting, at-large Congressional Delegate to the U.S. House of Representatives but the District has no representation in the U.S. Senate. The fiscal year of the District begins on October 1 and ends on September 30. This report presents financial information for the District’s fiscal year ended September 30, 2020. It provides a comprehensive view of the District’s financial activities (both governmental and business-type activities). Such activities include those reported in the general fund, federal and private resources fund, other special revenue funds, capital projects fund, and three proprietary funds which issue audited financial statements separately from the District: (1) Office of Lottery and Gaming, (2) Not-for-Profit Hospital Corporation, and (3) Unemployment Compensation Fund. This Citizen's Report, the focus of which extends beyond the general fund, gives the full financial picture of the District in a way that is similar to how investors and bond rating agencies view the District. For more detailed information on the general fund or other fund financial statements or budgetary reports, please refer to the District’s much broader Comprehensive Annual Financial Report (CAFR), which can be found at: www.cfo.dc.gov. The financial reporting entity of the District includes all the government’s agencies and its five discretely presented component units. The District also reports two blended component units whose financial position and results of operations are intertwined with those reported in the District’s financial statements. For more information or to obtain the audited financial statements of these entities, please contact their offices or access the websites shown below:
Discretely Presented Component Units
District of Columbia Green Finance Authority (202) 535-2600 https://dcgreenbank.org
University of the District of Columbia (202) 274-5000 https://www.udc.edu
Health Benefit Exchange Authority (202) 715-7576 https://hbx.dc.gov
Washington Convention and Sports Authority (Events DC) (202) 249-3000 http://eventsdc.com
Housing Finance Agency (202) 777-1600 http://www.dchfa.org
Blended Component Units
Tobacco Settlement Financing Corporation (202) 727-6055
Not-for-Profit Hospital Corporation (United Medical Center) (202) 574-6000

District of Columbia FY 2020 Citizen’s Financial Report 3
Elected Officials as of January 2, 2021
Muriel Bowser Mayor
Karl A. Racine Attorney General
U.S. House of Representatives
Eleanor Holmes Norton D.C. Delegate
D.C. Council (Composed of a Chairman, 4 At-Large members, and a member from each of the District’s 8 Wards)
Phil Mendelson Chairman
Anita Bonds At-Large
Christina D. Henderson At-Large
Elissa Silverman At-Large
Robert C. White, Jr. At-Large
Brianne K. Nadeau Ward 1
Brooke Pinto Ward 2
Mary M. Cheh Ward 3
Janeese Lewis George Ward 4
Kenyan R. McDuffie Ward 5
Charles Allen Ward 6
Vincent C. Gray Ward 7
Trayon White, Sr. Ward 8

4 District of Columbia FY 2020 Citizen’s Financial Report
Population Trends Each year, the U.S. Census Bureau releases population estimates as of July 1st of the calendar year and officially revises such estimates annually. On a quarterly basis, the U.S. Bureau of Economic Analysis (BEA) releases population data based on information provided by the U.S. Census Bureau. The BEA reported that there were 710,964 residents in the District as of the third quarter of calendar year 2020. This represents an increase of 4,530, or 0.6% from the revised estimate of 706,434 as of the third quarter of 2019.
Source: U.S. Bureau of Economic Analysis (BEA)
Employment Trends As the economy declined in 2020 as a result of the COVID-19 pandemic, employment within the District was severely impacted. Total employment as of September 2020 decreased to approximately 743,700 from the revised 797,800 as of September 2019. The largest decline was in the leisure and hospitality industry, which suffered a 43.0% decline. The unemployment rate in September 2020 spiked to 8.7% from the 5.3% (seasonally adjusted) rate reported in September 2019. Subsequently, new unemployment insurance claims were 309.0% higher in September 2020 compared to a year ago. As the nation's capital, Washington, D.C. is the headquarters for most federal government departments and agencies. The September 2020 federal workforce in the Washington Metropolitan Area totaled 376,500; with approximately 200,800 federal employees located in Washington, D.C. and 175,700 additional federal employees located elsewhere in the Washington Metropolitan Area.
Source: DC Department of Employment Services and U.S. Bureau of Labor Statistics
0.0%
2.0%
4.0%
6.0%
8.0%
10.0%
12.0%
680,000700,000720,000740,000760,000780,000800,000820,000
2011 2012 2013 2014 2015 2016 2017 2018 2019 2020Calendar Year
Employment and UnemploymentFY 2011 - FY 2020
Employment Unemployment Rate

District of Columbia FY 2020 Citizen’s Financial Report 5
Minimum Wage Under the Fair Shot Minimum Wage Act, signed by the Mayor in 2016, the minimum wage was increased in yearly increments over four years. The last incremental increase became effective on July 1, 2020. On that date, the minimum wage for District workers increased to $15.00 per hour and the minimum wage for tipped workers increased to $5.00 per hour. Beginning in 2021, the hourly minimum wage will increase each successive year in proportion to the increase in the Consumer Price Index.
Non-Tipped Workers Tipped Workers
$15.00 per hour beginning July 1, 2020 $5.00 per hour beginning July 1, 2020
Tourism and Hospitality
Washington, D.C. is a world-class city that has evolved into a premier destination for cultural, culinary, and entertainment experiences. Millions of U.S. citizens and international tourists visit the District’s more than 400 museums, war memorials, foreign embassies, and other historical landmarks each year. The hospitality industry is typically one of DC’s strongest sectors. It includes 140 hotels with more than 33,000 rooms. In calendar year 2019, approximately 22.8
million domestic visitors and 1.8 million international visitors traveled to the District.
Travel and tourism supported 78,266 jobs in the District, generating approximately $4.5 billion in wages.
Visitors spent approximately $8.2 billion in 2019, an increase of $331.0 million, over the prior year. A breakdown of visitor spending by category is as follows:
$ 2.9 billion, Lodging $ 2.5 billion, Food and Beverage $ 1.2 billion, Entertainment $ 932 million, Shopping/Retail $ 642 million, Transportation
Tourism data for calendar year 2020 was
not available at the time of this report’s release. However, it is anticipated that significant declines will be reported as a result of the global pandemic.
Source: Destination DC
Total Visitation to the District (2015 – 2019)
6 District of Columbia FY 2020 Citizen’s Financial Report
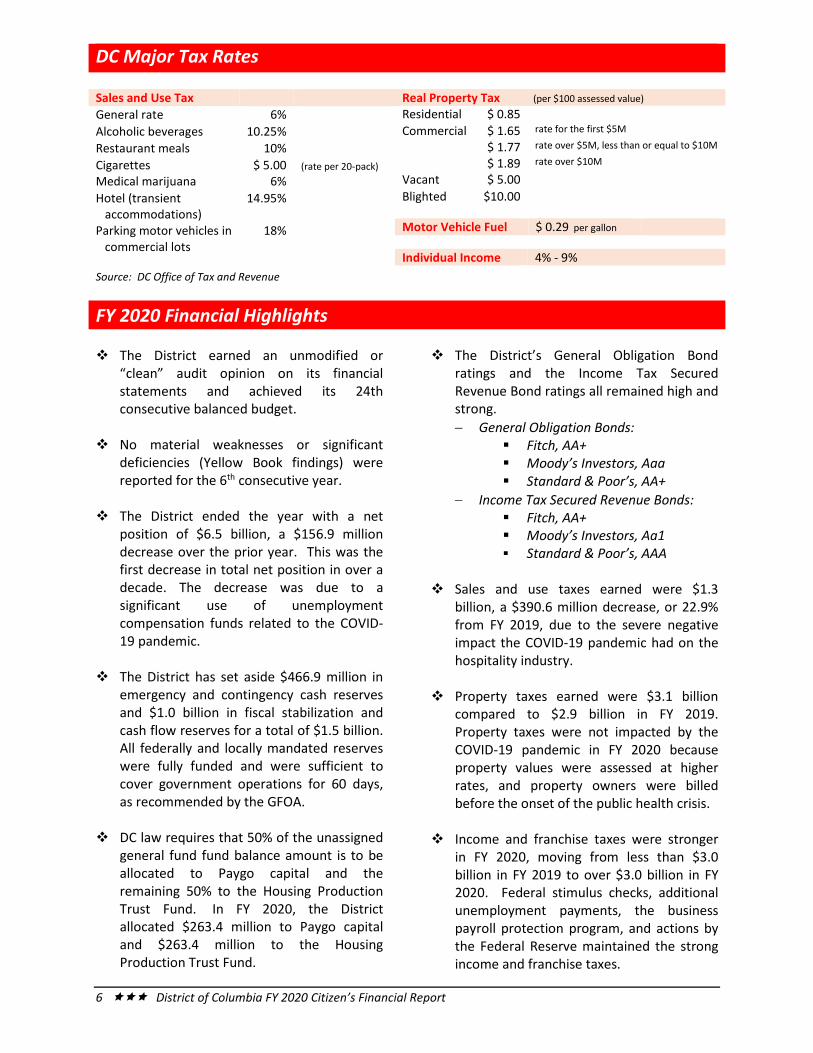
DC Major Tax Rates
Sales and Use Tax General rate 6% Alcoholic beverages 10.25% Restaurant meals 10% Cigarettes $ 5.00 (rate per 20-pack) Medical marijuana 6% Hotel (transient accommodations)
14.95%
Parking motor vehicles in commercial lots
18%
Real Property Tax (per $100 assessed value) Residential $ 0.85 Commercial $ 1.65 rate for the first $5M
$ 1.77 rate over $5M, less than or equal to $10M
$ 1.89 rate over $10M
Vacant $ 5.00 Blighted $10.00 Motor Vehicle Fuel $ 0.29 per gallon Individual Income 4% - 9%
Source: DC Office of Tax and Revenue
FY 2020 Financial Highlights The District earned an unmodified or
“clean” audit opinion on its financial statements and achieved its 24th consecutive balanced budget.
No material weaknesses or significant deficiencies (Yellow Book findings) were reported for the 6th consecutive year.
The District ended the year with a net
position of $6.5 billion, a $156.9 million decrease over the prior year. This was the first decrease in total net position in over a decade. The decrease was due to a significant use of unemployment compensation funds related to the COVID-19 pandemic.
The District has set aside $466.9 million in
emergency and contingency cash reserves and $1.0 billion in fiscal stabilization and cash flow reserves for a total of $1.5 billion. All federally and locally mandated reserves were fully funded and were sufficient to cover government operations for 60 days, as recommended by the GFOA.
DC law requires that 50% of the unassigned
general fund fund balance amount is to be allocated to Paygo capital and the remaining 50% to the Housing Production Trust Fund. In FY 2020, the District allocated $263.4 million to Paygo capital and $263.4 million to the Housing Production Trust Fund.
The District’s General Obligation Bond ratings and the Income Tax Secured Revenue Bond ratings all remained high and strong. − General Obligation Bonds:
Fitch, AA+ Moody’s Investors, Aaa Standard & Poor’s, AA+
− Income Tax Secured Revenue Bonds: Fitch, AA+ Moody’s Investors, Aa1 Standard & Poor’s, AAA
Sales and use taxes earned were $1.3
billion, a $390.6 million decrease, or 22.9% from FY 2019, due to the severe negative impact the COVID-19 pandemic had on the hospitality industry.
Property taxes earned were $3.1 billion
compared to $2.9 billion in FY 2019. Property taxes were not impacted by the COVID-19 pandemic in FY 2020 because property values were assessed at higher rates, and property owners were billed before the onset of the public health crisis.
Income and franchise taxes were stronger
in FY 2020, moving from less than $3.0 billion in FY 2019 to over $3.0 billion in FY 2020. Federal stimulus checks, additional unemployment payments, the business payroll protection program, and actions by the Federal Reserve maintained the strong income and franchise taxes.

District of Columbia FY 2020 Citizen’s Financial Report 7
Where the Money Comes From
Property taxes18.9% Sales and use taxes
7.9%
Income and franchise taxes18.3%
Other taxes6.1%
Non-tax general revenues3.7%
Charges for services7.3%
Operating grants and contributions
36.0%
Capital grants and contributions
1.8%
REVENUES $16.4 BILLION
District revenues include amounts accounted for in all funds - governmental (general fund, special revenue funds, and capital projects fund) and proprietary funds (Lottery and Gaming, Unemployment Compensation, and Not-for-Profit Hospital Corporation). These revenues do not include the discretely presented component units listed on page 2, which totaled $436 million in FY 2020. The major sources of the District’s revenues are taxes and operating grants and contributions. Taxes earned in FY 2020 represented 51.2% of total revenues. Revenues received from the federal government and other sources include:
Operating grants and contributions:
Amounts received from grantors/donors, which may be used to support the District’s day-to-day operations, programs, and activities. These include federal funding received for Medicaid which totaled $2.6 billion in FY 2020. The District also received
$1.4 billion from the Coronavirus Aid, Relief, and Economic Security (CARES) Act and other related federal assistances. Of this amount, $970 million was used to support the expansion of the unemployment insurance for District of Columbia workers.
Capital grants and contributions: Amounts received from grantors/donors to support the acquisition of property and equipment, and the construction of buildings or other infrastructure.
Charges for services: Fees assessed in exchange for a service that is rendered (e.g., driver license fees, motor vehicle tag renewal fees, parking fees, etc.).
Non-tax general revenues: Other sources of
revenue which are generated by the government’s operations (e.g., investment earnings, etc.).
Other 11.6%
Medicaid 15.9%
COVID-19 Relief 8.5%

8 District of Columbia FY 2020 Citizen’s Financial Report
Total Revenues in FY 2020 = $16.4 Billion
Tax Revenues Earned in FY 2020 ($ in Billions) Non-Tax Revenues Earned in FY 2020 ($ in Billions)
Property Taxes $ 3.1 Operating Grants & Contributions $ 5.9 Sales & Use Taxes 1.3 Medicaid = $2.6 COVID-19 Relief = $1.4 Other = $1.9 Income & Franchise Taxes 3.0 Capital Grants & Contributions 0.3 Other Taxes 1.0 Charges for Services 1.2 Total Tax Revenues $ 8.4 Non-Tax General Revenues 0.6 Total Non-Tax Revenues $ 8.0

District of Columbia FY 2020 Citizen’s Financial Report 9
Where the Money Goes
Governmental direction and support 7.8% Economic
development and regulation 4.8%
Public safety and justice 11.5%
Public education system 18.7%
Human support services33.1%
Public works7.2%
Public transportation
2.4%
Interest on long-term debt 2.4%
Enterprise activities
12.1%
EXPENSES $16.6 Billion
The District provides a broad range of services to its residents, including those normally provided by states and counties. These services include police, fire and emergency medical services, human support and welfare services, public education, and recreational activities. The District is also responsible for the construction and maintenance of highways, streets, buildings, parks, and other amenities. In FY 2020, the District’s total expenses were $16.6 billion. Human Support Services comprises the highest percentage of total expenses at 33.1%. These services are provided through Medicaid, Medicare, Temporary Assistance for Needy Families (TANF), Supplemental Nutrition Assistance Program (SNAP), and other programs promoting health and wellness, which benefit the District’s residents.
Expenses in FY 2020 ($ in Billions)
Governmental direction and support $ 1.3 Economic development and regulation 0.8 Public safety and justice 1.9 Public education system 3.1 Human support services 5.5 Public works 1.2 Public transportation 0.4 Interest on long-term debt 0.4 Enterprise activities 2.0
Total Expenses in FY 2020 $ 16.6
10 District of Columbia FY 2020 Citizen’s Financial Report
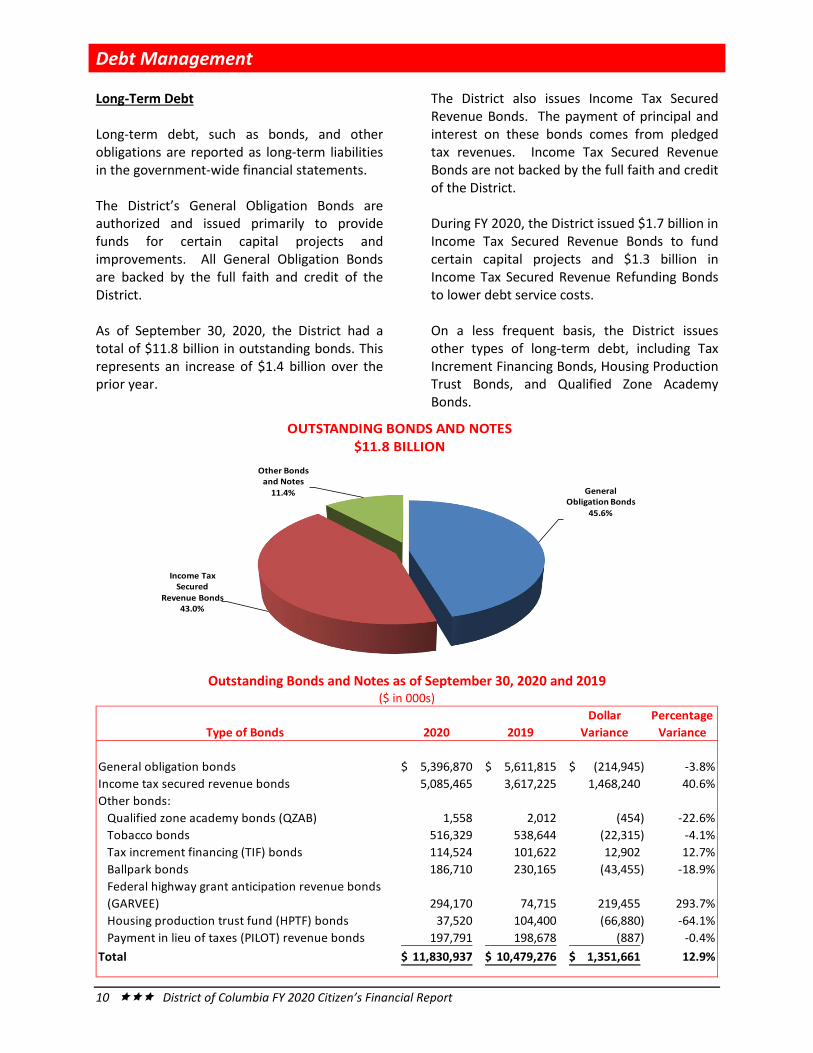
Debt Management Long-Term Debt Long-term debt, such as bonds, and other obligations are reported as long-term liabilities in the government-wide financial statements. The District’s General Obligation Bonds are authorized and issued primarily to provide funds for certain capital projects and improvements. All General Obligation Bonds are backed by the full faith and credit of the District. As of September 30, 2020, the District had a total of $11.8 billion in outstanding bonds. This represents an increase of $1.4 billion over the prior year.
The District also issues Income Tax Secured Revenue Bonds. The payment of principal and interest on these bonds comes from pledged tax revenues. Income Tax Secured Revenue Bonds are not backed by the full faith and credit of the District. During FY 2020, the District issued $1.7 billion in Income Tax Secured Revenue Bonds to fund certain capital projects and $1.3 billion in Income Tax Secured Revenue Refunding Bonds to lower debt service costs. On a less frequent basis, the District issues other types of long-term debt, including Tax Increment Financing Bonds, Housing Production Trust Bonds, and Qualified Zone Academy Bonds.
Outstanding Bonds and Notes as of September 30, 2020 and 2019 ($ in 000s)
Type of Bonds 2020 2019Dollar
VariancePercentage
Variance
General obligation bonds 5,396,870$ 5,611,815$ (214,945)$ -3.8%Income tax secured revenue bonds 5,085,465 3,617,225 1,468,240 40.6%Other bonds:
Qualified zone academy bonds (QZAB) 1,558 2,012 (454) -22.6%Tobacco bonds 516,329 538,644 (22,315) -4.1%Tax increment financing (TIF) bonds 114,524 101,622 12,902 12.7%
Ballpark bonds 186,710 230,165 (43,455) -18.9%Federal highway grant anticipation revenue bonds (GARVEE) 294,170 74,715 219,455 293.7%Housing production trust fund (HPTF) bonds 37,520 104,400 (66,880) -64.1%Payment in lieu of taxes (PILOT) revenue bonds 197,791 198,678 (887) -0.4%
Total 11,830,937$ 10,479,276$ 1,351,661$ 12.9%
General Obligation Bonds
45.6%
Income Tax Secured
Revenue Bonds43.0%
Other Bondsand Notes
11.4%
OUTSTANDING BONDS AND NOTES$11.8 BILLION

District of Columbia FY 2020 Citizen’s Financial Report 11
District Bond Ratings Rating agencies assess the credit quality of municipal issuers and assign a credit rating based on their analyses. The three primary rating agencies that rate municipal debt are: (1) Fitch Ratings; (2) Moody’s Investors Service; and (3) Standard & Poor’s Global Ratings. Each time the District issues new debt, the bond rating agencies assess the District’s financial condition and underlying credit worthiness and change their rating as warranted. See page 19 for the rating agencies’ complete rating scales. In FY 2020, for the third consecutive year, the District’s high ratings for both its General Obligation Bonds and the Income Tax Secured Revenue Bonds remained unchanged. These sustained ratings reflect the continued strength of the District’s economy despite the negative impact of the COVID-19 pandemic. Having high ratings also provides the District with a lower debt service cost.
The following tables present the District’s General Obligation Bond ratings and the Income Tax Secured Revenue Bond ratings for the past five fiscal years.
General Obligation Bonds 2016 2017 2018 2019 2020
Fitch Ratings AA AA AA+ AA+ AA+
Moody’s Investors Service Aa1 Aa1 Aaa Aaa Aaa
Standard & Poor’s Global Ratings
AA AA AA+ AA+ AA+
Income Tax Secured Revenue Bonds 2016 2017 2018 2019 2020
Fitch Ratings AA+ AA+ AA+ AA+ AA+
Moody’s Investors Service Aa1 Aa1 Aa1 Aa1 Aa1
Standard & Poor’s Global Ratings
AAA AAA AAA AAA AAA
Financial Statements The government-wide financial statements focus on all the District’s economic resources. The Statement of Net Position presents information on all the District’s assets plus deferred outflows of resources, and liabilities plus deferred inflows of resources, with the difference between the two reported as net position. The Statement of Activities summarizes both the gross and net cost of the governmental activities, business-type activities, and component units’ activities. Governmental activities show the District’s basic functional services, while business-type activities reflect enterprise operations where fees for services are expected to cover all or most of the costs of operations. • The Statement of Net Position and
Statement of Activities tables show comparative data for governmental
activities and business-type activities, and the totals for these two types of activities.
• Total assets increased by $1.8 billion mainly due to coronavirus relief funding received from the federal government to support the District’s pandemic response and increases in certain taxes (property taxes and income and franchise taxes). Continued investments in capital assets also contributed to the increase in total assets.
• The increase of $2.1 billion in total liabilities
resulted primarily from issuance of Income Tax Secured Revenue Bonds during fiscal year 2020 to finance capital improvement projects and refinance certain outstanding bonds to reduce total debt service costs.
• The combined total net position for the governmental activities and business-type activities decreased by 2.4%. This was the first decrease in total net position in over a

12 District of Columbia FY 2020 Citizen’s Financial Report
decade, mainly as a result of the use of reserves in the unemployment compensation fund.
• Driven by significant decreases in sales and
use taxes, and other taxes, general revenues decreased by $304.1 million. Due to the Coronavirus pandemic and measures implemented to prevent the spread of COVID-19, activities in hotels, restaurants, sports and entertainment venues, and retail outlets declined. As a result, sales and use tax revenues dropped dramatically in FY 2020. Other taxes such as deed recordation, deed transfer, and economic interest taxes, also declined due to the sluggish economy caused by the pandemic.
• The increase of $1.9 billion in operating
grants and contributions was due primarily to financial support received from the federal government to assist the District in its efforts to combat COVID-19. The District received $1.4 billion from the Coronavirus relief funding, 68.3% of which was used to expand unemployment programs for District of Columbia workers affected by the pandemic.
• The increase of $2.8 billion in expenses was
mainly due to increased spending in unemployment compensation, which
increased by $1.4 billion in FY 2020. This increase was due to an unprecedented number of claims being filed by eligible workers whose employment was discontinued as a result of the pandemic and the related economic downturn. Other significant increases were in public works, human support services, and public safety and justice. Public works expenses rose due to increased support of sustainable energy projects and programs and the Department of Energy and Environment’s required transfers to the Green Finance Authority. Human support services expenses increased as a result of the expansion of programs and services provided to recipients in response to the Coronavirus pandemic. Public safety and justice expenses increased due to the salaries and overtime paid to police officers and fire and emergency medical services personnel as part of the COVID-19 response efforts and due to the protests held in the District during the year.
• Each year, the Office of Lottery and Gaming transfers substantially all of its net income to the District. In FY 2020, it transferred $38.1 million of its income, which was a $7 million decrease from the prior year’s transfer of $45.1 million.
Statement of Net Position as of September 30, 2020
($ in 000s)
2020 2019 2020 2019 2020 2019
AssetsCurrent and other assets $7,784,964 $6,479,313 $317,801 $594,466 $8,102,765 $7,073,779Capital assets 15,315,706 14,534,439 70,136 68,849 $15,385,842 $14,603,288Total assets 23,100,670 21,013,752 387,937 663,315 23,488,607 21,677,067Deferred outflows of resources 286,527 251,997 - - 286,527 251,997LiabilitiesLong-term liabilities 14,491,829 12,910,442 10,458 9,885 14,502,287 12,920,327Other liabilities 2,379,115 2,008,918 210,263 67,439 2,589,378 2,076,357Total liabilities 16,870,944 14,919,360 220,721 77,324 17,091,665 14,996,684Deferred inflows of resources 181,414 273,443 - - 181,414 273,443Net position: Net investment in capital assets 3,232,889 3,571,065 70,136 68,849 3,303,025 3,639,914Restricted 1,891,026 1,803,748 90,550 503,431 1,981,576 2,307,179Unrestricted 1,210,924 698,133 6,530 13,711 1,217,454 711,844Total net position $6,334,839 $6,072,946 $167,216 $585,991 $6,502,055 $6,658,937
Totals Governmental activities Business-type activities

District of Columbia FY 2020 Citizen’s Financial Report 13
Statement of Activities for the Year Ended September 30, 2020 ($ in 000s)
coronavirus.dc.gov
In response to the COVID-19 pandemic, the website https://coronavirus.dc.gov was established as a way for District officials to keep residents, government employees, and the general public informed about measures being taken to reduce the spread of the disease. The website houses a wealth of information regarding COVID-19 including information on the disease and its symptoms, testing locations, the city’s operating status, vaccine distribution and much more.
The Mayor and other District officials also provide regular televised press briefings explaining case numbers, safety protocols, restrictions, and policy changes. District officials recognize the importance of transparency and open communication as part of the efforts to “flatten the curve” of this pandemic.
Black Lives Matter Plaza is a two-block-long pedestrian section of 16th Street, NW in Downtown D.C. The Department of Public Works painted the words “Black Lives Matter” in 35-foot yellow capital letters in the section and it was renamed Black Lives Matter Plaza by the Mayor on June 5, 2020.
2020 2019 2020 2019 2020 2019 Variance Revenues: Program revenues: Charges for services $891,589 $869,744 $313,407 $323,407 $1,204,996 $1,193,151 $11,845 Operating grants and contributions 4,826,314 3,916,440 1,025,633 18,319 5,851,947 3,934,759 1,917,188 Capital grants and contributions 278,833 258,500 - - 278,833 258,500 20,333 General revenues: Property taxes 3,061,745 2,888,245 - - 3,061,745 2,888,245 173,500 Sales and use taxes 1,317,113 1,707,745 - - 1,317,113 1,707,745 (390,632) Income and franchise taxes 3,021,673 2,969,289 - - 3,021,673 2,969,289 52,384 Other taxes 864,100 981,113 139,833 142,877 1,003,933 1,123,990 (120,057) Non-tax revenues 646,653 664,420 10,840 12,416 657,493 676,836 (19,343)Total revenues 14,908,020 14,255,496 1,489,713 497,019 16,397,733 14,752,515 1,645,218
Expenses 14,649,508 13,342,691 1,905,107 438,200 16,554,615 13,780,891 2,773,724Increase in net position before transfers 258,512 912,805 (415,394) 58,819 (156,882) 971,624 (1,128,506)
Transfers in (out) 3,381 8,740 (3,381) (8,740) - - - Change in net position 261,893 921,545 (418,775) 50,079 (156,882) 971,624 (1,128,506) Net position - Oct 1 6,072,946 5,151,401 585,991 535,912 6,658,937 5,687,313 971,624Net position - Sept 30 $6,334,839 $6,072,946 $167,216 $585,991 $6,502,055 $6,658,937 $(156,882)
Governmental activities Business-type activities Totals

14 District of Columbia FY 2020 Citizen’s Financial Report
Martin Luther King Jr. Memorial Library Reopening On September 24, 2020, the Mayor cut a ceremonial ribbon to celebrate the reopening of the Martin Luther King Jr. (MLK) Memorial Library following a three-year, $211 million modernization project. Located at 901 G Street, NW, the MLK Library modernization represents the DC Public Library’s most ambitious capital project. Since 2009, more than 20 libraries have been built or fully renovated in the District. The MLK Library was designed in the late 1960’s by Ludwig Mies van der Roche and opened in 1972. The library is the first public building in the country named after civil rights leader, Dr. Martin Luther King Jr. On March 4, 2017, the library closed for a complete modernization under the design of Dutch firm Mecanoo and local team OTJ Architects. The renovation
resulted in a significant expansion of public space and will also showcase art by established and emerging artists from the District and elsewhere. The transformed MLK Library now features:
• A spectacular new, vibrant, and transparent entryway
• A sculptured monumental staircase • A large auditorium and conference center • Creative spaces for fabrication, music
production and art creation • Ground level café with patio • A double-height reading room • Newly designed special collections space • Roof top terrace
“The King Mural”, created by artist Don Miller in 1986, was cleaned and restored to its original brilliance.
The 56-feet long mural is located on the ground floor in the building’s Great Hall.
An art installation by Xenobia Baily hangs from the main reading room’s new two-story ceiling.
A 290-seat auditorium for large-scale programming is located on the top floor.

District of Columbia FY 2020 Citizen’s Financial Report 15
The Arches Over the New Frederick Douglass Memorial Bridge On August 13, 2020, the Mayor and the District Department of Transportation announced the completion of the iconic arches for the newly reconstructed, six-lane, Frederick Douglass Memorial Bridge. The new bridge is part of the South Capitol Street Corridor Project which includes two phases: (1) replacement of the 70-year-old bridge; and (2) reconstruction of the Suitland Parkway/I-295 interchange.
The new bridge is being constructed approximately 100 feet from the current bridge. Now that the arches are complete, construction will begin on the new bridge deck where cars, bikes, and pedestrians will cross the Anacostia River when the bridge is completed in late 2021.
The Arches over the Frederick Douglas Memorial Bridge
District Wharf Phase 2 Construction is ongoing on the District Wharf Phase 2 located on the District’s Southwest Waterfront. Scheduled to open in 2022, Phase 2 will deliver an additional 1.25 million square feet of mixed-use spaces including a marina, office space, residential, retail, as well as parks and public spaces. Phase 1 of the District Wharf was completed in October 2017. The mile-long stretch along the Potomac River has reestablished Washington, DC as a waterfront city and destination.
The Wharf Phase 2 At A Glance
255 Apartments 96 Condominiums 131 Hotel Rooms
547,000 square feet of office space 95,000 square feet of retail space
223 Boat slips at the Wharf Marina 2 Garages with over 1,000 spaces
Architect Rendering of the District Wharf Phase 2

16 District of Columbia FY 2020 Citizen’s Financial Report
Operating Statistics
FY 2020 FY 2019Number of police officers 3,799 3,810 Number of police vehicles 1,257 1,250 Police crime index offenses 29,639 33,902
Number of fire & EMS operational personnel 1,848 1,939 Number of fire & EMS stations 34 34 Number of front-line emergency vehicles 168 168 Total number of fire/rescue incidents 37,132 39,454
Number of D.C. Public School teachers 4,522 4,320 Number of D.C. Public School students 51,060 49,056 Number of D.C. Public School high school graduates 2,180 2,170
Number of University of D.C. teachers 232 230 Number of University of D.C. students 3,953 4,456 Number of University of D.C. graduates 753 782
Convention Center conferences held 57 151 Convention Center attendees 569,524 1,066,175
Number of refuse collection trucks 103 102 Refuse collected (tons per day) 377 363 Recyclables collected (tons per day) 105 102
Outlook for FY 2021
The economic downturn resulting from the COVID-19 pandemic has created an uncertain outlook for the District. The announcement of at least two vaccine approvals in December 2020 was a positive development and indicates that many of the required restrictions may be lifted. Quick and effective vaccine deployment would accelerate economic activity and result in a positive change to the forecast.
• The District’s population continued to grow in FY 2020, but growth has slowed, averaging just under 5,000 new residents annually over the last two years. It has been estimated that population will continue to grow about 4,000 to 5,000 residents annually over the next four years.
• More job losses are expected for FY 2021, concentrated in hospitality, retail, and business
services, all of which declined significantly in FY 2020 as a result of the pandemic. Government and professional jobs grew in FY 2020 and are expected to grow in FY 2021.
• Wages grew 1.8 percent in FY 2020, slower than the historic trend. Although job losses during the pandemic put significant pressure on wages, they did not contract in FY 2020 because of growth in high paying sectors. Wages will continue growing in FY 2021 with some recovery in the sectors that were hardest hit during the pandemic.
Historically, investments in economic development attracted new businesses and housing in all neighborhoods of the city. However, due to COVID-19, the switch to telework, desire for more personal space, and the ability to host small meetings and conferences remotely, there has been a decline in demand for new office and meeting space.

District of Columbia FY 2020 Citizen’s Financial Report 17
Glossary Blended Component Unit
A legally separate organization which functions as an integral part of the primary government and whose data is blended with those of the primary government. The District currently has two blended component units:
1) Tobacco Settlement Financing Corporation 2) Not-for-Profit Hospital Corporation
Business-type Activities
Financed in whole or in part by fees charged to external parties for goods or services. The District reports Lottery and Gaming, Unemployment Compensation Fund, and Not-for-Profit Hospital Corporation as Business-type activities.
Capital Assets
Assets (infrastructure, land, buildings, equipment) used in operations that have initial useful lives extending beyond a fiscal year.
Component Unit
A legally separate organization for which the primary government is financially accountable and is included as part of its financial reporting entity. The District currently has five discretely presented component units:
1) District of Columbia Green Finance Authority 2) Health Benefit Exchange Authority 3) Housing Finance Agency 4) University of the District of Columbia 5) Washington Convention and Sports Authority
Comprehensive Annual Financial Report (CAFR)
An annual report issued by state and local governmental entities. A CAFR has three major sections: introductory, financial, and statistical.
Debt Service
Cash required in a given period, usually one year, for payment of interest and principal on outstanding debt.
Deferred Inflows of Resources
An acquisition of net position by the government that is applicable to a future reporting period.
Deferred Outflows of Resources
A consumption (use) of net position by the government that is applicable to a future reporting period.
Economic Resources
All inflows, outflows, and balances affecting or reflecting a governmental entity’s net position.
Fiscal Year (FY)
A financial reporting period of twelve months. The District’s fiscal year begins October 1 and ends September 30.
Fund
A separate fiscal and accounting entity used to segregate and account for resources related to a specific activity.

18 District of Columbia FY 2020 Citizen’s Financial Report
Glossary General Fund
The chief operating fund of the government. This fund is used to account for all financial resources except those required to be accounted for in other funds.
General Obligation Bonds
Municipal bonds that are secured by a state or local government’s pledge to use legally available resources, including tax revenues, to repay bondholders. Most general obligation pledges at the local government level include a pledge to levy a property tax to meet debt service requirements.
General Revenues
All revenues not reported as program revenues in the government-wide statement of activities. It includes taxes such as: property taxes, income and franchise taxes, and sales and use taxes.
Generally Accepted Accounting Principles (GAAP)
The conventions, rules, and procedures that serve as the standard for the fair presentation of financial statements.
Government-wide Financial Statements
Financial statements that report governmental activities and business-type activities rather than funds or fund types.
Income Tax Secured Revenue Bonds
Bonds in which the repayment is to be made from amounts derived from the collection of income taxes.
Net Investment in Capital Assets
One of three components of net position that must be reported in government-wide and proprietary fund financial statements. It consists of capital assets, net of accumulated depreciation, reduced by the outstanding balances of borrowings attributable to the acquisition, construction, or improvement of those assets.
Net Pension Asset
The excess of a pension plan’s fiduciary net position over its total pension liability.
Net Position
The residual of all other elements presented in a statement of financial position. The difference between assets plus deferred outflows of resources, on one hand, and liabilities plus deferred inflows of resources, on the other, constitutes net position, the last of the financial statement elements.
Popular Annual Financial Report (PAFR)
An annual report issued by state and local governmental entities that extracts information from their published Comprehensive Annual Financial Report (CAFR) designed to be readily accessible and easily understandable by the general public.
Program Revenues
Revenues that derive directly from a government’s programs (e.g., fees and charges) or from sources outside the reporting government’s tax base, which are directly related to a specific related program.
Proprietary Fund
A business-like fund of a state or local government. Proprietary funds provide goods or services to the general public for a fee.

District of Columbia FY 2020 Citizen’s Financial Report 19
Glossary Rating Agencies
Independent sources of information and analysis for capital markets and debt instruments. These agencies are private and for-profit entities that assist investors by providing rating and detailed research on credit factors. These factors determine the creditworthiness of municipalities, governments, and business entities. The three primary Rating Agencies that rate municipal debt are: Fitch Ratings; Moody’s Investors Service; and Standard & Poor’s Global Ratings. The following rating scale represents a consistent framework for ranking and comparing the relative risks of different debt issues. Each agency has developed its own set of easily recognizable symbols to grade all debt consistently. Fitch and Standard & Poor’s may use + or – to modify some ratings. Moody’s uses the numerical modifiers 1 (highest), 2, and 3 in the range from Aa1 through Ca3.
Explanation of municipal bond ratings
RATING SERVICE
Fitch Moody’s Standard & Poor’s
Highest quality High quality Upper medium grade
AAA AA A
Aaa Aa A
AAA AA A
Medium grade Predominantly speculative Speculative, low grade
BBB BB B
Baa Ba B
BBB BB B
Poor to default Highest speculation Lowest quality, no interest
CCC CC C
Caa Ca C
CCC CC C
In default In arrears Questionable value
DDD DD D
DDD DD D
Restricted Net Position
One of three components of net position that must be reported in government-wide and proprietary fund financial statements. It consists of restricted assets (those limited to a specific purpose or use) reduced by liabilities and deferred inflows of resources related to those assets.
Unmodified or “Clean” Audit Opinion
A written report issued by an independent auditor which states that the financial statements for the government present fairly its financial position and results of operations.
Unrestricted Net Position
One of three components of net position that must be reported in government-wide and proprietary fund financial statements. It is the difference between total net position and its two other components (net investment in capital assets and restricted net position).

20 District of Columbia FY 2020 Citizen’s Financial Report


CITIZEN’S FINANCIAL
REPORT
2020
OFFICE OF THE CHIEF FINANCIAL OFFICERJohn A. Wilson Building1350 Pennsylvania Avenue, NW, Suite 203Washington, DC 20004tel 202.727.2476fax 202.727.1643cfo.dc.gov
YEAR ENDED SEPTEMBER 30, 2020
GOVERNMENT OF THE DISTRICT OF COLUMBIA
MURIEL BOWSER MAYOR
JEFFREY S. DEWITT CHIEF FINANCIAL OFFICER
GOVERNMENT OF THE DISTRICT OF COLUMBIA OFFICE OF THE CHIEF FINANCIAL OFFICER
YEAR ENDED SEPTEMBER 30, 2020
247954_DC_PAFR_saddlestitch.indd All Pages247954_DC_PAFR_saddlestitch.indd All Pages 1/20/21 3:17 PM1/20/21 3:17 PM