Embed Size (px)
Citation preview

March 2017
citizen-generated data and sustainable development evidence from case studies in Kenya and Uganda report

citizen-generated data and sustainable development / devinit.org 1
Acknowledgements Development Initiatives (DI) and Development Research and Training (DRT) have been working under a formal partnership arrangement since 2009. The two organisations collaborate in policy research and improving access to and use of information on poverty and humanitarian issues, data analysis, institutional and partner capacity building and joint programmes targeting extreme and chronic poverty.
In March 2016, Making All Voices Count funded a joint DI and DRT one-year study to explore the use of citizen-generated data in improving decision-makers’ responsiveness and how use of the data can be improved within the information ecosystem. The study draws on evidence from two case studies in Kenya and Uganda About Making All Voices Count
Making All Voices Count is a programme working towards a world in which open, effective and participatory governance is the norm and not the exception. It focuses global attention on creative and cutting-edge solutions to transform the relationship between citizens and their governments. The programme is inspired by and supports the goals of the Open Government Partnership.
Making All Voices Count is supported by the UK Department for International Development (DFID), the US Agency for International Development (USAID), the Swedish International Development Cooperation Agency (Sida) and the Omidyar Network, and is implemented by a consortium consisting of Hivos, the Institute of Development Studies and Ushahidi.
Web: www.makingallvoicescount.org; Email: [email protected]; Twitter: @allvoicescount
Disclaimer: This document has been produced with the financial support of the Omidyar Network, Sida, DFID and USAID. The views expressed in this publication do not necessarily reflect the official policies of our funders.

citizen-generated data and sustainable development / devinit.org 2
ContentsAcronyms ........................................................................................................................3Executive summary......................................................................................................... 4
Main findings ............................................................................................................. 5Main recommendations.............................................................................................5
Introduction......................................................................................................................6Background............................................................................................................... 6About the study ......................................................................................................... 7Methodology.............................................................................................................. 8Limitations ................................................................................................................. 9Structure of the report ...............................................................................................9
Citizen-generated data in the literature.........................................................................10Defining citizen-generated data ..............................................................................10Benefits and limitations of citizen-generated data ..................................................10Potential benefits .................................................................................................... 10Potential limitations ................................................................................................. 11Evidence on the impact of citizen-generated data initiatives..................................12Key takeaways........................................................................................................12
Research findings: Case studies ..................................................................................13Community resource tracking in Uganda................................................................13Motivations for producing citizen-generated data ...................................................13Production of data................................................................................................... 15Use of the data........................................................................................................16Results of the initiative ............................................................................................18Conclusion ..............................................................................................................20The School Report Card in Kenya ..........................................................................20Motivations for producing citizen-generated data ...................................................20Production of data................................................................................................... 21Use of the data........................................................................................................23Results of the initiative ............................................................................................24Conclusion ..............................................................................................................25Review of the data produced by the two initiatives.................................................26Lessons from the case studies ...............................................................................26
The wider use potential of citizen-generated data ........................................................29The potential of citizen-generated data .................................................................. 29Increasing accountability.........................................................................................29Complementing official statistics and informing government planning...................29Using citizen-generated data to monitor the SDGs ................................................30Barriers to increased production and use of citizen-generated data ......................30The role of citizen-generated data ..........................................................................30Technical issues ..................................................................................................... 31Operational issues .................................................................................................. 31Key ways forward.................................................................................................... 31Putting the findings into context ..............................................................................32
Conclusion.....................................................................................................................33Annex 1: School Report Card data collection focus areas (Kenya)..............................35Annex 2: Community resource trackers reporting template (Uganda)..........................37Notes .............................................................................................................................38

citizen-generated data and sustainable development / devinit.org 3
Acronyms CDE County Director of Education CSO Civil society organisation DFID Department for International Development KCPE Kenya Certificate of Primary Education MOE Ministry of Education NGO Non-governmental organisation NTA National Taxpayers Association NESSP National Education Sector Support Program (Kenya) SDG Sustainable Development Goal SRC School Report Card UBOS Uganda Bureau of Statistics UN United Nations WASH Water, sanitation and hygiene
citizen-generated data and sustainable development / devinit.org 4
Executive summary The call for a data revolution, expressed in the report of the UN Secretary-General's High-Level Panel of Eminent Persons in the lead up to the 2030 Agenda for Sustainable Development,1
In both Kenya and Uganda, the development data and information landscape has changed significantly over recent years. Officials, civil society and the private sector are stepping up efforts to harness existing and new data sources to support decision-making and accountability for sustainable development.
has generated significant attention on the role of data in driving and monitoring sustainable development. Among a wide range of stakeholders, there has been growing discussion of the roles of official statistics and new data sources in order to seek drastic improvements in the production and use of data at national, regional and global levels.
2 Technological advances have supported increased access to data and information in digital formats, as well as the emergence of technology-focused or enabled data initiatives such as multiple open data platforms, and SMS-based citizen reporting systems.3
Some proponents of citizen-generated data see it as a key element in the emerging data revolution. CIVICUS define it as 'data that people or their organisations produce to directly monitor, demand or drive change on issues that affect them',
4 and such issues include resource allocation and service delivery. It is described as having significant potential to contribute to monitoring implementation and progress towards the Sustainable Development Goals (SDGs). This is seen to ensure citizen engagement, government responsiveness and impact at the local level, while helping fill important gaps in official data.5
There is, however, a need for stronger evidence on how citizen-generated data initiatives contribute to change in the development context. This is what we aim to contribute to with this report, based on two case studies from Kenya and Uganda.
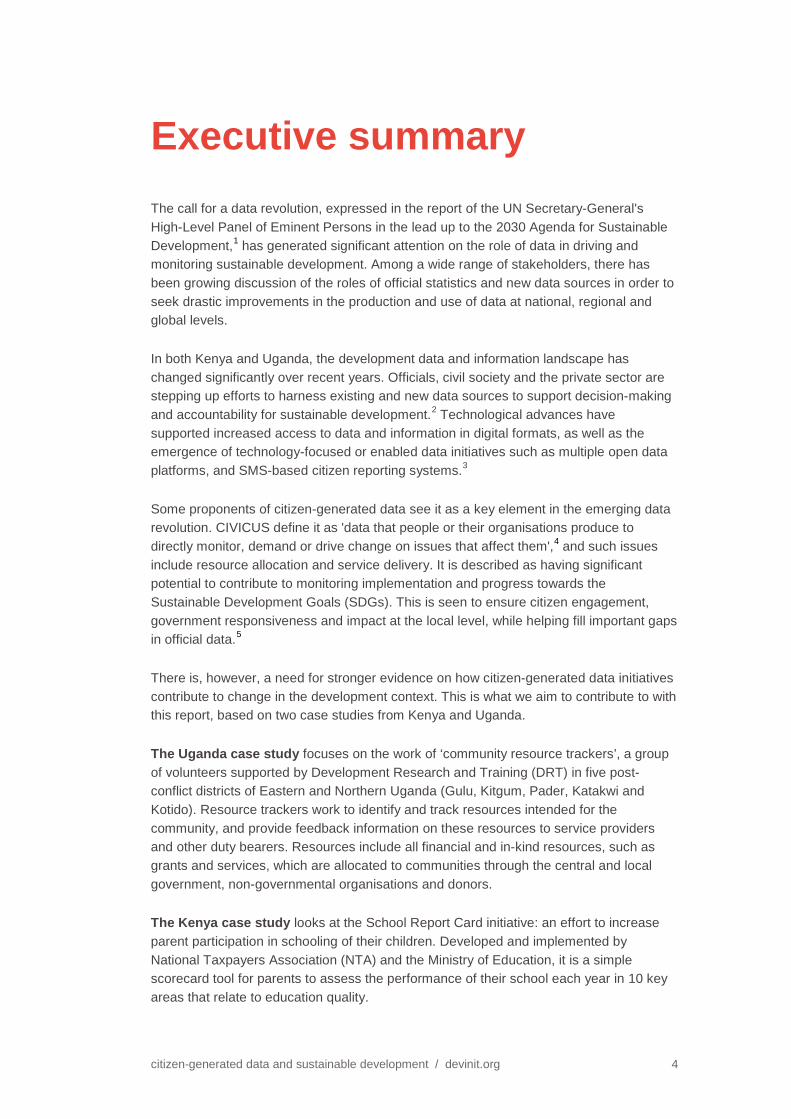
The Uganda case study focuses on the work of ‘community resource trackers’, a group of volunteers supported by Development Research and Training (DRT) in five post-conflict districts of Eastern and Northern Uganda (Gulu, Kitgum, Pader, Katakwi and Kotido). Resource trackers work to identify and track resources intended for the community, and provide feedback information on these resources to service providers and other duty bearers. Resources include all financial and in-kind resources, such as grants and services, which are allocated to communities through the central and local government, non-governmental organisations and donors.
The Kenya case study looks at the School Report Card initiative: an effort to increase parent participation in schooling of their children. Developed and implemented by National Taxpayers Association (NTA) and the Ministry of Education, it is a simple scorecard tool for parents to assess the performance of their school each year in 10 key areas that relate to education quality.

citizen-generated data and sustainable development / devinit.org 5
Main findings • The findings from our case studies demonstrate that citizens – individuals and
communities – are important agents in the data revolution as active users, producers and intermediaries of development data and information.
• In both cases, citizen-generated data initiatives have contributed to improvements in the delivery of development-related projects, accessibility and/or quality of public services.
• Both initiatives contributed to empowerment and participation of local actors in accountability efforts, albeit with more limited engagement from more marginalised groups.
• There is some indication that the Kenyan initiative saw policy-level uptake. • Due to significant differences in context and purpose of the initiatives, the data and
information produced differ significantly in degree of standardisation and documentation, pointing to a need for a differentiated approach when considering and harnessing the wider potential of citizen-generated data.
A further issue we explore in this report is the wider potential for increased production and use of citizen-generated data in development contexts. In this area, our findings indicate that there is potential of citizen-generated data – in particular at local level – to contribute to accountability, planning, SDG monitoring and to provide important complementary perspectives to official data and statistics. However, to realise this potential, important concerns need to be addressed, including on data quality and standards, capacity and sustainability of citizen-generated data efforts, and official recognition of citizen-generated data. This could be achieved through collaboration between official and non-official data producers and users.
Main recommendations
Going forward, there is a rich agenda for research and practical demonstration on how this potential can be realised in specific contexts and application scenarios. This could involve: • Conducting further research to develop typologies and case studies of citizen-
generated data initiatives and the data they produce. • Exploring in more detail how datasets generated through citizen-generated data
initiatives complement available official data. • Strengthening existing citizen-generated data efforts as appropriate to context and
objectives, in particular to include marginalised people and communities and to assure data quality.
• Building collaboration and partnerships with official actors, especially around the development of community-level data collection infrastructures.
• More broadly, engaging in ongoing dialogue with official and other non-official data stakeholders to contribute to the development of an inclusive national statistics system that maximises the contributions of all users and producers of data.

citizen-generated data and sustainable development / devinit.org 6
Introduction Background
The call for a data revolution, expressed in the report of the UN Secretary General's High-Level Panel of Eminent Persons in the lead up to the post-2015 development agenda,6
Some proponents of citizen-generated data see it as a key element in the data revolution. It is described as having significant potential to contribute to monitoring implementation and progress towards the Sustainable Development Goals (SDGs), enabling citizen engagement, government responsiveness and impact at the local level while helping fill important gaps in official data.
has generated significant attention on the role of data in driving and monitoring sustainable development. Among a wide range of stakeholders, there has been growing discussion of the role of official statistics and new sources and producers of data to seek drastic improvements in the production and use of data at national, regional and global levels.
7
There is, however, a need for stronger evidence on how citizen-generated data initiatives contribute to change in policy and practice and how they can contribute to the sustainable development agenda. This is what we aim to contribute to with this report, based on two case studies from Kenya and Uganda.
Some important considerations guided our research:
The changing data and information landscape: In both Kenya and Uganda, the development data and information landscape has changed significantly over recent years. In the context of emerging national discussions of the data revolution, there is significant interest and attention on harnessing alternative or new data sources to support decision-making and accountability for sustainable development.8 Technological advances have supported increased access to data and information in digital formats, and the emergence of technology-focused or enabled data initiatives such as multiple open data platforms and SMS-based citizen reporting systems.9
Persistent challenges to data availability and accessibility: Despite much excitement about the potential of new data sources, availability of relevant, disaggregated data to users at the subnational level remains a significant challenge.
10 Existing official data needs to be accessed through multiple systems, and technological infrastructure including reliable access to the internet and electricity remain a challenge in rural areas.11
The need for sustainable official data: Given the lack of disaggregated data needed to ensure that all people are counted and that no one is left behind, sustainable official data infrastructures are needed. This is critical to ensuring that robust data is available to decision-makers and accountability actors on key issues such as maternal mortality. This implies a move from survey-based data collection to robust civil registration, vital

citizen-generated data and sustainable development / devinit.org 7
statistics and broader administrative data systems. An important emerging area in this context is the development of community-based censuses.12
The need for an inclusive national statistics system: In light of the need for sustainable official data and the potential of new sources and producers of data, an inclusive understanding of the national statistics system is required. This would underpin collaboration between all data users and producers, and enable the recognition of non-government data within official statistics where it satisfies standards and benchmarks set by national statistics offices.
13
It is in this context that more evidence is needed on the potential of citizen-generated data. In particular, a better understanding is required on how its collection and use has influenced accountability, resource allocation and service delivery, and how governments respond to citizen-generated data initiatives. There is also a need for better understanding of the value-addition of citizen-generated data compared with other types of data, and its potential role in the information ecosystem.
About the study
Carried out jointly by Development Research and Training (DRT) and Development Initiatives (DI),14
The overarching research question for the study was; 'How can citizen-generated data lead to increased government responsiveness and accountability for resource allocation and service delivery?' Within this, the study sought to answer two specific questions:
this study explores two contrasting examples of citizen-generated data initiatives in Kenya and Uganda (see Figure 1). In Kenya, the example studied was the School Report Card initiative. This effort aims to increase parent participation in schooling of their children and was implemented by the National Taxpayers Association and the Ministry of Education. The Ugandan case study focuses on an initiative supported by DRT. This sought to empower community-level resource trackers to gather information and use it to seek improvements and accountability in local development efforts.
• What is/are the change(s) that the two citizen-generated data initiatives influenced? • In what ways can this influence be deepened?
In order to answer these questions, the study was structured around four main areas of enquiry: • the motivations for producing citizen-generated data in the two cases • the users of citizen-generated data and resulting information • the use of citizen-generated data and information • the wider use potential of citizen-generated data.

citizen-generated data and sustainable development / devinit.org 8
Figure 1: Overview of the case studies
Source: Report authors
Methodology
The research methodology was qualitative and primarily inductive. This approach was chosen to better understand the aims and behaviours of data producers and decision-makers and the factors contributing to data uptake and ultimately leading to or inhibiting change in context.
Following an initial literature review, key informant interviews and focus group discussions were carried out between May and September 2016 in Kenya and Uganda to collect the primary data for the case studies. Respondents were identified through a stakeholder mapping, and comprised NTA and DRT staff involved in the citizen-generated data initiatives, community members, service providers and officials, including actual and potential data users (See Table 1).
We also collaborated with CIVICUS and the Open Institute to hold a workshop in Nairobi in September 2016 bringing together stakeholders, including organisations that support the generation and uptake of citizen-generated data, to validate our preliminary findings. This also served to explore further how citizen-generated data can be practically used in monitoring the implementation and tracking progress on commitments such as the SDGs and other national and subnational development outcomes. Lastly, we carried out an
School report cards A formal mechanism for channelling solicited and structured citizen-generated data to government.
The School Report Card social audit implemented by the National Taxpayers Association (NTA) in Kenya.
Community resource trackers An informal mechanism for channelling unsolicited citizen-generated data to government.
The community resource tracking initiative implemented by Development Research and Training (DRT) in Uganda.
Case study aims • Exploring the impact of data on decision-making and
accountability efforts
• Exploring the place of citizen-generated data initiatives with other efforts to increase government responsiveness and accountability
• Exploring the use of citizen generated data alongside other types of data, in particular in planning and decision-making processes
citizen-generated data and sustainable development / devinit.org 9
assessment of the data generated by the case studies to demonstrate if other stakeholders can reuse this data, therefore promoting the wider use of citizen-generated data.
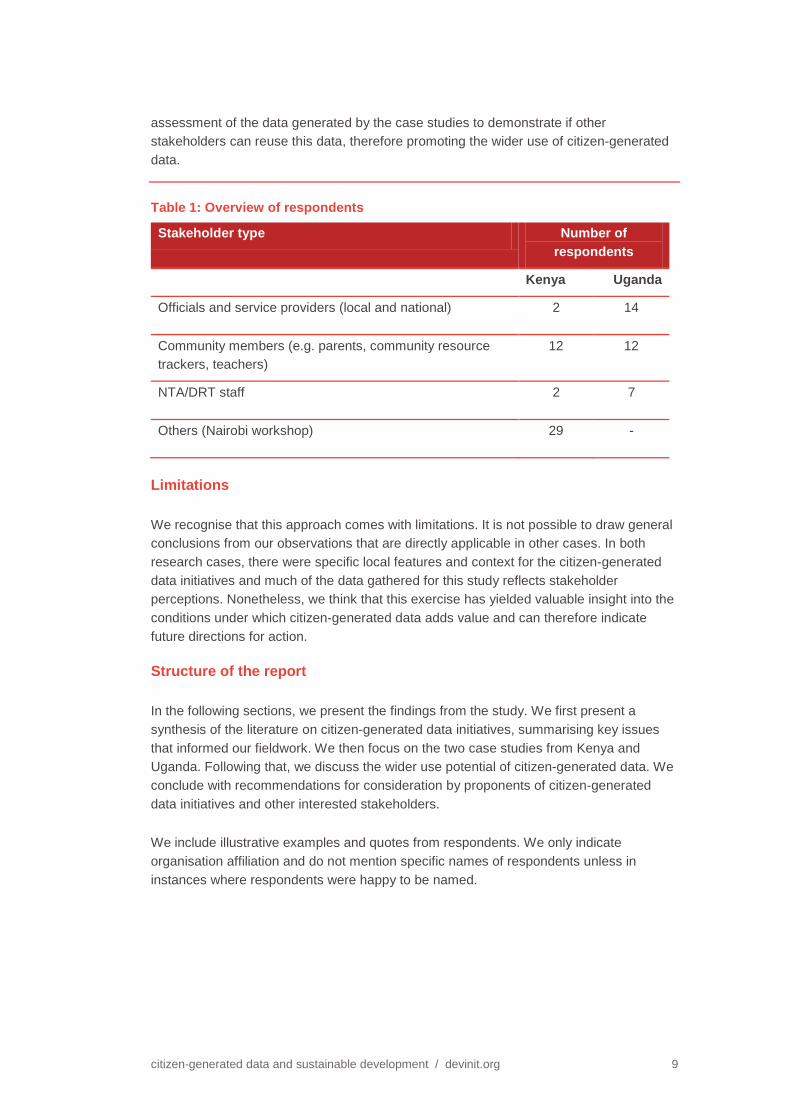
Table 1: Overview of respondents
Stakeholder type Number of respondents
Kenya Uganda
Officials and service providers (local and national) 2 14
Community members (e.g. parents, community resource trackers, teachers)
12 12
NTA/DRT staff 2 7
Others (Nairobi workshop) 29 -
Limitations
We recognise that this approach comes with limitations. It is not possible to draw general conclusions from our observations that are directly applicable in other cases. In both research cases, there were specific local features and context for the citizen-generated data initiatives and much of the data gathered for this study reflects stakeholder perceptions. Nonetheless, we think that this exercise has yielded valuable insight into the conditions under which citizen-generated data adds value and can therefore indicate future directions for action.
Structure of the report
In the following sections, we present the findings from the study. We first present a synthesis of the literature on citizen-generated data initiatives, summarising key issues that informed our fieldwork. We then focus on the two case studies from Kenya and Uganda. Following that, we discuss the wider use potential of citizen-generated data. We conclude with recommendations for consideration by proponents of citizen-generated data initiatives and other interested stakeholders.
We include illustrative examples and quotes from respondents. We only indicate organisation affiliation and do not mention specific names of respondents unless in instances where respondents were happy to be named.

citizen-generated data and sustainable development / devinit.org 10
Citizen-generated data in the literature Defining citizen-generated data
Citizen-generated data is a relatively new term, but one that is increasingly used in the development sector. Arguably, much of this recent increase in use of citizen-generated data terminology is due to the work of CIVICUS to promote citizen monitoring approaches in the context of the SDGs.15
'Data that people or their organisations produce to directly monitor, demand or drive change on issues that affect them. It is actively given by citizens, providing direct representations of their perspectives and an alternative to datasets collected by governments or international institutions.'
In its DataShift project, CIVICUS defines citizen-generated data as:
16
This highlights two elements of citizen-generated data. Firstly, it is expected to provide insight into citizen perspectives and secondly, it is to be produced by non-state actors, principally for accountability purposes.
17
The positioning of citizen-generated data as an alternative to official data is not without conceptual challenges in terms of its rigorous application in practice. For example, a recent DataShift study lists a community-based census and mobile birth registration as citizen-generated data efforts, among others.
18 It is at least arguable to what extent these are citizen-led initiatives.19
Benefits and limitations of citizen-generated data
Potential benefits
Many of the potential benefits associated with citizen-generated data initiatives relate to those connected with increased citizen engagement and accountability for development effectiveness and good governance.20 In the context of the SDG framework, civil society actors in particular have highlighted the importance of transparency, accountability and participation, especially with regard to SDG 16.21
While broader citizen participation approaches have strongly emphasised access to information as a key condition for engagement, advocates of citizen-generated data expand the focus beyond this to highlight the role of citizens as active producers of data.
Advocates for citizen-generated data highlight its role in bringing accountability to development processes through independent monitoring, and by complementing existing

citizen-generated data and sustainable development / devinit.org 11
data sources22 with qualitative, independent and local information.23 A central argument of citizen-generated data proponents is its potential to help ensure that 'all voices count': that the perspectives of otherwise marginalised actors are reflected in the context of an effort to 'leave no-one behind' in the delivery of the SDGs.24 Citizen-generated data is seen to offer perspectives and insights that official data collection may under-represent, such as citizens’ everyday concerns, inequality, corruption and rights violations.25 It could also be a key function of citizen-generated data initiatives to motivate official data collection in such areas.26 Based on the example of citizen science projects, such as in the environmental monitoring field, citizen-generated data approaches also potentially enable larger-scale data collection than some traditional approaches do, e.g. by harnessing volunteer capacity.27 It has also been pointed out that governments themselves could benefit from citizen-generated data to improve accountability and service delivery, for example by integrating citizen-generated data in government-led data portals.28
Potential limitations
Nonetheless, some potential limitations regarding citizen-generated data are highlighted in the literature. These can be divided into contextual and data-specific challenges.
As for other types of evidence, the availability of data itself is necessary but not sufficient for its use in policy- and decision-making. Uptake happens through direct and indirect pathways29 and requires favourable political conditions and incentives for data collection30 and its use,31 especially transparent policy processes.32 In addition to political constraints, human and system capacity for data use are key factors.33
For initiatives focused on citizen data access and generation, including open data approaches, some limitations have been diagnosed. These include:
• limited links between data supply and user needs,34 and between citizen feedback and government response mechanisms35
• information asymmetries in assessing service provision
• power dynamics, and the difficulty of interpreting beneficiary assessment36
• cost
37
• methodological capacity
• limited financial and organisational sustainability of citizen-generated data efforts.38
Despite the strong interest and potential seen by many commentators around technology, ensuring that digital divides between different groups and geographies can be overcome is a challenge
39 as is ensuring context adequacy.40
As an illustration of contextual limitations in Uganda, it has been noted that formal citizen participation mechanisms, such as in the planning process, are limited in practice by capacity and may be ritualised, rather than providing for effective uptake of citizen views.
41 More local and grassroots processes are not always well-linked to formal processes and institutions, limiting uptake of citizen suggestions.42
The lack of official recognition for citizen-generated data by officials is a larger challenge noted by multiple studies
43 and is associated with stakeholder concerns over standardisation and quality of citizen-generated data. Echoing similar concerns over citizen science and open data, this includes official statisticians’ worries about methodological rigour in data collection, representativeness, ownership, provenance,

citizen-generated data and sustainable development / devinit.org 12
privacy, misuse, standards for data quality (completeness, accuracy, timeliness) and structure.44
Evidence on the impact of citizen-generated data initiatives
To date, there is limited evidence on citizen-generated data initiatives' impact on development policy and practice. Some examples from developing countries in the literature are: inclusion of citizen-generated geo-data as court evidence to document land rights violations in Indonesia; changes in official approaches to measuring education outcomes in Uganda; and improvements to community water supply based on citizen monitoring and mapping in Malawi.45
There is also some evidence for the effectiveness of community scorecard exercises in increasing health service delivery in Uganda,
46 and of community monitoring efforts to address problems in various aid-funded projects in Kenya.47 A common thread among these is the importance of fit with local mechanisms, capacity and processes to facilitate citizen engagement with officials. An evaluation of ICT-enabled citizen feedback and participation processes finds that service-delivery improvements take place primarily where technology meets with existing government willingness to act on feedback.48
Beyond changes to policy and practice, a number of authors point to important intermediate dimensions of citizen engagement and citizen-generated data initiatives' impact. These include strengthening citizens' capability and confidence to engage with the state and service providers and developing community ties between citizens in the process.
49 These attitude and behavioural changes can be direct outcomes of citizen participation. The process of data generation by citizens can also help build people's knowledge and awareness, which further strengthens their participation, articulation of issues that matter to them and the taking of action.50
Key takeaways
The still relatively limited evidence on the impact of citizen-generated data confirmed the overall relevance of our research effort, as well as our approach of focusing on the process of the cases under study.51
• the configuration of stakeholder relationships and links to existing processes for citizen-government engagement within the citizen-generated data projects
The following were our key takeaways in terms of further refining the focus of our research in important areas:
• the extent to which the initiatives responded to existing policy priorities and the information needs related to these
• the choices made on data collection, analysis and communication tools, and whether these corresponded to existing capacities and skills
• the importance of understanding intermediate levels of change, such as around enhanced community engagement.

citizen-generated data and sustainable development / devinit.org 13
Research findings: Case studies This chapter presents the findings of the two case studies and discusses the lessons that we learnt. The findings come principally from interviews with key informants, focus group discussions and the assessment of the citizen-generated data collected by the participating organisations.
The Kenya case study looks at the School Report Card initiative, an effort to increase parent participation in schooling of their children. Developed and implemented by NTA and the Kenyan Ministry of Education, SRC is a simple scorecard tool for parents to assess the performance of their children’s school each year in 10 key areas that relate to education quality (see Annex 1).
The Uganda case study focuses on the work of community resource trackers, a group of volunteers supported by DRT in five post-conflict districts of Eastern and Northern Uganda (Gulu, Kitgum, Pader, Katakwi and Kotido). Resource trackers work to identify and track resources meant for the community, and provide feedback information on these resources to service providers and other duty bearers. Resources include all financial and in-kind resources, such as grants and services, which are allocated to communities through the central and local government, non-governmental organisations (NGOs) and donors. From an official perspective, the data generated in this process is unsolicited and therefore the trackers depend on the goodwill of duty bearers to receive and use it.
Community resource tracking in Uganda
Motivations for producing citizen-generated data
In designing the resource tracking initiative, the assumption was that more and better information proactively used by local communities in their interactions with duty bearers and service providers would increase responsiveness of resource allocation to local concerns and result in improved service delivery. An initial scoping found that despite multiple feedback channels to government, NGOs and donors being available, communities had limited capacity and opportunity to engage proactively with these.52 Hence the project was initiated to build demand for information and feedback loops between community members and duty bearers. During 2011 and 2016, 41 resource trackers were selected by the community and supported in an ongoing fashion by DRT on issues such as understanding the national and local budgeting planning processes, legal frameworks (especially around citizens' right to access information), monitoring and reporting, community participation, basic quantitative and qualitative skills, and developing work plans. The initiative was implemented with the financial support of DFID, under DI's and DRT's Programme Partnership Arrangement. As such, this case study was researched from the perspective of DRT and DI staff who were involved to different extents in implementing the initiative, if not in leading roles.

citizen-generated data and sustainable development / devinit.org 14
The resource tracker initiative included an important element of accessing quantitative and qualitative data from government, NGOs and donors as well as producing feedback data from the communities themselves. The initiative included establishing formal relationships with district government through memoranda of understanding, as well as a series of joint activities including trainings and community meetings with government.53 Accessing information and decision-makers, for example on centrally and locally managed budgets, work plans, social indicators, donor and NGO expenditure, and the duties of different actors were found to present challenges, albeit with important differences. For example, information on donor-funded projects tended to be harder to access than that concerning at least some government programmes, and local officials were the only group of decision-makers accessible with relative ease.54
Here, we focus on the aspects of the effort concerned with producing community feedback data. In this context, the key motivation of participants, according to the resource trackers, was to improve service delivery at the local government level.
Figure 2: Theory of change for the resource tracking effort
Source: DI and DRT

citizen-generated data and sustainable development / devinit.org 15
Production of data
Both qualitative and quantitative data was collected by the community trackers. Qualitative data related mainly to the nature and quality of infrastructure and service delivery. For example, the state of local roads, materials used for school construction, strength of a community bridge, quality of service delivery at a health facility such as patient satisfaction or waiting time, time taken by a service provider to respond to such issues as child abuse and domestic violence, and the work ethic of police. Quantitative data included the budgets allocated to schools and health centres and financial reports to determine how the money was used. It also included local government plans and budgets – to determine if services in the community corresponded with these, and the number of teachers and pupils in schools – to determine whether the ratios met policy prescriptions, and the number of service delivery points compared with service users, among other sources.
To collect the data, community resource trackers used informal and formal methods. Formal methods included the reading of notices put up by local government officials, official information requests from government offices, meetings with duty bearers, and actively seeking invitations to forums such as budget conferences or Parish Development Committee meetings.55 The informal methods included gathering feedback information at community level through conversations, direct observations, documentation through photos and stimulating local debate. For this purpose, and to enable engagement with duty bearers, the trackers were provided with mobile phones (with photo capability), monthly top-up credit and bicycles for transport. Trackers were also provided with simple data collection forms to record key community concerns (see Annex 2). These were regularly mailed or picked up by DRT staff and compiled in a basic Excel system in Kampala.56
From a citizen-generated data perspective, the key component of data collection is the resource trackers' work to gather community feedback, and to voice these concerns, in particular to duty bearers. Overall, informal methods of data collection were more important for trackers than formal routes.
The resulting information was therefore at least partially standardised and primarily qualitative in nature.
One key challenge faced by the resource trackers was engaging marginalised groups such as women, people with disabilities and those with low levels of literacy to participate to the same extent as others in resource tracking. At the same time, due to challenges in accessing disaggregated official data on marginalised groups, feedback from these groups is especially important.57 They can feel less empowered or be subject to adverse cultural norms, limiting their participation in or contribution to community meetings where resource trackers share the data and opinions are sought. For the resource trackers, working as a group, and focusing on face-to-face and audio-visual communication were important tactics to increase confidence and safety to overcome such challenges.

citizen-generated data and sustainable development / devinit.org 16
Use of the data
Primarily, the community resource trackers themselves used the feedback information in their engagement with duty bearers and service providers. To share data, the resource trackers mostly used channels such as village meetings, Barazas,58
Beyond the trackers themselves, officials and service providers also used the data in various instances. However, duty bearers and politicians at lower local government levels – village, parish, sub-county and service centres – were more regular users of this data than those at higher levels of government (see Tables 2 and 3).
budget conferences and sector review meetings to do so – but they had to seek invitations to some of the latter. This can be a challenging process, as initial feedback may require persistent follow-up with different levels of government over an extended period. The resource trackers therefore engaged in a long-term process of developing relationships with different officials to access official information and bring feedback from the community to the attention of officials for them to act on.
Table 2: Lower local government users of data and use cases
Audience Use case
Village chairman and village council
• In monitoring and planning • In formulation of local policy/by-laws
Parish chief and Parish Development Committee
• Mostly in a planning context
Sub-county chief and sub-county council
• Mostly in monitoring • A few times in a planning context • Sometimes for formulation of bylaws
NGOs and faith-based organisations
• To design programmes that respond to community needs; to help communities lobby duty bearers for better services.
Service centres (health centres, schools, etc.)
• As feedback on their services • For improvements in service delivery, • For improved planning and correctional action
reprimands
Service providers and policymakers at higher local government level and district and higher-level service centres such as health centre IV or regional hospitals, secondary schools, police stations were intended users, but did not use the data as often. This is because the first point of engagement for resource trackers was the lower local government level. If issues raised at that level were not within the mandate of the lower local government, then they escalated it to the higher local government (district) or to the national government. However, as indicated, higher levels of government (or donors) are harder to access for communities, because district offices can be located several hours

citizen-generated data and sustainable development / devinit.org 17
away over poor and at times flooded roads. Likewise, identifying suitable 'pressure points' to ensure uptake of information in decision-making was found to be easier for local official and locally managed resources. Nonetheless, some important actions were taken by higher-level officials in response to feedback data.
Table 3: Higher local government users of data and use cases
Audience Use case
Chief Administrative Officer • For monitoring
• Decision-making, enforcement, reprimand, correctional action
District chairperson and council and Resident District Commissioner
• For monitoring and correctional action • To a limited extent for planning purposes
Sector department heads • As feedback on their services • For improvements in service delivery, and future
planning
Despite the difference in regularity of using the data, our findings indicate that even for the higher-level duty bearers, the propensity to take up and use the data increased when the data was shared in government-led accountability fora like the Barazas at sub-county level or stakeholder coordination meetings at the district level. In these fora, the duty bearers were eager to act on the issues raised by non-state actors so that they do not re-emerge in subsequent meetings.
Example of follow-through to higher levels of government
Following the community trackers’ observation of shoddy work in the construction of two
classroom blocks at Toroma Primary School in Katakwi District, they filed several reports
with the sub-county authorities indicating the danger of the structures to the pupils, and
requesting the work to be redone. However, the sub-country officials did not do anything
about these concerns. According to one of the trackers, ‘every time we filed a report about
the issue, the sub-county officials would say there were no resources allocated for that
particular work, and the contractor was not willing to put in more resources'. During the
Baraza held on 15 October 2015 at Toroma sub-county grounds, the community trackers
reported the issue again, and explained their futile efforts to get a reaction from the sub-
county. The Resident District Commissioner, who also moderated the Baraza, instructed the
contractor to either rework the two classroom blocks or he would be disqualified in future
local government contracts. The Commissioner also instructed the sub-county chief to
ensure that the contractor does the work to satisfaction within three months and report to
him. Following the Baraza, the sub-county negotiated with the contractor who finally agreed
to renovate and strengthen the two classroom blocks.
citizen-generated data and sustainable development / devinit.org 18
Results of the initiative
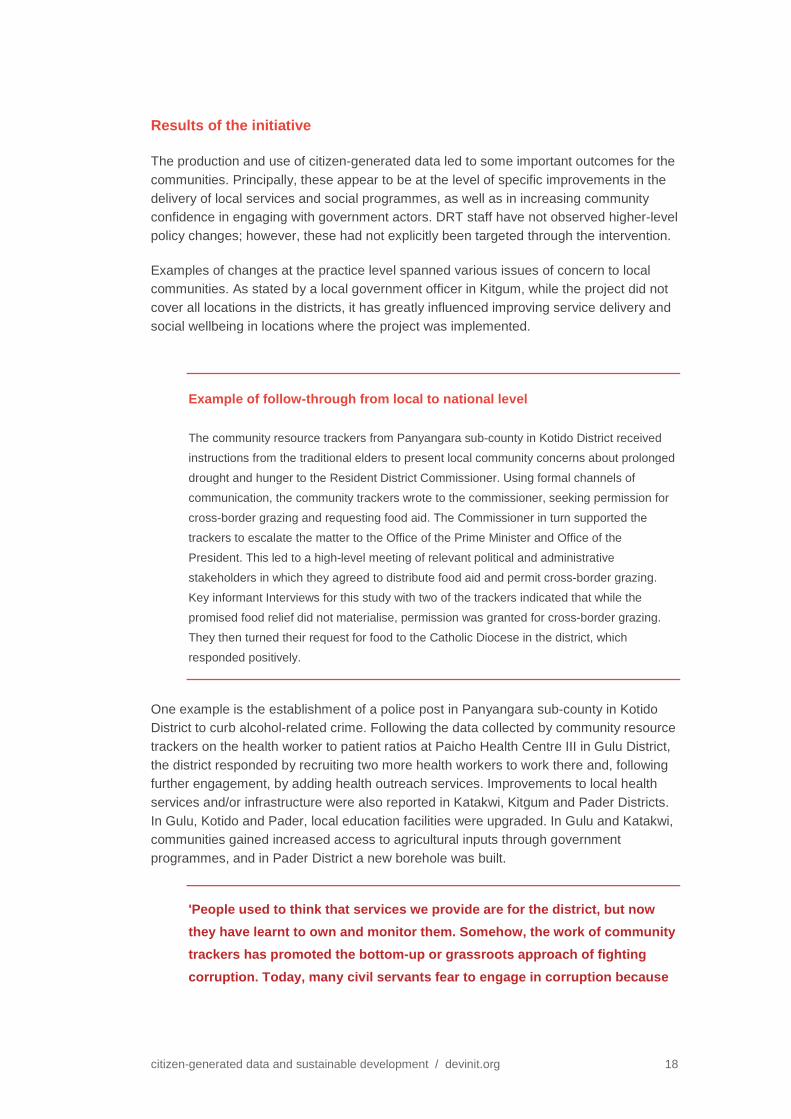
The production and use of citizen-generated data led to some important outcomes for the communities. Principally, these appear to be at the level of specific improvements in the delivery of local services and social programmes, as well as in increasing community confidence in engaging with government actors. DRT staff have not observed higher-level policy changes; however, these had not explicitly been targeted through the intervention.
Examples of changes at the practice level spanned various issues of concern to local communities. As stated by a local government officer in Kitgum, while the project did not cover all locations in the districts, it has greatly influenced improving service delivery and social wellbeing in locations where the project was implemented.
Example of follow-through from local to national level
The community resource trackers from Panyangara sub-county in Kotido District received
instructions from the traditional elders to present local community concerns about prolonged
drought and hunger to the Resident District Commissioner. Using formal channels of
communication, the community trackers wrote to the commissioner, seeking permission for
cross-border grazing and requesting food aid. The Commissioner in turn supported the
trackers to escalate the matter to the Office of the Prime Minister and Office of the
President. This led to a high-level meeting of relevant political and administrative
stakeholders in which they agreed to distribute food aid and permit cross-border grazing.
Key informant Interviews for this study with two of the trackers indicated that while the
promised food relief did not materialise, permission was granted for cross-border grazing.
They then turned their request for food to the Catholic Diocese in the district, which
responded positively.
One example is the establishment of a police post in Panyangara sub-county in Kotido District to curb alcohol-related crime. Following the data collected by community resource trackers on the health worker to patient ratios at Paicho Health Centre III in Gulu District, the district responded by recruiting two more health workers to work there and, following further engagement, by adding health outreach services. Improvements to local health services and/or infrastructure were also reported in Katakwi, Kitgum and Pader Districts. In Gulu, Kotido and Pader, local education facilities were upgraded. In Gulu and Katakwi, communities gained increased access to agricultural inputs through government programmes, and in Pader District a new borehole was built.
'People used to think that services we provide are for the district, but now they have learnt to own and monitor them. Somehow, the work of community trackers has promoted the bottom-up or grassroots approach of fighting corruption. Today, many civil servants fear to engage in corruption because

citizen-generated data and sustainable development / devinit.org 19
they know that communities are watching. When people watch and monitor programmes implemented in their villages, they push pressure higher up.' District Information Officer, Kitgum District
However, it is also clear that duty bearers did not always act on information brought forward. Key reasons given for this were resource limitations, lack of mandate or 'wrong timing' within the budgeting and planning cycle. Other times, especially on issues of local infrastructure construction, contracting services were involved, which the lower local government was not able to resolve. Therefore the response varied depending on the strength of relationships with specific government offices and departments. This had a strong bearing on whether they received a response and the quality of that response. A key reason cited where there was dragging in government uptake was the informality of the resource tracking exercise, that is its lack of attachment to a specific government office. Overall, government response was stronger on issues that affected community health and security.
'When duty bearers know that we have no official local government structure we report to, they do not respond'. Community resource tracker
An important element of change reported by the trackers and communities was the increase in skills and confidence of communities in demanding accountability. Communities felt much more aware of financial processes and how they can contribute to them. The community resource tracking work has empowered people to demand services from their duty bearers and duty bearers have come to understand that it is the responsibility of the resource trackers to inform communities. While resource trackers reference concrete improvements, it appears from various comments that they also now see a role for themselves in development processes where they did not do so before. In particular, female trackers reported increased personal confidence to engage in community affairs. Various trackers highlighted that they play an important information intermediary role between communities, local officials and political actors. In terms of challenges, while trackers note enduring motivation, some expressed ongoing need for facilitation support to continue their efforts. More broadly, access to official data and information remains an ongoing concern.
'I have confidence to stand and give my view in public meetings. I can also gather information, write reports and support my community in tracking resources invested in the parish.' Female resource tracker, Pader District

citizen-generated data and sustainable development / devinit.org 20
Conclusion
While there is little evidence of policy change or increased resource allocation, at least to date, the above examples prove that using citizen-generated feedback data to engage duty bearers can lead to improvements in service delivery. It is important to highlight, however, that the production of feedback data by citizens went hand in hand with them seeking to access and use official information.
As suggested in the literature review, community empowerment and increased confidence in engaging with government was an important results dimension. Where uptake of citizen-generated data and information was achieved, this depended strongly on the quality of relationships with government actors.
The School Report Card in Kenya
Motivations for producing citizen-generated data
The School Report Card is a tool for parents to use to demand accountability and to mobilise parental support for their children’s schools. It also links the wider community with MOE officials at different levels for the purpose of enhancing governance and accountability in delivering quality services in the education sector. Information for the School Report Card is generated through a voluntary, participatory process that targets inputs mostly from the parents. Across different stakeholders in the education ecosystem, the overarching motivation for engagement in the School Report Card exercise is the better school performance of children.
Before the launch of School Report Card in 2009, NTA59 reviewed the Kenya Education Sector Support Programme60
On this basis, NTA developed a scorecard tool for parents to assess annual school performance in 10 key areas that relate to education quality; this is implemented by the Ministry of Education (MOE) in collaboration with NTA. The School Report Card is not linked to any funding by the MOE. Rather, it is a tool to be used by the School Report Card Committee and parents to demand accountability from the head teacher, teachers and School Management Committee/Board of Management.
to identify ways to improve mean school performance scores. NTA identified low parent participation in schooling after the introduction of free primary education in 2003 as one of the fundamental issues needing addressing.
61
The MOE, with its role of setting and enforcing policies that ensure quality learning for all children, shared a motivation to increase parental involvement in education. Beyond this, it identified the School Report Card as a means to collect, aggregate and present monitoring data it did not readily have.
For NTA, the adoption of School Report Card elements into national education policy would be an added success on top of schools performing better post School Report Card adoption.
While there were mechanisms to collect feedback from parents and schools through the offices of the district education officer and the division officers, stakeholders did not adequately demand nor publicly share this data. One reason given was that there was little awareness of this data.

citizen-generated data and sustainable development / devinit.org 21
The primary reason for parents' participation in the School Report Card process is to improve the learning outcomes of their children. They also have a secondary motivation in ensuring effective use of school resources.
NTA and the MOE foresaw buy-in from teachers as potentially challenging as teachers might perceive it as a way of measuring their performance. To alleviate this, the MOE and NTA worked with the Teachers Service Commission and the Kenya National Union of Teachers to inform the teachers that the School Report Card was a tool to improve school performance by creating an enabling environment. This would go along with the teachers' role by including other factors associated with good performance, such as number of classrooms, access to clean water and sanitary facilities.
Production of data
The School Report Card is a form that is completed once a year by parents of children enrolled in public primary schools. To assist with completing the School Report Card, parents elect an School Report Card Committee that arranges an assessment meeting with parents to complete it. Individual schools can decide the timing of their own assessment meetings.
Since 2009 NTA, through facilitation by the MOE, has conducted the score card method of citizen-generated data feedback in all 47 counties in Kenya. The most recently available data indicate 5,77062 schools have been part of the process while 64,000 parents have been trained in the use of the scorecard for school assessment.63 School selection at county level is done at random using an algorithm.64 The MOE targets a full rollout of the process in all public primary schools in the future.65
Once a school is identified, the head teacher is introduced to the School Report Card process by NTA and the MOE for buy-in and once on board, the school proceeds to aid in the setup of an School Report Card committee.
At each school, one male and one female representative is selected to be trained on the School Report Card process, identify active female and male parents/parent association members for training,66
The School Report Card covers 10 key areas of the school and parents discuss and agree on a score from 10 (highest) to 1 (lowest). The scores for the 10 areas are combined to give each school a score out of 100. NTA uses this to rank the schools.
organise parents’ meetings, and guide the School Report Card process in their respective schools according to the guidelines. Following that, the head teacher convenes a meeting with the parents to introduce the process, followed by a second meeting at which parents provide their assessments using the School Report Card.
The 10 areas graded by parents according to their perception of school performance (detailed in Annex 1) are shown in Table 4.

citizen-generated data and sustainable development / devinit.org 22
Table 4: 10 focus areas for the School Report Card
Area of focus
School safety and protection
School facilities
Access to textbooks
Continuous assessments
Water, sanitation and health
Roles of children at the schools
Management of instructional materials
Performance of the School Management Committee/Board of Management
Homework assignments and marking
Parental responsibility
Once this process is completed, parents list five areas of priority requiring immediate action. As part of the process, the head teacher is also required to share additional information to be included the final report. These are detailed in Table 5.
Table 5: Additional information collected to be included in the School Report Card scorecard
Type of information Detail
Demographic information • Number and gender of children per class • Enrolment and absenteeism by gender and class • Pupil transition and dropout rate
Educational statistics
• Performance of children by gender, subject and class • Kenya Certificate of Primary Education (KCPE) mean
scores over time • Composition of Board of Management • Number of toilet facilities by gender between student
and staff • Type of access (piped from mains or borehole) and
storage of clean water • Number and type of classrooms per class
(permanent/semi) with pupil ratios
Budget allocations for education sector
• Free primary education funding to the school in actual amount and use
• Constituency Development Fund funding to the school in actual amount and use
Human resources • Number and gender of teachers per class over time

citizen-generated data and sustainable development / devinit.org 23
Use of the data
Once the assessment exercise is complete, the School Report Card Committee arranges a meeting with parents, the head teacher and the School Management Committee/Board of Management to discuss the findings. The aim of this meeting is to discuss and agree on timeframes and actions to be taken by the head teacher and School Management Committee/Board of Management to address the concerns of parents listed in the School Report Card form.
All County Directors of Education (CDE), CDE staff, sub-county education boards, head teachers, teachers and School Management Committee/Board of Managements are requested to implement the recommendations listed by parents in their School Report Card.
Thereafter, the Committee sends a copy of its completed School Report Card to each of the CDE and NTA and retains one copy. The CDE and staff is required to review each School Report Card and take action based on the information listed by parents. The CDE then consults and collaborates with the County Director of Teacher Management appointed by the Teachers Service Commission in addressing issues that concern teacher management.
After the meeting between parents, the head teacher and the School Management Committee/Board of Management meet to discuss the School Report Card findings, the School Report Card Committee organises relevant activities to help improve the school infrastructure and environment as per School Report Card findings, for example fencing of school, food drives and building works. One activity is carried out each month over a period of 11 months, undertaken by parents, the Committee, the head teacher or the School Management Committee/Board of Management depending on the task. The MOE and NTA have set up a hotline to answer any questions the Committee or parents have about the School Report Card.67
An overview of data usage is presented in Table 6.
Table 6: School Report Card data users and use cases
Audience Use case
School Report Card Committees (which collects the data based on the 10 elements)
Obtain the analysed information from NTA and engage parents and teachers with it to generate action points
NTA Analyse the School Report Card data to rank the schools
Education managers (head teachers, CDE, education boards, School Management Committees and teachers)
Use the information (analysed data) to implement recommendations of parents in the School Report Card
Parents Use the information to monitor and track subsequent improvements to the school based on initial recommendations

citizen-generated data and sustainable development / devinit.org 24
MOE Uses information on education performance and absenteeism in policy enforcement To facilitate implementation of the School Report Card recommendations that require MOE action such as recruitment of additional teachers and school funding allocations. Information also feeds into the monitoring and evaluation system of the ministry
Results of the initiative
The changes observed as resulting from the School Report Card initiative relate to policy, practice and behaviours. Importantly, there is also evidence of positive correlation between high School Report Card scores and high mean Kenya Certificate of Primary Education (KCPE) results in schools.68,69
Interviews with teachers in schools from Nakuru and Nyeri counties and with a Senior MOE official indicated their belief that school performance had increased.
‘The schools are performing better in mean scoring at KCPE and lower level classes while parents are now more proactive in dealing with school management. This is a good programme that needs roll out to all public schools.’ Senior Ministry of Education official
Importantly, there appear to have been significant behavioural changes in how parents engage with schools and the MOE.70 They are more aware of and proactive in their responsibilities to hold school management accountable for both learners’ performance and financial management. They engage more with teachers and ministry officials through regular meetings and individual correspondence. This has led to more awareness by parents on school performance, and parents also get involved in school activities such as contributing to construction of offices, classrooms and food granaries. Stakeholders observe that the more parents are aware of their responsibilities to hold school management to account through the School Report Card, the more engaged and vocal they are in school running and child performance. One study found an increase in perceived parental responsibility towards the school from an average of 46% in 2011 to 85% in 2013.71
‘Parents are now able to mobilise themselves and participate in school activities. Parents constructed this school store. They took the initiative to construct it without seeking government support.’ Parents Teachers Association Chairman
At the same time, there were some indications that citizens from poorer background are less likely to participate in the School Report Card process. For our research, we interviewed parents from a rural/poor part of Nakuru County who expressed willingness to participate in the School Report Card meetings, as they were aware of the benefits of

citizen-generated data and sustainable development / devinit.org 25
their active involvement. However, these parents indicated that they were not able to afford to leave their work and attend the scoring meetings. This raises a concern for the government on how to ensure that parents from all economic situations are able to participate in scoring and in school activities.
‘We meet and agree to contribute additional funds for school development, but for some of us who are poor, we cannot afford to contribute any money. I spend a lot of time working to earn a daily wage; I often do not have spare time to attend the school report card meetings'
Community member/parent
Between 2009 and 2013, the number of schools publicly displaying free primary education grants in schools rose by 12%,72
There has also been an observable positive change in learning amenities with several reports of classrooms, toilets and other learning amenities improving after recommendations for action by the School Report Card committees.
making a potential contribution to increased accountability.
73
At the policy level, the 2013-2018 National Education Sector Support Programme developed by the National Education Board has taken on board the School Report Card scoring approach.
However, lack of resources can hamper action here, which in part appears to be compensated for in individual cases by parents chipping in to construction of amenities like classrooms, toilets and fences.
74
It is important to note, however, that the School Report Card process is still voluntary; schools opt in and out depending on the head teacher's willingness to support the programme. In addition, the number of schools sampled during any given year is based on availability of funds at NTA. This has not been constant and the number of schools sampled has varied in number since 2009.
This is recognition from the government that the impact of School Report Card has been significant in increasing parent participation and improving schooling outcomes of Kenyan children.
Conclusion
This case study shows that citizen-generated data that is linked to formal public sector processes and building on solid relationships between nongovernment and official actors can make clear positive contributions to increased community engagement and improvements to the quality and outcome of services. There is also uptake of the effort at policy level.
While positive changes are observed in schools through the School Report Card process, there are indications that there may still be a disparity in adoption of the process between developed and marginalised areas.

citizen-generated data and sustainable development / devinit.org 26
Review of the data produced by the two initiatives
In both the Uganda and the Kenya cases, volunteers, recruited among community members, collected the data after undergoing some training. Data was both quantitative and qualitative and was analysed by the volunteers themselves (in Uganda) and by NTA (in the Kenyan case). In both cases, the respective communities participated in dissemination of the findings through meetings.
The data from the Kenyan case study is, in a formal sense, more structured, higher quality and potentially useful beyond its current application. It clearly followed some standard methodological procedures such as using algorithms to preselect schools based on school geographical distribution and providing the same data-recording template for all schools for standardised data recording of both qualitative and quantitative data. However, to date, use of the data appears to be limited to NTA and the MOE.
In contrast, in the Ugandan case, the community volunteers collected and analysed the data in much less standardised formats. This was due to its immediate use in accountability efforts and more limited capacities for data collection and analysis at the local level. So it would be misplaced to evaluate its quality according to formal criteria. It met the authenticity requirements and information needs at the lower local government level where it was used. Its value addition lay in how the resource trackers presented it and how it contributed real-time information to planning and monitoring of development efforts. In other words, it reflected the skills of the resource trackers, the priorities of the communities and informed government about the quality and gaps (if any) in service delivery, thereby opening channels for discussion towards improved service delivery. Nonetheless, it is also clear that in its present form, data generated by the resource trackers would be difficult to use outside of its current application area.
Overall, the contrast of choice of data collection tools in the two case studies aligns with the literature findings. The use of technology primarily needs to be based around locally appropriate skills, tools and approaches.
Lessons from the case studies
This report is based on two case studies discussing the use of citizen-generated data in two different scenarios: a process of providing unsolicited citizen feedback to duty bearers and service providers in local communities in Uganda and a more formalised process of citizen-generated data production and use involving the MOE and NTA in Kenya.
Stakeholder and process links: Both case studies highlight the importance of stakeholder relationships and links to existing engagement processes. In the case of the Ugandan resource trackers, the ability of community volunteers to build effective relationships with local office holders strongly conditioned the uptake of and action on feedback. Among the formal mechanisms the effort linked into, the government-led Barazas were particularly important. However, according to project participants, stronger relationships with local government from the outset would have led to greater change. In

citizen-generated data and sustainable development / devinit.org 27
the Kenyan case, the relationship between NTA and the MOE from design to uptake of the information is arguably central to its effectiveness and scale.
Relation to existing policy priorities: Likewise, the Kenyan case demonstrates the relevance of the link to existing policy priorities and the information needs that arise within these, in this case at the sector level. Again, this 'policy match' likely contributed to the initiative’s scale and effectiveness. The Ugandan case, by contrast, was deliberately designed to articulate community priorities and therefore was broader in scope and not focused on one sector. Success in uptake and action on feedback depended significantly on the ability and interests of different officials to respond.
Capacities and tools: Both citizen-generated data processes were largely voluntary, involving local communities with varied levels of education. As evident in both case studies, participants – who are often data collectors – needed to be trained before they could effectively generate, analyse, share and/or use data. Likewise, the choice of tools to facilitate the process, while different, aligned with different capacities and the scale of the implementation.
Types of changes observed: Concerning our overarching research question, we find that while policy changes can occur, as in the Kenyan case, most changes were observed at the level of concrete improvements to service delivery and/or accessibility – indeed the level desired by stakeholders in both cases. Importantly, both cases – despite their significant differences – indicate important effects on attitudes and behaviours of citizens.
This demonstrates that such efforts can increase people's knowledge about development discourse and processes, as well as stimulate their interest and desire to contribute to achieving the desired outcomes. It speaks to the central role of citizens in the development agenda – by participating in citizen-generated data efforts, they understand that they have a role to play and realise that their participation in service delivery affairs leads to better outcomes of the respective services. This was highlighted as an important potential outcome in the literature.
At the same time, our research indicates that in both efforts participation of more marginalised and poorer members of the community was more limited. This appears to be due to practical reasons such as the ability to 'afford' volunteer engagement, but may also relate to self-exclusion. This aspect requires both further research and attention from practitioners in these and similar initiatives.
Data-related considerations: Lastly, both cases demonstrate the strong relevance of citizen-generated data in efforts to improve service quality. However, due to significant differences in context and application area, the nature and format of data collected differed across the two cases. In Kenya, the data is collected across many locations and targets policymakers at the national level. On this basis, a much more standardised data collection system has been developed, with the potential for data use beyond the current audiences.

citizen-generated data and sustainable development / devinit.org 28
In the Ugandan case, the data is collected across fewer locations and information produced from it principally targets the most local level of government first. Therefore, the choice of an informal mechanism was suitable. However, this limits the re-usability of the data and information generated beyond its current application context.
Both cases demonstrates the importance of understanding citizen-generated data in the wider context of other available data, principally that from official sources. This is the subject of the final section of our report.

citizen-generated data and sustainable development / devinit.org 29
The wider use potential of citizen-generated data As part of this study, we sought to understand the wider potential of citizen-generated data. We were interested to explore the potential role of citizen-generated data in the context of the sustainable development agenda. To this purpose, we hosted a workshop in September 2016 in Nairobi in partnership with CIVICUS and the Open Institute. This event brought together a group of (primarily civil society) organisations to share our emerging research findings and discuss the role and potential of citizen-generated data. In addition, we consulted government decision-makers in Uganda on the same matter. In this section, we discuss the salient points of these meetings, aligning them to the findings in our case studies where relevant.
Contributions to the discussions broadly fell into three categories: The potential of citizen-generated data, barriers to its increased production and use, and suggested ways forward.
The potential of citizen-generated data
Increasing accountability
Civil society actors' support for citizen-generated data pertains to its role in closing feedback loops between decision-makers and service users, thereby augmenting transparency and accountability. Citizen-generated data is seen to help advance local priorities, better target scarce resources, and improve the flow of data to and from the local and national levels. Citizen-generated data can also help non-state actors align their work to government efforts to harness sustainable development.
Civil society organisations posited that citizen-generated data can support government in improving service delivery and making better decisions that will drive progress towards the SDGs. They also explained that when citizens participate in the generation of citizen-generated data and obtain feedback on this citizen-generated data, they become empowered to actively participate in monitoring service availability and quality. Overall there was a sense, resonating with the case study findings, that citizen-generated data is initially considered more likely to contribute to service delivery outcomes than policy change.
Complementing official statistics and informing government planning
The value of citizen-generated data to national and subnational policymakers is seen to lie in the recognition that existing data sources may not presently be able to deliver all information. For instance, 10-yearly population censuses and national household surveys conducted every 3 to 4 years cannot deliver the timely, disaggregated data that is required in particular to address local priorities.

citizen-generated data and sustainable development / devinit.org 30
Local governments can therefore benefit from alternative data and information sources. They obtain information from Barazas, community meetings and civil society organisations – all of which are sources of citizen-generated data. This information helps track community members’ access to and benefit from public services, and can feed into local government planning and monitoring processes. As in the School Report Card case in Kenya, citizen-generated data can help fill an existing data gap for government.
However, discussants also recognised that citizen-generated data’s strength lies in particular in addressing data gaps at community and local government levels, and in empowering communities to communicate with officials and service providers. It should therefore primarily be seen as complementing official data.
Using citizen-generated data to monitor the SDGs
In our discussions, stakeholders generally saw a role for citizen-generated data as part of a wider expansion of data sources to complement official data in monitoring the SDGs. At the workshop in Nairobi, discussants emphasised the potential of citizen-generated data to contribute to monitoring the SDGs at local level. For this, the localising of the SDGs would be an important precursor. In Uganda, discussions with team members of the national committee on SDG monitoring indicated that the potential of citizen-generated data is already being considered, to (qualitatively) identify and explain how SDGs are being achieved at the micro level.
Barriers to increased production and use of citizen-generated data
Despite the significant enthusiasm, discussions also highlighted barriers to realising the potential of citizen-generated data. These fell broadly into three categories: lack of clarity around the role of citizen-generated data in the national data ecosystem, technical issues and operational constraints.
The role of citizen-generated data
There was clear recognition that at present, official stakeholders may still view citizen-generated data with some scepticism. While some of these concerns relate to technical issues of data quality, there is also a sense that official stakeholders do not a priori see a role for non-official actors in the production of authoritative data on national development issues.
One of the main points of debate is therefore to what extent and under which conditions citizen-generated datasets could become part of what is considered official data. From the perspective of Ugandan government interlocutors, for example, ‘official statistics’ refers to data generated and/or validated by the national statistical office. If any agency wishes to generate data for national use or wider public consumption, the national statistical office must approve it, for it to be considered official data.

citizen-generated data and sustainable development / devinit.org 31
As citizen-generated data often covers small populations and limited geographical areas, the representativeness of citizen-generated data is a recurring point of concern for policy actors at national and local levels. Also, both official and unofficial actors recognise the politics inherent in data collection and use. From the perspective of official stakeholders, this can raise further concerns about citizen-generated data, though it can be accurate and useful.
Technical issues
Discussions also highlighted technical challenges that need to be overcome to build acceptance of citizen-generated data. Principally these relate to the perceived lack of representativeness, standardisation and quality assurance in the production of citizen-generated data. These concerns over the credibility of citizen-generated data are likely to be especially strong among official data producers and policy actors. Full acceptance of citizen-generated datasets as official data would therefore require them to satisfy quality standards set by national statistics offices, regional and international institutions where relevant.
It is important to note, however, that discussions concerning data quality and standards tend to centre on quantitative data. For qualitative information, as produced by many citizen-generated data efforts, there is in fact limited official guidance. Likewise, citizen-generated data efforts do not necessarily aim at official recognition. In many cases, citizen-generated data may achieve its purpose despite limited standardisation, or can be combined with standardised data to enrich existing information.
Operational issues
Discussions also highlighted some concerns around the scalability and sustainability of citizen-generated data efforts. In this context, key obstacles to overcome include the often-limited methodological capacity in civil society organisations and the dependency of most citizen-generated data efforts on donor funding. A further challenge raised for citizen-generated data efforts is to ensure their ability to set appropriate expectations and provide feedback to communities.
Key ways forward
While it was recognised that adopting the official data standards and methodologies would increase the opportunities for citizen-generated data to feed into official data collection and use, there were also concerns that such processes could be lengthy and bureaucratic.75
Those engaged in citizen-generated data efforts saw the following factors as critical: a focus on and investments into strong methodologies, appropriate training for enumerators, reliable data collection systems and tools, community engagement capacity and quality control.
There was also a sense that advancing access to official data and information was a continuing priority. The use of official data in combination with citizen-generated data was seen as vital to the success of citizen-generated data initiatives.

citizen-generated data and sustainable development / devinit.org 32
With regard to demonstrating the potential of citizen-generated data, a focus on supporting the delivery and monitoring of the sustainable development agenda at the local level was suggested. This should start by supporting the identification of specific community priorities (e.g. particular SDGs) and the production of monitoring data for these.
Putting the findings into context
To put these findings concerning the wider potential of citizen-generated data into context, we return to the premises laid out in the introduction. Undoubtedly, the data and information landscape has significantly changed in recent years. This includes the rising interest among official and non-official stakeholders in the data revolution paradigm and in innovative approaches to data collection and use.
At the same time, there are significant and persistent challenges in many developing countries around producing the timely, disaggregated data that is critical to leaving no one behind. Sustainably producing this data is first and foremost a role for official data producers. Citizen-generated data then has significant potential to complement official data, and in some cases, to do so at scale. It is within this context, and ideally within an inclusive national statistics system, that official and non-official data producers and users can and should increase collaboration.
One area where there should be much potential for such collaboration is at the local level. For many citizen-generated data efforts, the articulation of community needs and feedback is a key concern. Likewise, there are a series of examples of community-based data collection in Uganda, Zimbabwe and Kenya already demonstrating the potential of officials and communities to work together to produce sustainable, comprehensive and disaggregated local data.76
It should therefore be especially fruitful to explore concrete opportunities to increase availability and use of data for local action by drawing on the strengths of official and non-official actors.

citizen-generated data and sustainable development / devinit.org 33
Conclusion This report explored the production and use of citizen-generated data on the basis of two case studies, with the purpose of understanding the changes brought about by these initiatives. The first case study focused on an effort to empower community resource trackers in five districts in Northern Uganda to articulate unsolicited community feedback on a variety of local development concerns to duty-bearers and service providers. The second case study focused on a formalised, larger-scale initiative in Kenya that uses a report card approach to soliciting parental feedback on education services.
These are our main findings: • Both cases demonstrate that citizens – individuals and communities – are
important agents in the data revolution as active users, producers and intermediaries of development data and information.
• In both cases, citizen-generated data initiatives have contributed to specific improvements in the delivery of development-related projects, accessibility and/or quality of public services.
• Both initiatives contributed to empowerment and participation of local actors to contribute to accountability for results, albeit with more limited engagement from poorer groups.
• There is some indication that the Kenyan initiative saw policy-level uptake. • Due to significant differences in context and purpose of the initiatives, the data and
information produced differ significantly in terms of their degree of standardisation and documentation, pointing to a need for a differentiated approach when considering and harnessing the wider potential of citizen-generated data.
Based on the emerging findings from our case study research, we also explored the wider potential for increased production and use of citizen-generated data in a workshop with civil society representatives and through additional interviews with government officials.
Our findings from this indicate that: • There was agreement on the potential of citizen-generated data, in particular at
local level, to contribute to accountability, planning, SDG monitoring and to provide important complementary perspectives to official data and statistics.
• To realise this potential, important concerns need to be addressed, including on data quality and standards, capacity and sustainability of citizen-generated data efforts, and official recognition.
• There is significant opportunity for official and non-official data producers and users to collaborate on this agenda.
Based on our findings we offer the following suggestions, aimed primarily at proponents of citizen-generated data initiatives.

citizen-generated data and sustainable development / devinit.org 34
Going forward, there is a rich agenda for further research and practical demonstration on how this potential can be realised in specific contexts and applications scenarios. This could involve the following: • Conducting further research to develop typologies and case studies of citizen-
generated data initiatives, and the data they produce. A growing number of diverse interventions are described as citizen-generated data, or involve elements of it. A better understanding of different efforts' objectives and emphasis could contribute to a better overall understanding of the potential of citizen-generated data in different settings, for example, whether they primarily aim at increasing accountability in specific local contexts or at generating large-scale comparable datasets on citizen perspectives.
• Exploring in more detail how datasets generated through citizen-generated data initiatives complement available official data. To better understand (and where appropriate persuade official stakeholders of) the value added, more efforts to join-up official and non-official data would be particularly useful. Demonstrating that this leads to better information could be especially fruitful in relation to specific policy priorities (e.g. under specific SDGs).
• Strengthening existing citizen-generated data efforts as appropriate to context and objectives, especially to include marginalised people and communities, and to continuously improve data collection methodologies, tools, training, documentation and quality assurance.
• Building collaboration and partnerships with official actors such as national statistics offices and line ministries, in particular around the development of community-level data collection infrastructures. Given the ongoing need for sustainable data for local decision-making and accountability purposes, citizen-generated data proponents should engage with and wherever possible help strengthen existing and developing official efforts at this level.
• More broadly, engaging in ongoing dialogue with official and other non-official data stakeholders, for instance in the context of emerging data revolution processes. Where citizen-generated data initiatives engage constructively with national statistics offices as the leading official actors, they can contribute to the development of an inclusive national statistics system that maximises the contributions of all users and producers of data.
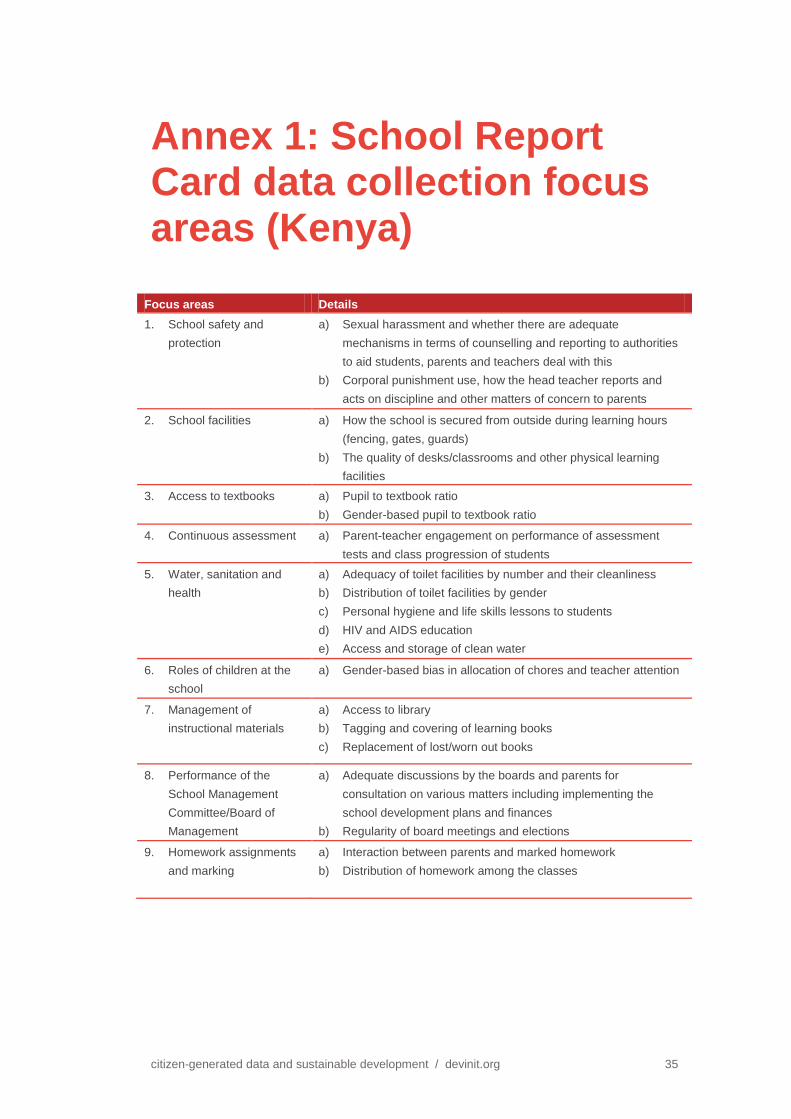
citizen-generated data and sustainable development / devinit.org 35
Annex 1: School Report Card data collection focus areas (Kenya)
Focus areas Details 1. School safety and
protection a) Sexual harassment and whether there are adequate
mechanisms in terms of counselling and reporting to authorities to aid students, parents and teachers deal with this
b) Corporal punishment use, how the head teacher reports and acts on discipline and other matters of concern to parents
2. School facilities a) How the school is secured from outside during learning hours (fencing, gates, guards)
b) The quality of desks/classrooms and other physical learning facilities
3. Access to textbooks a) Pupil to textbook ratio b) Gender-based pupil to textbook ratio
4. Continuous assessment a) Parent-teacher engagement on performance of assessment tests and class progression of students
5. Water, sanitation and health
a) Adequacy of toilet facilities by number and their cleanliness b) Distribution of toilet facilities by gender c) Personal hygiene and life skills lessons to students d) HIV and AIDS education e) Access and storage of clean water
6. Roles of children at the school
a) Gender-based bias in allocation of chores and teacher attention
7. Management of instructional materials
a) Access to library b) Tagging and covering of learning books c) Replacement of lost/worn out books
8. Performance of the School Management Committee/Board of Management
a) Adequate discussions by the boards and parents for consultation on various matters including implementing the school development plans and finances
b) Regularity of board meetings and elections
9. Homework assignments and marking
a) Interaction between parents and marked homework b) Distribution of homework among the classes
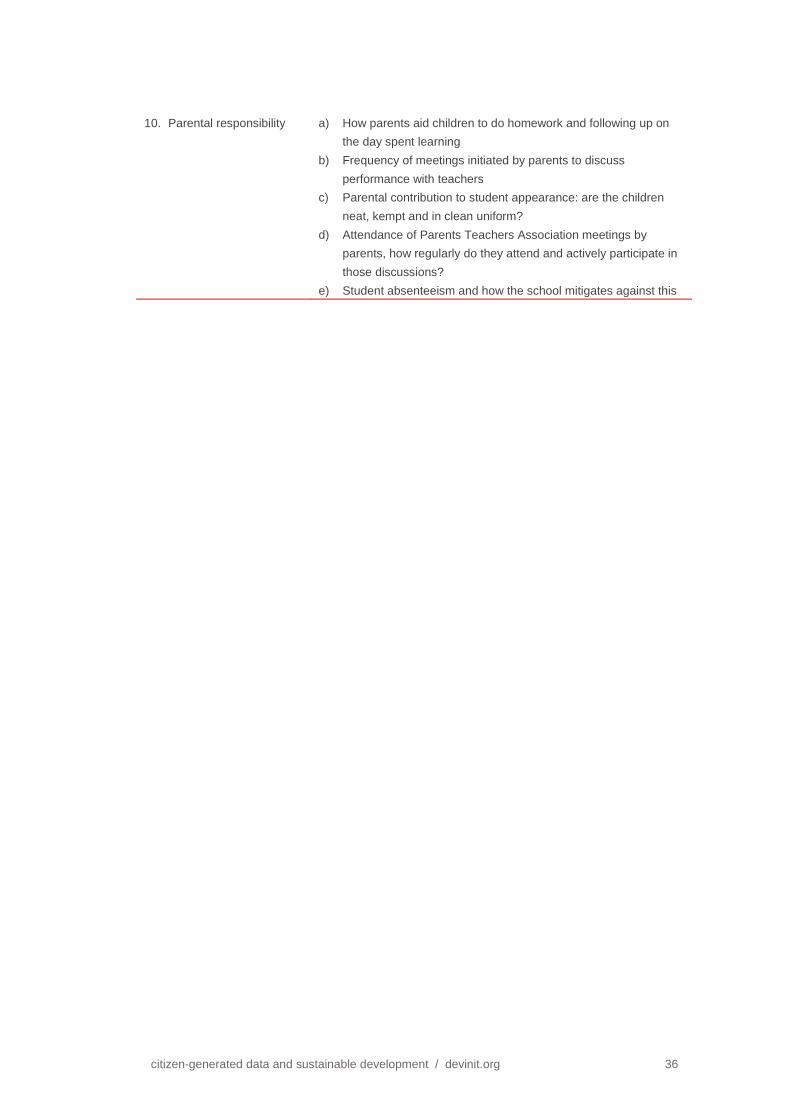
citizen-generated data and sustainable development / devinit.org 36
10. Parental responsibility a) How parents aid children to do homework and following up on the day spent learning
b) Frequency of meetings initiated by parents to discuss performance with teachers
c) Parental contribution to student appearance: are the children neat, kempt and in clean uniform?
d) Attendance of Parents Teachers Association meetings by parents, how regularly do they attend and actively participate in those discussions?
e) Student absenteeism and how the school mitigates against this

citizen-generated data and sustainable development / devinit.org 37
Annex 2: Community resource trackers reporting template (Uganda) District ………………………………………. Village……………………………………… Parish…………………………………………..
What sector did you work on?
Which issue did you follow up? Who raised the issue? When was the issue raised?
Why did you follow up that issue?
What did you do to ensure that that the issue is worked on? When did you start following up the issue? What steps did you take?
What Partners did you establish in the process? Or (Which organization, group of people did you find yourself working with in the process)
What problems did you face while doing your work as trackers?
What change took place after your intervention? (positive, negative)
Name of trackers
1. ………………………. Sign…..…………………… Date……………
2………………………… Sign…………………………Date……………
3………………………… Sign…………………………Date……………
4………………………… sign…………………………Date……………
citizen-generated data and sustainable development / devinit.org 38
Notes
1 IEAG, 2014. A World That Counts: Mobilising the Data Revolution for Sustainable Development. Available at: http://www.undatarevolution.org/ (accessed 22 February 2017). 2 In both Kenya and Uganda, multi-stakeholder conversations have emerged over recent years that aim to define priorities in data production and use for sustainable development, and to encourage collaboration among government and non-state actors. Development Initiatives is involved in both countries in relevant discussions. See for example: Adieno, D., 2015. Data Revolution: testing ideas at the national level in Kenya. Development Initiatives. Available at: http://devinit.org/post/data-revolution-testing-ideas-at-the-national-level-in-kenya/ (accessed 8 March 2017). 3 In both Kenya and Uganda there are multiple official and non-official data portals, some of which are more up to date than others. Overall, uptake of these has been limited, and fragmentation of various initiatives has been diagnosed as a challenge. Cf. Mahihu, C., 2013. Kenya’s Low Consumption of Open Data. Available at: https://ihub.co.ke/blogs/16329/kenyas-low-consumption-of-open-data (accessed 8 March 2017) and DRT, 2015. Unlocking the Potential of a More Harnessed Partnership Among Open Data Actors in Uganda. Available at: https://indigotrust.files.wordpress.com/2016/02/drt-indigo-trust-uganda-final-report.pdf (accessed 21 November 2016). Among newer data initiatives, U-report is worth noting as one gathering citizen-feedback based on SMS reporting, see: http://ureport.ug/ (accessed 8 March 2017) and the UN Global Pulse Lab Kampala is investing in a number of big data-focused projects for application in development settings, see: http://www.unglobalpulse.org/kampala (accessed 8 March 2017). 4 DataShift, 2015. What is citizen-generated data and what is the DataShift doing to promote it? Available at: http://civicus.org/images/ER%20cgd_brief.pdf (accessed 29 March 2016). 5 Cf. DataShift, 2016. Making use of citizen-generated data. Available at: http://www.data4sdgs.org/guide-making-use-of-citizen-generated-data (accessed 8 March 2017) and Lee, L., 2015. How citizen monitoring could make the SDGs really deliver for poor people. Available at: http://insights.careinternational.org.uk/development-blog/governance/how-citizen-monitoring-could-make-the-sdgs-really-deliver-for-poor-people (accessed 8 March 2017). 6 IEAG, 2014. A World That Counts: Mobilising The Data Revolution for Sustainable Development. Available at: http://www.undatarevolution.org/ (accessed 22 February 2017). 7 Cf. DataShift, 2016. Making use of citizen-generated data. Available at: http://www.data4sdgs.org/guide-making-use-of-citizen-generated-data (accessed 8 March 2017) and Lee, L., 2015. How citizen monitoring could make the SDGs really deliver for poor people. Available at: http://insights.careinternational.org.uk/development-blog/governance/how-citizen-monitoring-could-make-the-sdgs-really-deliver-for-poor-people (accessed 8 March 2017). 8 In both Kenya and Uganda, multi-stakeholder conversations have emerged over recent years that aim to define priorities in data production and use for sustainable development, and to encourage collaboration among government and non-state actors. Development Initiatives is involved in both countries in relevant discussions. See for example: Adieno, D., 2015. Data Revolution: testing ideas at the national level in Kenya. Available at: http://devinit.org/post/data-revolution-testing-ideas-at-the-national-level-in-kenya/ (accessed 8 March 2017). 9 In both Kenya and Uganda there are multiple official and non-official data portals, some of which are more up to date than others. Overall, uptake of these has been limited, and fragmentation of various initiatives has been diagnosed as a challenge. Cf. Mahihu, C., 2013. Kenya’s Low Consumption of Open Data. Available at: https://ihub.co.ke/blogs/16329/kenyas-low-consumption-of-open-data (accessed 8 March 2017) and DRT, 2015. Unlocking the Potential of a More Harnessed Partnership Among Open Data Actors in Uganda. Available at: https://indigotrust.files.wordpress.com/2016/02/drt-indigo-trust-uganda-final-report.pdf (accessed 21 November 2016). Among newer data initiatives, U-report is worth noting as one gathering citizen-feedback based on SMS reporting http://ureport.ug/ (accessed 8 March 2017) and the UN Global Pulse Lab Kampala is investing in a number of big data-focused projects for application in development settings http://www.unglobalpulse.org/kampala (accessed 8 March 2017). 10 Anderson, B. and Ntawiha, W., 2016. Uganda’s data ecosystem. Development Initiatives. Available at: http://devinit.org/post/ugandas-data-ecosystem/ (accessed 8 March 2017).

citizen-generated data and sustainable development / devinit.org 39
11 Anderson, B. and Sabiti, B., 2015. Adventures in the Data Revolution: Collecting Ugandan Data. Available at: https://marketsforgood.org/adventures-in-the-data-revolution-getting-to-grips-with-data-in-uganda/ (accessed 8 March 2017). 12 Anderson, B., 2017. Long-term investments in a short-term world: Arguments for sustainable data. Development Initiatives. Available at: http://devinit.org/post/long-term-investments-in-a-short-term-world-arguments-for-sustainable-data/ (accessed 8 March 2017). 13 Sabiti, B., 2017. Common cause, common language: Harmonising key concepts in the Data Revolution. Development Initiatives. Available at: http://devinit.org/post/common-cause-common-language-harmonising-key-concepts-in-the-data-revolution/ (accessed 8 March 2017). 14 Development Research and Training (DRT) is a local Ugandan-based not-for profit organisation, established in 1997 to undertake policy research and analysis that informs pro-poor policies and programmes. Development Initiatives (DI) is an independent international development organisation that focuses on the role of data in driving poverty eradication and sustainable development. DI has offices in Bristol (UK), Kampala (Uganda), Nairobi (Kenya) and Washington (USA). DRT and DI have partnered on a series of projects since 2011. For DI, this study was led by a team based in DI's Nairobi office. 15 See for example the citizen-generated data entry in the toolkit maintained by the Global Partnership for Sustainable Development Data: DataShift, 2016. 16 DataShift, 2015. What is citizen-generated data and what is the DataShift doing to promote it? Available at: http://civicus.org/images/ER%20cgd_brief.pdf (accessed 29 March 2016). 17 Cf. also Gray, J., Lämmerhirt, D. and Bounegru, L., 2016. Changing what counts: how can citizen-generated and civil society data be used as an advocacy tool to change official data collection. Available at: http://civicus.org/thedatashift/wp-content/uploads/2016/03/changing-what-counts-2.pdf (accessed 10 March 2017) and Wilson, C. and Rahman, Z., 2015. Citizen-generated data and governments: Towards a collaborative model. Available at: http://civicus.org/images/citizen-generated%20data%20and%20governments.pdf (accessed 10 March 2017). 18 Laemmerhirt, D., Jameson, S. and Prasetyo, E., 2016a. Acting Locally, Monitoring Globally? How to Link Citizen-generated Data to SDG Monitoring, page 16f. Available at: http://civicus.org/thedatashift/wp-content/uploads/2015/07/Acting-locally-monitoring-globally_Full-Report.pdf (accessed 10 March 2017). 19 There is also possibly a wider question here as to where to draw the boundary for what counts as citizen-generated data and what does not. Consider for example public service complaints hotlines run by a civil society organisation, an Ombudsman-type office and a public service provider. Each of these could deliver valuable citizen feedback but which counts as a citizen-generated data initiative? This in turn raises different questions depending on whether the focus is on the quality and use of the data, or on citizen-generated data as an approach to increasing citizen engagement and participation. 20 See for example the programmes of major development actors on citizen participation: DFID, 2013. Governance and Transparency Fund (GTF). Available at: https://www.gov.uk/guidance/governance-and-transparency-fund-gtf (accessed 1 April 2016); Oxfam America, 2016. Active Citizens and Accountable States. Available at: http:/policy-practice.oxfamamerica.org/work/active-citizens-accountable-states (accessed 1 April 2016); UNDP, 2016. Civic Engagement. Available at: http://www.undp.org/content/undp/en/home/ourwork/democratic-governance-and-peacebuilding/inclusive-political-processes/civic-engagement.html (accessed 1 April 2016); as well as wider research on the subject: Irvin, R. A. and Stansbury, J., 2004. Citizen Participation in Decision Making: Is It Worth the Effort? in Public Administration Review, 64(1): 55–65; IDS, 2015. Development Research Centre on Citizenship, Participation and Accountability. Available at: http://www.ids.ac.uk/project/development-research-centre-on-citizenship-participation-and-accountability (accessed 1 April 2016). 21 TAP Network, 2015. Transparency, Accountability and Participation (TAP): Catalyzing inclusive and transformative Financing for Development. Available at: https://www.access-info.org/wp-content/uploads/TAP_Network_FfD3_Position_Paper.pdf (accessed 10 March 2017). 22 Cf. DataShift, 2016. 23 Laemmerhirt, D., Jameson, S. and Prasetyo, E., 2016a. 24 Rogers, K., 2015. Traditional vs. citizen-generated data: Is it a case of either-or? Available at: https://www.devex.com/news/traditional-vs-citizen-generated-data-is-it-a-case-of-either-or-85975 (accessed 29 March 2016); Gray, J., Lämmerhirt, D. and Bounegru, L., 2016; Lee, L., 2015. 25 Gray, J., Lämmerhirt, D. and Bounegru, L., 2016. 26 Gray, J., Lämmerhirt, D. and Bounegru, L., 2016.

citizen-generated data and sustainable development / devinit.org 40
27 Cf. for example Hochachka, W. M. et al., 2012. Data-intensive science applied to broad-scale citizen science. Trends in Ecology and Evolution, 27(2): 130–7; Lagoze, C., 2014. eBird: Curating Citizen Science Data for Use by Diverse Communities. International Journal of Digital Curation, 9(1): 71–82; and Peters, M., Eames, C. and Hamilton, D., 2015. The use and value of citizen science data in New Zealand. Journal of the Royal Society of New Zealand, 45(3): 151–60. 28 Cavallo, S., Lynch, J. and Scull, P., 2014. The Digital Divide in Citizen-Initiated Government Contacts: A GIS Approach. Journal of Urban Technology, 21(4): 77–93; Wilson, C. and Rahman, Z., 2015. 29 Weiss, C. H., 1979. The Many Meanings of Research Utilization. Public Administration Review, 39(5): 426–31. 30 Gray, J., Lämmerhirt, D. and Bounegru, L., 2016. 31 Head, B. W., 2015. Policy Analysis: Evidence Based Policy-Making. In: J. D. Wright, ed. International Encyclopedia of the Social & Behavioral Sciences. Amsterdam: Elsevier, pages 281–7; Fox, J., 2014. Social accountability: what does the evidence really say? GPSA Working Paper 1, Washington, DC: World Bank; DFID, 2014. What is the evidence on the impact of research on international development? A DFID literature review., London/East Kilbride: Department for International Development. 32 Head, B. W., 2015. 33 Head, B. W., 2015; DFID, 2014; Newman, K. et al., 2013. What is the evidence on evidence‐informed policy making? Lessons from the International Conference on Evidence‐Informed Policy Making, Oxford: International Network for the Availability of Scientific Publications; Homer, D. and Abdel-Fattah, D., 2014. Understanding Government Data Use in Nepal, Washington, DC: Development Gateway. 34 DFID, 2014; Kitchin, R., 2013. Four critiques of open data initiatives. Available at: http://www.maynoothuniversity.ie/progcity/2013/11/four-critiques-of-open-data-initiatives (accessed 7 February 2016); REBOOT, 2015. Using Data to Influence Government Decisions. Opportunities and Challenges for User-Centered Design to Improve Governance Data Impact, New York: REBOOT. 35 Cindio, F. d. and Peraboni, C., 2011. Building Digital Participation Hives: Toward a Local Public Sphere. In: M. Foth, ed. From Social Butterfly to Engaged Citizen: Urban Informatics, Social Media, Ubiquitous Computing, and Mobile Technology to Support Citizen Engagement. Cambridge, MA: MIT Press, pages 93–113. 36 Ringold, D., Holla, A., Koziol, M. and Srinivasan, S., 2012. Citizens and Service Delivery. Assessing the Use of Social Accountability Approaches in Human Development, Washington, DC: World Bank. 37 Irvin, R. A. and Stansbury, J., 2004. 38 Wilson, C. and Rahman, Z., 2015. 39 Cf. for example the growth of Uganda's U-report initiative: Unicef, 2015. UNICEF’s U-Report social platform hits 1 million active users. Available at: http://www.unicef.org/media/media_82583.html (accessed 1 April 2016). Despite the significant growth of U-report, about 47% of users have university-level education, and despite significant uptake of the SMS reporting mechanism, evidence for impact in terms of increased government responsiveness is lacking to date. See: Peixoto, T. and Fox, J., 2016. When Does ICT-Enabled Citizen Voice Lead to Government Responsiveness? World Development Report 2016 Background Paper Digital Dividends, Washington, DC: World Bank. For the broader question of the digital divide also see Cavallo, S., Lynch, J. and Scull, P., 2014. The Digital Divide in Citizen-Initiated Government Contacts: A GIS Approach. Journal of Urban Technology, 21(4): 77–93. 40 Wilson, C. and Lanerolle, I. d., 2016. Test It and They Might Come: Improving the Uptake of Digital Tools in Transparency and Accountability Initiatives. IDS Bulletin, 47(1): 113–26. 41 Francis, P. and James, R., 2003. Balancing rural poverty reduction and citizen participation: The contradictions of Uganda’s decentralization program. World Development, 31(2): 325–337. 42 Ssebunya, A. K., 2014. Why local realities matter for Citizens’ Voice and Accountability. Lessons from Mwananchi Uganda pilot projects. Field Actions Science Reports, Volume 11, pages 1–7. 43 Gray, J., Lämmerhirt, D. and Bounegru, L., 2016. 44 Cf. Wilson, C. and Rahman, Z., 2015; Peters, M., Eames, C. and Hamilton, D., 2015; Hunter, J., Alabri, A. and Ingen, C. v., 2013. Assessing the quality and trustworthiness of citizen science data. Concurrency and Computation: Practice and Experience, Volume 25, pages 454–66; Ubaldi, B., 2013. Open Government Data: Towards Empirical Analysis of Open Government Data Initiatives. OECD Working Papers on Public Governance. Available at: http://dx.doi.org/10.1787/5k46bj4f03s7-en (accessed 10 March 2017). 45 Gray, J., Lämmerhirt, D. and Bounegru, L., 2016. 46 Ringold, D., Holla, A., Koziol, M. and Srinivasan, S., 2012.

citizen-generated data and sustainable development / devinit.org 41
47 National Taxpayers Association, 2016. Aid Transparency Pilot Report. Available at: http://integrityaction.org/sites/default/files/publication/files/Publication_NTA%20Integrity%20Action%20Aid%20Transaprency%20Pilot%20Project.pdf (accessed 26 February 2017). 48 Peixoto, T. and Fox, J., 2016. 49 Benequista, N., 2011. Blurring the Boundaries. Citizen Action Across States and Societies: A Summary of Findings from a Decade of Collaborative Research on Citizen Engagement, Brighton: Development Research Centre on Citizenship, Participation and Accountability; Purdam, K., 2014. Citizen social science and citizen data? Methodological and ethical challenges for social research. Current Sociology, 62(3): 374–392; Cavallo, S., Lynch, J. and Scull, P., 2014; Peters, M., Eames, C. and Hamilton, D., 2015. 50 Benequista, N., 2011. 51 Cf. Ringold, D., Holla, A., Koziol, M. and Srinivasan, S., 2012. 52 DRT, 2012. Feedback methods and practices in Northern and North Eastern Uganda. Available at: http://drt-ug.org/2016/10/06/feedback-methods-and-practices-in-northern-and-north-eastern-uganda/ (accessed 10 March 2017). 53 Cf. DRT, 2016. Better resource delivery through better information. Available at: http://drt-ug.org/2016/10/31/better-resource-delivery-through-better-information-ppa/ (accessed 10 March 2017). 54 See for more detail in DRT; DI, 2014. Using resource tracking and feedback to enhance accountability and resource effectiveness. Available at: http://devinit.org/wp-content/uploads/2014/11/Africa-Evidence-Network-paper1.pdf (accessed 5 March 2017). 55 A parish in Uganda is a lower local government planning unit where the lowest ranking civil servant at local government level works (i.e. the Parish Chief). A parish is made up of several villages, and several parishes make up a sub-county. Note that this structure is not in any way related to the organisation of the Catholic church. 56 According to DRT staff, this basic system was mostly effective in supporting local information tracking and data analysis to inform follow-up and support to trackers as well as for donor reporting purposes. However, there were operational differences in the regularity and comprehensiveness of information capture between different localities. 57 Cf. DRT, 2013. Resource tracking in five communities of Northern and North Eastern Uganda: Gulu, Katakwi, Kitgum, Kotido and Pader districts. Progress Report. Available at: http://drt-ug.org/2016/11/21/community-resource-flow-and-feedback-report/ (accessed 10 March 2017). 58 The Baraza Program, initiated in 2009, is a formal mechanism introduced by the Government of Uganda to provide a 'platform for the citizens to participate in the development cycle through monitoring the use of public resources in the delivery of services at local government level.' For more detail see: Office of the Prime Minister, 2017. Baraza Program. Available at: http://opm.go.ug/baraza-program/ (accessed 13 March 2017). 59 The NTA describes itself as a national, volunteer-based, independent and nonpartisan organisation established to improve the delivery of services and the management of devolved funds for the benefit of citizens by supporting good governance in Kenya through strengthening of citizen-to-government and citizen-to-citizen accountability. NTA does this mainly via the deployment of Citizen Report Card exercise where staff design and roll out citizen reporting tools on the education, health and governance sectors and share the findings publicly and with government Cf. NTA, 2016. Our History. Available at: http://nta.or.ke/index.php/en/about-us/our-history (accessed 10 March 2017). 60 Ministry of Education, 2005. Kenya Education Sector Support Programme 2005-2010. 61 Cf. in particular Ministry of Education and NTA, 2015. Primary School Report Card Guidelines for Parents. 62 NTA, 2014a. School Report Card Project - Phase III 2014. Empowering school communities through capacity building. 63 Mutsotso, B. M., 2015. Learning paper. Closing the loop: National Taxpayers Association’s KENYA project – 2014. Available at: https://integrityaction.org/sites/default/files/publication/files/Kenya%20Learning%20paper%202014.pdf (accessed 10 March 2017). 64 Schools identified = (target sample/total public schools x number of public primary schools in the county). Cf. NTA, 2014b. School Report Card 2013. 65 Ministry of Education and NTA, 2015. 66 These parents must be volunteers and not executive officials of the school’s management board/committees. They must also have a good level of education.

citizen-generated data and sustainable development / devinit.org 42
67 Ministry of Education and NTA, 2015. 68 Between 2013 and 2014, schools that recorded an above average mean School Report Card score (6/10) scored better in KCPE performance with the average Pearson score of 0.66, indicating a strong correlation between School Report Card scoring and KCPE performance. Out of the 10 School Report Card categories, 'School safety and protection' had the largest Pearson score, 0.76, while 'Water, sanitation and health' had the least mean score of 0.27, indicating weak correlation with KCPE performance. The Pearson correlation coefficient can take a range of values from +1 to -1. A value of 0 indicates that there is no association between the two variables. A value greater than 0 indicates a positive association; that is, as the value of one variable increases, so does the value of the other. 69 NTA, 2014a. 70 Cf. NTA, 2014b. 71 Mutsotso, B. M., 2015. 72 NTA, 2013, School Report card 2012 73 Mutsotso, B. M., 2015. 74 Ministry of Education, 2015. National Education Sector Plan. Available at: http://www.education.go.ke/index.php/downloads/file/82-national-education-sector-plan-volume-two-operational-plan (Accessed 16 March 2017). 75 For example, the Uganda Bureau of Statistics (UBOS) recently announced that any information that is going to be used to make conclusions at national level for government consumption and use must first be approved by the UBOS. UBOS would have to review the methodology and the data production process, and give a certificate of approval to respective organisations for respective studies/data generation processes, similar to the process used by the National Council of Science and Technology. 76 Anderson, B., 2017.

Development Initiatives (DI) is an independent international development organisation working on the use of data to drive poverty eradication and sustainable development. Our vision is a world without poverty that invests in human security and where everyone shares the benefits of opportunity and growth.
We work to ensure that decisions about the allocation of finance and resources result in an end to poverty, increase the resilience of the world’s most vulnerable people, and ensure no one is left behind.
Copyright © 2017 Development Initiatives We encourage dissemination of our work provided a reference is included.
Contact Ssanyu Rebecca, Senior Programme Officer, SPHD E: [email protected]
Karen Rono-Bett, Regional Technical Lead T: +254 (0) 20 2725346 | E: [email protected]
Steve Kenei, Data Scientist T: +254(0)202725346/7/8 | E: [email protected]
To find out more about our work visit: www.devinit.org | Twitter: @devinitorg Email: [email protected]
Development Initiatives is a group headed by Development Initiatives Poverty Research Limited, a not-for-profit company established in England no. 06368740. Registered office: North Quay House, Quay Side, Temple Back, Bristol, BS1 6FL, UK.
UK OFFICE Development Initiatives North Quay House Quay Side, Temple Back Bristol, BS1 6FL, UK +44 (0) 1179 272 505
KENYA OFFICE Development Initiatives Shelter Afrique Building 4th Floor, Mamlaka Road Nairobi, Kenya PO Box 102802-00101 +254 (0) 20 272 5346
DEVELOPMENT RESEARCH AND TRAINING (DRT) Ggaba Road, Mutesasira Zone, Kansanga PO Box 22459 Kampala, Uganda +256 (0) 312 – 263629/30 +256 (0) 414 – 269495 www.drt-ug.org
US OFFICE Development Initiatives 1110 Vermont Ave NW, Suite 500, Washington DC 20005, US