Embed Size (px)
DESCRIPTION
Youth are key to the prosperity of cities in the developing world, yet many barriers prevent them from fulfilling this role - most notably access to education, vocational training, and employment. It is crucial that governments and institutions assist youth to overcome these barriers by facilitating equitable access to education and employment.
Citation preview
United Nations Human Settlements ProgrammeP.O.Box 30030,Nairobi 00100,Kenya;Tel: +254-20-7623120; Fax: +254-20-76234266/7 (central office)[email protected]
www.unhabitat.org
CITIES OF YOUTH: CITIES OF PROSPERITY
Youth are key to the prosperity of cities in the developing world, yet many
barriers prevent them from fulfilling this role — most notably access to education, vocational training,
and employment. It is crucial that governments and institu-tions assist youth to overcome these barriers by facilitating equitable access to education and employment. This report
focuses on the nexus between employment, cities, and youth: ar-eas that drive economic prosperity in the developing world. The report analyzes those factors that increase the ability of youth to secure employment. Mobile communication technologies
as well emerge as supporting asset development among young people and equalizing wealth disparities.
The conclusion considers policy and program implications.
HS/025/13E ISBN (Volume): 978-92-1-132562-1
CITIES OF YOUTH: CITIES OF PROSPERITY
ii CITIES OF YOUTH: CITIES OF PROSPERITY
First published in Nairobi in 2013 by UN-Habitat. Copyright © United Nations Human Settlements Programme 2013
All rights reserved United Nations Human Settlements Programme (UN-Habitat) P. O. Box 30030, 00100 Nairobi GPO KENYA Tel: 254-020-7623120 (Central Office) www.unhabitat.org
HS/025/13E ISBN (Volume): 978-92-1-132562-1
Disclaimer
The designations employed and the presentation of the material in this publication do not imply the expression of any opinion whatsoever on the part of the Secretariat of the United Nations concerning the legal status of any country, territory, city or area or of its authorities, or concerning the delimitation of its frontiers of boundaries.
Views expressed in this publication do not necessarily reflect those of the United Nations Human Settlements Programme, the United Nations, or its Member States.
Excerpts may be reproduced without authorization, on condition that the source is indicated.
Acknowledgement
Director and Principal Author: Douglas Ragan
Editors: Willem Van Vliet, Louise Chawla
Design and Layout: Andrew Ondoo
Sponsor: Government of Norway, University of Colorado,
Children Youth and Environments Centre
CITIES OF YOUTH: CITIES OF PROSPERITY
iiiCITIES OF YOUTH: CITIES OF PROSPERITY
TablE OF COnTEnTS
List of Figures and Tables iv
Introduction 1
Chapter 1: Youth and the Urban Advantage 3
the Urban Disadvantage 6
Global responses and Mandates 10
Women, poverty, and employment 12
In Closing 13
Chapter 2: Cities of Youth 14
Summary profile of Six Urban regions 14
Summary of Urban regions 15
Youth as engines of prosperity 17
education and prosperous Cities 19
education, employment and Low Dependency ratio Countries: Columbia, India, and egypt 20
education and Gender 24
education accessibility, Infrastructure, and Wealth 24
Urbanization, Increased Wealth, and Mobile technologies 25
In Closing 28
Youth are assets to their community and a key constituency of cities. 29
Focus on transitions: Youth as one stage in a continuum from childhood to adulthood. 29
Chapter 3: Policy and Practice 29
the youthful developing world: tailoring the global response to employment. 30
Women are key to prosperous cities. 30
the improvement of and increased accessibility to urban infrastructure 30
Initiate and expand evaluation of best practices in skill training programs. 31
Collect labour force statistics disaggregated by age and along other dimensions (gender, disability status, etc.). 31
References 32

iv CITIES OF YOUTH: CITIES OF PROSPERITY
lIST OF bOx, FIguRES and TablES
BOX
Box 1: International Mandates and Youth Employment 10
FIgURes
FIgurE 1: Percentage of Male and Female Population, Aged 1–12, by Slum and Non-Slum residence, in Selected Countries 4
FIgurE 2: Youth and Employment, World, and region 5
FIgurE 3:Share of youth population (15-24) in the working age population, world and region, 1991 and 2015 (%) 6
FIgurE 4: Percentage of Youth Working in Informal Sector Living in Slums 8
FIgurE 5: unemployed, regional Scores: Surveys Conducted in 129 Countries and Areas in 2009/10 9
FIgurE 6: underemployed, regional Scores: Surveys conducted in 129 countries and areas in 2009/10 9
FIgurE 7: Population Pyramids for Thailand from 1960–2005 18
FIgurE 8: Completed Levels of Education by Location 21
FIgurE 9: Percentage Completing Each grade in Zambia (World Bank, 2006) 22
FIgurE 10: Completed levels of education by gender 24
FIgurE 11: Education and the Wealth Index 25
FIgurE 12: Households with Fixed Phones 27
TABLes
TABLE 1: global and regional Estimates of the Youth Labour Force, 2003–2015 7
TABLE 2: Share of Vulnerable Employment, North vs. Sub-Saharan Africa (in %) 11

1CITIES OF YOUTH: CITIES OF PROSPERITY
Cities of Youth: Cities of Prosperity is a back-ground report for the upcoming State of the Urban Youth Report (SUYR) 2011/2012—Prosperous Cities. Youth are key to the prosper-ity of cities in the developing world, yet many barriers—most notably under and unemploy-ment and a lack of access to basic services such as healthcare and education—prevent them from fulfilling this role. Youth from 15–24 are societies’ most essential and dynamic resource; if supported to create secure livelihoods, they, their families, and their communities will prosper. It is the responsibility of governments and institutions to assists youth in overcom-ing the barriers to their success, for example through the facilitation of equitable access to education and employment. This report focuses on the nexus between employment,
InTrOdUCTIOn
Students in a technical education program supported by the World bank in antioquia, Colombia. © Charlotte Kesl/World Bank
cities, and youth: areas that drive economic prosperity in the developing world. The report analyzes those factors that increase the ability of youth to secure employment. Mobile com-munication technologies appear to emerge as supporting asset development among young people and equalizing wealth disparities. The conclusion considers policy and program im-plications.
Chapter 1 will analyze pertinent research on youth and employment. It will situate youth employment globally, identify its current state, and review the barriers that youth face. Chapter 2 will analyze the Demographic and Health Surveys (DHS) of six geographically diverse urban areas. The analysis will focus on human capital (skills), income composition,
2 CITIES OF YOUTH: CITIES OF PROSPERITY
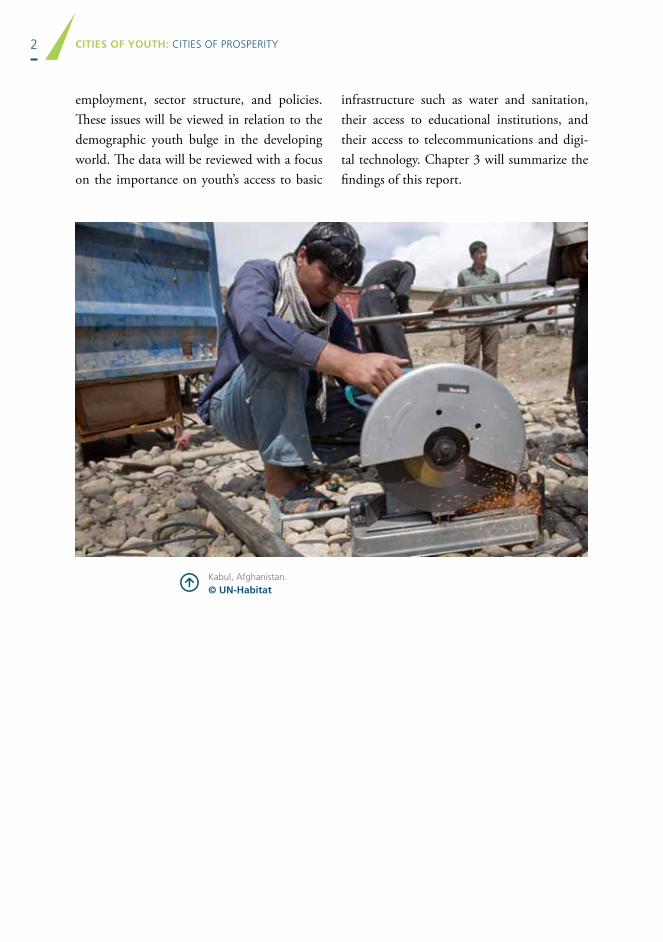
employment, sector structure, and policies. These issues will be viewed in relation to the demographic youth bulge in the developing world. The data will be reviewed with a focus on the importance on youth’s access to basic
infrastructure such as water and sanitation, their access to educational institutions, and their access to telecommunications and digi-tal technology. Chapter 3 will summarize the findings of this report.
Kabul, afghanistan. © Un-Habitat
3CITIES OF YOUTH: CITIES OF PROSPERITY
ChaPTER 1: YOUTH and THE UrBan advanTagE
Urbanization is the engine that propels the world towards prosperity in the 21st century and youth are the engineers. Youth are society’s most essential and dynamic human resource. There are more people under the age of 25 to-day than ever, totalling nearly three billion or almost half of the total global population; 1.3 billion of that total are between the age of 12 and 24 (World Bank, 2006). These youth live, by and large, in cities and towns; the cities of the developing world account for over 90% of the world’s urban growth and youth account for a large percentage of those inhabitants. It is estimated that as many as 60% of all urban dwellers will be under the age of 18 by 2030 (Woodrow Wilson International Center for Scholars, 2003).
Historically, youth have not been seen as a demographic important enough to engage with—this is even true for the world’s most youthful regions such as Africa—and they are not a focus for governments or funding agen-cies (Bennell, 2000; Mulenga, 2000). Yet there has been a growing understanding and con-cern over the declining socio-economic situ-ation of young people and their lack of live-lihood opportunities (Mayor & Binde, 2001; Curtain, 2000; Grierson, 1997; Mkandawire, 1996; Schnurr, 1998), especially in regions such as sub-Saharan Africa (Mayor & Binde, 2001; Sarr, 2004). These youth often grow up in poverty and they are excluded from the eco-nomic, political, and social life of their coun-tries, which in turn breeds disillusionment and
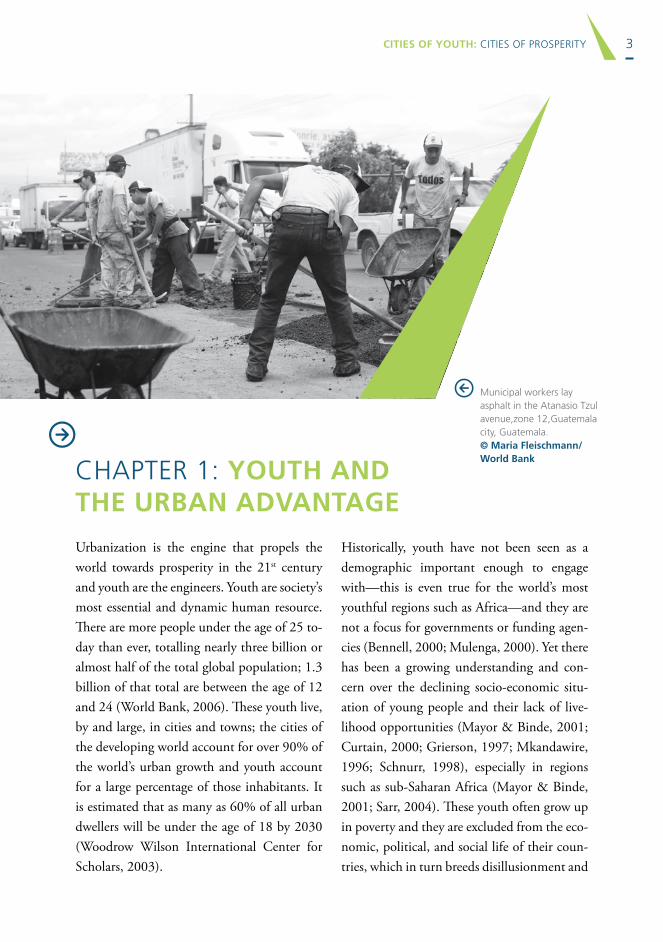
Municipal workers lay asphalt in the atanasio Tzul avenue,zone 12,guatemala city, guatemala. © Maria Fleischmann/World Bank
4 CITIES OF YOUTH: CITIES OF PROSPERITY
hopelessness, violence, and upheaval (Cincot-ta, 2005, 2008; Urdal, 2006). Indeed, much research has been done on youth violence in the developing world, especially in the Mid-dle East and North Africa (Cincotta, 2005; NIC, 2008; Urdal, 2006). This research found links between youth unemployment and so-cial exclusion, and suggests that this may lead to political and social instability (ILO, 2010) and possibly violence and terrorism. Yet vio-lence has not always been the last refuge, with vibrant and peaceful youth-led revolutions taking place, most recently in the Middle East and North Africa.
In the last decade, there has also been a rec-ognition that urban youth in the developing world are growing at an explosive rate. Be-tween 2000 and 2030, Africa’s urban popu-lation, which is to a great percentage youth, will grow from 294 million to 742 million, an
increase of 152%; Asia’s by 94%, and Latin America’s by 55% (UNFPA, 2007). Should these youth transition into adulthood in an environment that supports equal opportuni-ties, representation in governance, education, and secure employment opportunities, then they can become the engine for the creation of the economic and social capital that is needed to jump-start development in many regions of the world. This demographic “youth bulge” can be a “demographic gift” to the countries where it is occurring (UNDP, 2002, p.38), and it was this gift—a condition in which an economically active population exceeded the economically dependent —that fuelled the economic success of the Asian Tigers in the 1980s. Even halving the world’s youth unem-ployment rate may add an estimated USD 2.2 and 3.5 trillion, or between 4.4 and 7.0%, to the global GDP (ILO, 2004).
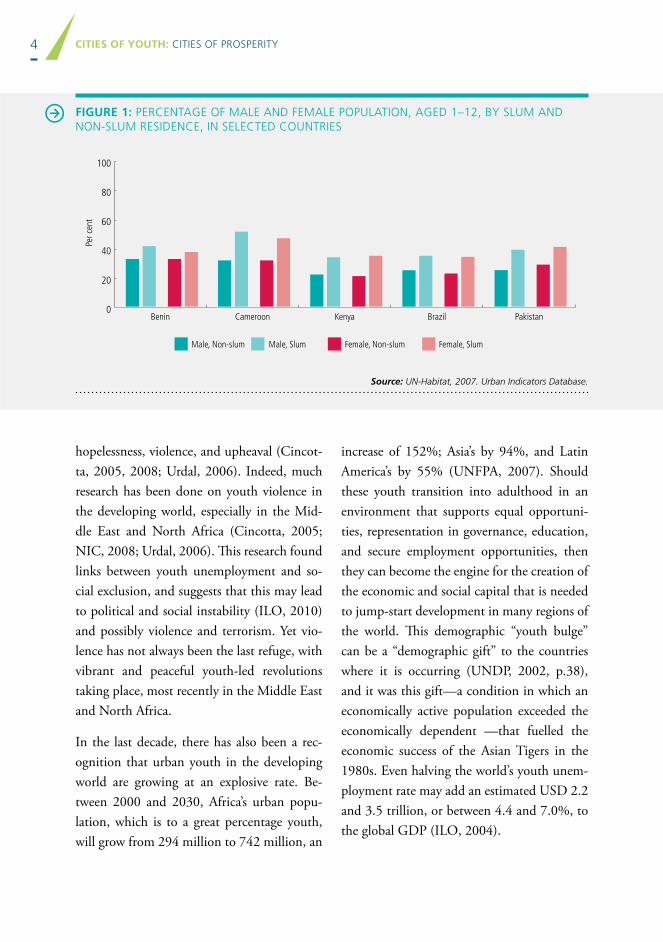
FIgUrE 1: PERCEnTagE OF MalE and FEMalE POPulaTIOn, agEd 1–12, bY SluM and nOn-SluM RESIdEnCE, In SElECTEd COunTRIES
Source: UN-Habitat, 2007. Urban Indicators Database.
Benin Cameroon Kenya Brazil Pakistan
Male, Non-slum Male, Slum Female, Non-slum Female, Slum
100
80
60
40
20
0
Per c
ent
5CITIES OF YOUTH: CITIES OF PROSPERITY
Youth, who are in the most productive times of their lives, can leverage the “urban advan-tage” (UN-Habitat, 2010), a concept relating to the abundance of goods, services such as health, recreation and education, amenities, and opportunities found in cities. No devel-oped country has achieved any level of pros-perity without urbanization; cities account for approximately 70% of global GDP, and as much as 55% of the GDP in low-income countries (UN-Habitat and DFID, 2002). It is anticipated that 80% of future economic growth will take place in cities (SIDA, 2006).
With youth globally being the best educated in history, the assumption would be that this leveraging of the urban advantage can happen exponentially—especially when contextual-ized within rapid global urbanization. Women play football on the 28 September
Stadium grounds. These days, the venue is again used for sporting events in Conakry, guinea. © nancy Palus/IrIn
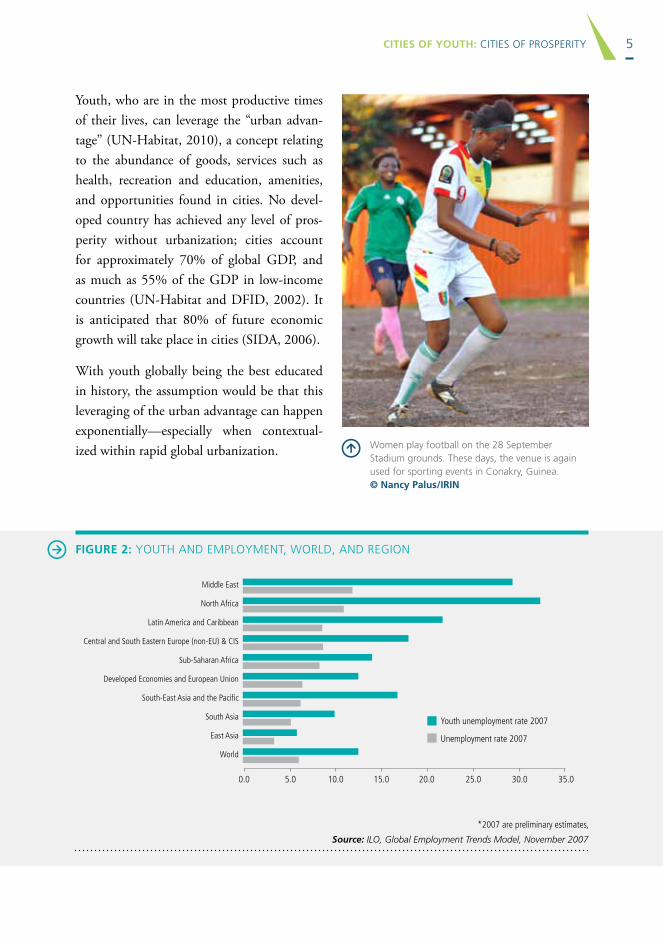
FIgUrE 2: YOuTh and EMPlOYMEnT, WORld, and REgIOn
Middle East
North Africa
Latin America and Caribbean
Central and South Eastern Europe (non-Eu) & CIS
Sub-Saharan Africa
Developed Economies and European union
South-East Asia and the Pacific
South Asia
East Asia
World
0.0 5.0 10.0 15.0 20.0 25.0 30.0 35.0
Youth unemployment rate 2007
Unemployment rate 2007
*2007 are preliminary estimates,
Source: ILO, Global Employment Trends Model, November 2007
6 CITIES OF YOUTH: CITIES OF PROSPERITY
The urban disadvantage
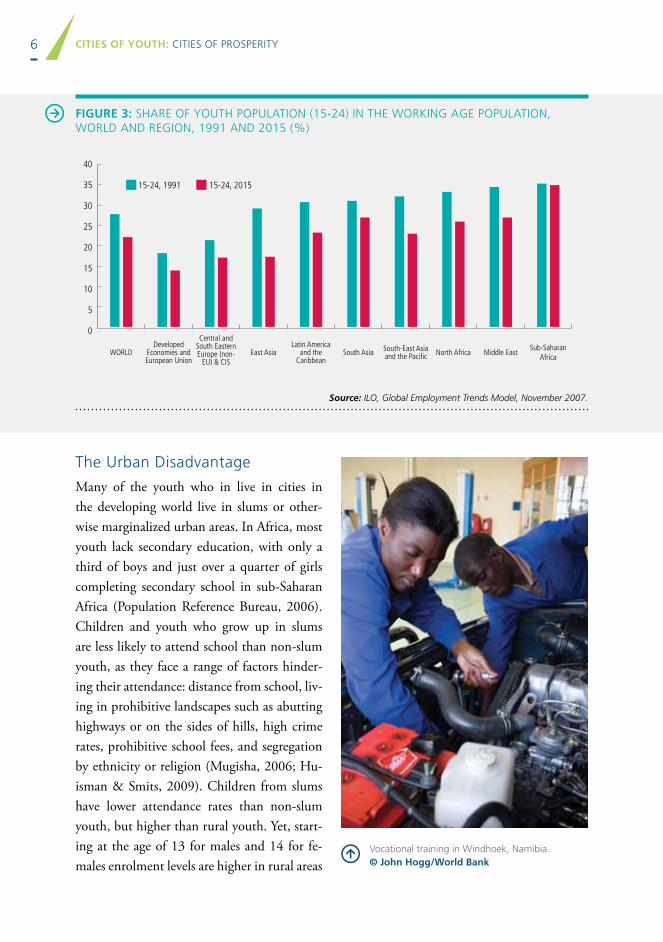
Many of the youth who in live in cities in the developing world live in slums or other-wise marginalized urban areas. In Africa, most youth lack secondary education, with only a third of boys and just over a quarter of girls completing secondary school in sub-Saharan Africa (Population Reference Bureau, 2006). Children and youth who grow up in slums are less likely to attend school than non-slum youth, as they face a range of factors hinder-ing their attendance: distance from school, liv-ing in prohibitive landscapes such as abutting highways or on the sides of hills, high crime rates, prohibitive school fees, and segregation by ethnicity or religion (Mugisha, 2006; Hu-isman & Smits, 2009). Children from slums have lower attendance rates than non-slum youth, but higher than rural youth. Yet, start-ing at the age of 13 for males and 14 for fe-males enrolment levels are higher in rural areas
Vocational training in Windhoek, namibia. © John Hogg/World Bank
FIgUrE 3: ShaRE OF YOuTh POPulaTIOn (15-24) In ThE WORKIng agE POPulaTIOn, WORld and REgIOn, 1991 and 2015 (%)
Source: ILO, Global Employment Trends Model, November 2007.
40
35
30
25
20
15
10
5
0
WorLDDeveloped
Economies and European union
Central and South Eastern Europe (non-
Eu) & CISEast Asia
Latin America and the
CaribbeanSouth Asia South-East Asia
and the Pacific North Africa Middle EastSub-Saharan
Africa
15-24, 1991 15-24, 2015
7CITIES OF YOUTH: CITIES OF PROSPERITY
than in urban areas, and starting at nine for females and 11 for males, the enrolment for slum children starts to decline while that of rural children increases or remains constant (Mugisha, 2006.) As Figure 1 demonstrates, slums are predominantly inhabited by young people. The advantages that accrue to urban youth do not necessarily accrue to slum chil-dren and youth.
In addition, while 85% of those of working age live in the developing world, most coun-tries in the developing world have youth un-employment rates that are two to three times greater than among adults; of the approxi-mately ten countries that have less than two times the adult rate, five are in sub-Saharan Africa (SSA), and two are unique in having more adults unemployed than youth—Liberia and Madagascar (ILO, 2010).
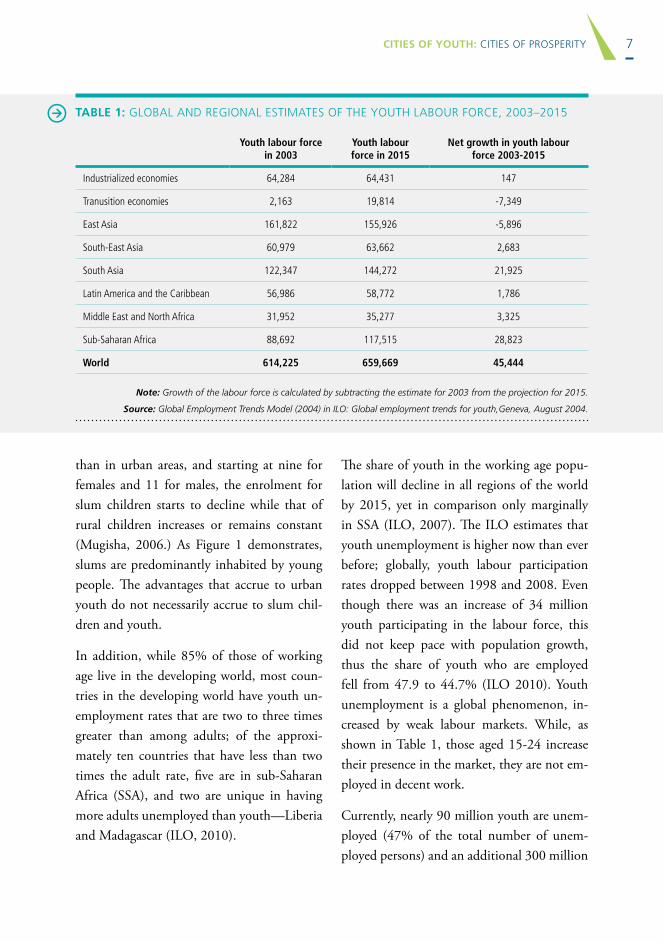
The share of youth in the working age popu-lation will decline in all regions of the world by 2015, yet in comparison only marginally in SSA (ILO, 2007). The ILO estimates that youth unemployment is higher now than ever before; globally, youth labour participation rates dropped between 1998 and 2008. Even though there was an increase of 34 million youth participating in the labour force, this did not keep pace with population growth, thus the share of youth who are employed fell from 47.9 to 44.7% (ILO 2010). Youth unemployment is a global phenomenon, in-creased by weak labour markets. While, as shown in Table 1, those aged 15-24 increase their presence in the market, they are not em-ployed in decent work.
Currently, nearly 90 million youth are unem-ployed (47% of the total number of unem-ployed persons) and an additional 300 million
TaBlE 1: glObal and REgIOnal ESTIMaTES OF ThE YOuTh labOuR FORCE, 2003–2015
Youth labour force in 2003
Youth labour force in 2015
Net growth in youth labour force 2003-2015
Industrialized economies 64,284 64,431 147
Tranusition economies 2,163 19,814 -7,349
East Asia 161,822 155,926 -5,896
South-East Asia 60,979 63,662 2,683
South Asia 122,347 144,272 21,925
Latin America and the Caribbean 56,986 58,772 1,786
Middle East and North Africa 31,952 35,277 3,325
Sub-Saharan Africa 88,692 117,515 28,823
World 614,225 659,669 45,444
Source: Global Employment Trends Model (2004) in ILO: Global employment trends for youth,Geneva, August 2004.
Note: Growth of the labour force is calculated by subtracting the estimate for 2003 from the projection for 2015.
8 CITIES OF YOUTH: CITIES OF PROSPERITY
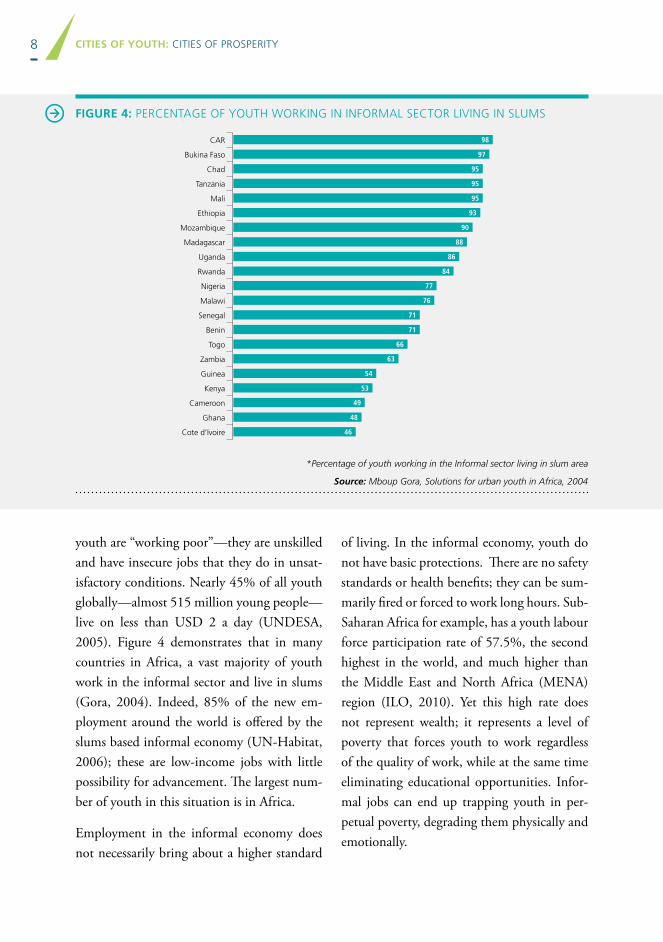
Source: Mboup Gora, Solutions for urban youth in Africa, 2004
FIgUrE 4: PERCEnTagE OF YOuTh WORKIng In InFORMal SECTOR lIVIng In SluMS
98
97
95
95
95
93
90
88
86
84
77
76
71
71
66
63
54
53
49
48
46
Car
Bukina Faso
Chad
tanzania
Mali
ethiopia
Mozambique
Madagascar
Uganda
rwanda
Nigeria
Malawi
Senegal
Benin
togo
Zambia
Guinea
Kenya
Cameroon
Ghana
Cote d’Ivoire
*Percentage of youth working in the Informal sector living in slum area
youth are “working poor”—they are unskilled and have insecure jobs that they do in unsat-isfactory conditions. Nearly 45% of all youth globally—almost 515 million young people—live on less than USD 2 a day (UNDESA, 2005). Figure 4 demonstrates that in many countries in Africa, a vast majority of youth work in the informal sector and live in slums (Gora, 2004). Indeed, 85% of the new em-ployment around the world is offered by the slums based informal economy (UN-Habitat, 2006); these are low-income jobs with little possibility for advancement. The largest num-ber of youth in this situation is in Africa.
Employment in the informal economy does not necessarily bring about a higher standard
of living. In the informal economy, youth do not have basic protections. There are no safety standards or health benefits; they can be sum-marily fired or forced to work long hours. Sub-Saharan Africa for example, has a youth labour force participation rate of 57.5%, the second highest in the world, and much higher than the Middle East and North Africa (MENA) region (ILO, 2010). Yet this high rate does not represent wealth; it represents a level of poverty that forces youth to work regardless of the quality of work, while at the same time eliminating educational opportunities. Infor-mal jobs can end up trapping youth in per-petual poverty, degrading them physically and emotionally.
9CITIES OF YOUTH: CITIES OF PROSPERITY
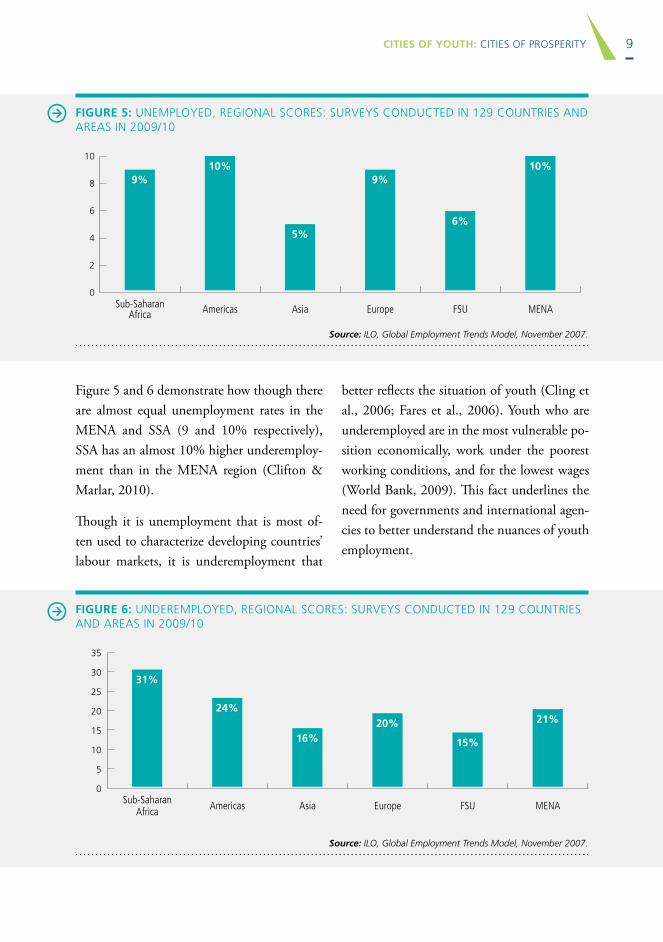
FIgUrE 5: unEMPlOYEd, REgIOnal SCORES: SuRVEYS COnduCTEd In 129 COunTRIES and aREaS In 2009/10
9%10%
5%
9%
6%
10%
Sub-Saharan Africa Americas Asia Europe FSu MENA
10
8
6
4
2
0
Source: ILO, Global Employment Trends Model, November 2007.
Figure 5 and 6 demonstrate how though there are almost equal unemployment rates in the MENA and SSA (9 and 10% respectively), SSA has an almost 10% higher underemploy-ment than in the MENA region (Clifton & Marlar, 2010).
Though it is unemployment that is most of-ten used to characterize developing countries’ labour markets, it is underemployment that
better reflects the situation of youth (Cling et al., 2006; Fares et al., 2006). Youth who are underemployed are in the most vulnerable po-sition economically, work under the poorest working conditions, and for the lowest wages (World Bank, 2009). This fact underlines the need for governments and international agen-cies to better understand the nuances of youth employment.
FIgUrE 6: undEREMPlOYEd, REgIOnal SCORES: SuRVEYS COnduCTEd In 129 COunTRIES and aREaS In 2009/10
Source: ILO, Global Employment Trends Model, November 2007.
31%
24%
16%20%
15%
21%
Sub-Saharan Africa Americas Asia Europe FSu MENA
35
30
25
20
15
10
5
0
10 CITIES OF YOUTH: CITIES OF PROSPERITY
global Responses and Mandates
The findings of the State of the Urban Youth Report 2010/2011 show that equal opportu-nities lead to equal outcomes. Governments at all levels urgently need to create equal op-portunities through policies, investment, and other interventions. Governments can impact youth prosperity through the implementation of effective employment policies and practices. Employment is crucial to bringing about pros-perity in the developing world.
The formal sector is unable to provide enough employment opportunities for young people, and this is one of the root causes of economic and social exclusion and a significant driver of informal economies (UN-Habitat, 2006). Paradoxically, the cit-ies that are a poverty trap for youth are also the places in which prosperity can flour-ish, where economies of scale allow for bur-geoning and sometimes exponential growth. The international community has begun to recognize the importance of employment as
a way to combat poverty and marginaliza-tion. The United Nations Millennium Decla-ration, adopted by the General Assembly in 2000, includes a commitment to “develop and implement strategies that give young people everywhere a real chance to find decent and productive work.” It was in recognition of the urgent need to address youth unemployment that Kofi Annan included the following text in paragraph 24 on the further development of the MDG targets in his last Secretary-Gener-al’s Report to the General Assembly in August 2006:
There are numerous international, national, and regional mandates for a response to youth concerns. Box 1 summarizes mandates related to youth employment.
World leaders agreed to several other important targets at the 2005 World Summit. I am therefore recommending the incorporation of these commitments into the set of targets used to follow up on the Millennium Declaration. This includes: a new target under Millennium Development Goal 1: to make the goals of full and productive employment and decent work for all, including for women and young people, a central objective of our relevant national and international policies and our national development strategies. (UNDP, 2005)
BOx 1: InTERnaTIOnal MandaTES and YOuTh EMPlOYMEnT
International Mandates:
• 1995 Social Summit
• Millennium declaration 2000
• Millennium development goal 8
• un general assembly Resolution a/RES/57/165
• Other un Resolutions on Youth (2004, 2005)
• International labor Organization (IlO) Conventions relating to Youth
• International labor Congress Recommendation 2005 (others)
• ECOSOC hlS 2006
national Mandates:
• Poverty Reduction Plans
• national development Plans
• national laws and Policies
11CITIES OF YOUTH: CITIES OF PROSPERITY
TaBlE 2: ShaRE OF VulnERablE EMPlOYMEnT, nORTh VS. Sub-SahaRan aFRICa (In %)
Source: ILO 2009a, January.
1997 2002 2009 2004 2005 2006 2007
Total
North Africa 42.9 40.3 39.8 41.1 40.9 38.6 37.1
Sub-Saharan Africa 80.9 79.3 79 77.3 77.7 78.3 77.4
Males
North Africa 39.3 38.4 36.9 36.7 37.2 34.5 33.1
Sub-Saharan Africa 76.2 74 73.4 70.7 71.7 73 72
Females
North Africa 55 46.2 48.8 54.2 52 50.3 48.5
Sub-Saharan Africa 86.9 86.2 86.4 85.8 85.3 85.1 84.4
Despite the mandates listed in Box 1, and de-spite the growing understanding within multi-lateral agencies and developing countries that there is a need to focus on youth employment, the actions that have been taken are in the formative stages. The needs of young people are not given sufficient priority in Poverty Reduction Strategy Plans (PRSPs) of nation states (SIDA, 2009). Initiatives proposed and implemented are often piecemeal, and limited in time and scope. Mentioning youth employ-ment in national policies or plans is not of much use without the implementation and monitoring of action plans that are linked to specific targets and budget outlays (ILO, 2006).
There has been an attempt to expand the knowledge of employment interventions for youth through the World Bank’s Labour Markets Team who produced a new study,
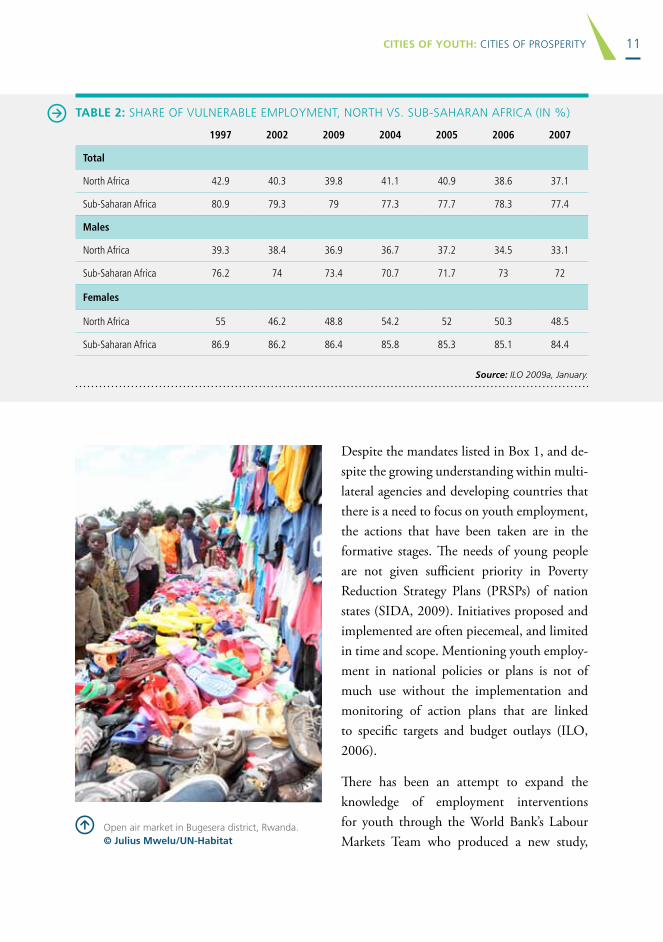
Open air market in bugesera district, Rwanda. © Julius Mwelu/Un-Habitat

12 CITIES OF YOUTH: CITIES OF PROSPERITY
the Global Inventory of Interventions to Sup-port Young Workers (World Bank, 2007). The researchers found that there were very few evidence-based evaluations done on the pro-grams reviewed. Though policy-makers con-sider measures to help young people make the transition into the labour market and obtain decent work, they are hampered by a lack of information on what their options are, what works in different situations, and what has been tried and failed.
Women, Poverty, and Employment
Urbanization and feminization of poverty going hand in hand. The impoverishment of women is revealed in their increased labour in the home, the social and cultural barriers to women’s employment, and the exploitation of women and girls (Aitken et al., 2006). More young women than young men are unem-ployed, with female unemployment upwards of 20% higher than male unemployment in some countries (World Youth Report, 2003). In 2009, female eclipsed male unemployment by 7.3% in Latin America and the Caribbe-an, 10.5% in the Middle East, and 11.4% in North Africa. Even though there has been an increase in the education of women, this has not translated into greater participation in the labour force (ILO, 2010).
As Table 2 demonstrates, SSA had, from 1997 to 2007, approximately double the rate of vul-nerable employed than North Africa. In the case of women, in both regions their rate was higher than men, and women in SSA were on average 43% higher than women in North Af-rica.
Women work more hours than males and are more likely to engage in non-market activities. In Ethiopia, women work 48-hour workweeks versus 32 for males. Of those hours they spend 36 in household activities in contrast to the 15 males work in these tasks (Ethiopia LFS, 2005). Women as well face more job insecuri-ty than men—especially jobs in industries that employ a large number of women are highly precarious with little job security, lower pay, few benefits, and weak social protection. In-ternational labour agencies such as the Inter-national Metalworkers Federation (IMF) and the Food, Agricultural, Hotel, and Restaurant Workers International (IUF) found that wom-en’s jobs in industries such as food processing and electronics tend to be more precarious in general, with less security, lower pay, fewer
Woman walking in city. ghana. © arne Hoel/World Bank
13CITIES OF YOUTH: CITIES OF PROSPERITY
benefits, and weaker social protection than the jobs of men in these industries. Many of these workers are young female migrant workers, often from rural areas, with little bargaining power (IUF, 2010).
Often times young educated women in the developing world leave their home countries in search of work, such as is the case for nurses in the Caribbean. For example, in Jamaica, 8% of generalist nurses and 20% of specialist nurses leave for the developed world each year. Between 2002 and 2006, more than 1,800 nurses left the Caribbean to work abroad for a number of reasons, including higher salaries, better working conditions, more opportuni-ties to advance their careers, and better train-ing. In regards to training, the faculty-student ratio in developing countries is reported to be as high as 1:45 compared with a 1:12 ratio in developed countries. In Kenya, there is only enough teaching staff to train 100 nurses and midwives per year, meaning it would take hun-dreds of years to teach the required number to provide quality health care (WHO, 2010).
What becomes clear from these statistics is that for cities to prosper women need to be able to have a level platform from which to access education and employment so as to build better livelihoods. Access to education, training and support will smooth their path to productive employment.
In Closing
This chapter reviewed the state of urban youth globally within the context of the role of youth in the creation of prosperous cities. It touched on key issues such as the demo-graphics of youth regionally and globally, the global policy response to youth employment by international agencies, the urban advantage and disadvantage, and the challenges faced by youth in their transition to employment. Spe-cial attention was given to the challenges of youth living in slums and employment chal-lenges faced by women. Chapter 2 will analyze six urban areas in regards to urban prosperity and youth. The report will conclude with a se-ries of policy and practice recommendations.
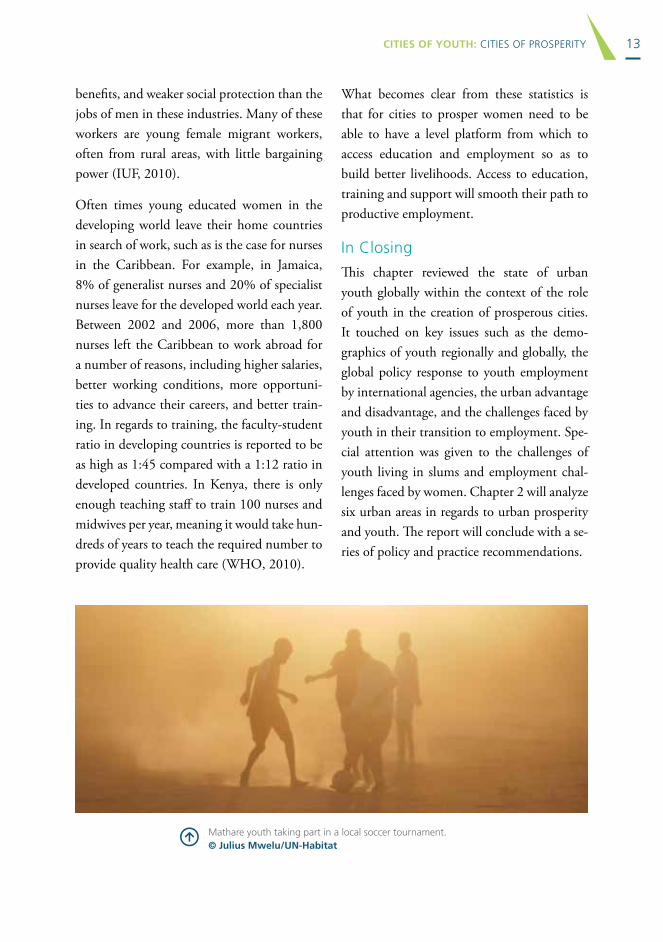
Mathare youth taking part in a local soccer tournament. © Julius Mwelu/Un-Habitat
14 CITIES OF YOUTH: CITIES OF PROSPERITY
This chapter analyzes the factors that help cre-ate prosperous cities. It analyzes youth’s relation to employment and wealth, referencing data from five urban areas as well as from the larger literature on the issue. Key to understanding employment and wealth is to understand the demographics of the developing world; more specifically, looking at the ability of youth to access decent and dignified employment, and the need for governments and institutions to facilitate this. The analysis of these countries is done using the Demographic and Health Sur-vey (DHS). As there are no employment data captured in the DHS, this chapter utilizes a wealth index as a proxy, which is compiled of assets owned by households, such as TVs, elec-tricity, appliances, cars, cycles, bikes, quality of housing, and access to sanitation facilities.
Summary Profile of Six urban Regions
This chapter analyzes pertinent literature on youth employment and data from the De-mographic and Health Surveys (DHS) from five urban regions: Bogota, Columbia; Cairo, Egypt; Accra, Ghana; Karnataka State, India; and Lusaka, Zambia. These urban regions have been chosen because they are regionally repre-sentative and experiencing—though in vary-ing degrees—a demographic “youth bulge.” Because there are limited countries that have disaggregated data for specific cities, urban re-gional data from Karnataka State, India and the Punjab, Pakistan is included. The primary goal of the analysis of these urban regions is to move from the broader global review of research to a more fine-grained picture of the
ChaPTER 2: CITIES OF YOUTH
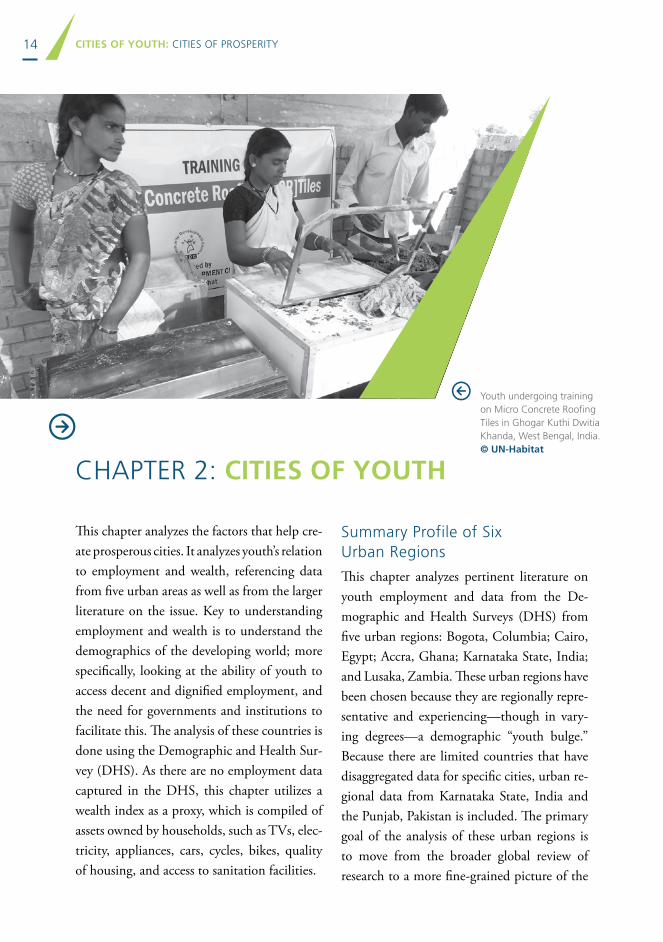
Youth undergoing training on Micro Concrete Roofing Tiles in ghogar Kuthi dwitia Khanda, West bengal, India. © Un-Habitat
15CITIES OF YOUTH: CITIES OF PROSPERITY
state of youth prosperity and the factors that impact it. The following section is a summary of the urban regions under review.
Summary of urban Regions
Bogota, CoLoMBIa
Columbia has an estimated population of 44,725,543, and an annual population growth rate of 1.2%. Three quarters of the total pop-ulation is urban and growing at an annual rate of 1.7%. Slum dwellers make up 16.1% (or 7,200,000) of the urbanites of Columbia (UN Statistics, 2010). Bogotá, with a population 8,262,000 million, is the capital of Columbia and its main economic and industrial center.
The country’s youth make up 28% of the total population (or 13,200,000). Twenty-one per-cent of youth (aged 15–24) were unemployed in 2007 (Population Reference Bureau, 2006). Sixteen percent of those were boys and 27% girls (UN Statistics, 2010). The youth unem-ployment rate is two and a half times that of adults.
Cairo, eGYpt
Egypt has an estimated population of 82,079,636 and an annual growth rate of 1.96%. Forty-three percent of the total popu-lation lives in urban centres, which are grow-ing at an annual rate of 2.1%. The proportion of urban residents living in slums is 17.1% (UN, 2010).
One third of Egypt’s population is between 10 and 24 years of age (Population Refer-ence Bureau, 2006). Ninety-five percent of all young people in Egypt complete primary school, and 69% of girls and 72% of boys at-tend secondary school. Youth unemployment rate in Egypt was 67% in 2006. This rate is over eight times (8.2) the unemployment rate among adults (UNICEF, 2010). Most unem-ployed are young women, whose employment rate has for the first time in a decade gone below 20%. Many of Egypt’s young educated females have either exited or never entered the labour market due to poor working condi-tions, low wages, and long hours.
greater Accra, GhaNa
The population of Ghana is estimated at 24 million with 16% of the population living in urban centres in 2005 (Population Reference Bureau, 2006). Almost 43% of Ghanaian ur-
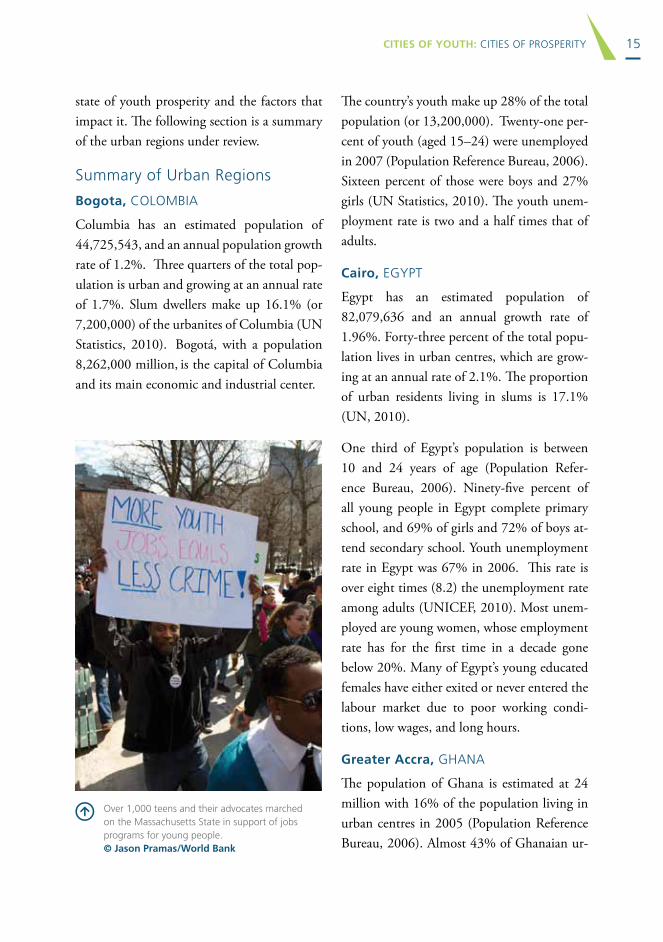
Over 1,000 teens and their advocates marched on the Massachusetts State in support of jobs programs for young people. © Jason Pramas/World Bank
16 CITIES OF YOUTH: CITIES OF PROSPERITY
banites live in slums (4,945,298) (UN Statis-tics, 2010). The population of the capital city, Accra, is estimated at 3,963,264 as of 2011.
Thirty-four percent (7,500,00) of the popula-tion is between 15 and 24 years of age (Popu-lation Reference Bureau, 2006), and 56% of the population of Accra is under the age of 24 years. Seventy-seven percent of Ghana’s chil-dren completed primary school in 2008, an improvement of over 60% since 2000 (UN Statistics, 2010). Forty-two percent of children attend secondary school, an equal amount of boys and girls (UNICEF, 2010). Youth unem-ployment stood at 16.6% in 2000, which is 1.9 times higher than adult unemployment (United Nations Statistics, 2010). In Accra the unemployment rate is 12.2%.
Karnataka state, INDIa
Karnataka State has an estimated population of 52,850,562. Forty percent of Karnataka state is urban, with 7.6% (or 4,049,000) of citizens living in slums, which are growing at 6.3% each year. Twenty-eight percent (or 20,500,000) of the Indian population is be-tween 10–24 years of age (Population Refer-ence Bureau, 2006).
Though 93% of Indian children complete pri-mary school and 54% of Indian children en-ter secondary school (UNICEF, 2010), there is still a wide gap between the education that Indian youth receive and the needs of the la-bour market; thus effecting negatively both the aspirations of Indian youth and society in general.
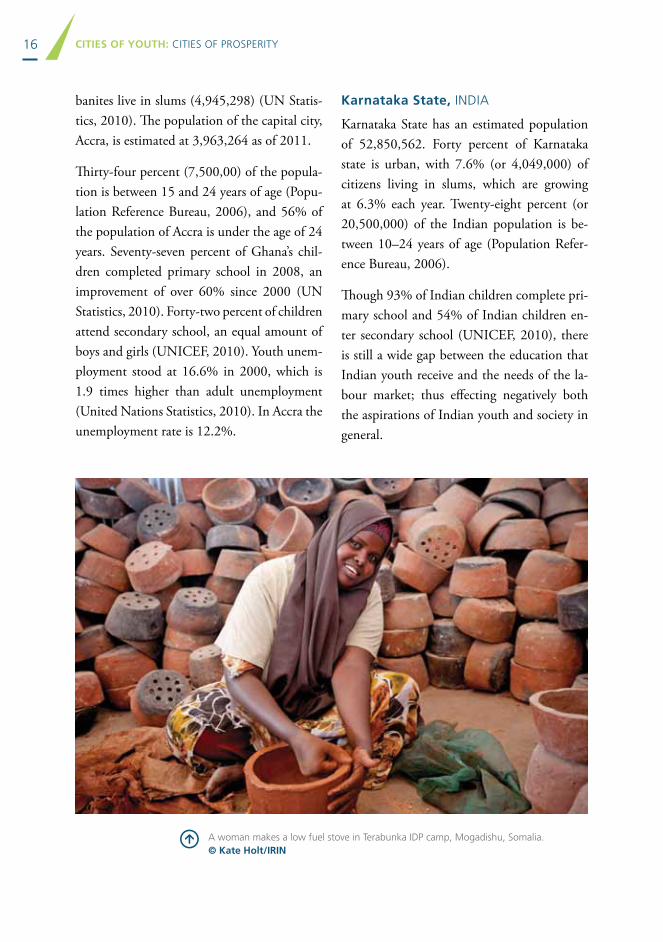
a woman makes a low fuel stove in Terabunka IdP camp, Mogadishu, Somalia. © Kate Holt/IrIn
17CITIES OF YOUTH: CITIES OF PROSPERITY
The Punjab, paKIStaN
Pakistan has an estimated population of 187,342,721. Thirty-six percent of the to-tal population is urban and this is growing at 3.1% a year (2010–15 est., UN, 2008). Forty-seven percent (or 89,000,000) of the urban population lives in slums. Young people (10–24) make up 34% of Pakistan’s popula-tion (54,200,000) (Population Reference Bu-reau, 2006).
The unemployment rate is 15%. Of youth, 7.5% are unemployed and the ratio youth un-employment to adult unemployment was 2.5 in 2007. Sixty percent of young people com-plete primary school of boys, while only 30% graduate from secondary school (World Bank, 2010). Lahore is the largest city in Punjab, the most populous province of Pakistan and the education capital of the country. The city has a growing computer assembly industry and is the country’s premier software producing center.
Lusaka, ZaMBIa
Lusaka is the capital and largest city of Zam-bia with a population of 1,413,000 or a tenth of Zambia’s population. The country’s youth number 4,200,000 or 36% of the population (Population Reference Bureau, 2006). Thirty-six percent of the total population is urban and growing at a rate of 3.2% per year, with slum dwellers making up 57.3% (or 7,950,000) of this urban population. The per capita GDP of Zambia is USD 1,500 (2010 est.) and Zam-bia has an unemployment rate of 50% (2009 est.). The ratio youth (15–24) unemployment rate to adult unemployment rate in Zambia was 2.5 in 2001 (UN, 2010b).
Each of these urban regions has a large youth demographic who face two key challenges: the lack of decent employment and access to edu-cation. The following section further expands upon the youth bulge phenomenon as it re-lates to prosperity and the related challenges of education and employment.
Youth as Engines of Prosperity
One of the most striking dimensions of ur-ban growth in the developing world is the de-mography, which has been called the “youth bulge,” defined as a high proportion of 15–29 year olds relative to the adult population. The youth bulge has often been described in nega-tive terms, especially in regards to the Middle East, North Africa (MENA), and the sub-Sa-haran African region, where it has been linked
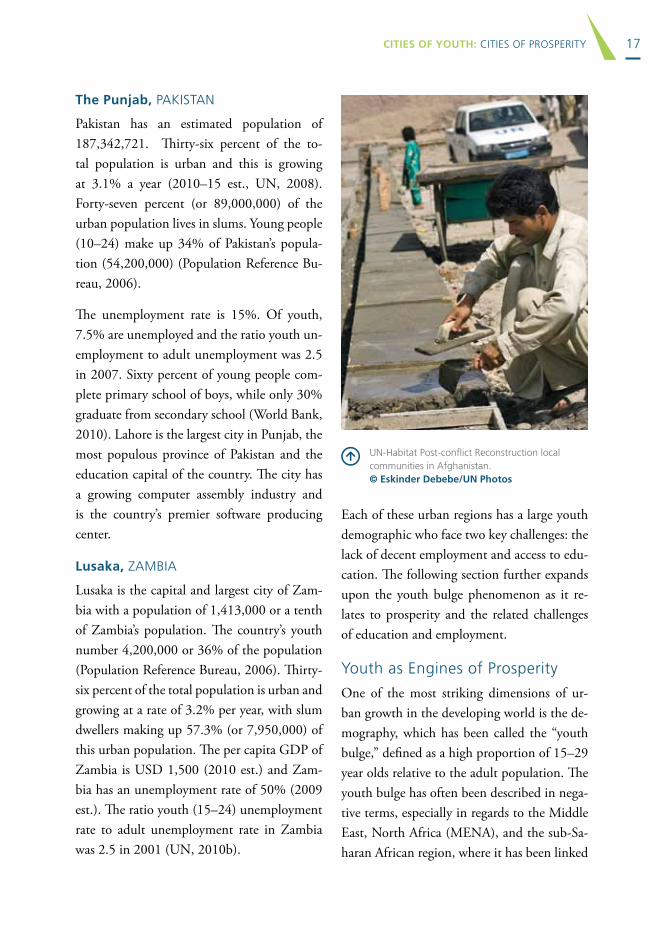
un-habitat Post-conflict Reconstruction local communities in afghanistan. © Eskinder debebe/Un Photos
18 CITIES OF YOUTH: CITIES OF PROSPERITY
Source: UNSD WPP 2008
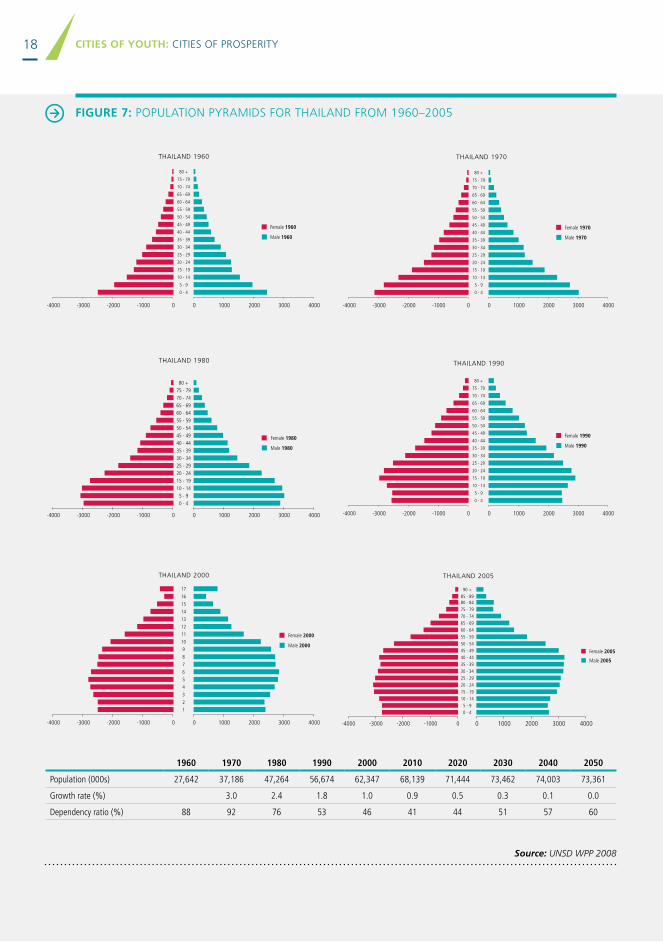
FIgUrE 7: POPulaTIOn PYRaMIdS FOR ThaIland FROM 1960–2005
0 1000 2000 3000 4000-4000 -3000 -2000 -1000 0
80 +
75 - 79
70 - 74
65 - 69
60 - 64
55 - 59
50 - 54
45 - 49
40 - 44
35 - 39
30 - 34
25 - 29
20 - 24
15 - 19
10 - 14
5 - 9
0 - 4
Male 1960
Female 1960
thaILaND 1960
0 1000 2000 3000 4000-4000 -3000 -2000 -1000 0
80 +
75 - 79
70 - 74
65 - 69
60 - 64
55 - 59
50 - 54
45 - 49
40 - 44
35 - 39
30 - 34
25 - 29
20 - 24
15 - 19
10 - 14
5 - 9
0 - 4
Male 1990
Female 1990
thaILaND 1990
0 1000 2000 3000 4000-4000 -3000 -2000 -1000 0
80 +
75 - 79
70 - 74
65 - 69
60 - 64
55 - 59
50 - 54
45 - 49
40 - 44
35 - 39
30 - 34
25 - 29
20 - 24
15 - 19
10 - 14
5 - 9
0 - 4
Male 1970
Female 1970
thaILaND 1970
0 1000 2000 3000 4000-4000 -3000 -2000 -1000 0
80 +75 - 7970 - 7465 - 6960 - 6455 - 5950 - 5445 - 4940 - 4435 - 3930 - 3425 - 2920 - 2415 - 1910 - 145 - 90 - 4
Male 1980
Female 1980
thaILaND 1980
0 1000 2000 3000 4000-4000 -3000 -2000 -1000 0
17
16
15
14
13
12
11
10
9
8
7
6
5
4
3
2
1
Male 2000
Female 2000
thaILaND 2000
0 1000 2000 3000 4000-4000 -3000 -2000 -1000 0
80 - 84
90 +
75 - 79
85 - 89
70 - 7465 - 6960 - 6455 - 5950 - 5445 - 4940 - 4435 - 3930 - 3425 - 2920 - 2415 - 1910 - 145 - 90 - 4
Male 2005
Female 2005
thaILaND 2005
1960 1970 1980 1990 2000 2010 2020 2030 2040 2050
Population (000s) 27,642 37,186 47,264 56,674 62,347 68,139 71,444 73,462 74,003 73,361
Growth rate (%) 3.0 2.4 1.8 1.0 0.9 0.5 0.3 0.1 0.0
Dependency ratio (%) 88 92 76 53 46 41 44 51 57 60
19CITIES OF YOUTH: CITIES OF PROSPERITY
to terrorism (NIC, 2008). Recent research has shown that a youth bulge may indeed be asso-ciated with increased risk of violence and con-flict and that one of the primary drivers for the violence is disenfranchised and unemployed youth (Urdal, 2006; Cincotta, 2008). Yet the youth bulge is also a window of opportunity, where the youthful labour force coincides with fewer dependants, thus providing an opportu-nity to maximize the rate of investment, eco-nomic growth, and employment.
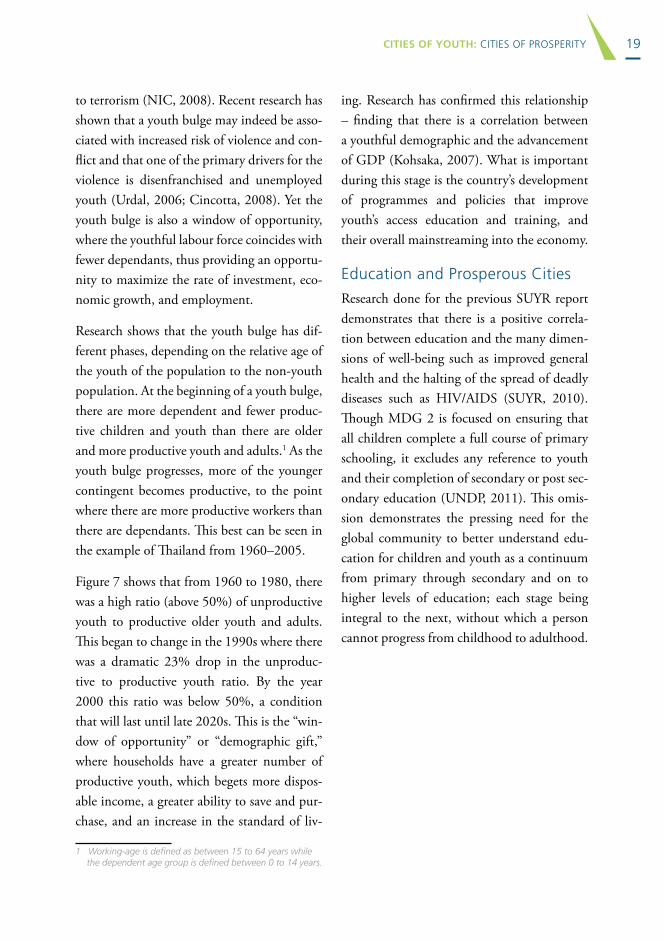
Research shows that the youth bulge has dif-ferent phases, depending on the relative age of the youth of the population to the non-youth population. At the beginning of a youth bulge, there are more dependent and fewer produc-tive children and youth than there are older and more productive youth and adults.1 As the youth bulge progresses, more of the younger contingent becomes productive, to the point where there are more productive workers than there are dependants. This best can be seen in the example of Thailand from 1960–2005.
Figure 7 shows that from 1960 to 1980, there was a high ratio (above 50%) of unproductive youth to productive older youth and adults. This began to change in the 1990s where there was a dramatic 23% drop in the unproduc-tive to productive youth ratio. By the year 2000 this ratio was below 50%, a condition that will last until late 2020s. This is the “win-dow of opportunity” or “demographic gift,” where households have a greater number of productive youth, which begets more dispos-able income, a greater ability to save and pur-chase, and an increase in the standard of liv-
1 Working-age is defined as between 15 to 64 years while the dependent age group is defined between 0 to 14 years.
ing. Research has confirmed this relationship – finding that there is a correlation between a youthful demographic and the advancement of GDP (Kohsaka, 2007). What is important during this stage is the country’s development of programmes and policies that improve youth’s access education and training, and their overall mainstreaming into the economy.
Education and Prosperous Cities
Research done for the previous SUYR report demonstrates that there is a positive correla-tion between education and the many dimen-sions of well-being such as improved general health and the halting of the spread of deadly diseases such as HIV/AIDS (SUYR, 2010). Though MDG 2 is focused on ensuring that all children complete a full course of primary schooling, it excludes any reference to youth and their completion of secondary or post sec-ondary education (UNDP, 2011). This omis-sion demonstrates the pressing need for the global community to better understand edu-cation for children and youth as a continuum from primary through secondary and on to higher levels of education; each stage being integral to the next, without which a person cannot progress from childhood to adulthood.
20 CITIES OF YOUTH: CITIES OF PROSPERITY
Education, Employment and low dependency ratio Countries: Columbia, India, and Egypt
Countries with a lower dependency ratio such as Columbia (dependency ratio of 58), In-dia (61), and Egypt (65), have had to focus on policies that assure the upgrading of skills training, advanced and tertiary education, and provision of skilled employment. Egypt, for example has the largest group of youth ever to enter the job market both absolutely and in relative terms. Yet Egypt, as well as other Arab countries, suffers from a brain drain, where the loss of talented young people who could contribute to nation building is seri-ous, as is the high investment in education by the government, which ends up benefiting other countries (Lancaster, Smith, & Thomas, 2008).
Unfortunately for Egyptian youth, though there has been an expansion in education; schools have been geared towards preparing students for bureaucratic work or for jobs in state-owned enterprises rather than jobs in the market economy. The result has been that the increase in the quantity of education has been rendered almost meaningless, as the quality of education has decreased. Egyptian young peo-ple, especially women, face serious difficulties and challenges in finding a career job after leaving school, with only 17 % of youth re-spondents of a recent survey having completed the transition from school to work; 25% were still was in transition—that is, either unem-ployed or not yet in a career job—and the rest had not begun their transition (Assaad, Ragui, & Barsoum, Ghada, 2007).
India is also a low dependency ratio country. One of the primary challenges faced by Indian youth in rural areas is infrastructure—specifi-cally the lack of secondary and higher educa-tion. Many Indian youth and their families migrate to urban areas for better education of their children. Globalization has brought many opportunities to India, yet the system-atic disinvestment in higher education in re-cent years has yielded neither world-class re-search nor highly trained scholars, scientists, and managers for the growing high tech sector (Selvam, 2010). Forty-six per cent of youth between the ages of 15–24 in India are un-employed. That is three times the unemploy-ment rate among Indian adults. This is not a problem of job unavailability, but the result of a shortage of skilled labour force.
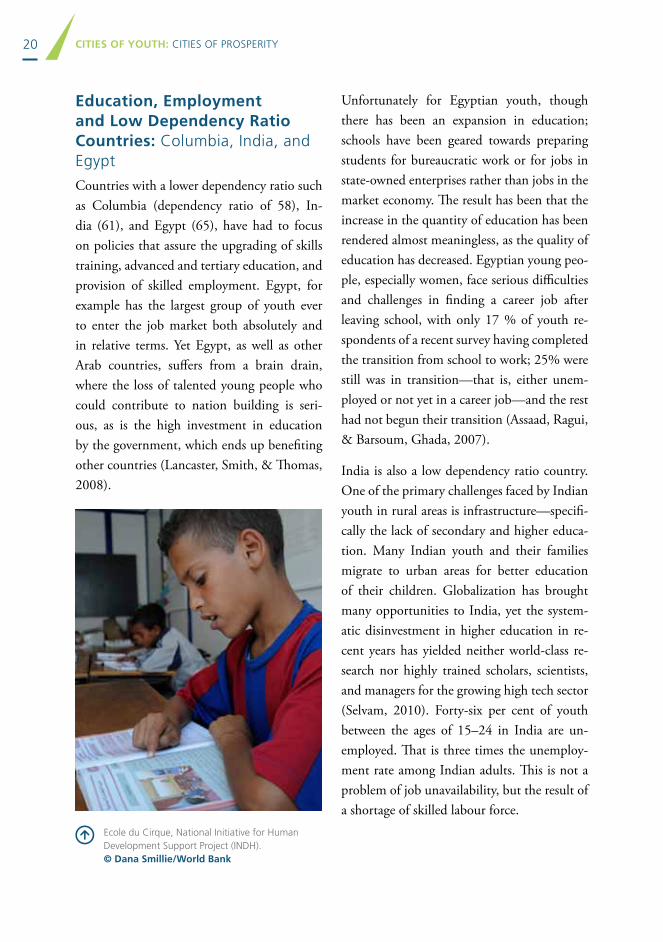
Ecole du Cirque, national Initiative for human development Support Project (Indh). © dana Smillie/World Bank
21CITIES OF YOUTH: CITIES OF PROSPERITY
For example, the Indian auto industry is on the rise, but auto companies have had to cut back on expansion due to a lack of adequate skilled staff. There is a shortage of skilled workers for nearly 20% of the infrastructure and construction sector. In response, some firms are taking the initiative to begin their own training centers for construction workers (UNDESA, 2010).
The inability of governments to provide edu-cation attuned to the needs of the job market combined with meaningful employment op-portunities can be one of the main causes of discontent of young people globally. Though this is the principal problem for both high and low dependency ratio countries, high depend-ency countries face greater challenges due to the larger percentage of the population that need to be provided education and job train-ing.
A demographic youth bulge presents itself dif-ferently for those countries with high depend-ency ratios in urban regions analyzed in this
report such as Ghana (76), Pakistan (82), and Zambia (99). These countries face substantial challenges in that they have a disproportionate level of dependent young people who are in need of employment, health care, and educa-tion (Lam, 2007). One way in which coun-tries have supported a dependent young popu-lation is to aim for full primary education so young people have the basic building blocks to be able to move towards higher levels of education. This has been done fairly success-fully world-wide where primary school enrol-ment rates in low-income countries rose from 50% in 1970 to 88% in 2000 with an average of over 80% of children completing primary school (UNICEF, 2003).
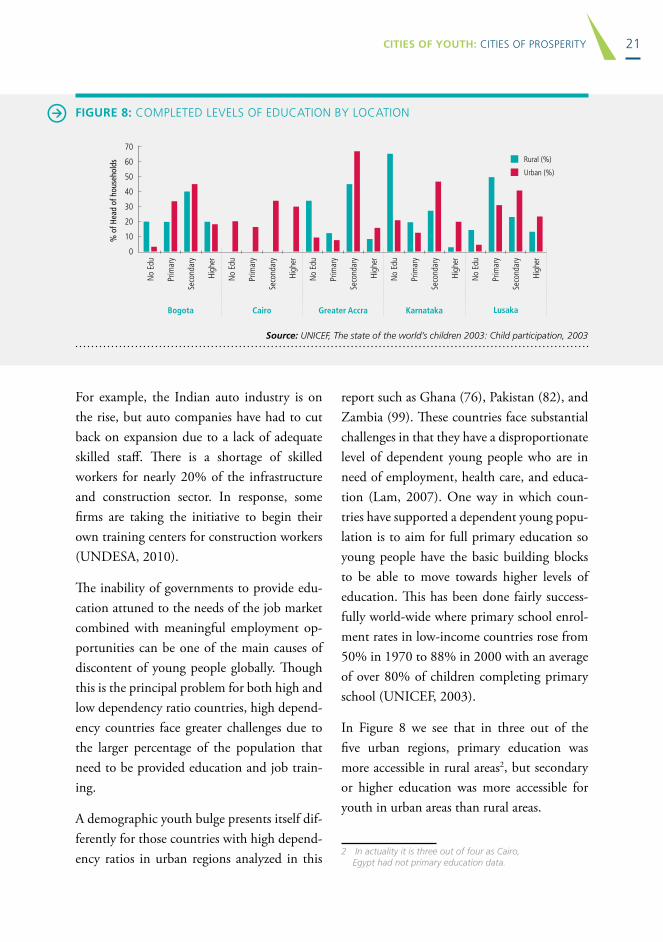
In Figure 8 we see that in three out of the five urban regions, primary education was more accessible in rural areas2, but secondary or higher education was more accessible for youth in urban areas than rural areas.
2 In actuality it is three out of four as Cairo, Egypt had not primary education data.
FIgUrE 8: COMPlETEd lEVElS OF EduCaTIOn bY lOCaTIOn
No
Edu
Prim
ary
Seco
ndar
y
High
er
No
Edu
Prim
ary
Seco
ndar
y
High
er
No
Edu
Prim
ary
Seco
ndar
y
High
er
No
Edu
Prim
ary
Seco
ndar
y
High
er
No
Edu
Prim
ary
Seco
ndar
y
High
er
Bogota Cairo Greater Accra Karnataka Lusaka
rural (%)
urban (%)
% o
f Hea
d of
hou
seho
lds
70
60
50
40
30
20
10
0
Source: UNICEF, The state of the world’s children 2003: Child participation, 2003
22 CITIES OF YOUTH: CITIES OF PROSPERITY
The only urban area in which this was not the case was Bogota, where primary education was more available in rural areas. Bogota is repre-sentative of Latin America as a whole, which is in a low dependence ratio phase, having an older demographic and thus less need and lower presence of primary education.
Yet, though education is accessible, there are still regions such as in SSA where youth do not attend school, or when they do, they receive poor quality education. In Ghana and Zam-bia, fewer than 60% of all 15 to 19 year olds who have completed six years of education can read a simple sentence in their own language (World Bank, 2006). As well, the success of primary education has seemingly come at the cost of, or at least with the lack of foresight in, investment in secondary and tertiary edu-cation.
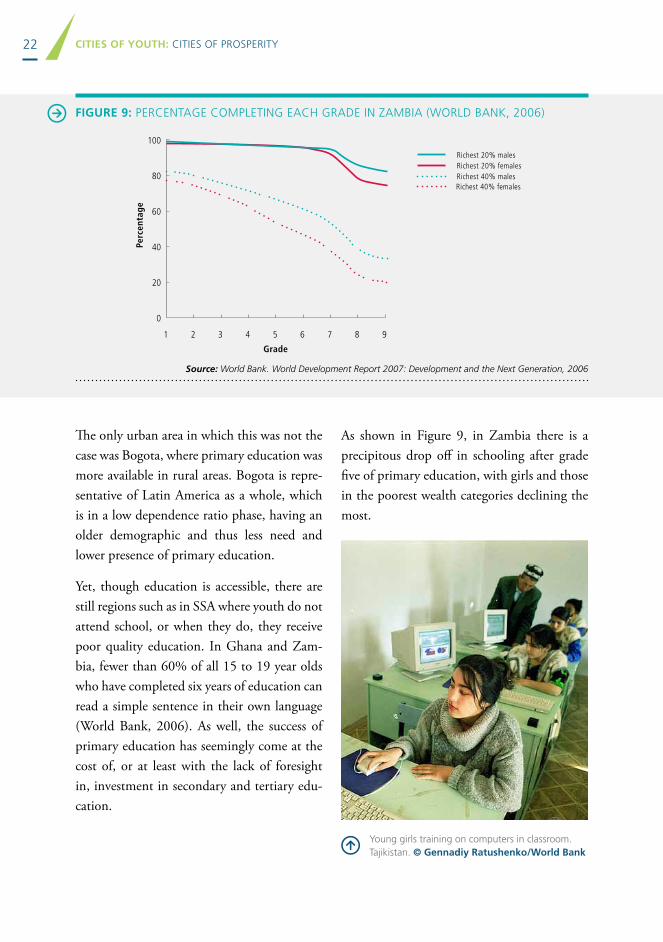
As shown in Figure 9, in Zambia there is a precipitous drop off in schooling after grade five of primary education, with girls and those in the poorest wealth categories declining the most.
FIgUrE 9: PERCEnTagE COMPlETIng EaCh gRadE In ZaMbIa (WORld banK, 2006)
Source: World Bank. World Development Report 2007: Development and the Next Generation, 2006
100
80
60
40
20
0
1 2 3 4 5
Grade
6 7 8 9
richest 20% malesrichest 20% femalesrichest 40% malesrichest 40% females
Perc
enta
ge
Young girls training on computers in classroom. Tajikistan. © gennadiy ratushenko/World Bank

23CITIES OF YOUTH: CITIES OF PROSPERITY
Zambia is typical of many countries in SSA in that it is in the early stages of the youth bulge. Though there is large number of young people who complete primary school, coun-tries from this region have yet to capitalize on the potential through continued education. Though this region has begun establishing the fundamentals for growth by providing access to primary education, the region is unable to increase its economic growth through educat-ing and training youth for the job market.
One way in which countries such as Zambia have provided support for children and young people who may have not had quality primary education, or are currently challenged with finding quality post primary education, is to provide “second chance” opportunities such as undertaken in Ghana’s functional literacy program or through building skills in public
works programs, ideally programs that focus on basic literacy. UN-Habitat has undertaken programs such as the Moonbeam Youth train-ing centre, the One Stop Resource Centres, and the We are the Future centres in post-con-flict countries in Africa (UN-Habitat, 2011).
Education is key to a peaceful and sustainable society. Yet, educational accessibility is affect-ed by infrastructure in the case of rural areas and of slums, and by cultural and societal bar-riers in the case of young women. And even if education opportunities were provided, if they are of poor quality or not adapted to the needs of the job market, they will block youth from finding dignified and profitable employment, add to youth’s disillusionment and hopeless-ness, which in turn may lead to violence.
Students work on an engine at Sisli Vocational high School in Istanbul, Turkey. © Simone d. McCourtie/World Bank
24 CITIES OF YOUTH: CITIES OF PROSPERITY
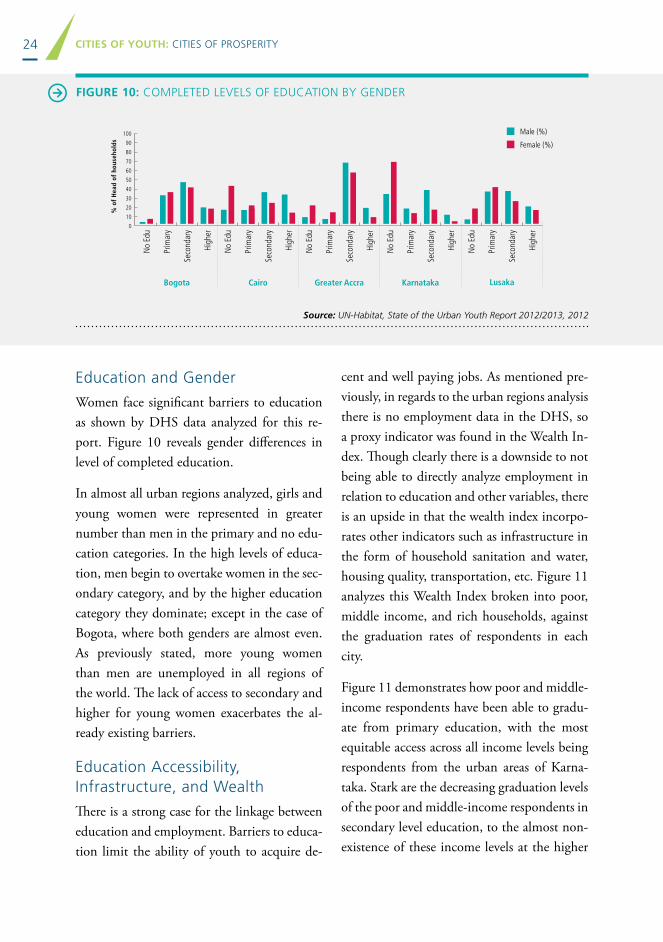
Education and gender
Women face significant barriers to education as shown by DHS data analyzed for this re-port. Figure 10 reveals gender differences in level of completed education.
In almost all urban regions analyzed, girls and young women were represented in greater number than men in the primary and no edu-cation categories. In the high levels of educa-tion, men begin to overtake women in the sec-ondary category, and by the higher education category they dominate; except in the case of Bogota, where both genders are almost even. As previously stated, more young women than men are unemployed in all regions of the world. The lack of access to secondary and higher for young women exacerbates the al-ready existing barriers.
Education accessibility, Infrastructure, and Wealth
There is a strong case for the linkage between education and employment. Barriers to educa-tion limit the ability of youth to acquire de-
cent and well paying jobs. As mentioned pre-viously, in regards to the urban regions analysis there is no employment data in the DHS, so a proxy indicator was found in the Wealth In-dex. Though clearly there is a downside to not being able to directly analyze employment in relation to education and other variables, there is an upside in that the wealth index incorpo-rates other indicators such as infrastructure in the form of household sanitation and water, housing quality, transportation, etc. Figure 11 analyzes this Wealth Index broken into poor, middle income, and rich households, against the graduation rates of respondents in each city.
Figure 11 demonstrates how poor and middle-income respondents have been able to gradu-ate from primary education, with the most equitable access across all income levels being respondents from the urban areas of Karna-taka. Stark are the decreasing graduation levels of the poor and middle-income respondents in secondary level education, to the almost non-existence of these income levels at the higher
FIgUrE 10: COMPlETEd lEVElS OF EduCaTIOn bY gEndER
Source: UN-Habitat, State of the Urban Youth Report 2012/2013, 2012
No
Edu
Prim
ary
Seco
ndar
y
High
er
No
Edu
Prim
ary
Seco
ndar
y
High
er
No
Edu
Prim
ary
Seco
ndar
y
High
er
No
Edu
Prim
ary
Seco
ndar
y
High
er
No
Edu
Prim
ary
Seco
ndar
y
High
er
Bogota Cairo Greater Accra Karnataka Lusaka
Male (%)
Female (%)
% o
f H
ead
of h
ouse
hold
s
100
90
80
70
60
50
40
30
20
10
0

25CITIES OF YOUTH: CITIES OF PROSPERITY
education level. Again, the different stages of the youth bulge play a role here, where urban regions with older demographics and lower dependency ratio (Bogota and Karnataka) have a more evenly distributed representation in secondary education than African urban re-gions, which have a younger demographic and higher dependency ratio. Across the board it can be inferred that the lack of representation of poor and middle-income respondents in secondary and higher education places youth in a deficit position when accessing education and training needed to achieve employment.
One aspect of infrastructure that seems to have great impact on youth’s access to employ-ment and advancement in their livelihoods is in the area of technology, and more specifically mobile technologies.
urbanization, Increased Wealth, and Mobile Technologies
Mobile technology has become increasingly important for both telephone services and a means to access the Internet. Limited access
to the internet because of lack of access to fixed broadband technology is often compen-sated for by the growth of mobile technolo-gies, especially in regards to youth (Halewood, 2007). With the arrival of fibre optic cables in many places in the developing world and the subsequent increase in the speed of the Inter-net and decrease in cost, the ability for young people to access the Internet has increased (Ragan, 2010; CP-Africa, 2011).
FIgUrE 11: EduCaTIOn and ThE WEalTh IndEx
Source: UN-Habitat, State of the Urban Youth Report 2012/2013, 2012
No
Edu
Prim
ary
Seco
ndar
y
High
er
No
Edu
Prim
ary
Seco
ndar
y
High
er
No
Edu
Prim
ary
Seco
ndar
y
High
er
No
Edu
Prim
ary
Seco
ndar
y
High
er
No
Edu
Prim
ary
Seco
ndar
y
High
er
Bogota Cairo Greater Accra Karnataka Lusaka
Poor
Middle Income
rich
% o
f H
ead
of h
ouse
hold
s
80
70
60
50
40
30
20
10
0
Motorcycles are one of the main forms of transportation. © Tran Thi Hoa/World Bank
26 CITIES OF YOUTH: CITIES OF PROSPERITY
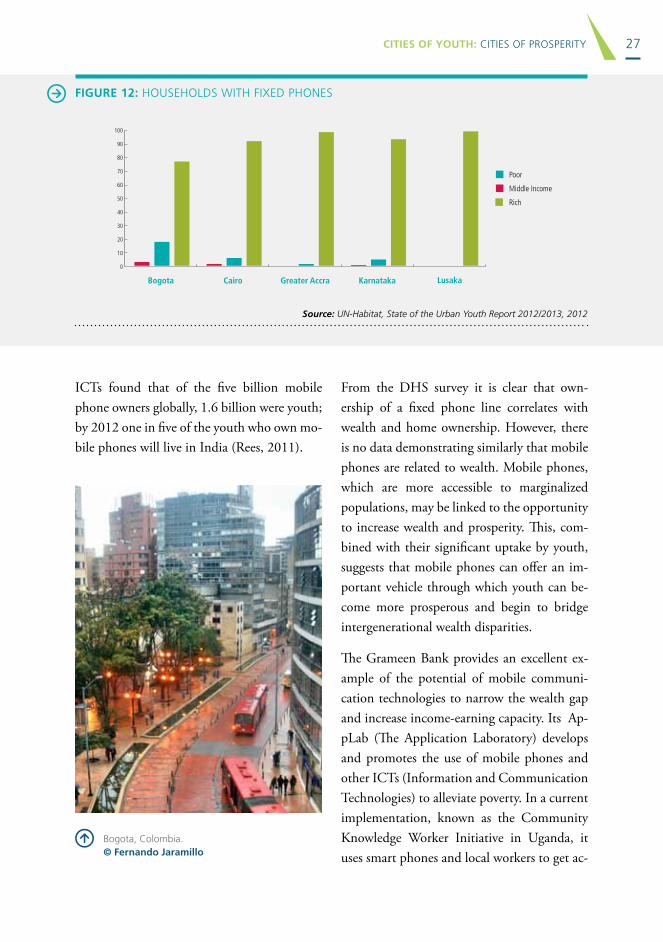
Though there is no specific data on mobile ownership in the DHS dataset, the wealth in-dex captured a fixed line ownership indicator as can be seen in Figure 12. This data shows a strong correlation between household phone ownership and wealth. In the city of Accra, Ghana, for example, 97.4% of the fixed line phones are owned by very wealthy house-holds. This suggests not only a strong link with wealth, but also with inequity, with fixed lined phones owned almost exclusively by the elite.
Communication technologies such as mo-bile phones enable increased social inclusion through employment generation and access social services for marginalized persons such as women (Gillwald, 2010). A high level of competition and a decrease in cost have sub-stantially reduced the digital divide in mobile
telephones. Mobile phones are more present than any other form of communication tech-nologies. The most recent data shows that 45% of inhabitants in the developing world have a mobile phone, with one out of four Af-ricans and one out of three Asians owning a mobile phone (ITU, 2010). Africa, which has the highest mobile growth rate, with annual growth over the past five years averaging ap-proximately 50% and with a total of 198 mil-lion mobile subscribers (ITU, 2010), could possibly become the first “post-PC” contin-ent, relying solely on mobile and not desktop technologies (Wanjiku, 2011). There is little data on young people’s use of mobile technol-ogy, but a survey on youth access to ICTs done for the 2007 World Bank World Development report found that in India well over 50% of youth surveyed had access to mobile phones (Halewood, 2007). Research on youth and
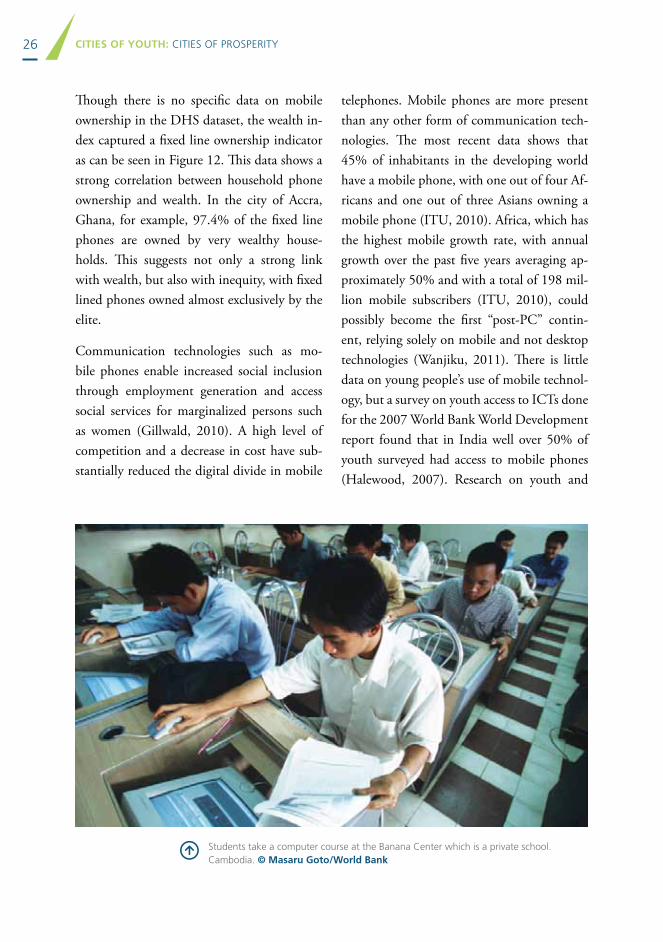
Students take a computer course at the banana Center which is a private school. Cambodia. © Masaru goto/World Bank
27CITIES OF YOUTH: CITIES OF PROSPERITY
FIgUrE 12: hOuSEhOldS WITh FIxEd PhOnES
Source: UN-Habitat, State of the Urban Youth Report 2012/2013, 2012
Bogota Cairo Greater Accra Karnataka Lusaka
Poor
Middle Income
rich
100
90
80
70
60
50
40
30
20
10
0
ICTs found that of the five billion mobile phone owners globally, 1.6 billion were youth; by 2012 one in five of the youth who own mo-bile phones will live in India (Rees, 2011).
From the DHS survey it is clear that own-ership of a fixed phone line correlates with wealth and home ownership. However, there is no data demonstrating similarly that mobile phones are related to wealth. Mobile phones, which are more accessible to marginalized populations, may be linked to the opportunity to increase wealth and prosperity. This, com-bined with their significant uptake by youth, suggests that mobile phones can offer an im-portant vehicle through which youth can be-come more prosperous and begin to bridge intergenerational wealth disparities.
The Grameen Bank provides an excellent ex-ample of the potential of mobile communi-cation technologies to narrow the wealth gap and increase income-earning capacity. Its Ap-pLab (The Application Laboratory) develops and promotes the use of mobile phones and other ICTs (Information and Communication Technologies) to alleviate poverty. In a current implementation, known as the Community Knowledge Worker Initiative in Uganda, it uses smart phones and local workers to get ac-
bogota, Colombia. © Fernando Jaramillo
28 CITIES OF YOUTH: CITIES OF PROSPERITY
tionable, relevant, local information to where workers need it, and provides the ability to col-lect data in real-time. A growing group of 689 Community Knowledge Workers (CKWs) presently serves 43,980 Ugandan farmers. As the program proves its value, it may expand to serve 200,000 farmers in Uganda. While this initiative is being deployed in a rural environ-ment, it is clearly in order to explore its ap-plication in urban markets as well. Further, stronger income generation in rural areas will likely diminish urban migration by younger age groups and may spur the return of those with precarious urban livelihoods.3
3 For more information, see http://www.grameenfoundation.applab.org/section/index and http://www.grameenfoundation.org/what-we-do/empowering-poor
In Closing
This chapter analyzed factors that help cre-ate a prosperous city, mainly youth’s access to education and infrastructure, which paves the way to decent employment. These factors are, pivotal in the capacity of governments and in-stitutions to enact and implement supportive programs and policies. The final chapter will summarize and present the key points of this report related to the creation of prosperous cities through youth employment.
29CITIES OF YOUTH: CITIES OF PROSPERITY
ChaPTER 3: POlICY and PraCTICE
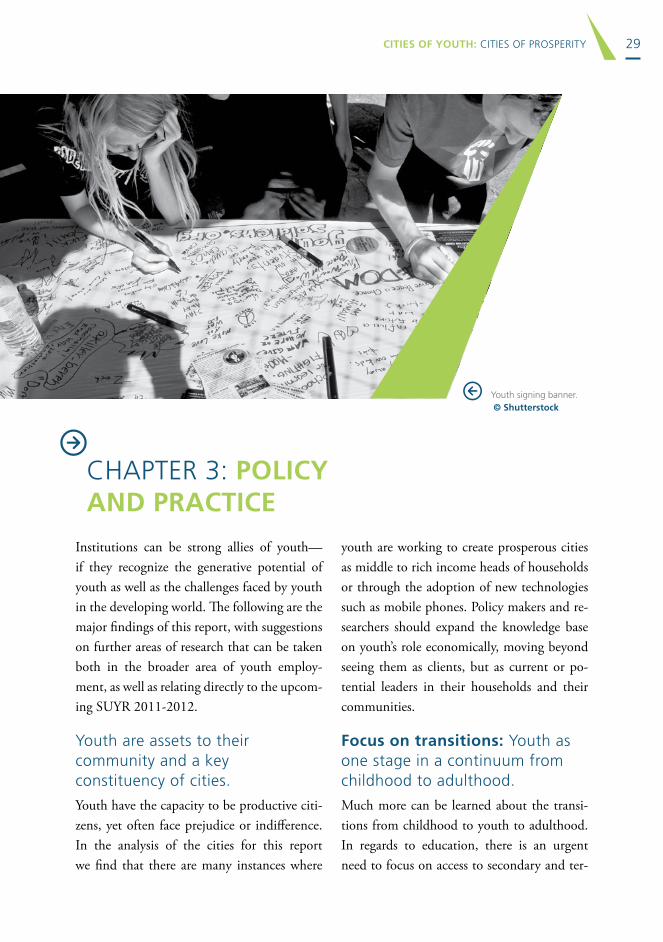
Youth signing banner. © Shutterstock
Institutions can be strong allies of youth—if they recognize the generative potential of youth as well as the challenges faced by youth in the developing world. The following are the major findings of this report, with suggestions on further areas of research that can be taken both in the broader area of youth employ-ment, as well as relating directly to the upcom-ing SUYR 2011-2012.
Youth are assets to their community and a key constituency of cities.
Youth have the capacity to be productive citi-zens, yet often face prejudice or indifference. In the analysis of the cities for this report we find that there are many instances where
youth are working to create prosperous cities as middle to rich income heads of households or through the adoption of new technologies such as mobile phones. Policy makers and re-searchers should expand the knowledge base on youth’s role economically, moving beyond seeing them as clients, but as current or po-tential leaders in their households and their communities.
Focus on transitions: Youth as one stage in a continuum from childhood to adulthood.
Much more can be learned about the transi-tions from childhood to youth to adulthood. In regards to education, there is an urgent need to focus on access to secondary and ter-

30 CITIES OF YOUTH: CITIES OF PROSPERITY
tiary education. Currently there is a strong fo-cus on primary education, yet the attainment of this goal in isolation runs the risk of creat-ing more disillusionment and anger if primary graduates can’t continue their education. All stages of transition for youth bust be support-ed—not just the earliest.
The youthful developing world: Tailoring the global response to employment.
The developing world is going through a youth bulge, with each region at different stages. Regions such as Latin America and the Caribbean and Asia have a low dependency ra-tio versus Africa, which has high dependency ratios. For effective support from governments and institutions, aid must be tailored to the different demographic stage each region is in. For example, in addition to formal schooling, non-formal training by government and other institutions must be expanded as long as the practices can be deemed efficient and effective through the undertaking of rigorous evalua-tion and monitoring.
Women are key to prosperous cities.
To achieve socially and economically vibrant cities, women must be included. Young wom-en face the same barriers as men, with the ad-dition of societal and cultural norms that im-pede their transition to decent work. Special focus must be given to assure that women can work equal hours for equal pay, that they work in safe environments that are free from harass-ment and discrimination, and that family ob-ligations are respected and taken into account. Support for women’s use of ICTs and mobile technologies would also be a positive step.
The improvement of and increased accessibility to urban infrastructure
The research done for this report suggests that those with greater wealth and access to infra-structure have better access to higher levels of education. To assure that there is equitable ac-cess to employment there must be equitable access to infrastructure. This can range from the provision of more and higher quality schools in slums, to the provision of roads and other basic infrastructure. Communication infrastructure, and more specifically mobile technologies, are as well key to enabling youth to smoothly transition to employment.
Youth and mobile phone technology. © Shutterstock
31CITIES OF YOUTH: CITIES OF PROSPERITY
Initiate and expand evaluation of best practices in skill training programs.
A range of skills training programs is under-way globally, yet there is little empirical data to support their effectiveness. The Youth Em-ployment Inventory is one example of a global program looking to document and learn from ongoing programs. Further evaluations need to be done and lessons learned need to be shared in a systematic way.
Collect labour force statistics disaggregated by age and along other dimensions (gender, disability status, etc.).
There is a disturbing dearth of data on young people aged 15–24. There is an urgent need to work with governments and other institu-tions to collect and analyze employment data disaggregated by gender and age so as to bet-ter understand the underlying trends, identify where progress is being made, and assess the effectiveness of interventions (ECA, 2009).
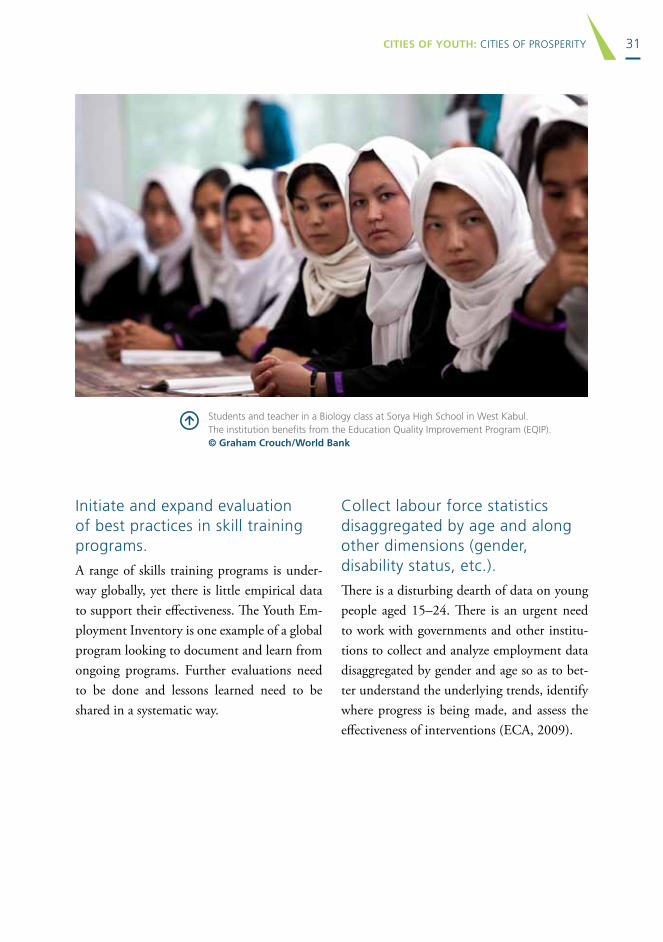
Students and teacher in a biology class at Sorya high School in West Kabul. The institution benefits from the Education Quality Improvement Program (EQIP). © graham Crouch/World Bank
32 CITIES OF YOUTH: CITIES OF PROSPERITY
Agren, D, & Downie, A. (October, 2010). Help wanted: training provided: Across Latin America. Latin Trade, Retrieved 16 April 2011 from http://latintrade.com/2010/10/help-wanted-training-provided
Aho, M., & Andre, R. (2011). Expanding youth access to formal labor markets through public-private collaboration. Paper presented at a private roundtable discussion during proceedings at the Council of the Americas, Bogota, Columbia.
Aitken, S., Estrada, S. L., Jennings, J. and Aguirre, L.M. (2006) “Reproducing life and labor: global processes and working children in Tijuana, Mexico”, Childhood 13(3), pp. 365-87.
Arif, G.M., & Chaudhry, N. (2008). Demographic transition and youth employment in Pakistan. Pakistan Development Review, 47(1), 27-70. Retrieved from EconPapers. Retrieved 16 April 2010 from http://www.pide.org.pk/pdf/PDR/2008/Volume1/27-70.pdf
Assaad, R., & Barsoum, G. (2007). Youth exclusion in Egypt: in search of “Second chances” No. 2. Washington, D.C.: Wolfensohn Center for Development, Dubai School Of Government.
Basu, A. & Stewart, F. (1993) Structural adjustment policies and the poor in Africa: An analysis of the 1980s. Discussion paper in development economics, Series (no. 10), University of Reading, Department of Economics.
Bennell, P. (2000). Improving youth livelihoods in SSA: A review of policies and programmes with particular emphasis on the link between sexual behaviour and Economic Well-being. Report to the International Development Center (IDRC). Ottawa, Ontario: Communications Division of the International Development Research Centre (IDRC).
CP-Africa (2011). Africa’s fixed broadband prices fall by over 55%. Retrieved July 4 2011 from http://www.cp-africa.com/2011/07/04/africas-fixed-broadband-prices-fall-by-over55/?utm_source=feedburner&utm_medium=email&utm_campaign=Feed%3A+CelebratingProgressAfrica+%28CP-Africa%29
Caparros, M., Laski, L., & Schellekens, S. (2008). Generation of change: Young people and culture: UNFPA state of world population 2008:Youth supplement. New York: UNFPA.
rEFErEnCES
33CITIES OF YOUTH: CITIES OF PROSPERITY
Chaaban, J. (2008). The costs of youth exclusion in the Middle East (no. 7). Washington, D.C.: Wolfensohn Center for Development, Dubai School Of Government.
Chelala, C. (2008). The Next Generation Of Entrepreneurs. Americas, 60 (4), 58-60.
Cincotta, R. (2005). State of the world 2005 global security brief #2: Youth bulge, underemployment raise risks of civil conflict. Retrieved April 10, 2011, from http://www.worldwatch.org/node/76
Cincotta, R. P. (2008). Half a chance: Youth bulges and transitions to liberal democracy. Environmental Change and Security Program [ECSP] Report, Issue 13, 2008-2009. Washington, D.C.: Woodrow Wilson International Center for Scholars.
Clifton, J., & Marlar, J. (2011). Good jobs: The new global standard. Washington, D.C.: Gallup, Inc. Retrieved April 12, 2011 from www.gallup.com/.../Good%20Jobs_The%20New%20Global%20Standard.pdf
Cunningham, W. (November, 2010). Active labor market programs: A framework to guide youth employment interventions. Employment Policy Primer Note (No. 16). Washington, D.C.: World Bank. Retrieved April 12, 2011 from http://web.worldbank.org/WBSITE/EXTERNAL/TOPICS/EXTSOCIALPROTECTION/EXTLM/0,,contentMDK:22795057~menuPK:588059~pagePK:210058~piPK:210062~theSitePK:390615~isCURL:Y~isCURL:Y,00.html
Curtain, R. (2000). Towards a youth employment strategy. Report to the United Nations on Youth Employment. New York.
Curtain, R. (21-25 June 2004). Indicators and measures of youth unemployment: Major limitations and alternatives. Paper for Expert Group Meeting on Strategies for Creating Urban Youth Employment: Solutions for Urban Youth in Africa organized by the Division for Social Policy and Development, Department of Economic and Social Affairs, United Nations in collaboration with UN-Habitat and the Youth Employment Network. Nairobi, Kenya
ECLAC. (2002). High Student Drop-Out Rates in Latin America. Santiago, Chile: United Nations Publications (LC/G.2193–P). Retrieved April 10, 2011 from http://www.eclac.org/cgi-bin/getProd.asp?xml=/publicaciones/xml/5/11245/P11245.xml&xsl=/dds/tpl-i/p9f.xsl&base=/dds/tpl/top-bottom.xslt
Fares, J., Montenegro, C. E., & Orazem, P. F. (November, 2006). How are youth faring in the labor market? evidence from around the world (no. 4071). Washington, D.C.: World Bank. (DOI: 10.1596/1813-9450-4071)
Gillwald, A. & Stork, C. (2010). Gender Assessment of ICT Access and Usage in Africa. Vol 1 Policy Paper 5. Johannesburg: Research ICT Africa. Retrieved April 12, 2011 from http://lirneasia.net/wp-content/uploads/2010/09//Gender_Paper_Sept_2010.pdf
34 CITIES OF YOUTH: CITIES OF PROSPERITY
Grierson, J.P. (1997). Where there is no job. London: ITDG Publishing.
Gulyani, S., Talukdar, D., & Jack, D. (2010). Poverty, living conditions, and infrastructure access. A comparison of slums in Dakar, Johannesburg, and Nairobi. Washington, D.C.: e Africa Infrastructure Country Diagnostic (AICD), The World Bank Africa Region Sustainable Development Division. (Report # WPS5388).
Halewood, N. and Kenny, C. 2007. Young people and ICTs in developing countries. World Development Report: World Bank, Washington D.C.
Handoussa, H. (2010). Egypt human development report 2010. Youth in Egypt: Building our future. Egypt: Human Development Project, United Nations Development Programme (UNDP) and the Institute of National Planning. (ISBN: 977-5023-12-2).
0Hansen, K. T., (Spring, 2010). Changing youth dynamics in Lusaka’s informal economy in the context of economic liberalization. African Studies Quarterly, 11(2, 3). Retrieved 16 April 2011 from http://www.africa.ufl.edu/asq/v11/v11i2-3a2.pdf
Huisman, J., & Smits, J. (2009). Effects of household and district-level factors on primary school enrollment in 30 developing countries. World Development, 37(1), 179–193. (DOI: 10.1016/j.worlddev.2008.01.007).
International Labour Office (ILO) (2007), Global Employment Trends Model; Geneva: ILO
International Labour Office (ILO) (2006) National Action Plans on Youth Employment. Geneva: ILO
International Labour Office (ILO) (2007), Global Employment Trends Model; Geneva: ILO
International Labour Office (ILO) (August, 2010). Global employment trends 2010: Special issue on the impact of the global economic crisis on youth. Geneva: ILO. (ISBN: 978-92-2-123856-0).
International Telecommunications Union (2010). Global ICT developments. Retrieved 16 April, 2011 from http://www.itu.int/ITU-D/ict/statistics/ict/index.html
International Union of Food (IUF) (2010). Precarious Employment. Geneva: IUF.
Javed, A. (2010, August 22). Huge unemployment can push youth to militancy. The Nation, Retrieved 16 April 2011 from http://www.nation.com.pk/pakistan-news-newspaper-daily-english-online/Regional/Lahore/22-Aug-2010/Huge-unemployment-can-push-youth-to-militancy2010
Josiah, S. (10 July 2010). Response of higher education to globalisation: empirical evidences from India. Journal of Social and Economic Development, 12(2), 154-171. Retrieved from Academic OneFile. Web. 16 Apr. 2011. (Gale Document No. A238093174).
Lancaster, P., Smith, P. A., & Thomas, L. (August-September, 2008). Arab youth: the challenge of tomorrow. The Middle
35CITIES OF YOUTH: CITIES OF PROSPERITY
East, Retrieved 16 April 2011 from http://findarticles.com/p/articles/mi_m2742/is_392/ai_n28048864/
London, J. K., Zimmerman, K., & Erbstein, N. (Summer, 2003). Youth-led research and evaluation: Tools for youth, organizational, and community development. New Directions for Evaluation, (No. 98), 33-45. (ISSN: 1097-6736).
Mayor, F. & Binde, J. (2001). The world ahead: Our future in the making. London: Zed Books.
Mboup, G. (June 2004). Solutions for urban youth in Africa. Presentation for expert group meeting on strategies for creating urban youth employment; UN-Habitat; Nairobi, Kenya. Retrieved 14 April 2011 from http://www.un.org/esa/socdev/unyin/documents/ydiHabitatyouthemployment.pdf
Mckenzie, D. J. (2006). A profile of the World’s young developing country migrants. Washington, D.C.: World Bank. (No. 4021).
Mckenzie, D. J. (2006). A profile of the World’s young developing country migrants (no. 4021). Washington, DC: World Bank.
Mkandawire, R. M. (1996). Experiences in youth policy and programme in commonwealth Africa. Unpublished Policy Document Prepared for the Commonwealth Youth Programme Department.
Mugisha, F. 2006. School enrollment among urban non-slum, slum and rural children in Kenya: Is the urban advantage eroding? International Journal of Educational Development, 26, 471–482.
Mulenga, L.C. (2000). Livelihoods of young people in Zambia’s Copperbelt and local responses. Doctoral dissertation. University of Wales at Cardiff.
Mustapha, A (1992). Structural adjustment and multiple modes of social: Livelihood in Nigeria. In P. Gibbon, Y. Bangura, & A. Ofstad (eds.), Authoritarianism, democracy and adjustment: The politics of economic reform in Africa. Uppsala: Nordiska Afrikainstitutet (The Nordic Africa Institute).
National Intelligence Council (NIC) (2008). Global trends 2025: A transformed world. Washington DC: United States.
Pilgrim, M. (2009). Youth employment and social integration. Paper submitted on the occasion of the UN expert group Meeting on “Policies to Advance Social Integration” New York, Nov 2nd to 4th, 2009. Geneva: Youth Employment Network.
Population Council. (2007). Colombia 2005: Results from the demographic and health survey. Studies in Family Planning, 38(1), pp. 55-60.
Population Reference Bureau, (2006). PRB world’s youth 2006 data sheet. Retrieved from http://www.prb.org/Datafinder/Topic/Bar.aspx?sort=v&order=d&variable=23
36 CITIES OF YOUTH: CITIES OF PROSPERITY
Putnam, R. (2000). Bowling alone: The collapse and revival of American community. New York: Simon & Schuster.
Putz, U. (3 February 2011). No quick fix for Arab youth’s economic woes. Spiegel International, Retrieved 16 April 2011 from http://www.spiegel.de/international/world/0,1518,743456,00.html
Ragan, D. Digital Access for all (2): For Africa, the Time is NOW. Retrieved 14 April 2011 from http://pradical.org/2010/10/18/digital-access-for-all-2/
Rees, Alexandra (2011). A Look at the Mobile Youth. Retrieved 16 April 2011 from http://www.gottaquirk.com/2011/08/10/a-look-at-the-mobile-youth/
Rosas, G., & Rossignotti, G. (2008) Guide for the preparation of national action plans on youth employment. Geneva: ILO. (ISBN 978-92-2-120617-0).
Salehi-Isfahani, D., & Egel, D. (September, 2007). Youth exclusion in Iran: The state of education, employment and family formation (No. 3). The Middle East Initiative Working Paper. Washington, D.C.: Wolfensohn Center for Development, Dubai School Of Government. Retrieved 14 April 2011 from http://www.brookings.edu/~/media/Files/rc/papers/2007/09_youth_exclusion_salehi_isfahani/09_youth_exclusion_salehi_isfahani.pdf
Sarr, M. D. (2004). Poverty reduction strategy and youth employment in Senegal. Paper for Expert Group Meeting on “Strategies for Creating Urban Youth Employment: Solutions for Urban Youth in Africa” by the Division for Social Policy and Development, Department of Economic and Social Affairs, United Nations, UN-Habitat, and the Youth Employment Network, 21-25 June 2004. Nairobi, Kenya: UNDESA/UN-Habitat. Retrieved 14 April 2011 from http://www.un.org/esa/socdev/social/papers/urban_sarr_prsp.pdf
Sarr, M.D (2000). Youth Employment in Africa: The Senegalese Experience. Report to the UN and ILO. New York: UN.
SIDA (2006) Fighting poverty in an urban world—Support to urban development. Stockholm: Department for Infrastructure and Economic Cooperation, Division for Urban Department. Retrieved 14 April 2011 from http://www.sida.se/PageFiles/22936/SIDA30526en_UrbanPolicy_Ny%5B1%5D.indd.pdf
SIDA (2009). The role of young people in poverty reduction: Tackling poverty together. Stockholm: The National Council of Swedish Youth Organizations (LSU). Retrieved 15 April 2011 from http://www.un.org/esa/socdev/publications/TPTPublication.pdf
37CITIES OF YOUTH: CITIES OF PROSPERITY
Sommers, M. (2003). War, Urbanization, and Africa’s Youth at Risk: Understanding and Addressing Future Challenges. Washington, DC: Basic Education and Policy Support (BEPS) Activity and Creative Associates International.
Sommers, M. (2006). Youth and conflict: A brief review of available literature. Washington, DC: Education Development Centre and USAID.
Sparreboom, T, & Shahnaz, , L. (2007). Assessing labour market vulnerability among young people. Pakistan Development Review, 46(3), 193-213, Retrieved from EconPapers. Retrieved 16 April 2011 from http://EconPapers.repec.org/RePEc:pid:journl:v:46:y:2007:i:3:p:193-213
Todaro, M. (1969). A Model of Labor Migration and Urban Unemployment in Less Developed Countries. American Economic Review, 59, 138-148.
ul Haque, M, & Sultana, , M. (2003). Coming of age in contemporary Pakistan: influences of gender and poverty. Pakistan Development Review, 42(4), 643-668. Retrieved from EconPapers. Retrieved 16 April 2011 from http://EconPapers.repec.org/RePEc:pid:journl:v:42:y:2003:i:4:p:643-668
UNDP (2002). Arab Human Development Report. New York, New York. pg. 38
UNDESA (2010). Millennium development goal indicators, youth unemployment rate, aged 15-24, both sexes. Retrieved 16
April 2011, from http://mdgs.un.org/unsd/mdg/SeriesDetail.aspx?srid=630&crid=170
UN-ESCWA (2007). The Millennium Development Goals in the Arab Region 2007: A Youth Lens, an Overview. Retrieved from http://www.escwa.un.org/divisions/div_editor/Download.asp?table_ name=other&field_name=ID&FileID=951
UN-Habitat & DFID (2002). Sustainable urbanisation: Achieving agenda 21. Nairobi: UN-Habitat.
UN-Habitat (2006). The State of the World’s Cities Report, 2006-2007: The Millennium Development Goals and Urban Sustainability: 30 Years of Shaping the Habitat Agenda. Nairobi: UN- HABITAT.
UN-Habitat. (2007). The urban penalty: The poor die young. State of the world cities 2006–2007 (pp. 1–2). Nairobi, Kenya: UN-Habitat.
UN-Habitat. (2008). The place of children: Poverty and promise. Report of children living in poverty, prepared for UN Habitat Boulder, Colorado: University of Colorado.
UN-Habitat. (2008). Urban features: Children, slums’ first casualties. State of the world’s cities report 2006/7 (pp. 1-2). Nairobi, Kenya: UN-Habitat.
UN-Habitat. (2011). Youth programs and activities. Retrieved 04/01, 2011, from http://www.unhabitat.org/list.asp?typeid=13&catid=531
38 CITIES OF YOUTH: CITIES OF PROSPERITY
UN-Habitat (2010). The State of the World’s Cities Report 2010. Nairobi: UN- HABITAT.
UNICEF (2003). The state of the world’s children 2003: Child participation. New York:
UNICEF. Retrieved 16 April 2011 from http://www.unicef.org/sowc03/contents/childparticipation.html
UNICEF, (2010). Unicef Egypt statistics. Retrieved 16 April 2011 from http://www.unicef.org/infobycountry/egypt_statistics.html#77
UNICEF, Education. (2010). Secondary school participation Retrieved 16 April 2011 from http://www.childinfo.org/education_secondary.php
United Nations b, . (2010). Millennium development goal indicators, ratio of youth unemployment rate to adult unemployment rate. Retrieved 16 April 2011 from http://unstats.un.org/unsd/mdg/SeriesDetail.aspx?srid=671&crid
United Nations Development Programme. (2009). Millennium development goal 2. Retrieved April 1, 2011. from http://www.undp.org/mdg/goal8.shtml
UNDESA. (2010). Millennium development goal indicators, youth unemployment rate, aged 15-24, both sexes Retrieved April 1, 2011 from http://mdgs.un.org/unsd/mdg/SeriesDetail.aspx?srid=630&crid=170
United Nations Economic Commission for Africa (UNECA). (June, 2009). African youth report 2009: Expanding opportunities for and with young people in Africa. Addis Ababa, Ethiopia: ECA Publications and Conference Management Section (PCMS).
United Nations Statistics Division, Department of Economic and Social Affairs. (2010). Millennium development goal indicators, youth unemployment rate, aged 15-24, both sexes. Retrieved 16 April 2011 from http://mdgs.un.org/unsd/mdg/SeriesDetail.aspx?srid=630&crid=170
United Nations, (2010). Millennium development goal indicators, slums. Retrieved 16 April 2011 from http://unstats.un.org/unsd/mdg/SeriesDetail.aspx?srid=710
United Nations. (2007). The employment imperative: Report on the world social situation. New York, New York: United Nations.
Urdal, H. (2006). A clash of generations? Youth bulges and political violence. International Studies Quarterly 50, 607–629.
Van Vliet, W. (2008). Creating liveable cities for all ages: Intergenerational strategies and initiatives. Nairobi, Kenya: UN-Habitat.
39CITIES OF YOUTH: CITIES OF PROSPERITY
Wanjiku, R. (5 April 2011). Africa banking on mobile to be first post-PC continent. Computerworld (Kenya), Nairobi, Kenya.
Woodrow Wilson International Center for Scholars (2003). Youth Explosions in Developing World Cities: Approaches to Reducing Poverty and Conflict in an Urban Age. Washington, D.C.: Woodrow Wilson International Center for Scholars.
World Bank (2006). World Development Report 2007: Development and the Next Generation. Washington. DC: The World Bank.
World Bank (2010). Education in Pakistan. Retrieved 16 April 2011 from http://www.worldbank.org.pk/WBSITE/EXTERNAL/COUNTRIES/SOUTHASIAEXT/PAKISTANEXTN/0,,contentMDK:21608863~pagePK:141137~piPK:141127~theSitePK:293052,00.html
World Bank (June. 2007). Interventions to Support Young Workers in Latin America and the Caribbean: Regional Report for the Youth Employment Inventory. Washington, D.C.
World Health Organization (2010). Bulletin of the World Health Organization. Vol. 88, Issue 5. P. 327-328. Washington, D.C.

40 CITIES OF YOUTH: CITIES OF PROSPERITY
United Nations Human Settlements ProgrammeP.O.Box 30030,Nairobi 00100,Kenya;Tel: +254-20-7623120; Fax: +254-20-76234266/7 (central office)[email protected]
www.unhabitat.org
CITIES OF YOUTH: CITIES OF PROSPERITY
Youth are key to the prosperity of cities in the developing world, yet many
barriers prevent them from fulfilling this role — most notably access to education, vocational training,
and employment. It is crucial that governments and institu-tions assist youth to overcome these barriers by facilitating equitable access to education and employment. This report
focuses on the nexus between employment, cities, and youth: ar-eas that drive economic prosperity in the developing world. The report analyzes those factors that increase the ability of youth to secure employment. Mobile communication technologies
as well emerge as supporting asset development among young people and equalizing wealth disparities.
The conclusion considers policy and program implications.
HS/025/13E ISBN (Volume): 978-92-1-132562-1