Embed Size (px)
Citation preview

CITIES AND CIRCULAR ECONOMY FOR FOOD
CITIES AND CIRCULAR ECONOMY FOR FOOD • PORTO, PORTUGAL
CONTENTS EXECUTIVE SUMMARY 2
1. PORTO’S UNIQUE ASSETS 3
2. URBAN AND PERI-URBAN FOOD PRODUCTION 5
3. URBAN FOOD CONSUMPTION 1 1
4. ORGANIC WASTE AND FOOD BY-PRODUCTS 13
6. INVESTIGATING THE BENEFITS OF A CIRCULAR ECONOMY FOR FOOD IN PORTO 15
APPENDIX 17
1
CITIES AND CIRCULAR ECONOMY FOR FOOD • PORTO, PORTUGAL
EXECUTIVE SUMMARY
Porto, Portugal Situated near the sea along the river Douro, Porto is Portugal's second largest city. With a diverse range of food production in the Porto Metropolitan Area (PMA), an innovative profile, and an already active approach to improving the food system, the City of Porto is in a unique position to begin the transition towards a circular economy for food. By establishing favourable policies, facilitating collaborations across the entire food value chain, and undertaking its own initiatives, the City of Porto could realise the circular economy vision and create significant economic, health, and environmental benefits.
THE CITY OF PORTO CAN HARNESS THE THREE AMBITIONS DESCRIBED IN THE CITIES AND CIRCULAR ECONOMY FOR FOOD REPORT:
1) Source food grown regeneratively, and locally where appropriate 2) Make the most of food 3) Design and market healthier food products
THE FOLLOWING ASSETS COULD BE LEVERAGED TO BUILD A THRIVING CIRCULAR FOOD SYSTEM IN PORTO:
Strong innovation profile and start-up
friendly city
Diverse regional food production and
national strategy on biological agriculture
Part of a large vibrant hub of 2 million
people
Circular economy roadmap including
food system actions
Projects connecting consumers with food
production and growing separation and valorisation of
organics
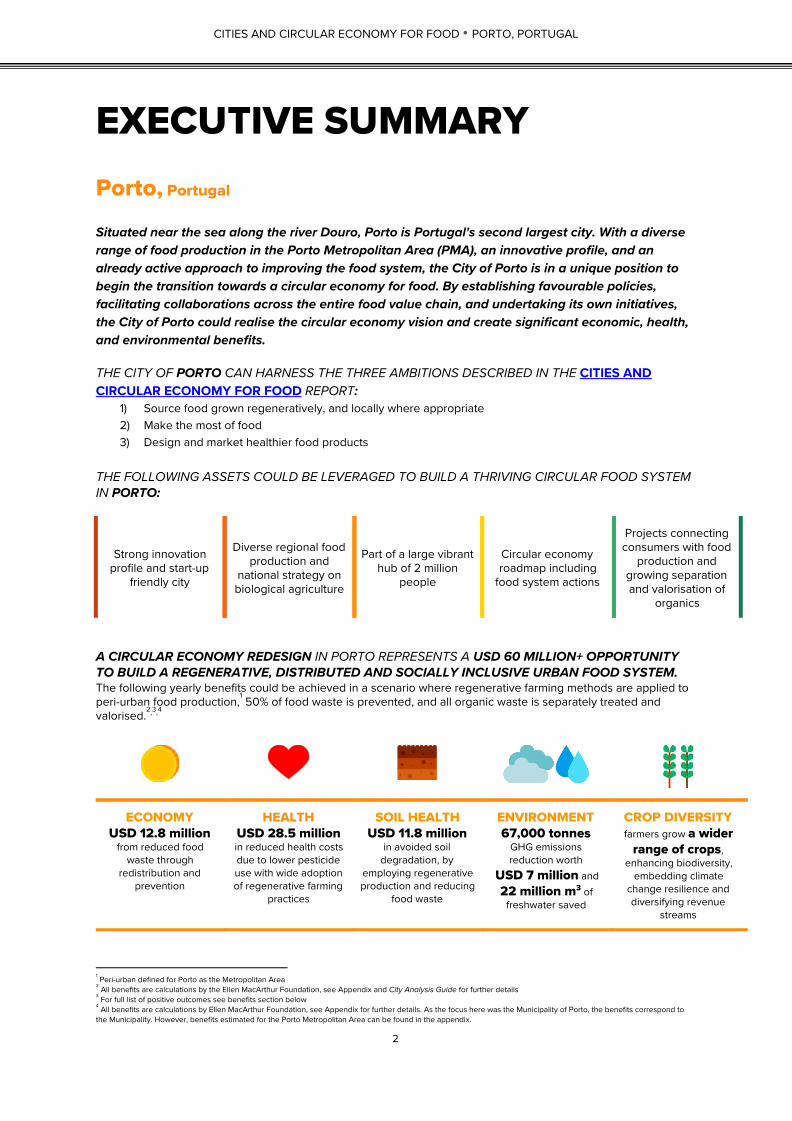
A CIRCULAR ECONOMY REDESIGN IN PORTO REPRESENTS A USD 60 MILLION+ OPPORTUNITY TO BUILD A REGENERATIVE, DISTRIBUTED AND SOCIALLY INCLUSIVE URBAN FOOD SYSTEM. The following yearly benefits could be achieved in a scenario where regenerative farming methods are applied to peri-urban food production, 50% of food waste is prevented, and all organic waste is separately treated and
1
valorised. , , 2 3 4
ECONOMY USD 12.8 million
from reduced food waste through
redistribution and prevention
HEALTH USD 28.5 million in reduced health costs due to lower pesticide use with wide adoption of regenerative farming
practices
SOIL HEALTH USD 11.8 million
in avoided soil degradation, by
employing regenerative production and reducing
food waste
ENVIRONMENT 67,000 tonnes
GHG emissions reduction worth
USD 7 million and
22 million m3 of freshwater saved
CROP DIVERSITY farmers grow a wider
range of crops, enhancing biodiversity,
embedding climate change resilience and diversifying revenue
streams
1 Peri-urban defined for Porto as the Metropolitan Area 2 All benefits are calculations by the Ellen MacArthur Foundation, see Appendix and City Analysis Guide for further details 3 For full list of positive outcomes see benefits section below 4 All benefits are calculations by Ellen MacArthur Foundation, see Appendix for further details. As the focus here was the Municipality of Porto, the benefits correspond to the Municipality. However, benefits estimated for the Porto Metropolitan Area can be found in the appendix.
2
CITIES AND CIRCULAR ECONOMY FOR FOOD • PORTO, PORTUGAL
1. PORTO’S UNIQUE ASSETS
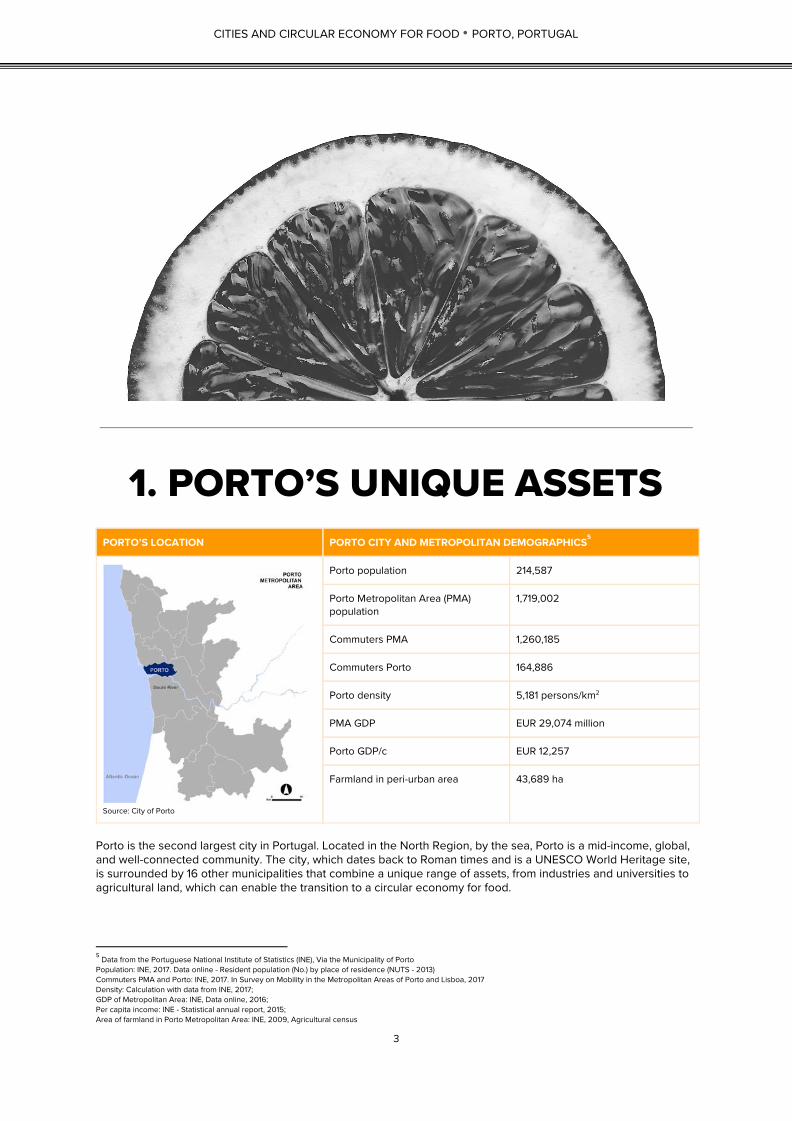
PORTO’S LOCATION PORTO CITY AND METROPOLITAN DEMOGRAPHICS 5
Source: City of Porto
Porto population 214,587
Porto Metropolitan Area (PMA) population
1,719,002
Commuters PMA 1,260,185
Commuters Porto 164,886
Porto density 5,181 persons/km2
PMA GDP EUR 29,074 million
Porto GDP/c EUR 12,257
Farmland in peri-urban area 43,689 ha
Porto is the second largest city in Portugal. Located in the North Region, by the sea, Porto is a mid-income, global, and well-connected community. The city, which dates back to Roman times and is a UNESCO World Heritage site, is surrounded by 16 other municipalities that combine a unique range of assets, from industries and universities to agricultural land, which can enable the transition to a circular economy for food.
5 Data from the Portuguese National Institute of Statistics (INE), Via the Municipality of Porto Population: INE, 2017. Data online - Resident population (No.) by place of residence (NUTS - 2013) Commuters PMA and Porto: INE, 2017. In Survey on Mobility in the Metropolitan Areas of Porto and Lisboa, 2017 Density: Calculation with data from INE, 2017; GDP of Metropolitan Area: INE, Data online, 2016; Per capita income: INE - Statistical annual report, 2015; Area of farmland in Porto Metropolitan Area: INE, 2009, Agricultural census
3
CITIES AND CIRCULAR ECONOMY FOR FOOD • PORTO, PORTUGAL
Porto’s and Porto Metropolitan Area’s unique assets include: STRONG INNOVATION PROFILE: Porto was voted the top European start-up friendly city, spurred by
6
organisations such as ScaleUp Porto that combine local development, with innovation and the environment. 7
CIRCULAR ECONOMY ROADMAP: Porto Municipality recently developed a circular economy roadmap with the ambition of becoming a circular city by 2030, following the national action plan and the momentum building
8 9
across Europe. The roadmap includes food system actions. PRODUCER OF LARGE RANGE OF FOOD TYPES AND PRODUCTS: situated in a diverse geographic area and next to the sea, Porto’s surrounding agricultural lands and fisheries produce a wide range of fruits, vegetables, dairy, meat, and seafood.
10
MULTIPLE ONGOING INITIATIVES: from urban vegetable gardens and green roofs to separation of organics at source, solidarity restaurants and influencing portion sizes, multiple initiatives aligned with the principles of a circular economy are already at work in Porto. LARGE TOURISM INDUSTRY: selected in 2017 as Best European destination to travel to, Porto welcomes
11
approximately 1.2 million visitors per year, generating a vibrant additional market for the local food system. 12
6 Porto. Porto vence o prestigiado World Excellence Award para a cidade europeia mais amiga das startups , http://www.porto.pt/noticias/porto-vence-o-prestigiado-world-excellence-award-para-a-cidade-europeia-mais-amiga-das-startups- 7 ScaleUp Porto, http://scaleupporto.pt/about-scaleup-porto/ 8 Porto Municipality, http://www.cm-porto.pt/economia-circular 9 Republica Portuguesa, Ambiente. Leading the transition – Action plan for circular economy in Portugal: 2017–2020, https://circulareconomy.europa.eu/platform/sites/default/files/strategy_-_portuguese_action_plan_paec_en_version_3.pdf 10 See food production section for more information 11 European Best Destinations (2017), https://www.europeanbestdestinations.com/best-of-europe/european-best-destinations-2017/ 12 PWC (2017), Standing out from the crowd: European cities hotel forecast for 2017 and 2018, https://www.pwc.ch/en/publications/2017/european-hotels-forecast-report-2017-2018-web.pdf
4
CITIES AND CIRCULAR ECONOMY FOR FOOD • PORTO, PORTUGAL
2. URBAN AND PERI-URBAN FOOD PRODUCTION
Porto has been long recognised for its wine production, and indeed vast quantities are processed and stored on the banks of the Douro. However, the Porto Metropolitan Area’s food production is also extensive and
13
wide-ranging, including seafood, meat and dairy, as well as fruits and vegetables (see Figure 2 for top products). In terms of the contribution to the local GDP, PMA’s primary food production only accounts for 1.5%. However, other food-related industries such as food manufacturing (fish canning, port wine blending, etc.), catering and
14
hospitality, and organic waste processing also represent significant contributions to the services and manufacturing categories of GDP.
15
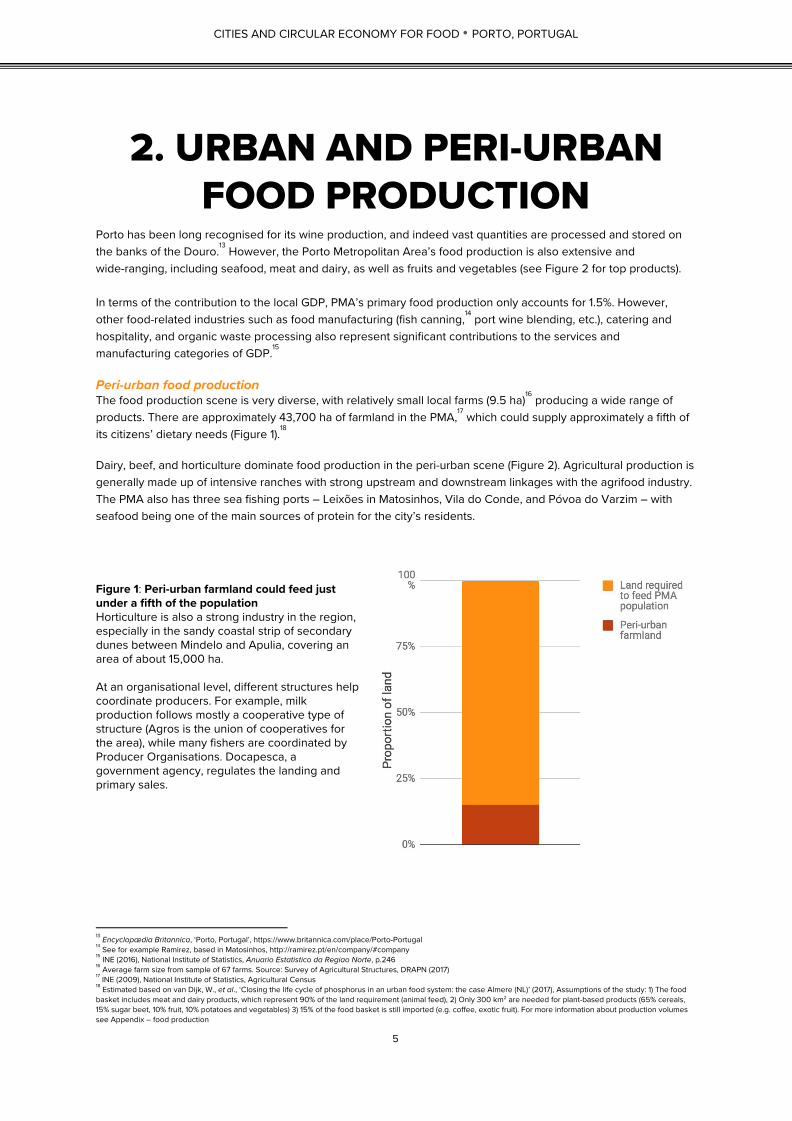
Peri-urban food production The food production scene is very diverse, with relatively small local farms (9.5 ha) producing a wide range of 16
products. There are approximately 43,700 ha of farmland in the PMA, which could supply approximately a fifth of 17
its citizens’ dietary needs (Figure 1). 18
Dairy, beef, and horticulture dominate food production in the peri-urban scene (Figure 2). Agricultural production is generally made up of intensive ranches with strong upstream and downstream linkages with the agrifood industry. The PMA also has three sea fishing ports – Leixões in Matosinhos, Vila do Conde, and Póvoa do Varzim – with seafood being one of the main sources of protein for the city’s residents. Figure 1 : Peri-urban farmland could feed just under a fifth of the population Horticulture is also a strong industry in the region, especially in the sandy coastal strip of secondary dunes between Mindelo and Apulia, covering an area of about 15,000 ha. At an organisational level, different structures help coordinate producers. For example, milk production follows mostly a cooperative type of structure (Agros is the union of cooperatives for the area), while many fishers are coordinated by Producer Organisations. Docapesca, a government agency, regulates the landing and primary sales.
13 Encyclopædia Britannica , ‘Porto, Portugal’, https://www.britannica.com/place/Porto-Portugal 14 See for example Ramirez, based in Matosinhos, http://ramirez.pt/en/company/#company 15 INE (2016), National Institute of Statistics, Anuario Estatistico da Regiao Norte , p.246 16 Average farm size from sample of 67 farms. Source: Survey of Agricultural Structures, DRAPN (2017) 17 INE (2009), National Institute of Statistics, Agricultural Census 18 Estimated based on van Dijk, W., et al., ‘Closing the life cycle of phosphorus in an urban food system: the case Almere (NL)’ (2017), Assumptions of the study: 1) The food basket includes meat and dairy products, which represent 90% of the land requirement (animal feed), 2) Only 300 km2 are needed for plant-based products (65% cereals, 15% sugar beet, 10% fruit, 10% potatoes and vegetables) 3) 15% of the food basket is still imported (e.g. coffee, exotic fruit). For more information about production volumes see Appendix – food production
5
CITIES AND CIRCULAR ECONOMY FOR FOOD • PORTO, PORTUGAL
Figure 2: Top agricultural products in North region 19
Product Tonnes/year
Meat (cattle, poultry, and others) 76,766,000
Dairy and eggs 9,884,845
Grapes 20 316,227
Peri-urban food production and practices Although the food flow patterns are not clear, there are existing initiatives, such as Prove, that are linking
21
producers with consumers, with the intention of creating a more locally integrated food system. Other initiatives, such as AMAP, are also looking to diversify agricultural practices and transition to more regenerative modes of 22
production. While the productivity of the land is high, changing production practices to ones that maintain healthy ecosystems is particularly important in the face of climate change and land degradation, which is of growing concern in Portugal. ,
23 24
In this context, the Porto Metropolitan Area comprises a wide range of farm and production types. Based on a survey of 67 farms, 13 different types of farms were present, and 10% indicated they produced a variety of 25
agricultural crops through polyculture or a mix of agricultural crops and livestock. Figure 3. Average fertiliser consumption in Portugal and the world (2016)
26
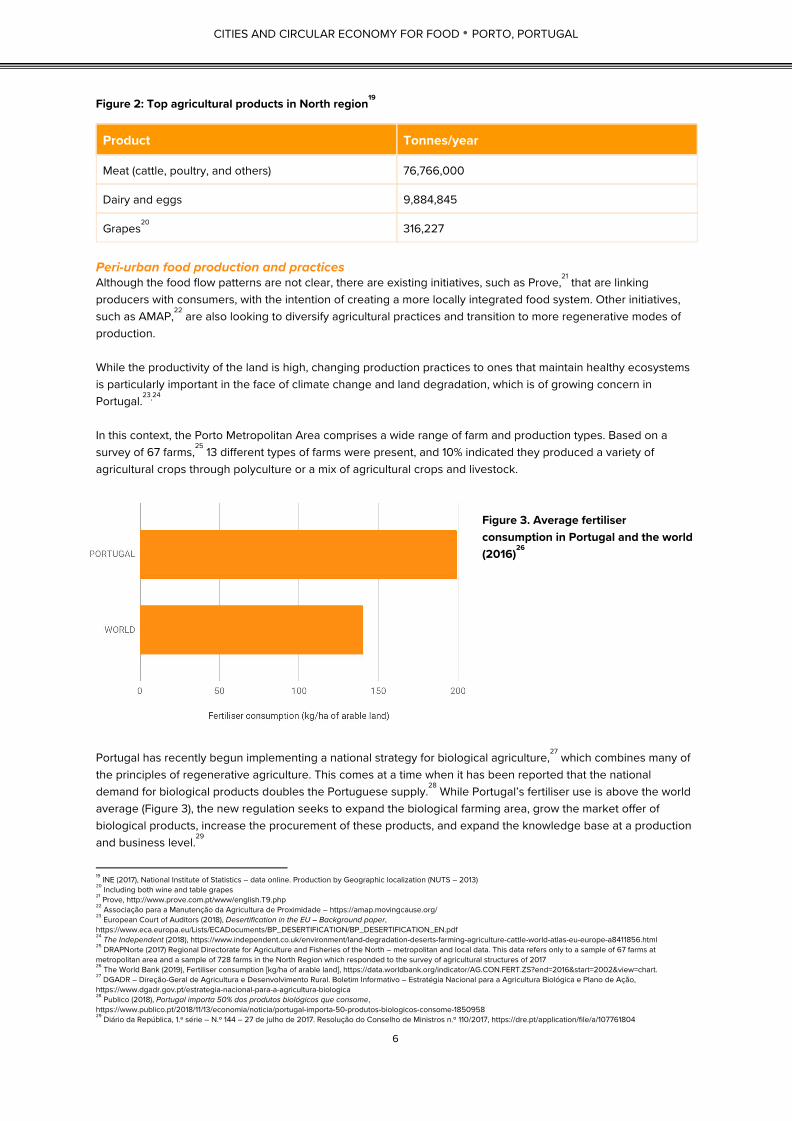
Portugal has recently begun implementing a national strategy for biological agriculture, which combines many of 27
the principles of regenerative agriculture. This comes at a time when it has been reported that the national demand for biological products doubles the Portuguese supply. While Portugal’s fertiliser use is above the world
28
average (Figure 3), the new regulation seeks to expand the biological farming area, grow the market offer of biological products, increase the procurement of these products, and expand the knowledge base at a production and business level.
29
19 INE (2017), National Institute of Statistics – data online. Production by Geographic localization (NUTS – 2013) 20 Including both wine and table grapes 21 Prove, http://www.prove.com.pt/www/english.T9.php 22 Associação para a Manutenção da Agricultura de Proximidade – https://amap.movingcause.org/ 23 European Court of Auditors (2018), Desertification in the EU – Background paper , https://www.eca.europa.eu/Lists/ECADocuments/BP_DESERTIFICATION/BP_DESERTIFICATION_EN.pdf 24 The Independent (2018), https://www.independent.co.uk/environment/land-degradation-deserts-farming-agriculture-cattle-world-atlas-eu-europe-a8411856.html 25 DRAPNorte (2017) Regional Directorate for Agriculture and Fisheries of the North – metropolitan and local data. This data refers only to a sample of 67 farms at metropolitan area and a sample of 728 farms in the North Region which responded to the survey of agricultural structures of 2017 26 The World Bank (2019), Fertiliser consumption [kg/ha of arable land], https://data.worldbank.org/indicator/AG.CON.FERT.ZS?end=2016&start=2002&view=chart. 27 DGADR – Direção-Geral de Agricultura e Desenvolvimento Rural. Boletim Informativo – Estratégia Nacional para a Agricultura Biológica e Plano de Ação, https://www.dgadr.gov.pt/estrategia-nacional-para-a-agricultura-biologica 28 Publico (2018), Portugal importa 50% dos produtos biológicos que consome , https://www.publico.pt/2018/11/13/economia/noticia/portugal-importa-50-produtos-biologicos-consome-1850958 29 Diário da República, 1.ª série – N.º 144 – 27 de julho de 2017. Resolução do Conselho de Ministros n.º 110/2017, https://dre.pt/application/file/a/107761804
6

CITIES AND CIRCULAR ECONOMY FOR FOOD • PORTO, PORTUGAL
Urban production and innovation The City of Porto is a dense and vibrant area, but space was found to develop 13 vegetable gardens covering a combined cultivable area of 4 ha, which have been producing food on a small scale since 2003 (Figures 4 and 5). These gardens are jointly monitored by the Municipality and Lipor, and they not only serve household vegetable 30
needs, but also have been supplied with 400 composters, which combined return 120 tonnes of organic material to the soil every year. However, it must be noted that they represent only a fraction of the 62.5 ha of agricultural 31
land in the Municipality of Porto, highlighting the potential for urban production to take in organic material and 32
supply local needs. 33
Figure 4: Location of the 13 vegetable gardens in the
City of Porto. Source: Porto Municipality
Figure 5: Condominia Municipal Vegetable Garden.
The garden was established in 2004.
Source: Porto Municipality
Urban food production could soon reach higher levels. The Fifth Façade Project (PQAP) is exploring how to 34
include green roofs into the urban development agenda. Green roofs, already covering an area of 11 ha, would 35
not only increase the cultivable area of the city but would also create a range of other benefits, including increasing the climate change resilience of the city (Figure 6).
30 LIPOR is the Municipalities Association responsible for the management, recovery and treatment of the municipal waste produced in the Porto municipality. It has a complete Environmental Education Program that includes urban farming in various projects namely the “Horta à Porta” project (“Vegetable garden at Door”) 31 Porto Municipality 32 INE (2009), National institute of Statistics., Agricultural census 33 Risks of contamination from atmospheric pollutants must be considered in urban food production 34 City of Porto and Associação Nacional de Coberturas Verdes, http://www.greenroofs.pt/en/pqap 35 City of Porto
7
CITIES AND CIRCULAR ECONOMY FOR FOOD • PORTO, PORTUGAL
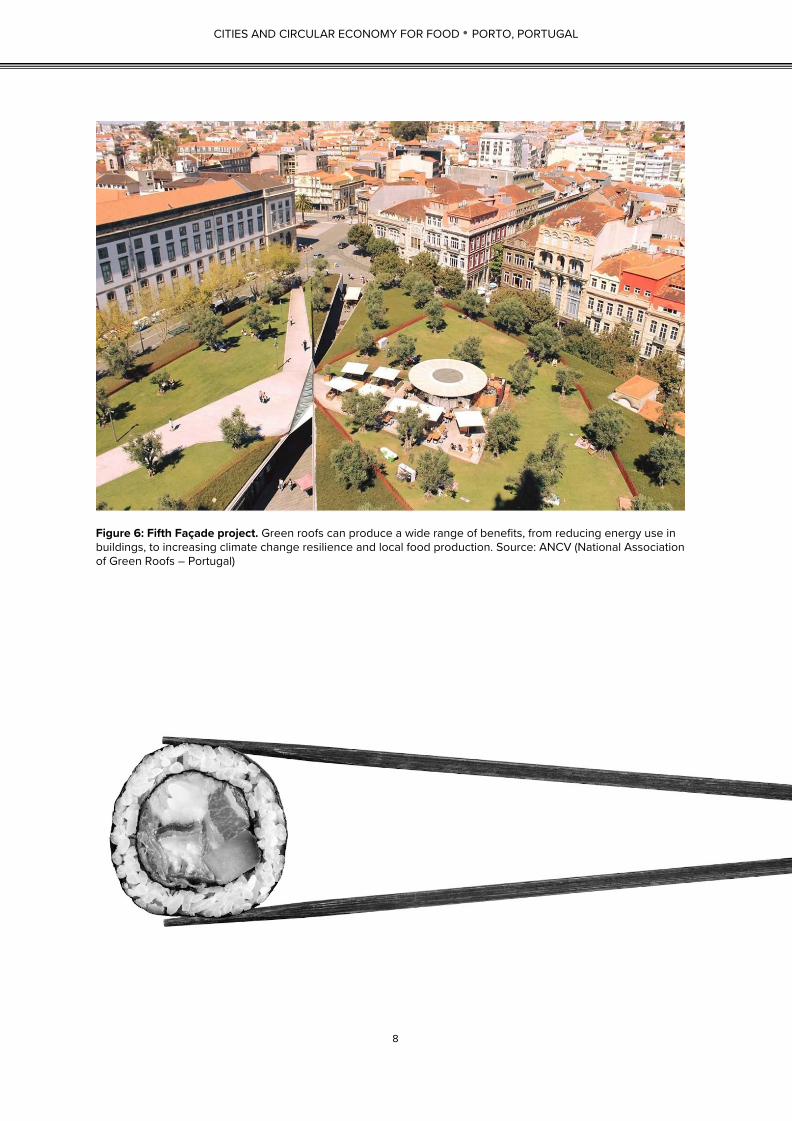
Figure 6: Fifth Façade project. Green roofs can produce a wide range of benefits, from reducing energy use in buildings, to increasing climate change resilience and local food production. Source: ANCV (National Association of Green Roofs – Portugal)
8
CITIES AND CIRCULAR ECONOMY FOR FOOD • PORTO, PORTUGAL
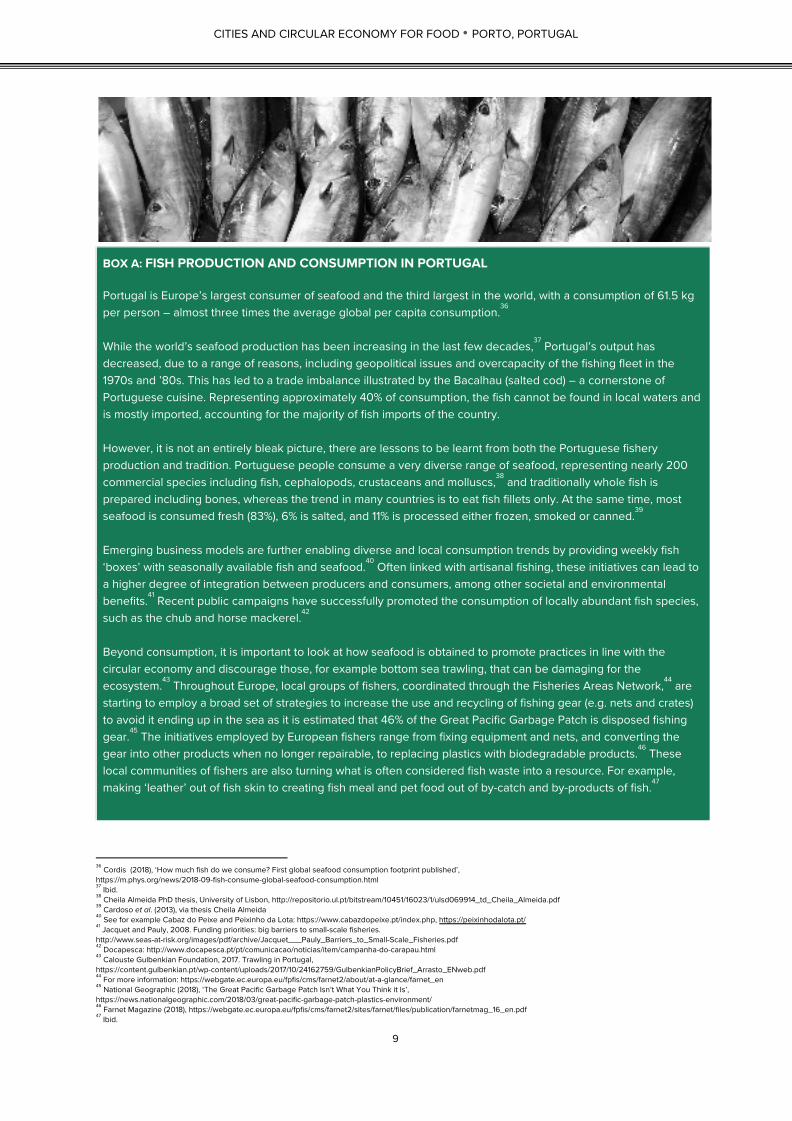
BOX A: FISH PRODUCTION AND CONSUMPTION IN PORTUGAL Portugal is Europe’s largest consumer of seafood and the third largest in the world, with a consumption of 61.5 kg per person – almost three times the average global per capita consumption.
36
While the world’s seafood production has been increasing in the last few decades, Portugal’s output has
37
decreased, due to a range of reasons, including geopolitical issues and overcapacity of the fishing fleet in the 1970s and ’80s. This has led to a trade imbalance illustrated by the Bacalhau (salted cod) – a cornerstone of Portuguese cuisine. Representing approximately 40% of consumption, the fish cannot be found in local waters and is mostly imported, accounting for the majority of fish imports of the country. However, it is not an entirely bleak picture, there are lessons to be learnt from both the Portuguese fishery production and tradition. Portuguese people consume a very diverse range of seafood, representing nearly 200 commercial species including fish, cephalopods, crustaceans and molluscs, and traditionally whole fish is
38
prepared including bones, whereas the trend in many countries is to eat fish fillets only. At the same time, most seafood is consumed fresh (83%), 6% is salted, and 11% is processed either frozen, smoked or canned.
39
Emerging business models are further enabling diverse and local consumption trends by providing weekly fish ‘boxes’ with seasonally available fish and seafood. Often linked with artisanal fishing, these initiatives can lead to
40
a higher degree of integration between producers and consumers, among other societal and environmental benefits. Recent public campaigns have successfully promoted the consumption of locally abundant fish species, 41
such as the chub and horse mackerel. 42
Beyond consumption, it is important to look at how seafood is obtained to promote practices in line with the circular economy and discourage those, for example bottom sea trawling, that can be damaging for the ecosystem. Throughout Europe, local groups of fishers, coordinated through the Fisheries Areas Network, are
43 44
starting to employ a broad set of strategies to increase the use and recycling of fishing gear (e.g. nets and crates) to avoid it ending up in the sea as it is estimated that 46% of the Great Pacific Garbage Patch is disposed fishing gear. The initiatives employed by European fishers range from fixing equipment and nets, and converting the
45
gear into other products when no longer repairable, to replacing plastics with biodegradable products. These 46
local communities of fishers are also turning what is often considered fish waste into a resource. For example, making ‘leather’ out of fish skin to creating fish meal and pet food out of by-catch and by-products of fish.
47
36 Cordis (2018), ‘How much fish do we consume? First global seafood consumption footprint published’, https://m.phys.org/news/2018-09-fish-consume-global-seafood-consumption.html 37 Ibid. 38 Cheila Almeida PhD thesis, University of Lisbon, http://repositorio.ul.pt/bitstream/10451/16023/1/ulsd069914_td_Cheila_Almeida.pdf 39 Cardoso et al . (2013), via thesis Cheila Almeida 40 See for example Cabaz do Peixe and Peixinho da Lota: https://www.cabazdopeixe.pt/index.php, https://peixinhodalota.pt/ 41 Jacquet and Pauly, 2008. Funding priorities: big barriers to small-scale fisheries. http://www.seas-at-risk.org/images/pdf/archive/Jacquet___Pauly_Barriers_to_Small-Scale_Fisheries.pdf 42 Docapesca: http://www.docapesca.pt/pt/comunicacao/noticias/item/campanha-do-carapau.html 43 Calouste Gulbenkian Foundation, 2017. Trawling in Portugal, https://content.gulbenkian.pt/wp-content/uploads/2017/10/24162759/GulbenkianPolicyBrief_Arrasto_ENweb.pdf 44 For more information: https://webgate.ec.europa.eu/fpfis/cms/farnet2/about/at-a-glance/farnet_en 45 National Geographic (2018), ‘The Great Pacific Garbage Patch Isn’t What You Think it Is’, https://news.nationalgeographic.com/2018/03/great-pacific-garbage-patch-plastics-environment/ 46 Farnet Magazine (2018), https://webgate.ec.europa.eu/fpfis/cms/farnet2/sites/farnet/files/publication/farnetmag_16_en.pdf 47 Ibid.
9

CITIES AND CIRCULAR ECONOMY FOR FOOD • PORTO, PORTUGAL
While the question of what a truly regenerative fishery looks like still remains, pursuing steps such as Marine Stewardship Council certification of fisheries and innovative models that allow for consumption of locally
48
abundant species and design out waste, would certainly help make the best out of our natural resources.
48 Marine Stewardship Council, https://www.msc.org/home
10
CITIES AND CIRCULAR ECONOMY FOR FOOD • PORTO, PORTUGAL
3. URBAN FOOD CONSUMPTION
Traditionally, Porto’s meat and fish intake has been high, but current food trends towards
plant-based proteins are gaining traction in the region. Initiatives around food distribution and tackling food insecurity are also seeing citizens adopt a healthier attitude to the food they
purchase and consume, as well as raising awareness of the need to reduce food waste.
HOW MUCH AND WHAT TYPES OF FOOD DO PEOPLE IN PORTO CONSUME? Just under 2 kg of food are consumed per person per day in Portugal, culminating in over 150 thousand tonnes of food per year for the whole Municipality of Porto. Meat and seafood consumption remains high, representing double and triple the world
49
average, with 93 kg of meat and 57 kg of seafood consumed per year. However, current trends of reducing meat 50
intake and searching for alternative sources of proteins are being adopted, with the number of vegetarians increasing fourfold in just one decade.
51
Increasing awareness of healthier eating is one of the main drivers for current food trends, resulting in a higher demand for vegetarian dishes and, especially among more senior consumers, for fresh products. The concern
52
over healthy foods has led to a growing number of consumers opting for organic or biological products, leading to investments by retailers in this area. Increasing awareness about healthy eating is also driving demand for less processed foods, that are free of artificial ingredients and that also use the whole food product in their preparation. A full breakdown of the consumption of different food types can be found in the Appendix. WHERE DO PEOPLE BUY THEIR GROCERIES? Supermarkets in Portugal hold 90% of the market share,
53
highlighting how important it is that they play a part in changing the food system. In the Porto Metropolitan Area, other points of sale such as markets, for example Mercado do Bolhao and Mercado do Matosinhos, still attract 54
large numbers of people. Other platforms are focusing on connecting producers with consumers. For example, the Associação para a Manutenção da Agricultura de Proximidade is looking to link consumers
55
with local producers that follow agroecological principles in their practices. Similarly, in the fisheries area, Cabaz do Peixe and Peixinho da Lota are not only directly connecting
56
consumers with fishers, but also increasing the diversity of seafood that is consumed.
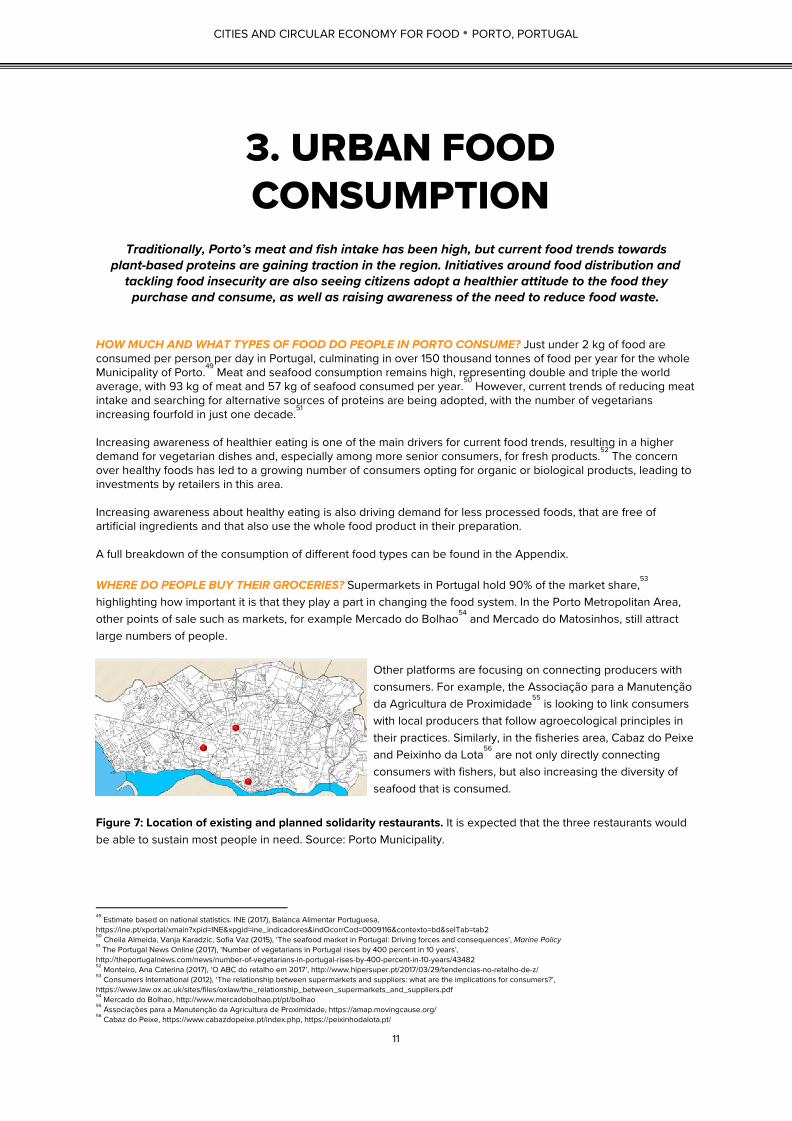
Figure 7: Location of existing and planned solidarity restaurants. It is expected that the three restaurants would be able to sustain most people in need. Source: Porto Municipality.
49 Estimate based on national statistics. INE (2017), Balanca Alimentar Portuguesa, https://ine.pt/xportal/xmain?xpid=INE&xpgid=ine_indicadores&indOcorrCod=0009116&contexto=bd&selTab=tab2 50 Cheila Almeida, Vanja Karadzic, Sofia Vaz (2015), ‘The seafood market in Portugal: Driving forces and consequences’, Marine Policy 51 The Portugal News Online (2017), ‘Number of vegetarians in Portugal rises by 400 percent in 10 years’, http://theportugalnews.com/news/number-of-vegetarians-in-portugal-rises-by-400-percent-in-10-years/43482 52 Monteiro, Ana Caterina (2017), ‘O ABC do retalho em 2017’, http://www.hipersuper.pt/2017/03/29/tendencias-no-retalho-de-z/ 53 Consumers International (2012), ‘The relationship between supermarkets and suppliers: what are the implications for consumers?’, https://www.law.ox.ac.uk/sites/files/oxlaw/the_relationship_between_supermarkets_and_suppliers.pdf 54 Mercado do Bolhao, http://www.mercadobolhao.pt/pt/bolhao 55 Associações para a Manutenção da Agricultura de Proximidade, https://amap.movingcause.org/ 56 Cabaz do Peixe, https://www.cabazdopeixe.pt/index.php, https://peixinhodalota.pt/
11
CITIES AND CIRCULAR ECONOMY FOR FOOD • PORTO, PORTUGAL
FOOD INSECURITY ISSUES: Other initiatives, such as solidarity restaurants, are focusing on redistribution to tackle food insecurity. The Batalha solidarity restaurant offers 200 complete meals per day to people in economic need, granting them access to a healthy and balanced diet. Two new solidarity restaurants are planning to open soon. They are run in a partnership that includes NGOs, hotels, professional nutritionists, a hospital, and the Municipality of Porto – highlighting the importance of cooperation. Similarly, food donations are preventing food in perfect condition from being lost and are reducing food waste by 11% per year. There are over 30 organisations operating in Porto, such as ReFood, which reportedly distributed 20,000 meals in 2015.
57 58
Fruta Feia (‘ugly fruit’) is another organisation contributing to the reduction of food waste, by gathering misshapen fruits and vegetables from farmers and marketing them. These products, which otherwise farmers would not be able to sell, are offered through four different outlets in the Porto Metropolitan Area. At a national level, the initiative has prevented nearly 1,400 tonnes of fruits and vegetables from going to waste.
59
57 Re-food, https://www.re-food.org/pt 58 Municipality of Porto 59 Fruta Feia, https://frutafeia.pt/en
12
CITIES AND CIRCULAR ECONOMY FOR FOOD • PORTO, PORTUGAL
4. ORGANIC WASTE AND FOOD BY-PRODUCTS
Porto’s waste management system is in development. Separate collection of organic waste from households began in July 2018 and has not yet been applied to all households. However, a successful programme for commercial establishments has been in place for over a decade.
LIPOR is responsible for the management, recovery, and treatment of the municipal waste produced in the Porto Municipality and 8 of the 17 municipalities of the Porto Metropolitan Area (PMA). In alignment with national and European goals, the separate collection of organics is planned to reach over 40,000 households (or 30% of the city) in the short term. The current valorisation method for the organics that are collected is treatment and conversion into Nutrimais – a compost-like product that contributes nutrients and helps build soil health. Figure 9 shows the tonnes of Nutrimais produced every year, and the potential area of farmland that it could currently cover. Figure 8: Organic waste valorisation in Porto Metropolitan Area – 2017
60
Product Treatment Tonnes of Nutrimais produced/yr
% Potential farmland coverage area
61
Proportion treated circular in PMA
62
Compost derived product – Nutrimais
63Separation at source and in-vessel composting
12,000 15.3% 11%
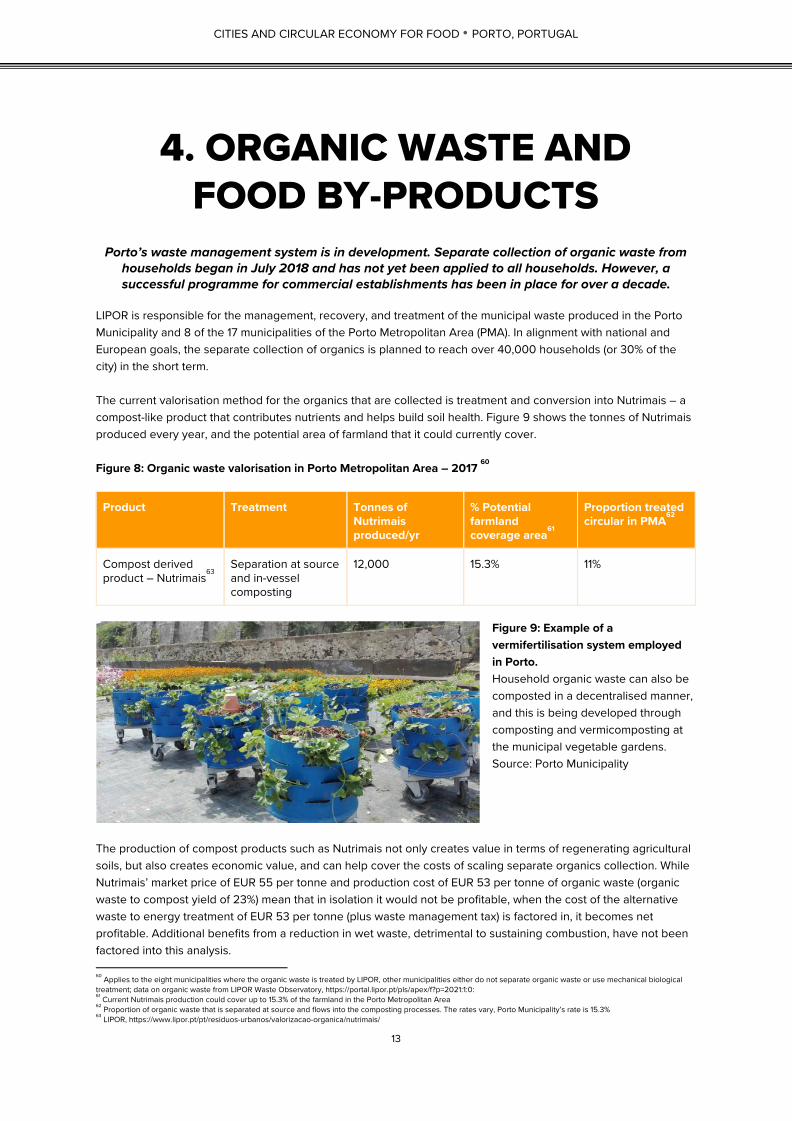
Figure 9: Example of a vermifertilisation system employed in Porto. Household organic waste can also be composted in a decentralised manner, and this is being developed through composting and vermicomposting at the municipal vegetable gardens. Source: Porto Municipality
The production of compost products such as Nutrimais not only creates value in terms of regenerating agricultural soils, but also creates economic value, and can help cover the costs of scaling separate organics collection. While Nutrimais’ market price of EUR 55 per tonne and production cost of EUR 53 per tonne of organic waste (organic waste to compost yield of 23%) mean that in isolation it would not be profitable, when the cost of the alternative waste to energy treatment of EUR 53 per tonne (plus waste management tax) is factored in, it becomes net profitable. Additional benefits from a reduction in wet waste, detrimental to sustaining combustion, have not been factored into this analysis.
60 Applies to the eight municipalities where the organic waste is treated by LIPOR, other municipalities either do not separate organic waste or use mechanical biological treatment; data on organic waste from LIPOR Waste Observatory, https://portal.lipor.pt/pls/apex/f?p=2021:1:0: 61 Current Nutrimais production could cover up to 15.3% of the farmland in the Porto Metropolitan Area 62 Proportion of organic waste that is separated at source and flows into the composting processes. The rates vary, Porto Municipality’s rate is 15.3% 63 LIPOR, https://www.lipor.pt/pt/residuos-urbanos/valorizacao-organica/nutrimais/
13
CITIES AND CIRCULAR ECONOMY FOR FOOD • PORTO, PORTUGAL
It must be highlighted that home and neighbourhood composting can play a big role in scaling the organics separation, especially when centralised facilities are working close to full capacity. Similarly, the costs and challenges of separate organics separation should be considered.
THE ROLE OF DESIGN It is important to emphasise the design aspect of the circular economy, which aims to prevent food from becoming organic waste in the first place. While some initiatives are diverting food that would go to waste to people in need through donations, LIPOR is working on two alternative projects: Embrulha (packaging) to provide biodegradable
64
packaging that allows people to take home their leftovers from restaurants; and Doce Certa (right portion), which 65
works with canteens, restaurants, and food system actors to define healthy and balanced meals in the right portion size. Design also applies to creating recipes that utilise by-products or foods that would become waste. Examples of this are Continente’s ‘Panana’ and chutney products. LIPOR also provides recipes for cooking without waste and
66
recipes for products that are traditionally considered waste. Finally, even more broadly, design applies also to systems and methods used by retailers to ensure that products that are getting close to their expiration or best before date are sold in time. More information on the mass of organic waste collected and type can be found in the Appendix.
64 For more information, see: https://www.lipor.pt/pt/educacao-ambiental/horta-da-formiga/desperdicio-alimentar/embrulha/ 65 For more information, see: https://www.lipor.pt/pt/educacao-ambiental/horta-da-formiga/desperdicio-alimentar/dose-certa-2/ 66 For more information: https://missao.continente.pt/noticias-eventos/panana-novo-produto-economia-circular and https://missao.continente.pt/noticias-eventos/o-nao-leva-casa-acaba-doces-chutneys
14
CITIES AND CIRCULAR ECONOMY FOR FOOD • PORTO, PORTUGAL
6. INVESTIGATING THE BENEFITS OF A
CIRCULAR ECONOMY FOR FOOD IN PORTO
Note: All calculations for the following benefits are based on estimated global benefits applied to the region. See City Analysis Guide for further details on the factors used to calculate the estimated benefits. The following priorities and scenarios that would shift Porto towards a circular economy for food were established based on conversations with the Municipality of Porto and other relevant actors. City priorities or concrete next steps that the city authority can take to move towards the goal are also outlined for each scenario. Further 67
details on the calculations, methods, and benefits for both Porto and the Porto Metropolitan Area can be found in the Appendix.
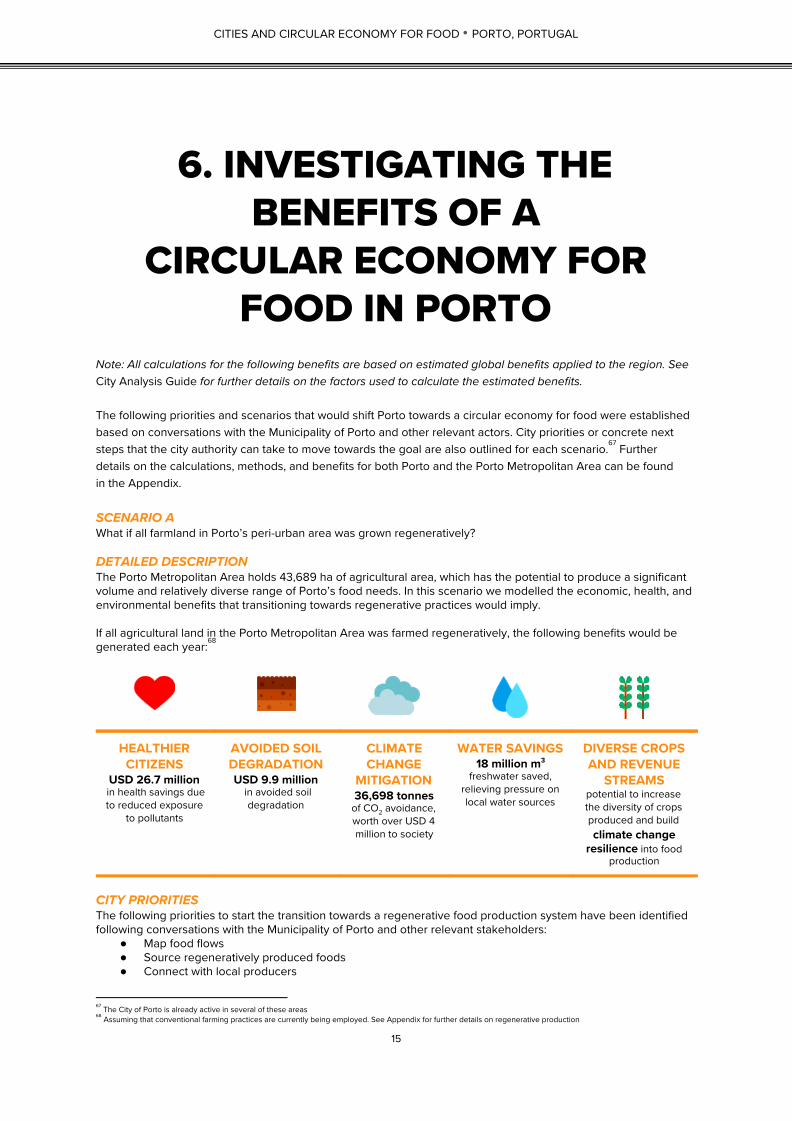
SCENARIO A What if all farmland in Porto’s peri-urban area was grown regeneratively? DETAILED DESCRIPTION The Porto Metropolitan Area holds 43,689 ha of agricultural area, which has the potential to produce a significant volume and relatively diverse range of Porto’s food needs. In this scenario we modelled the economic, health, and environmental benefits that transitioning towards regenerative practices would imply. If all agricultural land in the Porto Metropolitan Area was farmed regeneratively, the following benefits would be generated each year:
68
HEALTHIER CITIZENS
USD 26.7 million in health savings due to reduced exposure
to pollutants
AVOIDED SOIL DEGRADATION USD 9.9 million
in avoided soil degradation
CLIMATE CHANGE
MITIGATION 36,698 tonnes
of CO2 avoidance, worth over USD 4 million to society
WATER SAVINGS 18 million m 3
freshwater saved, relieving pressure on local water sources
DIVERSE CROPS AND REVENUE
STREAMS potential to increase the diversity of crops produced and build climate change
resilience into food production
CITY PRIORITIES The following priorities to start the transition towards a regenerative food production system have been identified following conversations with the Municipality of Porto and other relevant stakeholders:
● Map food flows ● Source regeneratively produced foods ● Connect with local producers
67 The City of Porto is already active in several of these areas 68 Assuming that conventional farming practices are currently being employed. See Appendix for further details on regenerative production
15
CITIES AND CIRCULAR ECONOMY FOR FOOD • PORTO, PORTUGAL
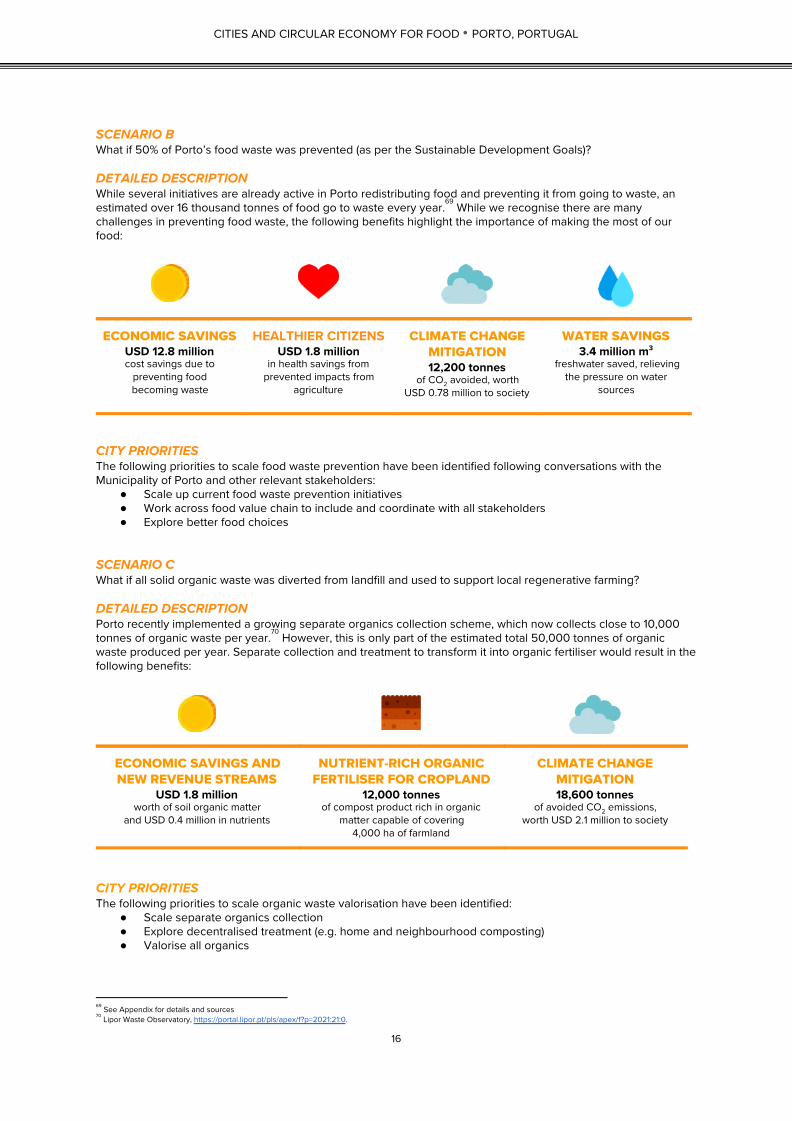
SCENARIO B What if 50% of Porto’s food waste was prevented (as per the Sustainable Development Goals)? DETAILED DESCRIPTION While several initiatives are already active in Porto redistributing food and preventing it from going to waste, an estimated over 16 thousand tonnes of food go to waste every year. While we recognise there are many
69
challenges in preventing food waste, the following benefits highlight the importance of making the most of our food:
ECONOMIC SAVINGS USD 12.8 million cost savings due to
preventing food becoming waste
HEALTHIER CITIZENS USD 1.8 million
in health savings from prevented impacts from
agriculture
CLIMATE CHANGE MITIGATION 12,200 tonnes
of CO2 avoided, worth USD 0.78 million to society
WATER SAVINGS 3.4 million m 3
freshwater saved, relieving the pressure on water
sources
CITY PRIORITIES The following priorities to scale food waste prevention have been identified following conversations with the Municipality of Porto and other relevant stakeholders:
● Scale up current food waste prevention initiatives ● Work across food value chain to include and coordinate with all stakeholders ● Explore better food choices
SCENARIO C What if all solid organic waste was diverted from landfill and used to support local regenerative farming? DETAILED DESCRIPTION Porto recently implemented a growing separate organics collection scheme, which now collects close to 10,000 tonnes of organic waste per year. However, this is only part of the estimated total 50,000 tonnes of organic
70
waste produced per year. Separate collection and treatment to transform it into organic fertiliser would result in the following benefits:
ECONOMIC SAVINGS AND NEW REVENUE STREAMS
USD 1.8 million worth of soil organic matter
and USD 0.4 million in nutrients
NUTRIENT-RICH ORGANIC FERTILISER FOR CROPLAND
12,000 tonnes of compost product rich in organic
matter capable of covering 4,000 ha of farmland
CLIMATE CHANGE MITIGATION 18,600 tonnes
of avoided CO2 emissions, worth USD 2.1 million to society
CITY PRIORITIES The following priorities to scale organic waste valorisation have been identified:
● Scale separate organics collection ● Explore decentralised treatment (e.g. home and neighbourhood composting) ● Valorise all organics
69 See Appendix for details and sources 70 Lipor Waste Observatory, https://portal.lipor.pt/pls/apex/f?p=2021:21:0.
16
CITIES AND CIRCULAR ECONOMY FOR FOOD • PORTO, PORTUGAL
APPENDIX
REGENERATIVE FOOD PRODUCTION
● Benefits were calculated for the 43,689 hectares of farmland in Porto’s peri-urban area (which in this case corresponds to the farmland in Porto Metropolitan Area)
● See additional City Analysis Guide with benefit factor table for details ● Benefits are quantified in comparison to conventional practices, as defined in the full Cities and Circular
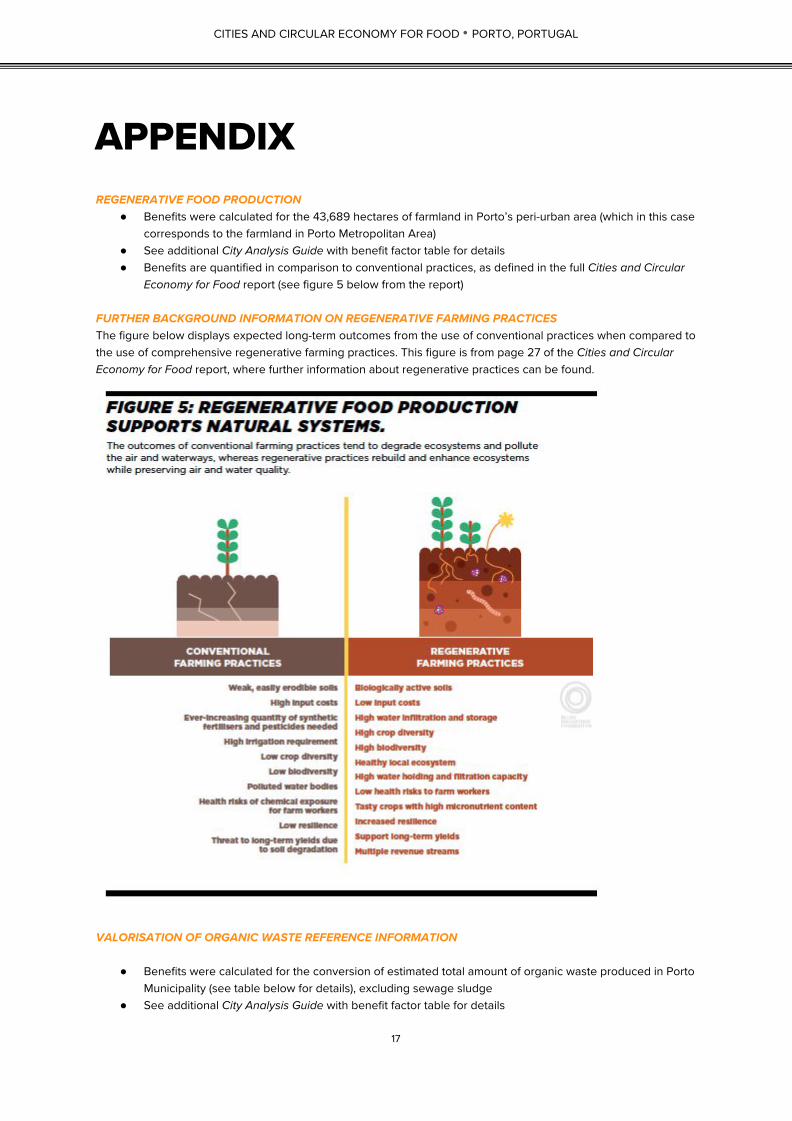
Economy for Food report (see figure 5 below from the report) FURTHER BACKGROUND INFORMATION ON REGENERATIVE FARMING PRACTICES The figure below displays expected long-term outcomes from the use of conventional practices when compared to the use of comprehensive regenerative farming practices. This figure is from page 27 of the Cities and Circular Economy for Food report, where further information about regenerative practices can be found.
VALORISATION OF ORGANIC WASTE REFERENCE INFORMATION
● Benefits were calculated for the conversion of estimated total amount of organic waste produced in Porto Municipality (see table below for details), excluding sewage sludge
● See additional City Analysis Guide with benefit factor table for details
17

CITIES AND CIRCULAR ECONOMY FOR FOOD • PORTO, PORTUGAL
ORGANIC WASTE PRODUCTION IN PORTO AND PMA (2017) 71
Type Porto (tonnes/yr) PMA (tonnes/yr)
Residential* N/A N/A
Green waste 3,977.5 25,207.6
Commercial 5,357.5 21,700.1
Total collected 9,335.3 46,907.8
Total production (estimate)** 51,631.0 427,007.8
* Residential collection begun in mid-2018 ** Estimate by the Ellen MacArthur Foundation based on data from the Lipor Waste Observatory APPROACH FOR CALCULATING BENEFITS FROM FOOD WASTE PREVENTION
● Benefits were calculated for 16,276 tonnes of food waste of avoidable food waste. See table below for details and sources
● Economic benefit estimated based on the value per mass of food and total mass of food waste ● See City Analysis Guide with benefit factor table for details on estimation of wider benefits
FOOD WASTE AND VALUE
Total / yr
Food Surplus 72 90.0 kg/person
Avoidable food waste 73 70.2 kg/person
Tn avoidable food waste 16,276 tonnes
Annual spend on food 74 €1166/person
Mass of food consumed 75 1.94kg/person
Value of kg of food 76 EUR 1.65/kg
Value of food waste 77 EUR 22.7 million
Value of preventing 50% waste 78 EUR 11.3 million
71Residential separate organics collection started in mid 2018. Data from Lipor Waste Observatory 72 Lipor via City of Porto 73 Assuming 83% and 81% of food constitute the edible component for production and distribution respectively – Source: City of Porto 74 Based on expenditure on household expenditure, assuming 2.5 persons per household. Source: Household Budget Survey INE, 2017 75 Balanca Alimentar Portuguesa 2012–2016. INE 2017 76 Estimate based on annual spend on food and mass of food consumed per year per person 77 Estimate obtained by multiplying mass of avoidable food waste * value of a kg of food 78 As per the Sustainable Development Goals
18
CITIES AND CIRCULAR ECONOMY FOR FOOD • PORTO, PORTUGAL
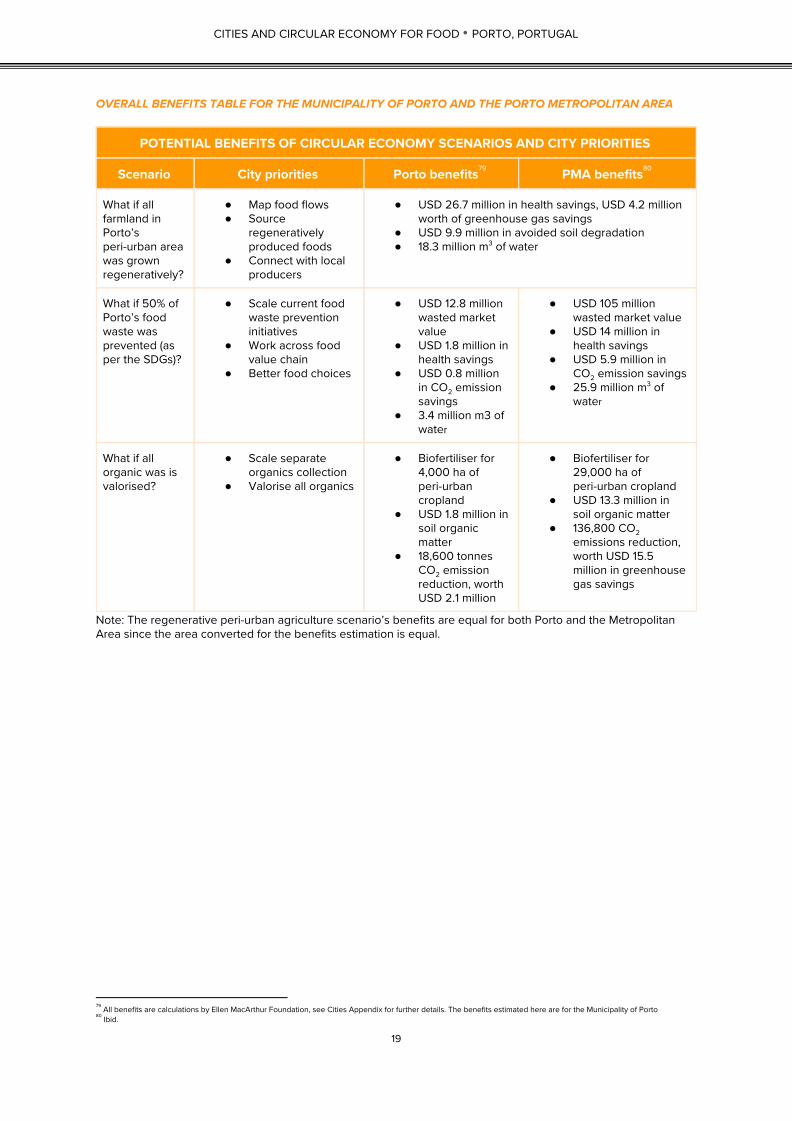
OVERALL BENEFITS TABLE FOR THE MUNICIPALITY OF PORTO AND THE PORTO METROPOLITAN AREA
POTENTIAL BENEFITS OF CIRCULAR ECONOMY SCENARIOS AND CITY PRIORITIES
Scenario City priorities Porto benefits 79 PMA benefits
80
What if all farmland in Porto’s peri-urban area was grown regeneratively?
● Map food flows ● Source
regeneratively produced foods
● Connect with local producers
● USD 26.7 million in health savings, USD 4.2 million worth of greenhouse gas savings
● USD 9.9 million in avoided soil degradation ● 18.3 million m3 of water
What if 50% of Porto’s food waste was prevented (as per the SDGs)?
● Scale current food waste prevention initiatives
● Work across food value chain
● Better food choices
● USD 12.8 million wasted market value
● USD 1.8 million in health savings
● USD 0.8 million in CO2 emission savings
● 3.4 million m3 of water
● USD 105 million wasted market value
● USD 14 million in health savings
● USD 5.9 million in CO2 emission savings
● 25.9 million m3 of water
What if all organic was is valorised?
● Scale separate organics collection
● Valorise all organics
● Biofertiliser for 4,000 ha of peri-urban cropland
● USD 1.8 million in soil organic matter
● 18,600 tonnes CO2 emission reduction, worth USD 2.1 million
● Biofertiliser for 29,000 ha of peri-urban cropland
● USD 13.3 million in soil organic matter
● 136,800 CO2 emissions reduction, worth USD 15.5 million in greenhouse gas savings
Note: The regenerative peri-urban agriculture scenario’s benefits are equal for both Porto and the Metropolitan Area since the area converted for the benefits estimation is equal.
79 All benefits are calculations by Ellen MacArthur Foundation, see Cities Appendix for further details. The benefits estimated here are for the Municipality of Porto 80 Ibid.
19
CITIES AND CIRCULAR ECONOMY FOR FOOD • PORTO, PORTUGAL
NOTE ABOUT THIS PORTO CITY STORY AND THE FULL REPORT The Cities and Circular Economy for Food (2019) report was designed to initiate a deeper exploration of the role that cities, and the businesses and governments in them, can have in the creation of a circular economy for food. It acknowledges cities as only one key driver of change among many others. It advocates the circular economy as one of several approaches that can support the development of a healthier and regenerative food system. The focus city chapters were developed to demonstrate how cities around the world could benefit from applying the vision set forth in the report. The conclusions draw on an extensive analysis of the current regional food system, and benefit calculations are based on estimated global benefit factors applied to the local context. See City Analysis Guide for further details on the research process and factors used to calculate the estimated benefits. The authors of this city chapter collected information from a number of articles, publications, and reports, and consulted more than 20 experts during its preparation. However, uncertainties remain within the document as the scientific understanding of the various components of a circular economy for food supply continues to evolve. The document does not intend to provide diet recommendations or advice on food consumption, although it does highlight the role that food system players have in offering healthy foods with positive environmental impacts.
DISCLAIMER The Porto city story has been produced by a team from the Ellen MacArthur Foundation. The city benefit calculations use global factors supplied by SYSTEMIQ as part of the global Cities and Circular Economy for Food report analysis. Those were applied to the local context in order to estimate the potential benefits for Porto in transitioning to a circular economy for food model. The Ellen MacArthur Foundation makes no representations and provides no warranties in relation to any aspect of the city story including regarding the advisability of investing in any particular company or investment fund or other vehicle. Whilst care and attention has been exercised in the preparation of the city story and its analyses, relying on data and information believed to be reliable, neither the Foundation nor any of its employees or appointees shall be liable for any claims or losses of any nature in connection with information contained in this document, including, but not limited to, lost profits or punitive or consequential damages. The Ellen MacArthur Foundation would like to thank the organisations who contributed to the Porto city story (see following pages) for their constructive input. Contribution to the the city story, or any part of it, should not necessarily be deemed to indicate any kind of partnership or agency between the contributors and the Ellen MacArthur Foundation, nor an endorsement of its conclusions or recommendations. © Ellen MacArthur Foundation 2019 The full Cities and Circular Economy for Food report and Porto city story can be found at: https://www.ellenmacarthurfoundation.org/our-work/activities/cities-and-circular-economy-for-food To quote the Porto city story, please use the following reference: Ellen MacArthur Foundation, Cities and Circular Economy for Food: Porto (2019).
20
CITIES AND CIRCULAR ECONOMY FOR FOOD • PORTO, PORTUGAL
ACKNOWLEDGEMENTS We are very grateful for the support we have received in producing this focus city story. Special thanks go to our Advisory Board, our local participant organisations for their active involvement, and also to the many academic, industry, NGO, and government agency experts who provided invaluable perspectives.
LEAD PARTNER
CORE PARTNERS
PHILANTHROPIC PARTNERS
KNOWLEDGE PARTNER
CORE PROJECT TEAM
ELLEN MACARTHUR FOUNDATION Andrew Morlet , Chief Executive Rob Opsomer , Systemic Initiatives Lead Clementine Schouteden , Project Lead Emma Chow , Project Manager Nick Jeffries , Case Study Programme Manager Luisa Santiago , Brazil Lead Del Hudson , North America Lead Aurélien Susnjara , Research Analyst Camille Gillet , Research Analyst Marco Meloni , Research Analyst, Lead Author Victoria Almeida, Brazil Associate
SYSTEMIQ Martin Stuchtey , Managing Partner Jaap Strengers , Senior Associate Lauren Boutillier , Associate Tilmann Vahle , Associate Florian Fesch , Intern Lisa Griebel , Intern Mayra Buschle , Working Student
21
CITIES AND CIRCULAR ECONOMY FOR FOOD • PORTO, PORTUGAL
PORTO CONTRIBUTORS
ALIADOS - THE CHALLENGES CONSULTING Vasco Sousa , Co-founder & Managing Partner LIPOR - INTERMUNICIPAL WASTE MANAGEMENT OF GREATER PORTO, PORTUGAL Susana Lopes , Senior Technician, Environmental Engineer
MUNICIPALITY OF PORTO, DEPARTMENT OF ENVIRONMENTAL PLANNING AND MANAGEMENT Sara Velho , Senior Technician Nuno Morais , Senior Technician Pedro Pombeiro , Head of Department SONAE MC Pedro Lago , Director: Sustainability and Circular Economy
FURTHER CONTRIBUTORS
ELLEN MACARTHUR FOUNDATION Ian Banks , Editorial Lead Joe Iles , Editor Jocelyn Bleriot , Executive Officer; Head, International Institutions & Governments Clementine d’Orion , Network Manager Sarah Churchill-Slough , Design and Branding Manager Ross Findon , Media and Social Media Manager, Systemic Initiatives Katie Schuster , Communications Executive, Systemic Initiatives Alix Bluhm , Communications Manager, Systemic Initiatives Sebastian Egerton-Read , Social Media Manager Vicky Deegan , Digital Project Manager
CONKER HOUSE PUBLISHING Jo de Vries, Editor Emma Parkin, Editor ADVISORY BOARD CALOUSTE GULBENKIAN FOUNDATION Catarina Grilo, Manager, Sustainability Program Luis Lobo Xavier, Director, Sustainability Program
DANONE Merijn Dols, Senior Director of Business Processes, Open Innovation & Cycles INTESA SANPAOLO AND INTESA SANPAOLO INNOVATION CENTER Massimiano Tellini, Global Head - Circular Economy Luigi Riccardo, Innovation Specialist - Circular Economy
PEOPLE’S POSTCODE LOTTERY Will Humpington, Climate Change & Environmental Programmes Advisor
PORTICUS Federico Bellone, Regional Director for Latin America
SUEZ Henry Saint-Bris, Senior Advisor
TETRA PAK Mario Abreu, Vice President - Sustainability Sabine von Wirén-Lehr, Director Public Affairs
THE FINNISH INNOVATION FUND SITRA Hanna Mattila, Specialist, Circular Economy
VEOLIA Gary Crawford, Vice President - International Affairs
22

CITIES AND CIRCULAR ECONOMY FOR FOOD • PORTO, PORTUGAL
PROJECT MAINSTREAM BOARD
AVERDA Malek Sukkar , Chief Executive Officer
DSM Feike Sijbesma , Chief Executive Officer
PHILIPS Frans van Houten , Chief Executive Officer
SUEZ Jean-Louis Chaussade , Chief Executive Officer VEOLIA Antoine Frérot , Chief Executive Officer
WORLD ECONOMIC FORUM
Sean de Cleene , Head, Food System Initiative Antonia Gawel , Head, Circular Economy Initiative
ABOUT THE ELLEN MACARTHUR FOUNDATION
CORE PHILANTHROPIC FUNDERS
GLOBAL PARTNERS
The Ellen MacArthur Foundation was launched in 2010 with the aim of accelerating the transition to the circular economy. Since its creation, the charity has emerged as a global thought leader, putting the circular economy on the agenda of decision-makers around the world. The charity’s work focuses on seven key areas: insight and analysis; business; institutions, governments, and cities; systemic initiatives; circular design; learning; and communications. Further information: ellenmacarthurfoundation.org • @circulareconomy
23

CITIES AND CIRCULAR ECONOMY FOR FOOD • PORTO, PORTUGAL
IMAGE CREDITS In order of appearance: PORTO: © JOYT, ADOBESTOCK.COM LEMON: © GREY, ADOBESTOCK.COM ROSEMARY: © MARGO555, ADOBESTOCK.COM SUSHI: © VANKAD, ADOBESTOCK.COM FISH: © TIMUR1970, ADOBESTOCK.COM PINEAPPLE: © EMIL BIZYAEV, ADOBESTOCK.COM AVOCADO: © ND700, ADOBESTOCK.COM
24


![Ricoh: Manufacturing in the Circular Economy - Base Cities Birmingham - April 2013]](https://img.dokumen.tips/doc/110x75/54bee83f4a795944718b45c0/ricoh-manufacturing-in-the-circular-economy-base-cities-birmingham-april-2013.jpg)


