Embed Size (px)
Citation preview

This journal is c the Owner Societies 2012 Phys. Chem. Chem. Phys., 2012, 14, 7441–7447 7441
Cite this: Phys. Chem. Chem. Phys., 2012, 14, 7441–7447
Bridging QTAIM with vibrational spectroscopy: the energy of
intramolecular hydrogen bonds in DNA-related biomoleculesw
Tymofii Yu. Nikolaienko,*aLeonid A. Bulavin
aand Dmytro M. Hovorun*
bcd
Received 17th January 2012, Accepted 3rd April 2012
DOI: 10.1039/c2cp40176b
Physical properties of over 8000 intramolecular hydrogen bonds (iHBs), including 2901 ones of the
types OH� � �O, OH� � �N, NH� � �O and OH� � �C, in 4244 conformers of the DNA-related molecules
(four canonical 20-deoxyribonucleotides, 1,2-dideoxyribose-5-phosphate, and 2-deoxy-D-ribose in its
furanose, pyranose and linear forms) have been investigated using quantum theory of atoms in
molecules (QTAIM) and vibrational analysis. It has been found that for all iHBs with positive red-shift
of the proton donating group stretching frequency the shift value correlates with rcp—the electron
charge density at the (3,�1)-type bond critical point. Combining QTAIM and spectroscopic data new
relationships for estimation of OH� � �O, OH� � �N, NH� � �O and OH� � �C iHB enthalpy of formation
(kcal mol�1) with RMS error below 0.8 kcal mol�1 have been established: EOH� � �O = �3.09 + 239�rcp,EOH� � �N = 1.72 + 142�rcp, ENH� � �O = �2.03 + 225�rcp, EOH� � �C = �0.29 + 288�rcp, where rcp is in
e a0�3 (a0 – the Bohr radius). It has been shown that XH� � �Y iHBs with red-shift values over 40 cm�1
are characterized by the following minimal values of the XHY angle, rcp and r2rcp: 1121, 0.005 e a0�3
and 0.016 e a0�5, respectively. New relationships have been used to reveal the strongest iHBs in
canonical 20-deoxy- and ribonucleosides and the O50H� � �N3 H-bond in ribonucleoside guanosine was
found to have the maximum energy (8.1 kcal mol�1).
Introduction
Hydrogen bonds are believed to be the most universal of non-
covalent interactions controlling the spatial structure of biological
molecules and their assemblies. Both inter- and intramolecular
hydrogen bonds (H-bonds) play a crucial role in controlling the
structure of biological molecules as well as their functions.1–5 The
most illustrative examples include pairing of nitrogenous base in
the DNA double helix, stabilization of protein secondary
structure, DNA–protein complex formation6 and various
anomalies in physical properties of water.7,8 This type of non-
covalent interactions is also known to be important in the fields
of materials science,9,10 solid state chemistry11,12 and theory of
ionic liquids.13 Therefore, despite a century of tremendous
research activity in this field,14 the nature of H-bonds is still
being studied vigorously.2,15–18
Various theoretical and experimental techniques are routinely
used to probe H-bonds.15,16 However, there are just a few ways
to estimate H-bond strength quantitatively: use of spectroscopic
manifestations of H-bond formation such as red-shift of XH
stretching vibration frequency or increase in IR intensity;19
estimation of complex dissociation energy with modern vibra-
tional predissociation spectroscopy,20 temperature-dependent
field ionization mass spectrometry21 or calorimetry;22–24
investigation of variations in molecules magnetic properties,25
wavefunction-based26 and/or solvation-related27,28 descriptors
or electron density topology;29–31 or theoretical calculation of
complex stabilization energy (SE) with ab initio techniques.16
Although experimental methods are quite reliable for simple
molecular dimers (like water, ammonia etc.), it is not straight-
forward to use them for investigation of complexation of
conformationally flexible molecules, since neither parti-
cular conformation of molecules, nor general structure of a
complex is known for sure. The same limitations hold true
also for small and ‘rigid’ molecules if their large-sized clusters
aMolecular Physics Department, Faculty of Physics,Taras Shevchenko National University of Kyiv, 4 Hlushkova ave.,03022 Kyiv, Ukraine. E-mail: [email protected];Fax: +38 0974524557; Tel: +38 0974524557
bDepartment of Molecular and Quantum Biophysics,Institute of Molecular Biology and Genetics of National Academy ofSciences of Ukraine, 150 Zabolotnoho Str., 03680 Kyiv, Ukraine.E-mail: [email protected]; Fax: +38 0445262014;Tel: +38 0445262014
c Research and Educational Center ‘‘State Key Laboratory ofMolecular and Cell Biology’’, 150 Zabolotnoho Str., 03680 Kyiv,Ukraine
dDepartment of Molecular Biology, Biotechnology and Biophysics,Institute of High Technologies, Taras Shevchenko NationalUniversity of Kyiv, 2 Hlushkova Ave., 03127 Kyiv, Ukraine
w Electronic supplementary information (ESI) available: Fig. SF1 presentsinitial correlations between proton donation group stretching vibrationfrequency red-shift and electron charge density at the bond critical point;Table S1 contains the structure of the (3S,4R)-3,4,5-trihydroxypentanalconformer exhibiting a maximum red-shift of the ‘free’ hydroxyl group;details of conformational parameters of canonical ribonucleosideconformers having the strongest H-bonds are given in Table S2.See DOI: 10.1039/c2cp40176b
PCCP Dynamic Article Links
www.rsc.org/pccp PAPER

7442 Phys. Chem. Chem. Phys., 2012, 14, 7441–7447 This journal is c the Owner Societies 2012
are of interest: water clusters (H2O)n with n > 6 with their
structural variability32 can serve as an illustrative example.
Among others, the quantum theory of atoms in molecules
(QTAIM) approach29 is, perhaps, the most universal tool to
characterize H-bonds33,34 since it operates on electron density, an
experimentally measurable quantity.35–38 However, in its original
form QTAIM gives no recipe how to connect electron density-
derived properties with H-bond strength. To do it, one may use
empirically derived complex parameters (such as Grabowski
parameter,15,39 for example) or try to estimate H-bond dissociation
energy. The latter became possible with the paper of Espinosa
et al.,40 establishing the relationship between the H-bond
dissociation energy De and the virial density Vel in the form of
De = ca03Vel(
-rcp), (1)
where a0 is the Bohr radius and c is the dimensionless
proportionality constant, so that ca03 represents a kind of
the ‘effective volume’. In its original form of (1)40 the value
c = 1/2 has been proposed. Despite being very popular (see,
e.g., references in ref. 41), the relationship (1) has several
shortcomings. It deals with the virial density, which cannot
be measured in experiment directly, so in order to use it in
practice one has to employ an additional interrelationship
between Vel and electron charge density.38 Furthermore, the
relationship (1) is based on the data from X-ray diffraction
experiments, in which the question of possibility of distin-
guishing the bonding from simple overlapping of electron
clouds of neighboring atoms remains controversial.42,43 Moreover,
the formula (1) was obtained for XH� � �O (X=C,N, O)H-bonds
assuming that their energy depends univocally and solely on
the H� � �O distance, which is not always true.44 Another issue
arises from the fact that in the case of non-H� � �O H-bonds the
formula (1) with the c = 1/2 coefficient is known to over-
estimate binding energy. In particular, for H� � �F bonds the
smaller value of c (c = 0.31) was obtained as the best fit,41
making it ‘safe’ to use (1) for weak interactions only.41
At the same time, there is another way to extract binding energy
from QTAIM analysis results since there is evidence7,15,41,45–49
that the electron charge density rcp at the BCP (bond critical
point, i.e., (3,�1)-type electron charge gradient field critical
point lying on the bond path corresponding to the H-bond)
can also serve as the measure of H-bond strength. On this
ground the following relationships connecting intermolecular
complex stabilization energy SE (kcal mol�1) with electron
charge density rcp (a.u., 1 a.u.= e a0�3, where e is the elementary
charge and a0 is the Bohr radius) have been proposed:
SE ¼Xi
Ei; ð2Þ
Ei = Arcpi + B, (3)
where summation goes over all bonds connecting molecules
and index i enumerates bond critical points on the intermolecular
bond paths;A and B coefficient values are summarized in Table 1.
Several serious limitations on existing relationships in the
form of (2) and (3) should be stressed. First of all, in all the
studies mentioned the complex stabilization energy has been
assumed to equate the sum of H-bond energies (eqn (2)),
which is doubtful (e.g., guanine–cytosine pair of nitrogenous
DNA bases is one of the most striking examples of a system,
where the stabilization energy markedly exceeds the sum of
H-bond energies25). Moreover, the complex stabilization
energy itself has been evaluated on the basis of theoretical
calculations by means of rather low level computations (except
for ref. 45 and 46 and, in part, ref. 7) and was hardly checked
experimentally. Second, the regression coefficient values
reported by different studies differ substantially (in about
3 times, see Table 1), making it difficult to use regression (3)
for practical estimations. The absence of sufficiently large data
samplings could also be mentioned. Third, only intermolecular
H-bonds have been considered. Thus, no reliable data for
estimating intramolecular H-bonds energy with (3) are avail-
able to date.
At the same time, another powerful, but unfairly rarely used
in quantum chemistry tool for identification of H-bonds
as well as for estimation of their strength is vibrational
spectroscopy.19 Nevertheless, a red-shift of H-bond donor
group stretching vibration frequency is, along with QTAIM
bond path presence, one of well-accepted criteria for H-bond
formation.50 Since modern quantum chemical calculations are
capable of reproducing experimental vibrational frequencies
with the high accuracy (typical RMS deviations of scaled
harmonic vs. experimentally observed frequencies are less than
40 cm�1 51), calculated vibrational spectra can be considered as
a reliable and, which is also important, independent way to
evaluate properties of individual H-bonds. In addition, this
way is not limited to probing intermolecular bonds only.
Therefore, the purpose of the present study is to shed some
light on the intramolecular H-bond strength evaluation problem
Table 1 Coefficients of linear regression (3) connecting complex stabilization energy (SE, kcal mol�1) and electron charge density at the bondcritical point (rcp, e/a30)
Model system (the level of theory in parentheses) Ref.
Coefficients
A/kcal mol�1 (a.u.)�1 SB/kcal mol�1
(HF)n clusters with n = 2, . . ., 8 (DFT B3LYP/6-31++G(d,p)) 46 98.0 2.7HF� � �HR (R = H, Li, Al, Cl, CCH) complexes under external electric fieldsparallel to the H� � �F interaction (MP2/6-311++G (d,p))
41 300 �0.6
Water molecule clusters, (H2O)n, n = 2, . . ., 6 (HF/aug-cc-pVTZ) 7 175 0.3Water molecule clusters, (H2O)n, n = 2, . . ., 20 (HF/6-31(d, p)) 47 263.5 0Phenol–water clusters (HF/6-31G*) 48 212.6 0Various canonical and noncanonical DNA base pairs (MP2/6-31G*(0.25)) 49 315.6 �2.728 different intermolecular H-bonded and van der Waals complexes (MP2/aug-cc-pVDZ) 45 356 �2.294 different H-bonded complexes: water clusters, phenol–water clusters, ionic water clusters,DNA base pairs, etc. (various)
15 268 0

This journal is c the Owner Societies 2012 Phys. Chem. Chem. Phys., 2012, 14, 7441–7447 7443
by using large samplings of electron density QTAIM analysis
data in conjunction with vibrational spectroscopy data obtained
by ab initio calculations.
Computational details
The following biologically relevant DNA-related molecules
(Fig. 1) have been chosen to obtain (nXH, EHB) data set:
canonical 20-deoxyribonucleotides (613 conformations of
50-deoxycytidylic,52 660 conformations of 50-thymidylic,53
726 conformations of 50-deoxyadenylic54 and 745 conforma-
tions of 50-deoxyguanylic55 acids) and their model structural
units: 1,2-dideoxyribose-5-phosphate56 (472 conformations),
2-deoxy-D-ribofuranose57 (94 conformations of the a-anomer
and 107 conformations of the b-anomer), 2-deoxy-D-ribopyranose58
(74 conformations of the a-anomer and 83 conformations
of the b-anomer) and (3S,4R)-3,4,5-trihydroxypentanal, the
linear (aldehydo) form of 2-deoxy-D-ribose59 (670 conforma-
tions). Complete conformational families of these molecules have
been obtained previously52–59 using the DFT B3LYP/6-31G(d,p)
level of theory for geometry optimization, calculation of spatial
electron density distributions and harmonic frequencies. The
scaling factor of 0.96160 has been used to scale all harmonic
vibrational frequencies, providing their RMS error with respect
to experimental values of about 35 cm�1.51
Large conformational capacity of the molecules under study
made it possible to reveal over 8000 intramolecular H-bonds in
4244 conformers in total (see the Results and discussion
section for details). Intramolecular H-bonds in each confor-
mer have been detected by means of QTAIM electron density
topology analysis using the AimAll software package.61 The
existence of the bond path between two atoms (one and only
one of which is hydrogen) containing the (3,�1) critical pointwas considered as a necessary and sufficient condition to treat
the pair of atoms as bonded. Among all H-bonds found in
this way only H-bonds of OH� � �O, OH� � �N, NH� � �O and
OH� � �C types have been selected for further analysis since
others, ‘nonconventional’ (i.e., CH� � �X) bonds, are difficult to
handle with spectroscopic methods.62
Normal vibrations responsible for a given XH proton
donating group stretching have been identified by analytical
calculation of the derivative cXHj = @lXH/@xj of the XH bond
length lXH with respect to the j-th normal coordinate xj and
comparing it with the fixed threshold value (cth = 0.92).64
H-bond formation enthalpy (referred to simply as ‘H-bond
energy’ hereinafter) has been estimated with Iogansen’s
relationship19,63
EHB kcalmol�1� �
¼ 0:33ffiffiffiffiffiffiffiffiffiffiffiffiffiffiffiffiffiffiffiffiffiffiffiffiffiffiffiffiffiffiffiDn cm�1½ � � 40
q; ð4Þ
where Dn= nfreeXH � nbondedXH represents the red-shift value of the
nXH frequency caused by H-bond formation with XH group
being the proton donor. To obtain the value of nfreeXH each
molecule as well as each XH group within it have been
analyzed independently; nfreeXH has been calculated as the simple
average of stretching vibration frequencies for XH groups
such that: (i) their H atom does not participate in any XH� � �Ybonding (i.e., no QTAIM bond path ends on it except for the
one corresponding to the XH covalent bond), and (ii) unique
normal vibration exists with cXHj > cth. The RMS deviation of
nfreeXH obtained in this way falls within the (6.0–28.0) cm�1 range
which is lower than both scaled harmonic frequencies error
(about 35 cm�1 51) and the ‘lowest possible’ red-shift value
allowed by (4) (i.e., 40 cm�1). For NH� � �Y bonds vibrational
spectra obtained after non-H-bonded H-atom deuteration
have been used to split degeneracy of vibrations of the dGMP
–NH2 group being the proton donor in all NH� � �O bonds
analyzed. In this case the scaled average nfreeXH value was 3505 cm�1
with RMS deviation of only 1.7 cm�1.
Using H-bonds energy obtained by (4) linear regression
coefficients in eqn (3) have been determined by a standard
least-squares fitting procedure for each of four H-bond types
independently. XH� � �Y bonds where the XH group participates
Fig. 1 Biomolecules under study: canonical 20-deoxyribonucleotides (50-deoxycytidylic (dCMP), 50-thymidylic (TMP), 50-deoxyadenylic (dAMP)
and 50-deoxyguanylic (dGMP) acids), 1,2-dideoxyribose-5-phosphate (12DR5P), 2-deoxy-D-ribose in linear (2DRL), furanose (a-(2DRFa) andb-(2DRFb) anomers) and pyranose (a-(2DRPa) and b-(2DRPb) anomers) forms.

7444 Phys. Chem. Chem. Phys., 2012, 14, 7441–7447 This journal is c the Owner Societies 2012
in more than one H-bond simultaneously (bifurcating H-bond)
have been excluded (8 H-bonds in total).
Results and discussion
In total as many as 2901 conventional H-bonds (2331 OH� � �O,
297 OH� � �N, 184 NH� � �O and 89 OH� � �C) have been identified
in 4424 conformations on the basis of QTAIM electron charge
density analysis. Among them, there are 2796 conventional
H-bonds having well-established normal vibration corresponding
to proton donor group stretching. All but 4 H-bonds are
characterized by a red-shift, while only 88% (2457 bonds)
have had its value of 40 cm�1 or above—the reasonable
threshold value in the sense that this minimal shift value is
needed by eqn (4). H-bonds with DnXH Z 40 cm�1 will be
referred to as ‘well-red-shifted H-bonds’ hereinafter. Next,
bifurcating H-bonds (i.e., with more than one proton acceptor
bonded to a given proton donor) have been excluded so that
the final data sampling contained 2449 H-bonds.
It should be mentioned, however, that 127 OH-groups have
been detected (about 4% as compared to a total number of
conventional H-bonds) with red-shift values over 40 cm�1, but
for which no bonding path indicating the presence of H-bonds
has been found with QTAIM. The maximum red-shift value
for such ‘free’ OH group was found to be 78 cm�1 and found
in the 2DRL molecule (the structure of the corresponding
conformer is available, see the ESIw).Table 2 contains the total number of bonds of each type as
well as minimum and maximum values of their geometrical
parameters and physical properties of bond critical points.
Fig. 2 outlines the distribution of H-bonds geometrical properties
in the ‘distance–angle’ frame.
It is noteworthy that no H-bonds with the XHY angle
below 1121 were found among well-red-shifted conventional
H-bonds. This agrees well with a generally accepted lower
threshold of 1101.18 Another important finding is that no
well-red-shifted H-bond has its rcp value below 0.005 e a0�3
and r2rcp below 0.016 e a0�5 (see Table 2), which is also in
good agreement with the values recommended by Koch and
Popelier criteria65,66 and molecular crystal analysis by Munshi
and Guru Row.67
As can be seen from Fig. 2 and Table 2, all the OH� � �CH-bonds investigated are slightly ‘longer’ than the others: the
average value of O–C distance is 3.36 A with standard devia-
tion (SD) of 0.13 A while corresponding X–Y distances for
other H-bond types are 2.99 A (SD = 0.12 A) for NH� � �O,
2.77 A (SD = 0.08 A) for OH� � �O and 2.82 A (SD = 0.14 A)
for OH� � �N. For OH� � �Y bonds there is a clear trend for the
Table 2 Ranges of geometrical parameters and bond critical pointphysical properties for well-red-shifted hydrogen bondsa
H-bondNo. ofbonds
GeometrybBond critical pointpropertiesc
LXY/A +XHY/1rcp,10�2 a.u.
r2rcp,10�2 a.u.
min max min max min max min max
OH� � �O 1949 2.581 3.089 112.7 177.5 1.18 4.96 4.14 15.8OH� � �N 269 2.589 3.173 122.0 178.3 0.88 7.64 3.27 11.7NH� � �O 150 2.828 3.489 129.7 178.4 0.61 3.58 2.39 10.2OH� � �C 81 3.125 3.780 129.3 179.0 0.49 1.49 1.64 3.80
a ‘Well-red-shifted’ are hydrogen bonds with the donor group stretching
vibration frequency red-shift value of 40 cm�1 or above. b LXY denotes
the distance between the nuclei of ‘heavy’ atoms X and Y and+XHY is
the angle between lines X–H and H–Y. c rcp and r2rcp are electron
charge density and its laplacian values calculated at the bond critical
point; one atomic unit (a.u.) corresponds to e/a30 for electron density
and to e/a50 for its laplacian, e is elementary charge, a0 E 0.529 A is the
Bohr radius.
Fig. 2 Geometrical parameters distribution of well-red-shifted intra-
molecular hydrogen bonds (XH� � �Y) found in biomolecules under study.
Fig. 3 Hydrogen bond energy (EHB) plotted vs. electron charge density
(rcp) in the bond critical point for well-red-shifted intramolecular
hydrogen bonds found in biomolecules under study.
Table 3 Linear fit parameter values for linear relation EHB=Arcp + Bbetween the HB energy EHB (kcal mol�1) and the electron charge densityvalue rcp (e/a30) at the bond critical pointa
H-bondA/kcal mol�1
(e a0�3)�1 B/kcal mol�1
Correlationcoefficient, R
Standarddeviation,sE/kcal mol�1
OH� � �O 239 � 2.2 �3.09 � 0.07 0.93 0.69OH� � �N 142 � 2.1 1.72 � 0.08 0.97 0.50NH� � �O 225 � 12 �2.03 � 0.25 0.85 0.76OH� � �C 288 � 19 �0.29 � 0.22 0.86 0.35
a Estimates for the parameter standard deviations are given after ‘‘�’’ sign.
This journal is c the Owner Societies 2012 Phys. Chem. Chem. Phys., 2012, 14, 7441–7447 7445
average O–Y distance: the bigger the van-der-Waals radii68 of
Y (1.71 A for C, 1.50 A for N and 1.29 A for O), the bigger this
distance is.
Fig. 3 displays correlation between the electron charge
density at the bond critical point rcp and H-bond energies
EHB (and hence the red-shift values) obtained by eqn (4) along
with the corresponding linear regressions (shownwith dotted lines).
Peculiar properties of OH� � �C H-bonds can also be seen here
since their maximum energy is just EmaxHB = 4.0 kcal mol�1,
which is small as compared to others (EmaxHB = 5.6 kcal mol�1
for NH� � �O, 7.9 kcal mol�1 for OH� � �O and 11.8 kcal mol�1
for OH� � �N). Relatively large spread of points in the low
H-bond energy region is due to the fact that in this region the
values of Dn are close to the typical RMS deviation of scaled
harmonic frequencies obtained ab initiowith respect to experimental
ones (about 35 cm�1 51). Table 3 outlines linear regression (3)
parameters for each of four H-bond types separately.
First of all we should note that regression coefficients differ
substantially (up to twice: A from 142 to 288, B from �3.1to 1.7) depending on the bond type. This makes it clear why
the linear regression coefficient values reported for intermolecular
H-bonded complexes previously (see Table 1) differ so much.
As an additional justification we have performed linear approxi-
mation of the whole (rcp, EHB) dataset making no distinction by
the bond type. This resulted in coefficient values A = 200 � 2.2
and B=�1.70� 0.07 with correlation coefficient R=0.88 and
standard deviation sE = 1.0 kcal mol�1 much higher than those
for individual bonds (see Table 3).
Finally, it might be interesting to verify regressions obtained
in this work for intermolecular complexes. Since the number of
OH� � �O bonds analyzed is the highest it seems to be reasonable
to use this case for testing. According to data in Table 3 the
corresponding linear regression would be
EOH� � �O [kcal mol�1] = �3.09 + 239�rcp [a.u.]. (5)
For instance, in the case of water dimer optimized at the DFT
B3LYP/6-31G(d,p) level of theory the BSSE-correction accounted
rcp value at the OH� � �O H-bond critical point is 0.026 a.u. hence
(5) gives EHB = 3.1 kcal mol�1, which is in excellent agreement
with the stabilizing enthalpy (3.2 � 0.1 kcal mol�1) with
thermal corrections at 373 K obtained theoretically69 and with
the experimental binding enthalpy of 3.15 � 0.03 kcal mol�1.20
In contrast to our results, Espinosa–Molins–Lecomte’s eqn (1)
gives 6.25 kcal mol�1 (the virial density at the bond critical
point is Vel = 0.020 a.u.) if c = 1/2 is taken. Considering
thermal correction to be 3kBTE 1.75 kcal mol�1 this gives the
enthalpy of DHEML = 4.50 kcal mol�1 being about 30%
higher than its real value, while with c = 0.31 DHEML =
2.12 kcal mol�1, about 30% lower than the real value.
We believe that the discrepancies between real bond energies
and energies calculated by means of the Espinosa–Molins–
Lecomte equation originate from the fact that the latter has
been parametrized using H-bonds data for the substance in
crystalline state effectively strengthening H-bonds.70
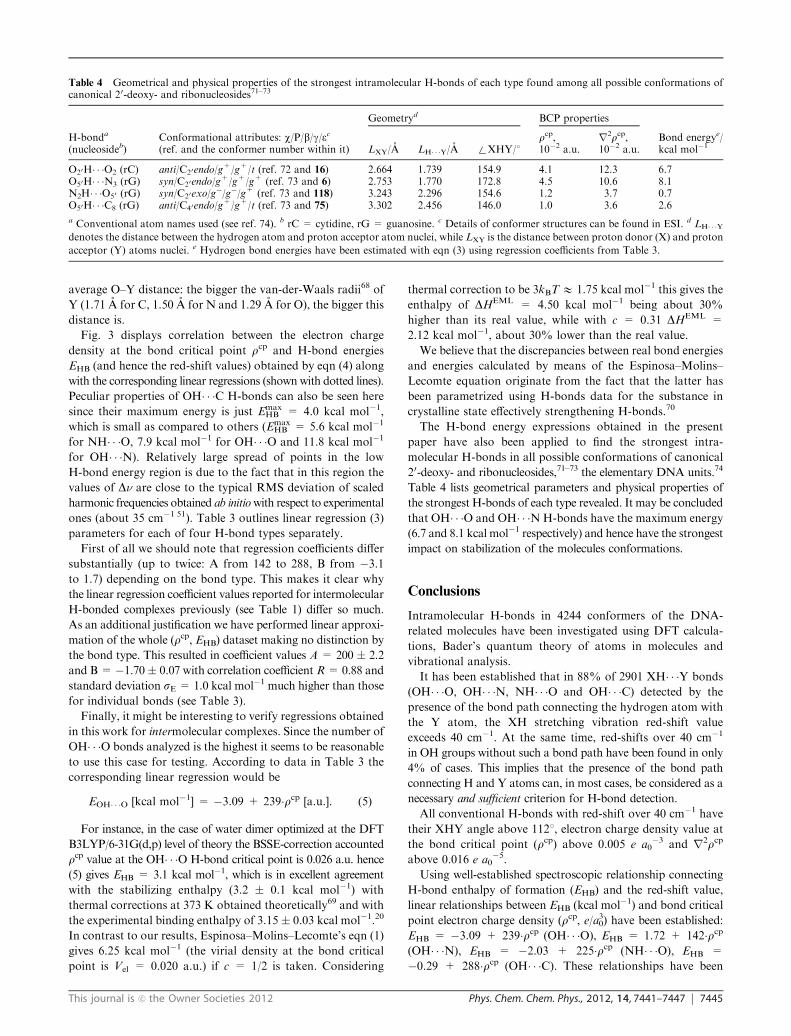
The H-bond energy expressions obtained in the present
paper have also been applied to find the strongest intra-
molecular H-bonds in all possible conformations of canonical
20-deoxy- and ribonucleosides,71–73 the elementary DNA units.74
Table 4 lists geometrical parameters and physical properties of
the strongest H-bonds of each type revealed. It may be concluded
that OH� � �O and OH� � �NH-bonds have the maximum energy
(6.7 and 8.1 kcal mol�1 respectively) and hence have the strongest
impact on stabilization of the molecules conformations.
Conclusions
Intramolecular H-bonds in 4244 conformers of the DNA-
related molecules have been investigated using DFT calcula-
tions, Bader’s quantum theory of atoms in molecules and
vibrational analysis.
It has been established that in 88% of 2901 XH� � �Y bonds
(OH� � �O, OH� � �N, NH� � �O and OH� � �C) detected by the
presence of the bond path connecting the hydrogen atom with
the Y atom, the XH stretching vibration red-shift value
exceeds 40 cm�1. At the same time, red-shifts over 40 cm�1
in OH groups without such a bond path have been found in only
4% of cases. This implies that the presence of the bond path
connecting H and Y atoms can, in most cases, be considered as a
necessary and sufficient criterion for H-bond detection.
All conventional H-bonds with red-shift over 40 cm�1 have
their XHY angle above 1121, electron charge density value at
the bond critical point (rcp) above 0.005 e a0�3 and r2rcp
above 0.016 e a0�5.
Using well-established spectroscopic relationship connecting
H-bond enthalpy of formation (EHB) and the red-shift value,
linear relationships between EHB (kcal mol�1) and bond critical
point electron charge density (rcp, e/a30) have been established:
EHB = �3.09 + 239�rcp (OH� � �O), EHB = 1.72 + 142�rcp(OH� � �N), EHB = �2.03 + 225�rcp (NH� � �O), EHB =
�0.29 + 288�rcp (OH� � �C). These relationships have been
Table 4 Geometrical and physical properties of the strongest intramolecular H-bonds of each type found among all possible conformations ofcanonical 20-deoxy- and ribonucleosides71–73
H-bonda
(nucleosideb)Conformational attributes: w/P/b/g/ec
(ref. and the conformer number within it)
Geometryd BCP properties
Bond energye/kcal mol�1LXY/A LH� � �Y/A +XHY/1
rcp,10�2 a.u.
r2rcp,10�2 a.u.
O20H� � �O2 (rC) anti/C20endo/g+/g+/t (ref. 72 and 16) 2.664 1.739 154.9 4.1 12.3 6.7
O50H� � �N3 (rG) syn/C20endo/g+/g+/g+ (ref. 73 and 6) 2.753 1.770 172.8 4.5 10.6 8.1
N2H� � �O50 (rG) syn/C20exo/g�/g�/g+ (ref. 73 and 118) 3.243 2.296 154.6 1.2 3.7 0.7
O50H� � �C8 (rG) anti/C40endo/g+/g+/t (ref. 73 and 75) 3.302 2.456 146.0 1.0 3.6 2.6
a Conventional atom names used (see ref. 74). b rC = cytidine, rG = guanosine. c Details of conformer structures can be found in ESI. d LH� � �Ydenotes the distance between the hydrogen atom and proton acceptor atom nuclei, while LXY is the distance between proton donor (X) and proton
acceptor (Y) atoms nuclei. e Hydrogen bond energies have been estimated with eqn (3) using regression coefficients from Table 3.

7446 Phys. Chem. Chem. Phys., 2012, 14, 7441–7447 This journal is c the Owner Societies 2012
used to reveal the strongest intramolecular H-bonds in canonical
20-deoxy- and ribonucleosides and the O50H� � �N3 H-bond in
ribonucleoside guanosine was found to have the maximum
energy (8.1 kcal mol�1).
Acknowledgements
The authors highly appreciate the access to high-performance
computational resources and software provided by the Boholubov
Institute for Theoretical Physics of National Academy of Sciences
of Ukraine. We also encourage the kind help of Dr Yevgen P.
Yurenko in article preparation and Dr Roman O. Zhurakivsky
for nucleoside database processing.
Notes and references
1 G. A. Jeffrey and W. Saenger, Hydrogen Bonding in BiologicalStructures, Springer-Verlag, 1991.
2 K. E. Riley and P. Hobza,Wiley Interdiscip. Rev.: Comput. Mol. Sci.,2011, 1, 3.
3 A. Senes, I. Ubarretxena-Belandia and D. M. Engelman, Proc. Natl.Acad. Sci. U. S. A., 2001, 98, 9056.
4 Y. P. Yurenko, R. O. Zhurakivsky, S. P. Samijlenko and D. M.Hovorun, J. Biomol. Struct. Dyn., 2011, 29(1), 51; Y. P. Yurenko,R. O. Zhurakivsky, M. Ghomi, S. P. Samijlenko and D. M. Hovorun,J. Phys. Chem. B, 2007, 111(32), 9655; Y. P. Yurenko, R. O.Zhurakivsky, M. Ghomi, S. P. Samijlenko and D. M. Hovorun,J. Phys. Chem. B, 2007, 111(22), 6263; O. I. Bolsunova, O. O.Brovarets’, D. M. Hovorun, L. A. Zaika and A. I. Potopalsky,Int. Rev. Biophys. Chem., 2011, 2(5), 159; O. O. Brovarets’ andD. M. Hovorun, Ukr. Biochem. J., 2010, 82(3), 55; O. O. Brovarets’and D. M. Hovorun, Ukr. Biochem. J., 2010, 82(5), 51; O. O.Brovarets’, R. O. Zhurakivsky and D. M. Hovorun, Biopolym. Cell,2010, 26(5), 398; O. O. Brovarets’, Ye. P. Yurenko, I. Ya. Dubey andD. M. Hovorun, J. Biomol. Struct. Dyn., 2012, 29(6), 597; S. P.Samijlenko, O. M. Krechkivska, D. A. Kosach and D. M. Hovorun,J. Mol. Struct., 2004, 708, 97; Ya. R. Mishchuk, A. L. Potyagaylo andD. M. Hovorun, J. Mol. Struct., 2000, 552, 283; S. P. Samijlenko, I. V.Alexeeva, L. H. Palchykivs’ka, I. V. Kondratyuk, A. V. Stepanyugin,A. S. Shalamay and D. M. Hovorun, J. Mol. Struct., 1999, 484, 31;S. P. Samijlenko, Y. P. Yurenko, A. V. Stepanyugin and D. M.Hovorun, J. Phys. Chem. B., 2010, 114, 1454; S. P. Samijlenko, I. V.Alexeeva, L. H. Palchykivs’ka, I. V. Kondratyuk, A. V. Stepanyugin,A. S. Shalamay and D. M. Hovorun, Spectrochim. Acta, Part A, 1999,55, 1133.
5 C. F. Matta, N. Castillo and R. J. Boyd, J. Phys. Chem. B, 2006,110, 563.
6 G. Desiraju and T. Steiner, The Weak Hydrogen Bond: In StructuralChemistry and Biology, Oxford University Press, 2001.
7 H. Lu, Y. Wang, Y. Wu, P. Yang, L. Li and S. Li, J. Chem. Phys.,2008, 129, 124512.
8 P. H. Poole, F. Sciortino, T. Grande, H. Eugene Stanley andC. Austen Angell, Phys. Rev. Lett., 1994, 73, 1632.
9 N. C. Seeman, Nature, 2003, 421, 427.10 F. C. Simmel and W. U. Dittmer, Small, 2005, 1, 284.11 T. Steiner, Angew. Chem., Int. Ed., 2002, 41, 48.12 M. Nishio, Y. Umezawa, K. Honda, S. Tsuboyama and H. Suezawa,
CrystEngComm, 2009, 11, 1757.13 K. Fumino, A. Wulf and R. Ludwig, Phys. Chem. Chem. Phys.,
2009, 11, 8790.14 G. Gilli and P. Gilli, The Nature of the Hydrogen Bond: Outline of
a Comprehensive Hydrogen Bond Theory (IUCr monographs oncrystallography; no. 23), Oxford University Press, 2009.
15 R. Parthasarathi and V. Subramanian, inHydrogen Bonding—NewInsights, ed. S. Grabowski, Springer, 2006, pp. 1–51.
16 K. Muller-Dethlefs and P. Hobza, Chem. Rev., 2000, 100, 143.17 B. Kojic-Prodic and K. Molcanov, Acta Chim. Slov., 2008, 55, 692.18 G. R. Desiraju, Angew. Chem., Int. Ed., 2011, 50, 52.19 A. V. Iogansen, Spectrochim. Acta, Part A, 1999, 55, 1585.20 B. E. Rocher-Casterline, L. C. Ch’ng, A. K. Mollner and
H. Reisler, J. Chem. Phys., 2011, 134, 211101.
21 L. F. Sukhodub, Chem. Rev., 1987, 87, 589.22 E. M. Arnett, L. Joris, E. Mitchell, T. S. S. R. Murty, T. M. Gorrie
and P. V. R. Schleyer, J. Am. Chem. Soc., 1970, 92, 2365.23 I. Jelesarov and H. R. Bosshard, J. Mol. Recognit., 1999, 12, 3.24 B. N. Solomonov, V. B. Novikov, M. A. Varfolomeev and
A. E. Klimovitskii, J. Phys. Org. Chem., 2005, 18, 1132.25 H. Fliegl, O. Lehtonen, D. Sundholm and V. R. I. Kaila, Phys.
Chem. Chem. Phys., 2011, 13, 434.26 K. Wendler, J. Thar, S. Zahn and B. Kirchner, J. Phys. Chem. A,
2010, 114, 9529.27 J. A. Platts, Phys. Chem. Chem. Phys., 2000, 2, 973.28 J. A. Platts, Phys. Chem. Chem. Phys., 2000, 2, 3115.29 R. F. W. Bader, Atoms in Molecules: A Quantum Theory, Oxford
University Press, 1990.30 O. A. Zhikol, O. Shishkin, K. A. Lyssenko and J. Leszczynski,
J. Chem. Phys., 2005, 122, 144104-1.31 C. F. Matta and J. Hernandez-Trujillo, J. Phys. Chem. A, 2003,
107, 7496; C. F. Matta and J. Hernandez-Trujillo, J. Phys. Chem. A,2005, 109, 10798.
32 P. Qian, W. Song, L. Lu and Z. Yang, Int. J. Quantum Chem.,2010, 110, 1923.
33 R. F. W. Bader, J. Phys. Chem. A, 1998, 102, 7314.34 The Quantum Theory of Atoms in Molecules From Solid State to
DNA and Drug Design, ed. C. F. Matta and R. J. Boyd, Wiley-VCHVerlag GmbH & Co., 2007.
35 T. S. Koritsanszky and P. Coppens, Chem. Rev., 2001, 101, 1583.36 V. Tsirelson and A. Stash, Acta Crystallogr., Sect. A: Cryst. Phys.,
Diffr., Theor. Gen. Crystallogr., 2004, 60, 418.37 A. Ranganathan, G. U. Kulkarni and C. N. R. Rao, J. Mol.
Struct., 2003, 656, 249.38 V. G. Tsirelson, Acta Crystallogr., Sect. B: Struct. Crystallogr.
Cryst. Chem., 2002, 58, 632.39 S. J. Grabowski, Chem. Phys. Lett., 2001, 338, 361.40 E. Espinosa, E. Molins and C. Lecomte, Chem. Phys. Lett., 1998,
285, 170.41 I. Mata, I. Alkorta, E. Espinosa and E. Molins, Chem. Phys. Lett.,
2011, 507, 185.42 M. A. Spackman, Chem. Phys. Lett., 1999, 301, 425.43 J. D. Dunitz and A. Gavezzotti, Chem. Soc. Rev., 2009, 38, 2622.44 C. Gatti, Z. Kristallogr., 2005, 220, 399.45 R. Parthasarathi, V. Subramanian and N. Sathyamurthy, J. Phys.
Chem. A, 2006, 110, 3349.46 L. Rincon, R. Almeida, D. Garcia-Aldea and H. Diez y Riega,
J. Chem. Phys., 2001, 114, 5552.47 R. Parthasarathi, V. Subramanian and N. Sathyamurthy, Synth.
React. Inorg., Met.-Org., Nano-Met. Chem., 2008, 38, 18.48 R. Parthasarathi, V. Subramanian and N. Sathyamurthy, J. Phys.
Chem. A, 2005, 109, 843.49 R. Parthasarathi, R. Amutha, V. Subramanian, B. U. Nair and
T. Ramasami, J. Phys. Chem. A, 2004, 108, 3817.50 E. Arunan, G. R. Desiraju, R. A. Klein, J. Sadlej, S. Scheiner,
I. Alkorta, D. C. Clary, R. H. Crabtree, J. J. Dannenberg,P. Hobza, H. G. Kjaergaard, A. C. Legon, B. Mennucci andD. J. Nesbitt, Pure Appl. Chem., 2011, 83, 1637.
51 J. P. Merrick, D. Moran and L. Radom, J. Phys. Chem. A, 2007,111, 11683.
52 T. Yu. Nikolaienko and D. M. Hovorun,Dopov. Nats. Akad. NaukUkr., 2010, N9, 173.
53 T. Yu. Nikolaienko, L. A. Bulavin and D. M. Hovorun, Ukr.Biokhim. Zh., 2010, 82(6), 76.
54 T. Yu. Nikolaienko, L. A. Bulavin and D. M. Hovorun, Ukr.Biokhim. Zh., 2011, 83(4), 16.
55 T. Yu. Nikolaienko, L. A. Bulavin and D. M. Hovorun, Biopolym.Cell, 2011, 27(4), 291.
56 T. Yu. Nikolaienko, L. A. Bulavin, D. M. Hovorun andO. O. Missura, Ukr. Biokhim. Zh., 2011, 83(1), 54.
57 T. Yu. Nikolaienko, L. A. Bulavin and D. M. Hovorun, Biopolym.Cell, 2011, 27(1), 74.
58 T. Yu. Nikolaienko, L. A. Bulavin and D. M. Hovorun, Ukr.Bioorg. Acta, 2010, 8(2), 8.
59 T. Yu. Nikolaienko, L. A. Bulavin and D. M. Hovorun, Ukr.Bioorg. Acta, 2011, 9(1), 3.
60 K. K. Irikura, R. D. Johnson III and R. N. Kacker, J. Phys. Chem. A,2005, 109, 8430.
61 T. A. Keith, AIMAll (Version 08.11.29), 2008 (aim.tkgristmill.com).

This journal is c the Owner Societies 2012 Phys. Chem. Chem. Phys., 2012, 14, 7441–7447 7447
62 W. Qian and S. Krimm, J. Phys. Chem. A, 2002, 106, 6628.63 L. M. Epstein and E. S. Shubina, Coord. Chem. Rev., 2002,
231, 165; M. Rozenberg, C. Jung and G. Shoham, Spectrochim.Acta, Part A, 2005, 61, 733; A. Gomez-Zavaglia and R. Fausto,J. Phys. Chem. A, 2004, 108, 6953; M. Rozenberg, G. Shoham,I. Reva and R. Fausto, Spectrochim. Acta, Part A, 2004, 60, 463;M. Rozenberg, G. Shoham, I. Reva and R. Fausto, Spectrochim.Acta, Part A, 2004, 60, 2323; R. R. Shagidullin, A. V. Chernova,S. A. Katsyuba, L. V. Avvakumova and R. R. Shagidullin, Russ.Chem. Bull., 2004, 53, 55.
64 L. A. Bulavin, T. Yu. Nikolaienko and D. M. Hovorun, Dopov.Nats. Akad. Nauk Ukr., 2010, N7, 61.
65 U. Koch and P. L. A. Popelier, J. Phys. Chem., 1995, 99, 9747.66 R. J. Gillespie and P. L. A. Popelier, Chemical bonding and molecular
geometry: from Lewis to electron densities, Oxford University Press,2001.
67 P. Munshi and T. N. Guru Row, CrystEngComm, 2005, 7, 608.68 Yu. V. Zefirov and P. M. Zorky, Russ. Chem. Rev., 1995, 64, 415.
69 M. W. Feyereisen, D. Feller and D. A. Dixon, J. Phys. Chem.,1996, 100, 2993.
70 D. M. Hovorun and Y. R. Mishchuk, Ukr. J. Phys., 1997,42(8), 933.
71 Ye. P. Yurenko, R. O. Zhurakivsky, M. Ghomi, S. P. Samijlenkoand D. M. Hovorun, J. Phys. Chem. B, 2008, 112, 1240;R. O. Zhurakivskyi and D. M. Hovorun, Ukr. Biokhim. Zh.,2006, 78(6), 70; Ye. P. Yurenko, R. O. Zhurakivsky, S. P.Samijlenko, M. Ghomi and D. M. Hovorun, Chem. Phys. Lett.,2007, 447, 140; R. O. Zhurakivsky and D. M. Hovorun, Biopolym.Cell, 2007, 23(4), 363; R. O. Zhurakivsky and D. M. Hovorun,Dopov. Nats. Akad. Nauk Ukr., 2007, N5, 180; R. O. Zhurakivskyand D. M. Hovorun, Biopolym. Cell, 2008, 24(2), 142; R. O.Zhurakivsky and D. M. Hovorun, Ukr. Bioorg. Acta, 2007,5(2), 44.
72 R. O. Zhurakivsky and D.M. Hovorun, Phys. Alive, 2007, 15(1), 92.73 R. O. Zhurakivsky and D.M. Hovorun, Phys. Alive, 2007, 15(2), 24.74 W. Saenger, Principles of nucleic acid structure, Springer-Verlag, 1984.
![Citethis:hys. Chem. Chem. Phys .,2011,13 ,18001812 PAPER - BIUbarkaie/pccp.pdf · reach a plateau [Line 20]. Driven motion may lead to a superdiffusive power-law form of the second](https://img.dokumen.tips/doc/110x75/608951b1c18ab05aa24e6dc9/citethishys-chem-chem-phys-201113-18001812-paper-biu-barkaiepccppdf.jpg)