Embed Size (px)
Citation preview

This journal is c the Owner Societies 2012 Phys. Chem. Chem. Phys., 2012, 14, 7131–7136 7131
Cite this: Phys. Chem. Chem. Phys., 2012, 14, 7131–7136
The combination of a polymer–carbon composite electrode with a
high-absorptivity ruthenium dye achieves an efficient dye-sensitized
solar cell based on a thiolate–disulfide redox couplew
Jing Zhang,a Huijin Long,a Sara G. Miralles,b Juan Bisquert,b
Francisco Fabregat-Santiago*band Min Zhang*
a
Received 14th March 2012, Accepted 14th March 2012
DOI: 10.1039/c2cp40809k
To overcome the intrinsic shortcomings of the traditional iodide–triiodide redox couple and
pursue a further performance improvement, intense efforts have been made to exploit alternative
redox shuttles in dye-sensitized solar cells (DSCs). Herein, we report an energetic and kinetic view
of DSCs when the iodine electrolyte is substituted with its thiolate counterpart and identify that a
conventional platinum counter electrode presents low catalytic activity for the thiolate electrolyte,
featuring a high charge transfer resistance found at the platinized fluorine-doped tin oxide (FTO).
We employ conductive carbon black with several polymers to fabricate highly active composite
catalysts for thiolate regeneration. The use of a highly active conductive carbon black and
polymerized 3,4-ethylenedioxythiophene composition as a counter electrode combined with a
high-absorptivity ruthenium dye C106 sensitized titania film has generated a DSC with an organic
thiolated electrolyte, exhibiting an overall power conversion efficiency of 7.6% under AM1.5G
full sunlight.
Introduction
As a potential substitute for the traditional fuel energy sources
that are currently being exhausted, the dye-sensitized solar cell
(DSC)1 has attracted extensive interest in both academic and
industrial fields. In a typical DSC, the iodide–triiodide redox
shuttle is the most common choice, owing to an expeditious dye
regeneration, a sluggish recombination between photoinjected
electrons in titania and triiodide and a rapid mass transport of
redox ions in a thin-layer sandwich device architecture.2 However,
the ordinary iodine electrolyte also presents some prominent
constraints on the development of new photosensitizers, semi-
conductors and counter electrodes.3 Recently, intense endeavors
have been made to explore alternative redox couples to replace the
iodine shuttle, such as metal complexes, halogens, pseudohalogens
and somemetal-free organic redox shuttles.4 The thiolate–disulfide
(T�–T2) organic redox couple (Fig. S1w) exploited by Gratzel et al.
achieved the highest efficiency of 6.4% in iodine-free DSCs at that
time.4q In comparison with the iodine cell, the thiolate counterpart
exhibited lower open-circuit photovoltage (Voc) and fill factor (FF).
To further enhance the photovoltaic performance of this kind
of cell, it is necessary to develop an in-depth understanding of
energetics and kinetics of these two DSCs with different
electrolytes.
It is found that the charge transfer resistance at the Pt/thiolate
electrolyte interface is larger than that for the Pt/iodine case
which explains the better FF attained with the iodine electrolyte.
Because of the benign conduction, high specific surface area and
low cost, the carbon materials have been applied as counter
electrodes (CEs) in DSCs.5 Carbon black is a good electrical
conductor and shows high catalytic activity for the reduction of
triiodide. An efficiency as high as 9.1% has been obtained for
iodine-based DSCs with a carbon black counter electrode.5e
However, the catalytic activity of carbon black for thiolate–
disulfide is insufficient.
In this work, through a joint spectroscopic and electrical
study on the energetics and kinetics of DSCs, we will take a
close look at the origins of the redox couple influences on the
photocurrent action spectra and current–voltage (j–V) curves
of DSCs, by formulating two kinds of electrolytes characteristic of
thiolate and iodine redox shuttles, respectively. On the basis of the
aforementioned understanding, we will combine conductive carbon
blacks (CCBs) with several polymers that have been proved to
actively catalyze the reduction of triiodide to fabricate high active
composite catalysts for thiolate regeneration. Integrating CCB and
a polymerized 3,4-ethylenedioxythiophene (PEDOT) composition
with a high-absorptivity ruthenium dye C106 (Fig. S1w)sensitized titania film and perfusing with an organic thiolate
a Changchun Institute of Applied Chemistry, Chinese Academy ofScience, Changchun 130022, China. E-mail: [email protected];Fax: 86 431 852 629 53; Tel: 86 431 852 629 53
b Photovoltaic and Optoelectronic Devices Group, Physics Department,Universitat Jaume I, 12071 Castello, Spain. E-mail: [email protected]
w Electronic supplementary information (ESI) available: Molecularstructures, steady-state electronic absorption spectra, details of fittingof TAS and emission decay and electrochemical data. See DOI:10.1039/c2cp40809k
PCCP Dynamic Article Links
www.rsc.org/pccp PAPER
Dow
nloa
ded
by U
nive
rsita
t Jau
me
I on
26
June
201
2Pu
blis
hed
on 2
3 M
arch
201
2 on
http
://pu
bs.r
sc.o
rg |
doi:1
0.10
39/C
2CP4
0809
KView Online / Journal Homepage / Table of Contents for this issue

7132 Phys. Chem. Chem. Phys., 2012, 14, 7131–7136 This journal is c the Owner Societies 2012
electrolyte, our device achieved a 7.6% efficiency under
AM1.5G full sunlight.
Results and discussion
We first measured the photocurrent action spectra of DSCs
employing the thiolate and iodine electrolytes depicted in
Fig. 1, in which the incident photon-to-collected electron
conversion efficiencies (IPCEs) are plotted as a function of
wavelength. As Fig. 1 presents, it can be seen that the electrolyte
alteration from iodine to thiolate does not influence the IPCEs in
the whole spectral range of 400–800 nm. Also note that although
the iodine electrolyte exhibits higher absorption coefficients in the
wavelength region of 400–450 nm (Fig. S2w), no noticeable
difference in the IPCEs of the cells with these two electrolytes
is observed in this spectral range, owing to the high-absorption-
coefficient nature of our C106 dye.
Although comparable IPCE heights across the whole spectral
response region with a maximum of B86% were obtained with
the thiolate and iodine electrolytes, it is still valuable to determine
the net charge separation yields at the dye/titania/electrolyte
interface and scrutinize the physical origins of non-ideal external
quantum efficiencies. Transient absorption measurements were
carried out to evaluate the kinetic competition between the
recombination of photoinjected electrons and oxidized dye
(D+) and the interception of D+ by the electron-donating species
in electrolytes.6 A monochromatic probe light at 782 nm was
applied in transient kinetic measurements, where the excitation
wavelength and fluence were carefully tuned to ensure that
B1 � 1014 photons cm�2 (B1.0 photon per particle) were
absorbed by the dye-coated film, with an identical exciton
distribution profile during every laser pulse. In the absence of
electron-donating species in electrolytes, the absorption decay
(trace c in Fig. 2A and B) can be attributed to the D+
recombination with titania electrons, featuring a mean reaction
time (hti) of 11 � 0.4 ms calculated through a stretched
exponential fitting (see Electronic Supplementary Informationwfor details). A further employment of the thiolate electrolyte
remarkably accelerated the absorption decay (trace a in
Fig. 2A) through electron donation from the thiolate to the
oxidized dye molecules, producing a hti of 14.5� 0.8 ms for the dyeregeneration reaction. By comparison, the iodine electrolyte features
a slightly faster dye regeneration rate with a 3.4 � 0.4 ms mean
reaction time (trace b in Fig. 2B). This displays a reverse
dependence of the Gibbs free energy for dye regeneration,
indicating that with respect to the routinely used iodine
electrolyte, the sluggish dye regeneration of the thiolate counterpart
should allow for a small elevation space of the ground-state redox
potential in the future design of low energy gap dyes to harvest
near-infrared solar photons. In spite of their dissimilar dye
regeneration kinetics, however, the branch ratios of the dual-
channel charge transfer kinetics were over 750 for both redox
shuttles, exerting negligible influences on the IPCE maxima.
We resorted to the time-correlated single photon counting
(TCSPC) technique to evaluate the exciton dissociation efficiency
at the dye/titania interface.7 A reference dummy cell was first
constructed based on a C106-coated alumina film soaked in the
thiolate or iodine electrolyte, which displays a strong photo-
luminescence (the blue lines in Fig. 2C and D) upon laser
excitation at 488 nm. On account of the straddling
dye/alumina junction, which is thermodynamically unfeasible
for charge generation, we assign these emissions to the irradiative
and non-irradiative deactivations of excited-state dye molecules.
The time-correlated emission decay traces are well fitted with a
Fig. 1 Photocurrent action spectra of dye-sensitized solar cells with
iodine and thiolate as redox species. The aperture area of the metal
mask is 0.160 cm2. An anti-reflection film was adhered to the testing
cell during measurement.
Fig. 2 (A) and (B) Kinetic traces in the (a) thiolate, (b) iodine and
(c) inert electrolytes of a 12-mm-thick, C106-coated titania film. The smooth
lines are stretched exponential fittings over the raw data obtained by
averaging 800 laser shots. The excitation fluence is 44 mJ cm�2 at a
wavelength of 665 nm. (C) and (D) Time-correlated emission decay
traces of cells with titania or alumina film with an excitation wave-
length of 488 nm. The detection wavelength was at the wavelength of
the maximum emission intensity. The emission intensity (I) was
corrected in terms of the film absorbance at 488 nm and further
normalized with respect to the emission maximum of a dye-coated
alumina film (Imax,alumina).
Dow
nloa
ded
by U
nive
rsita
t Jau
me
I on
26
June
201
2Pu
blis
hed
on 2
3 M
arch
201
2 on
http
://pu
bs.r
sc.o
rg |
doi:1
0.10
39/C
2CP4
0809
K
View Online

This journal is c the Owner Societies 2012 Phys. Chem. Chem. Phys., 2012, 14, 7131–7136 7133
stretched exponential function (see the Electronic Supplementary
Informationw for details). The photoluminescence average life-
times (hti) of the C106 dye molecules anchored on alumina in
contact with the thiolate and iodine were calculated as 29.2� 0.16
and 34.2 � 0.09 ns, respectively. Moreover, the emission average
lifetimes on the titania film (the red lines in Fig. 2C and D) are
notably reduced to 2.1 � 0.09 and 1.6 � 0.07 ns for the
corresponding thiolate and iodine electrolytes. Hereby, we can
derive the electron injection rate constants to be (4.3� 0.2) � 108
and (6.0 � 0.3) � 108 s�1 for cells with thiolate and iodine
electrolytes, respectively. Calculation with the photoluminescence
average lifetimes on titania and on alumina affords comparable
electron injection yields (Zinj) of (93� 0.3)% and (95 � 0.2)% for
the respective thiolate and iodine cells, which echoes the similar
IPCE maxima mentioned above.
The solar-to-electricity conversion efficiencies were further
evaluated by measuring the photocurrent density–voltage
(j–V) characteristics (Fig. 3) at an irradiation of 100 mW cm�2
AM1.5G simulated sunlight and the photovoltaic parameters are
collected in Table 1. The components of the previously optimized
iodine based electrolyte were utilized in the iodine cell, which
achieved the best power conversion efficiency of C106 under
this film thickness. The short-circuit photocurrent density (jsc),
open-circuit photovoltage (Voc) and fill factor (FF) of a typical
cell with the iodine electrolyte are 17.1 mA cm�2, 750 mV and
0.77, respectively, affording an overall power conversion
efficiency (Z) of 9.8%. The thiolate analogue exhibits a
similar jsc, in agreement with the preceding IPCE measurements,
but it leads to a 90 mV decrease of Voc from 750 to 660 mV in
contrast to the iodine cell. This fact together with a decreased FF
of 0.55 results in a lower Z of 6.2%.
The relatively low Voc for the thiolate cell may be explained
by analyzing the energetics of the redox couple and conduction
band position in TiO2 (Fig. S3w) with an energy diagram, as
plotted in Fig. 4a.8 As observed in the figure, while the TiO2
conduction band edge in thiolate is only 10 mV lower than in
iodine, the redox potential for thiolate is 130 mV higher than
for iodine. Consequently, the recombination resistance, and
therefore the Voc, is expected to be lower in the case of thiolate
than for iodine. This is what was found in Fig. 4(b). Near Voc,
the differences in Rrec are 110 mV coincident, within the
experimental error, with the difference DEc–DEredox = 140 mV
between the positions of the conduction band and the redox levels
in the two electrolytes. This result suggests that the change in Rrec
is mostly due to these changes in the energetic levels. A change in
slope is also found in the recombination resistance, which suggests
that the recombination mechanism is also different. The small
difference found between the shift in Rrec and the change in Voc
with the redox couples is also attributed to the change in slope of
Rrec, since for lower slopes larger Voc are expected.9
The significantly inferior FF is another important cause of
the lower power conversion efficiency of the thiolate electrolyte.
Through comparing the charge transfer resistances at the CE
Fig. 3 j–V characteristic measured at an irradiation of 100 mW cm�2
AM1.5G sunlight for dye-sensitized solar cells with two different redox
species. The counter electrode was a platinized FTO. The aperture
area of the metal mask is 0.160 cm2. An anti-reflection film was
adhered to the testing cell during measurement.
Table 1 Photovoltaic data measured at an irradiation of 100 mW cm�2
AM1.5G sunlighta
Electrolyte Voc/mV jsc/mA cm�2 FF Z (%)
Thiolate 660 � 5 17.1 � 0.02 0.55 � 0.002 6.2 � 0.05Iodine 750 � 5 17.1 � 0.02 0.77 � 0.001 9.8 � 0.04
a The spectral distribution of our light resource simulates the AM1.5G
solar emission (ASTM G173-03) with a mismatch of B5%. The
abbreviations in Table 1 stand for: open-circuit photovoltage Voc;
short-circuit photocurrent density jsc; fill factor FF; total power
conversion efficiency Z, and charge transfer resistance from the counter
electrode to the redox couple RCE.
Fig. 4 (a) Energy levels in the DSCs sensitized with C106 in (left)
iodine and (right) thiolate based electrolytes. (b) Recombination
resistance for the DSCs with these two redox couples under 1 sun
illumination.
Dow
nloa
ded
by U
nive
rsita
t Jau
me
I on
26
June
201
2Pu
blis
hed
on 2
3 M
arch
201
2 on
http
://pu
bs.r
sc.o
rg |
doi:1
0.10
39/C
2CP4
0809
K
View Online
7134 Phys. Chem. Chem. Phys., 2012, 14, 7131–7136 This journal is c the Owner Societies 2012
(RCE) in the two types of electrolyte, we found that the RCE of
thiolate is remarkably larger than that of the iodine cell, which
is the main reason for the lower FF. Obviously, we may
conclude here that the widely used Pt CE is not active enough
for the reduction of T2 in the thiolate electrolyte system.
Carbonaceous materials are usually considered as substitutes for
Pt at counter electrodes in DSCs due to their high conductivity,
large specific surface area and low cost, but the catalytic activities of
carbonaceous materials for the reductive reaction on the CE are
hardly comparable with Pt.Wewill utilize carbon black and several
conductive polymer composites as active CEs for the thiolate
electrolyte reduction, since conductive polymers have been proven
to be highly active for electrocatalysis.10 The pyrrole (PY), aniline
(ANI) or 3,4-ethylenedioxythiophene (EDOT) was polymerized on
a conductive carbon black (CCB) film screen printed on FTO glass
to form a polymer–CCB composite CE for the thiolate cells.
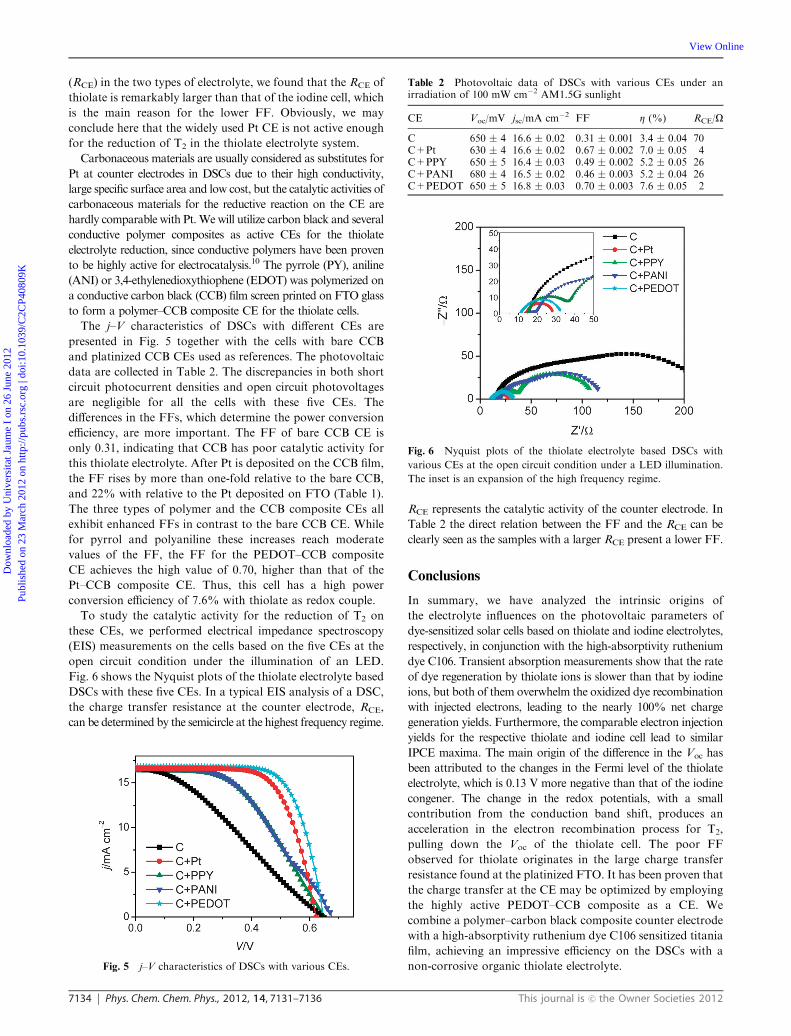
The j–V characteristics of DSCs with different CEs are
presented in Fig. 5 together with the cells with bare CCB
and platinized CCB CEs used as references. The photovoltaic
data are collected in Table 2. The discrepancies in both short
circuit photocurrent densities and open circuit photovoltages
are negligible for all the cells with these five CEs. The
differences in the FFs, which determine the power conversion
efficiency, are more important. The FF of bare CCB CE is
only 0.31, indicating that CCB has poor catalytic activity for
this thiolate electrolyte. After Pt is deposited on the CCB film,
the FF rises by more than one-fold relative to the bare CCB,
and 22% with relative to the Pt deposited on FTO (Table 1).
The three types of polymer and the CCB composite CEs all
exhibit enhanced FFs in contrast to the bare CCB CE. While
for pyrrol and polyaniline these increases reach moderate
values of the FF, the FF for the PEDOT–CCB composite
CE achieves the high value of 0.70, higher than that of the
Pt–CCB composite CE. Thus, this cell has a high power
conversion efficiency of 7.6% with thiolate as redox couple.
To study the catalytic activity for the reduction of T2 on
these CEs, we performed electrical impedance spectroscopy
(EIS) measurements on the cells based on the five CEs at the
open circuit condition under the illumination of an LED.
Fig. 6 shows the Nyquist plots of the thiolate electrolyte based
DSCs with these five CEs. In a typical EIS analysis of a DSC,
the charge transfer resistance at the counter electrode, RCE,
can be determined by the semicircle at the highest frequency regime.
RCE represents the catalytic activity of the counter electrode. In
Table 2 the direct relation between the FF and the RCE can be
clearly seen as the samples with a larger RCE present a lower FF.
Conclusions
In summary, we have analyzed the intrinsic origins of
the electrolyte influences on the photovoltaic parameters of
dye-sensitized solar cells based on thiolate and iodine electrolytes,
respectively, in conjunction with the high-absorptivity ruthenium
dye C106. Transient absorption measurements show that the rate
of dye regeneration by thiolate ions is slower than that by iodine
ions, but both of them overwhelm the oxidized dye recombination
with injected electrons, leading to the nearly 100% net charge
generation yields. Furthermore, the comparable electron injection
yields for the respective thiolate and iodine cell lead to similar
IPCE maxima. The main origin of the difference in the Voc has
been attributed to the changes in the Fermi level of the thiolate
electrolyte, which is 0.13 V more negative than that of the iodine
congener. The change in the redox potentials, with a small
contribution from the conduction band shift, produces an
acceleration in the electron recombination process for T2,
pulling down the Voc of the thiolate cell. The poor FF
observed for thiolate originates in the large charge transfer
resistance found at the platinized FTO. It has been proven that
the charge transfer at the CE may be optimized by employing
the highly active PEDOT–CCB composite as a CE. We
combine a polymer–carbon black composite counter electrode
with a high-absorptivity ruthenium dye C106 sensitized titania
film, achieving an impressive efficiency on the DSCs with a
non-corrosive organic thiolate electrolyte.Fig. 5 j–V characteristics of DSCs with various CEs.
Table 2 Photovoltaic data of DSCs with various CEs under anirradiation of 100 mW cm�2 AM1.5G sunlight
CE Voc/mV jsc/mA cm�2 FF Z (%) RCE/O
C 650 � 4 16.6 � 0.02 0.31 � 0.001 3.4 � 0.04 70C+Pt 630 � 4 16.6 � 0.02 0.67 � 0.002 7.0 � 0.05 4C+PPY 650 � 5 16.4 � 0.03 0.49 � 0.002 5.2 � 0.05 26C+PANI 680 � 4 16.5 � 0.02 0.46 � 0.003 5.2 � 0.04 26C+PEDOT 650 � 5 16.8 � 0.03 0.70 � 0.003 7.6 � 0.05 2
Fig. 6 Nyquist plots of the thiolate electrolyte based DSCs with
various CEs at the open circuit condition under a LED illumination.
The inset is an expansion of the high frequency regime.
Dow
nloa
ded
by U
nive
rsita
t Jau
me
I on
26
June
201
2Pu
blis
hed
on 2
3 M
arch
201
2 on
http
://pu
bs.r
sc.o
rg |
doi:1
0.10
39/C
2CP4
0809
K
View Online
This journal is c the Owner Societies 2012 Phys. Chem. Chem. Phys., 2012, 14, 7131–7136 7135
Experimental
Counter electrode preparation
The fluorine-doped tin oxide (FTO) glass substrates (TEC
15 O sq.�1, Libbey-Owens-Ford Industries, 2.2 mm thick)
were cleaned ultrasonically in deionized water, acetone and
ethanol and finally dried by blowing them with dry air. The
conductive carbon black (Super p) (CCB) paste was prepared
by mixing CCB, polyvinylidene fluoride and N-methyl-2-
pyrrolidone at a mass ratio of 16 : 9 : 180. A B3.6 mm-thick
CCB layer was first screen-printed onto a pre-cleaned FTO
glass (TEC 15 O sq.�1, Libbey-Owens-Ford Industries, 2.2 mm
thick) and further baked at 120 1C for 5 min to produce a CCB
positive electrode for the DSCs. The polymerization deposition
was carried out by cyclic voltammetry technology using a three-
electrode system. The working electrode was the FTO with CCB
layer, the CE was a freshly polished Pt wire and the reference
electrode was Ag–AgCl. The applied voltage range for PPY,
PEDOT and PANI is �0.4 to 0.8, �0.4 to 1.2 and �0.6 to 1.0 V,
respectively (scan times: three; scan rate: 10 mV s�1). The
electrolyte for PPY or PEDOT was composed of 0.1 M lithium
bis(trifluoromethanesulfonyl)imide (LiTFSI) and 20 mM PY or
EDOT in acetonitrile.11 The aniline was polymerized in aqueous
solution with 1 M HCl and 20 mM aniline.12
Cell fabrication and characterizations
A double-layer titania film was used as the negative electrode
of the DSC. A 7 mm-thick transparent layer of 22 nm-sized
TiO2 particles was first screen-printed onto a pre-cleaned FTO
conducting glass electrode (Nippon Sheet Glass, Solar, 4 mm
thick) and further coated with a 6 mm-thick second layer of
scattering titania particles (WERO-4, Dyesol). The detailed
preparation procedures of the 22 nm-sized titania nano-
particles, pastes for screen-printing and nanostructured titania
films were reported previously.13 The film thickness was
monitored with a bench-top Ambios XP-1 stylus profilometer.
After sintering at 500 1C and cooling to 100 1C, the sintered
titania electrodes (B0.28 cm2) were stained by immersing
them into a dye solution of C106 (10 mM C106 and 10 mM
chenodeoxycholic acid in DMSO) for 5 min. The synthesis of
C106 has been described in our previous paper.14 The
dye-coated titania electrode was then rinsed with DMSO and
ethanol, dried by air flow, and was further assembled with a
thermally platinized FTO or CCB–polymer composite printed
FTO positive electrode by a 30 mm-thick Bynel (DuPont) hot-
melt gasket and sealed up by heating. The internal space was
perfused with a thiolate or iodine electrolyte with the aid of a
vacuum-back-filling system. The thiolate electrolyte is composed
of 0.4 M 5-mercapto-1-methyltetrazole ion (T�), 0.2 M of the
dimer of T� (T2) (Fig. S1w), 1 M 4-tert-pyridine (TBP) and
0.05 M lithium bis(trifluoromethanesulfonyl)imide (LiTFSI) in
acetonitrile. The iodine electrolyte consists of 1.0 M 1,3-dimethyl-
imidazolium iodide (DMII), 0.02 M iodine (I2), 1.0 M TBP and
0.05 M LiI in acetonitrile.
Electrical impedance measurements
Electrical impedance experiments were carried out under an
LED irradiation of 100 mW cm�2 on an IM6ex electrochemical
workstation, with a frequency range from 50 mHz to 100 kHz
and a potential modulation of 10 mV. The obtained impedance
spectra were fitted with the Z-view software (v2.80, 2002,
Scribner Associates Inc.) in terms of an appropriate equivalent
circuit.
Voltammetric measurements
Square-wave voltammograms of ferrocene were measured on
a CHI660C electrochemical workstation. A reference electrode
was constructed by dipping a platinum wire into a DSC
(thiolate or iodine) electrolyte-filling glass tube, the bottom end
of which was sealed with a ceramic porous frit. A 5 mm-radius
platinum ultramicroelectrode was used as the working electrode
and a platinum wire as the CE.
Steady-state and transient absorption measurements
Electronic absorption spectra were recorded on a PerkinElmer
Lamda 900 spectrometer. Transient absorption measurements
were performed with a LP920 laser flash spectrometer pumped
with a nanosecond wavelength tunable OPOLett-355II laser.
The sample was kept at a 451 angle with respect to the
excitation beam. The transient absorption spectrum was recorded
with an Andor ICCD camera using a xenon arc lamp as the probe
light. In the kinetic measurements, the probe light was first passed
through a bandpass filter (center wavelength: 782 nm), detected by
a fast photomultiplier tube and recorded with a TDS 3012C digital
signal analyzer. The pulse fluence and excitation wavelength
for the thiolate are 48.5 mJ cm�2 and 686 nm, for the iodine
are 48.5 mJ cm�2 and 687 nm, and for the inert electrolyte are
48.2 mJ cm�2 and 690 nm, respectively.
Acknowledgements
The Chinese group thanks the National Science Foundation
of China (No. 51103146), the National 863 Program
(No. 2011AA050521) and the National 973 Program
(No. 2011CBA00702) for financial support. We are grateful
to Dyesol for supplying the WER4-O scattering paste and to
DuPont Packaging and Industrial Polymers for supplying the
Bynel film. The Spanish group acknowledges financial support
from Ministerio de Cıencia e Innovacion under Projects
HOPE CSD2007-00007 and MAT 2010-19827 and Generalitat
Valenciana under Project PROMETEO/2009/058.
Notes and references
1 B. O’Regan and M. Gratzel, Nature, 1991, 353, 737.2 G. Boschloo and A. Hagfeldt, Acc. Chem. Res., 2009, 42, 1819.3 S. Yanagida, Y. Yu and K. Manseki, Acc. Chem. Res., 2009,42, 1827.
4 (a) G. Oskam, B. V. Bergeron, G. J. Meyer and P. C. Searson,J. Phys. Chem. B, 2001, 105, 6867; (b) H. Nusbaumer, J.-E. Moser,S. M. Zakeeruddin, M. K. Nazeeruddin and M. Gratzel, J. Phys.Chem. B, 2001, 105, 10461; (c) S. A. Sapp, C. M. Elliott,C. Contado, S. Caramori and C. A. Bignozzi, J. Am. Chem.Soc., 2002, 124, 11215; (d) H. Nusbaumer, S. M. Zakeeruddin,J.-E. Moser and M. Gratzel, Chem.–Eur. J., 2003, 9, 3756;(e) P. Wang, S. M. Zakeeruddin, J.-E. Moser, R. Humphry-Bakerand M. Gratzel, J. Am. Chem. Soc., 2004, 126, 7164;(f) P. J. Cameron, L. M. Peter, S. M. Zakeeruddin andM. Gratzel, Coord. Chem. Rev., 2004, 248, 1447; (g) Z.-S. Wang,K. Sayama and H. Sugihara, J. Phys. Chem. B, 2005, 109, 22449;
Dow
nloa
ded
by U
nive
rsita
t Jau
me
I on
26
June
201
2Pu
blis
hed
on 2
3 M
arch
201
2 on
http
://pu
bs.r
sc.o
rg |
doi:1
0.10
39/C
2CP4
0809
K
View Online

7136 Phys. Chem. Chem. Phys., 2012, 14, 7131–7136 This journal is c the Owner Societies 2012
(h) S. Hattori, Y. Wada, S. Yanagida and S. Fukuzumi, J. Am.Chem. Soc., 2005, 127, 9648; (i) B. V. Bergeron, A. Marton,G. Oskam and G. J. Meyer, J. Phys. Chem. B, 2005, 109, 937;(j) S. Cazzanti, S. Caramori, R. Argazzi, C. M. Elliott andC. A. Bignozzi, J. Am. Chem. Soc., 2006, 128, 9996;(k) Z. Zhang, P. Chen, T. N. Murakami, S. M. Zakeeruddin andM. Gratzel, Adv. Funct. Mater., 2008, 18, 341; (l) B. M. Klahr andT. W. Hamann, J. Phys. Chem. C, 2009, 113, 14040; (m) C. Teng,X. Yang, C. Yuan, C. Li, R. Chen, H. Tian, S. Li, A. Hagfeldt andL. Sun, Org. Lett., 2009, 11, 5542; (n) T. C. Li, A. M. Spokoyny,C. She, O. K. Farha, C. A. Mirkin, T. J. Marks and J. T. Hupp,J. Am. Chem. Soc., 2010, 132, 4580; (o) H. Wang, P. G. Nicholson,L. Peter, S. M. Zakeeruddin and M. Gratzel, J. Phys. Chem. C,2010, 114, 14300; (p) H. Tian, X. Jiang, Z. Yu, L. Kloo, A. Hagfeldtand L. Sun, Angew. Chem., Int. Ed., 2010, 49, 7328; (q) M. Wang,N. Chamberland, L. Breau, J.-E. Moser, R. Humphry-Baker,B. Marsan, S. M. Zakeeruddin and M. Gratzel, Nat. Chem., 2010,2, 385; (r) S. Caramori, J. Husson, M. Beley, C. A. Bignozzi,R. Argazzi and P. C. Gros, Chem.–Eur. J., 2010, 16, 2611;(s) S. M. Feldt, E. A. Gibson, E. Gabrielsson, L. Sun, G. Boschlooand A. Hagfeldt, J. Am. Chem. Soc., 2010, 132, 16714; (t) D. Li,H. Li, Y. Luo, K. Li, Q. Meng, M. Armand and L. Chen,Adv. Funct.Mater., 2010, 20, 3358; (u) A. Yella, H.-W. Lee, H. N. Tsao, C. Yi,A. K. Chandiran, M. K. Nazeeruddin, E. W.-G. Diau, C. Y. Yeh,S. M. Zakeeruddin and M. Gratzel, Science, 2011, 334, 629;(v) T. W. Hamann and J. W. Ondersma, Energy Environ. Sci.,2011, 4, 370.
5 Selected examples include: (a) A. Kay and M. Gratzel, Sol. EnergyMater. Sol. Cells, 1996, 44, 99; (b) K. Imoto, K. Takahashi,T. Yamaguchi, T. Komura, J. Nakamura and K. Murata, Sol.Energy Mater. Sol. Cells, 2003, 79, 459; (c) K. Suzuki,M. Yamaguchi, M. Kumagai and S. Yanagida, Chem. Lett.,2003, 32, 28; (d) S. Jang, R. Vittal and K. Kim, Langmuir, 2004,20, 9870; (e) T. N. Murakami, S. Ito, Q. Wang,M. K. Nazeeruddin, T. Bessho, I. Cesar, P. Liska, R. Humphry-Baker, P. Comte, P. Pechy and M. Gratzel, J. Electrochem. Soc.,2006, 153, A2255; (f) Z. Huang, X. Liu, K. Li, D. Li, Y. Luo, H. Li,W. Song, L. Chen and Q. Meng, Electrochem. Commun., 2007,
9, 596; (g) T. N. Murakmi and M. Gratzel, Inorg. Chim. Acta,2008, 361, 572; (h) W. Hong, Y. Xu, G. Lu, C. Li and G. Shi,Electrochem. Commun., 2008, 10, 1555; (i) W. J. Lee,E. Ramasamy, D. Y. Lee and J. S. Song, ACS Appl. Mater.Interfaces, 2009, 1, 1145; (j) M. X. Wu, X. Lin, T. H. Wang,J. S. Qiu and T. L. Ma, Energy Environ. Sci., 2011, 4, 2308;(k) H. Wang, G. Liu, X. Li, P. Xiang, Z. Ku, Y. Rong, M. Xu,L. Liu, M. Hu, Y. Yang and H. Han, Energy Environ. Sci., 2011,4, 2025.
6 (a) S. Ardo and G. J. Meyer, Chem. Soc. Rev., 2009, 38, 115;(b) S. A. Haque, Y. Tachibana, R. L. Willis, J. E. Moser,M. Gratzel, D. R. Klug and J. R. Durrant, J. Phys. Chem. B,2000, 104, 538; (c) S. Pelet, J.-E. Moser and M. Gratzel, J. Phys.Chem. B, 2000, 104, 1791.
7 (a) S. E. Koops, B. C. O’Regan, P. R. F. Barnes and J. R. Durrant,J. Am. Chem. Soc., 2009, 131, 4808; (b) C. A. Kelly, F. Farzad,D. W. Thompson, J. M. Stipkala and G. J. Meyer, Langmuir, 1999,15, 7047.
8 E. M. Barea, J. Ortiz, F. J. Paya, F. Fernandez-Lazaro,F. Fabregat-Santiago, A. Sastre-Santos and J. Bisquert, EnergyEnviron. Sci., 2010, 3, 1985.
9 F. Fabregat-Santiago, J. Bisquert, E. Palomares, L. Otero,D. Kuang, S. M. Zakeeruddin and M. Gratzel, J. Phys. Chem. C,2007, 111, 6550.
10 B. Winther-Jensen, O. Winther-Jensen, M. Forsyth andD. R. MacFarlane, Science, 2008, 321, 671.
11 (a) Y. Saito, W. Kubo, T. Kitamura, Y. Wada and S. Yanagida,J. Photochem. Photobiol., A, 2004, 164, 153; (b) S. Ahmad,M. Deepa and S. Singh, Langmuir, 2007, 23, 11430; (c) J. Wu,Q. Li, L. Fan, Z. Lan, P. Li, J. Lin and S. Hao, J. Power Sources,2008, 181, 172.
12 (a) A. G. MacDiarmid, Angew. Chem., Int. Ed., 2001, 40, 2581;(b) G. Wu, K. L. More, C. M. Johnston and P. Zelenay, Science,2011, 332, 443.
13 P. Wang, S. M. Zakeeruddin, P. Comte, R. Charvet, R. Humphry-Baker and M. Gratzel, J. Phys. Chem. B, 2003, 107, 14336.
14 Y. Cao, Y. Bai, Q. Yu, Y. Cheng, S. Liu, D. Shi, F. Gao andP. Wang, J. Phys. Chem. C, 2009, 113, 6290.
Dow
nloa
ded
by U
nive
rsita
t Jau
me
I on
26
June
201
2Pu
blis
hed
on 2
3 M
arch
201
2 on
http
://pu
bs.r
sc.o
rg |
doi:1
0.10
39/C
2CP4
0809
K
View Online


![Citethis:hys. Chem. Chem. Phys .,2011,13 ,18001812 PAPER - BIUbarkaie/pccp.pdf · reach a plateau [Line 20]. Driven motion may lead to a superdiffusive power-law form of the second](https://img.dokumen.tips/doc/110x75/608951b1c18ab05aa24e6dc9/citethishys-chem-chem-phys-201113-18001812-paper-biu-barkaiepccppdf.jpg)