Embed Size (px)
Citation preview

INVESTOR PRESENTATION As of July 25, 2013
Safe Harbor Statement
2
Except for historical information contained herein, the matters set forth in this presentation contain forward-looking statements, including industry market projections; our revenue growth opportunities; future product releases; projected inventory ramps; and forecasted revenue, gross margin, and R&D and SG&A expenses. These forward-looking statements are based on our current expectations, estimates and assumptions and are subject to certain risks and uncertainties that could cause actual results to differ materially from our current expectations, estimates and assumptions and the forward-looking statements made in this presentation. These risks and uncertainties include, but are not limited to, the risk factors listed in our Form 10-K for the year ended March 30, 2013, and in other filings with the Securities and Exchange Commission. The foregoing information concerning our business outlook represents our outlook as of the date of this presentation, and we undertake no obligation to update or revise any forward-looking statements, whether as a result of new developments or otherwise.
3
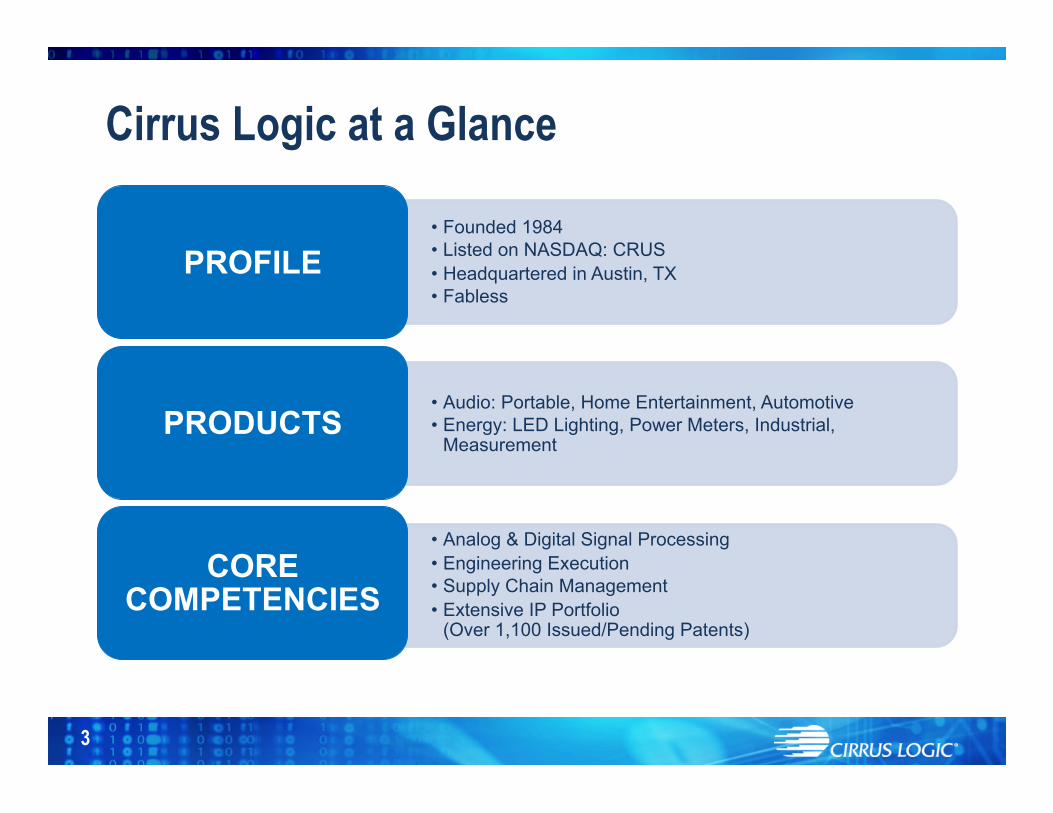
Cirrus Logic at a Glance
• Founded 1984 • Listed on NASDAQ: CRUS • Headquartered in Austin, TX • Fabless
PROFILE
• Audio: Portable, Home Entertainment, Automotive • Energy: LED Lighting, Power Meters, Industrial,
Measurement PRODUCTS
• Analog & Digital Signal Processing • Engineering Execution • Supply Chain Management • Extensive IP Portfolio
(Over 1,100 Issued/Pending Patents)
CORE COMPETENCIES
4
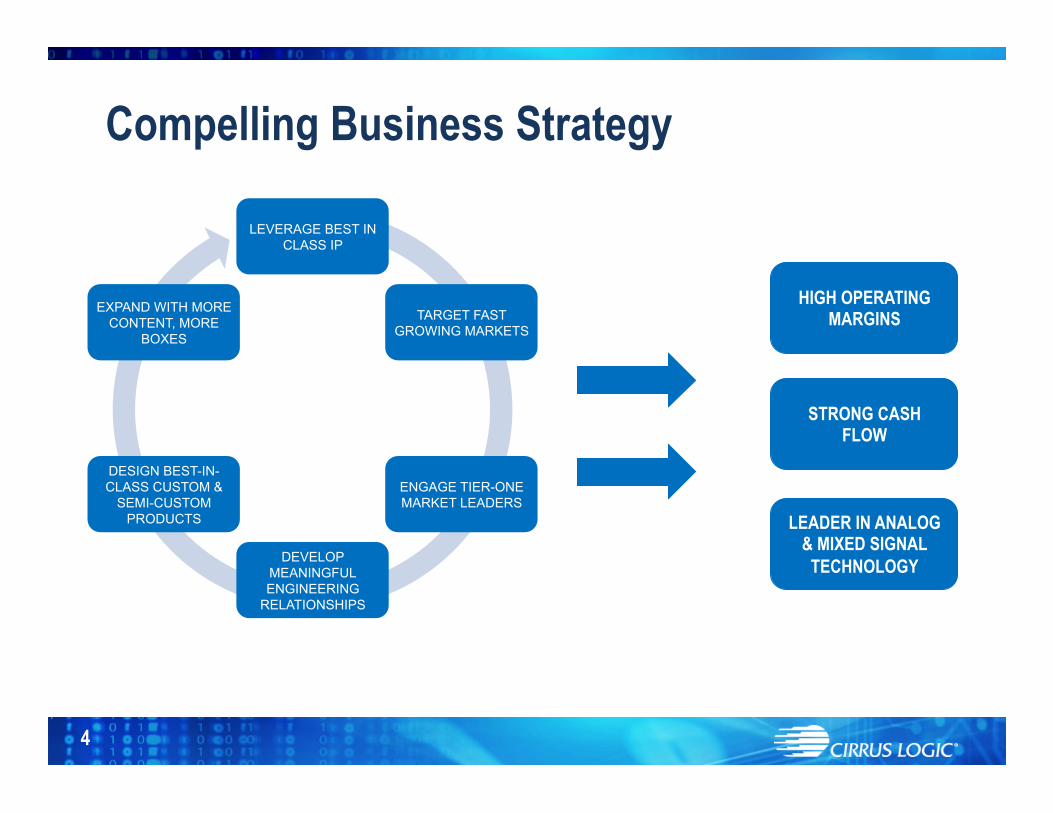
Compelling Business Strategy
LEVERAGE BEST IN CLASS IP
TARGET FAST GROWING MARKETS
ENGAGE TIER-ONE MARKET LEADERS
DEVELOP MEANINGFUL ENGINEERING
RELATIONSHIPS
DESIGN BEST-IN-CLASS CUSTOM &
SEMI-CUSTOM PRODUCTS
EXPAND WITH MORE CONTENT, MORE
BOXES
HIGH OPERATING MARGINS
STRONG CASH FLOW
LEADER IN ANALOG & MIXED SIGNAL
TECHNOLOGY

5
Focus on Tier One Customers
• Over 2,500 customers worldwide • Largest customer represented 77% of revenue in Q1 FY14 • Majority of products sold direct to customers
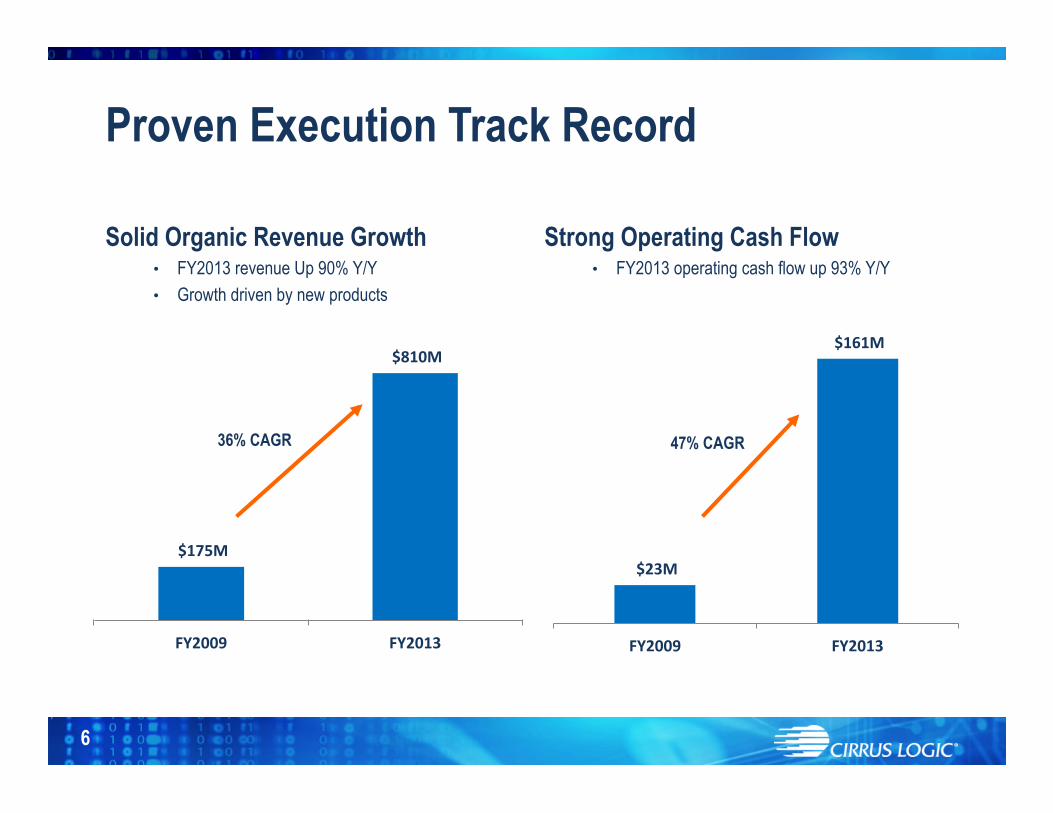
Solid Organic Revenue Growth • FY2013 revenue Up 90% Y/Y • Growth driven by new products
Strong Operating Cash Flow • FY2013 operating cash flow up 93% Y/Y
$23M
$161M
FY2009 FY2013
$175M
$810M
FY2009 FY2013
Proven Execution Track Record
6
36% CAGR 47% CAGR

Unique Corporate Culture
7
“Best Places to Work” 2011 & 2012
COMMUNITY SUPPORT
WORK HARD, PLAY HARD

8
AUDIO
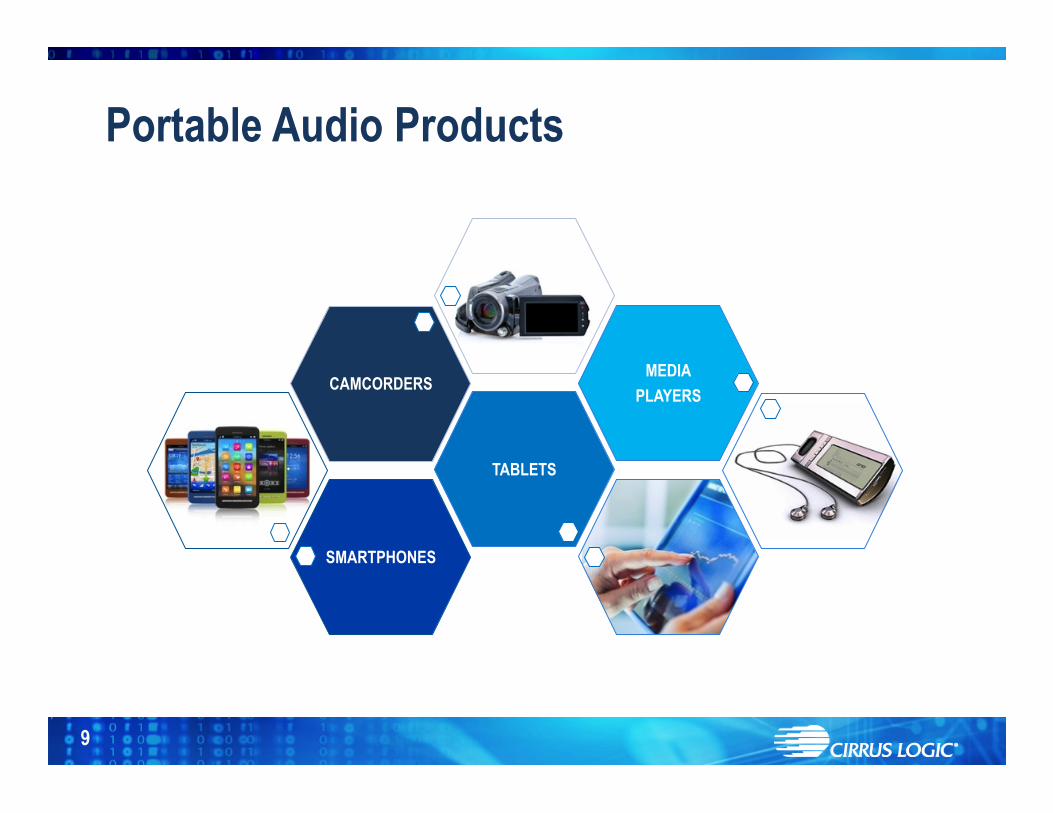
Portable Audio Products
9
SMARTPHONES
TABLETS
CAMCORDERS MEDIA
PLAYERS

Portable Audio: An Evolving Market
10
Global Smartphone Market Maturing: • Ultra high volume • Very competitive market
Additional Features Driving TAM Expansion • Voice enhancing features • Adaptive Noise Canceling (ANC) • Audio amps • Multi microphone beamforming
Portable Audio Opportunity Continuing to Grow Long Term
• Voice experience becoming more important in a broader range of products
• New device form factors being introduced • Customers requiring very low power solutions
for complex audio challenges Source: iSuppli and Company estimates
Global Smartphone Market
35%
28%
20%
15% 13%
400.0
500.0
600.0
700.0
800.0
900.0
1,000.0
1,100.0
1,200.0
1,300.0
1,400.0
0%
5%
10%
15%
20%
25%
30%
35%
40%
2012 2013 2014 2015 2016
% Unit Growth Unit Shipments
650M Units
1.3B Units
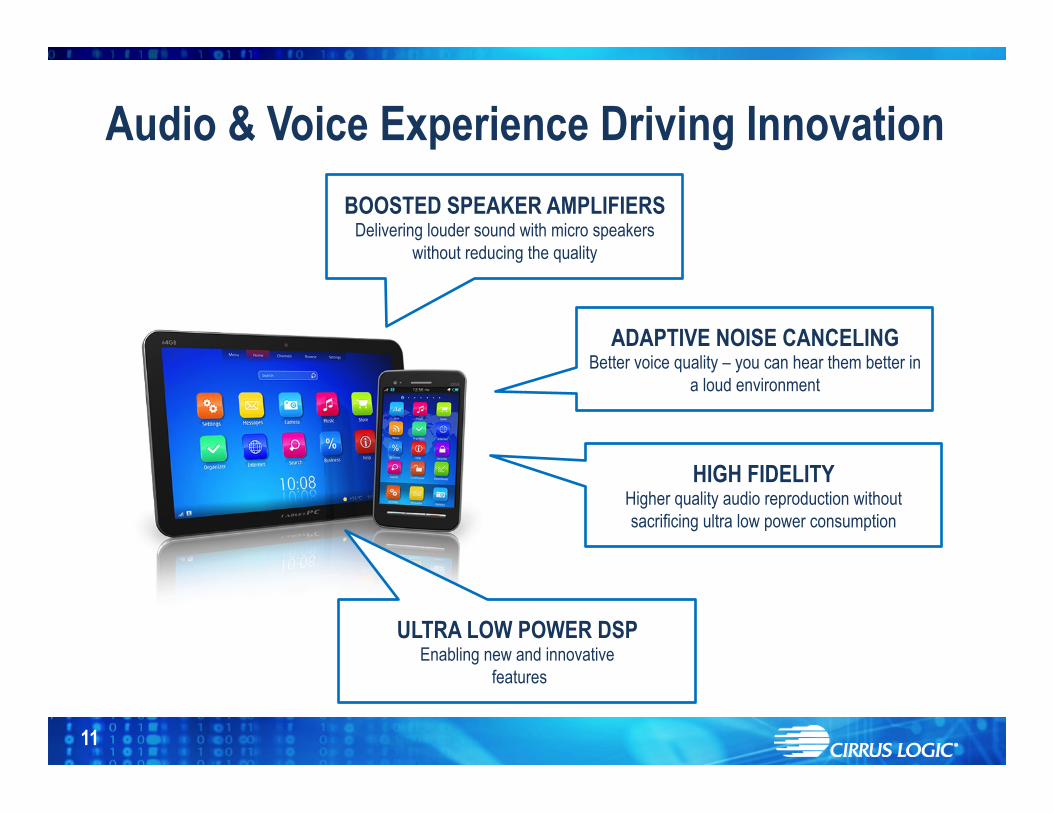
Audio & Voice Experience Driving Innovation
11
ULTRA LOW POWER DSP Enabling new and innovative
features
BOOSTED SPEAKER AMPLIFIERS Delivering louder sound with micro speakers
without reducing the quality
ADAPTIVE NOISE CANCELING Better voice quality – you can hear them better in
a loud environment
HIGH FIDELITY Higher quality audio reproduction without sacrificing ultra low power consumption
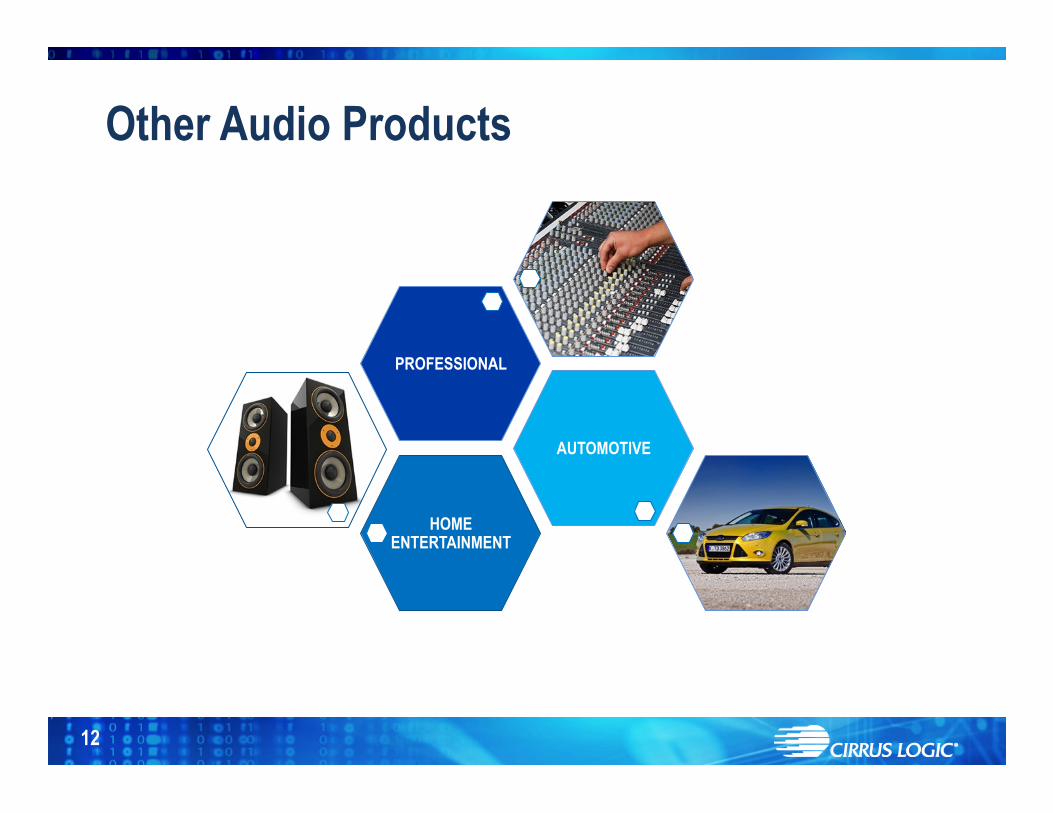
Other Audio Products
12
HOME ENTERTAINMENT
AUTOMOTIVE
PROFESSIONAL
13
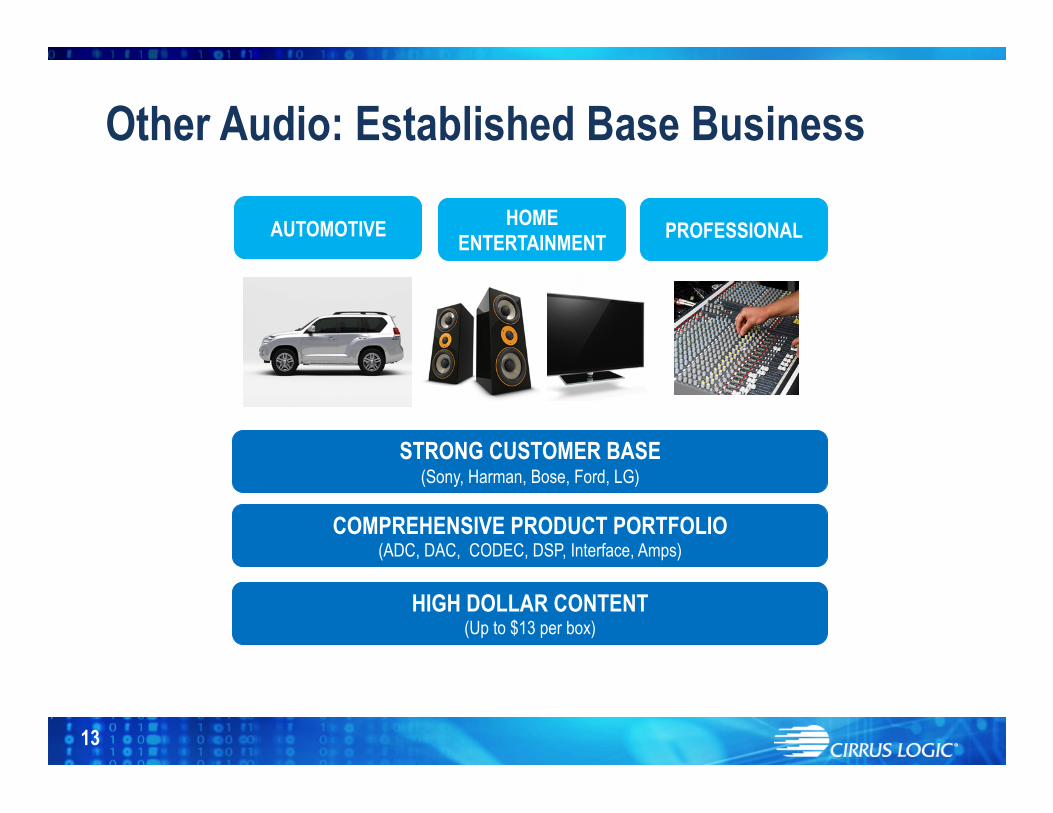
Other Audio: Established Base Business
HOME ENTERTAINMENT AUTOMOTIVE
STRONG CUSTOMER BASE
(Sony, Harman, Bose, Ford, LG)
COMPREHENSIVE PRODUCT PORTFOLIO (ADC, DAC, CODEC, DSP, Interface, Amps)
HIGH DOLLAR CONTENT (Up to $13 per box)
PROFESSIONAL
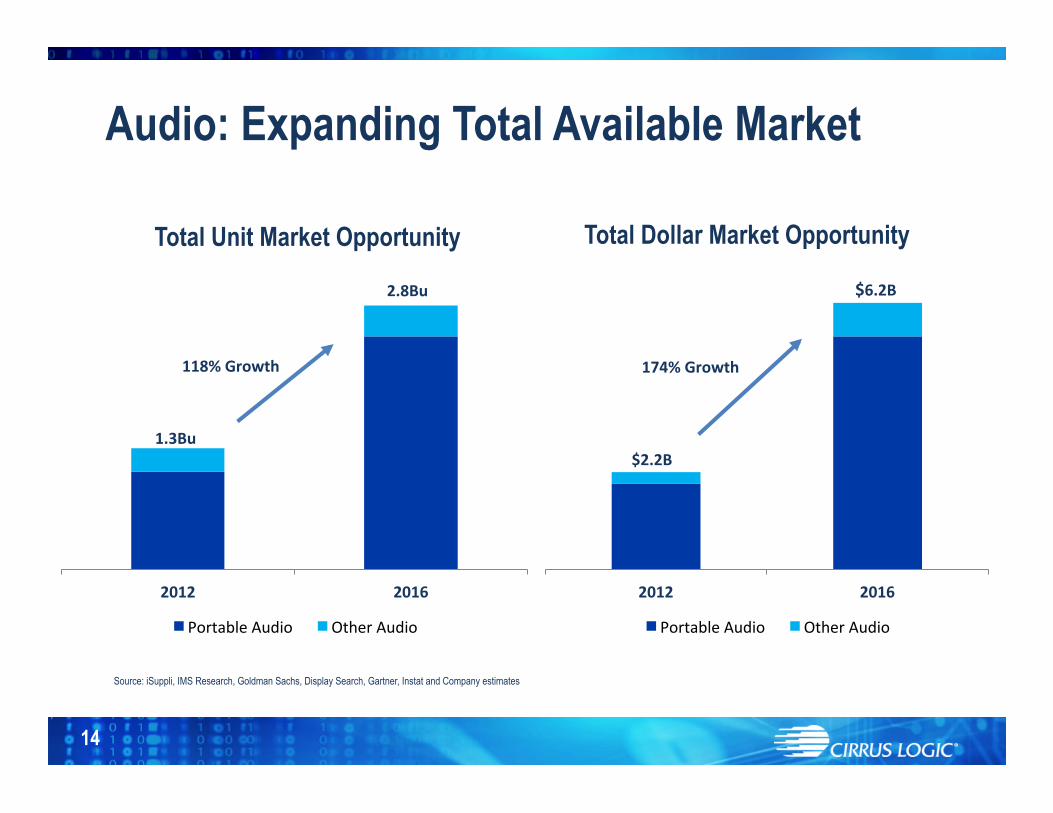
Audio: Expanding Total Available Market
14
Total Unit Market Opportunity
Total Dollar Market Opportunity
Source: iSuppli, IMS Research, Goldman Sachs, Display Search, Gartner, Instat and Company estimates
2012 2016
Portable Audio Other Audio
$6.2B
174% Growth
$2.2B
2012 2016
Portable Audio Other Audio
1.3Bu
2.8Bu
118% Growth

Cirrus Logic Advantage in Audio
15
STRONG IP PORTFOLIO TIER-ONE CUSTOMERS
FAST GROWING MARKETS ENGINEERING EXECUTION

16
ENERGY
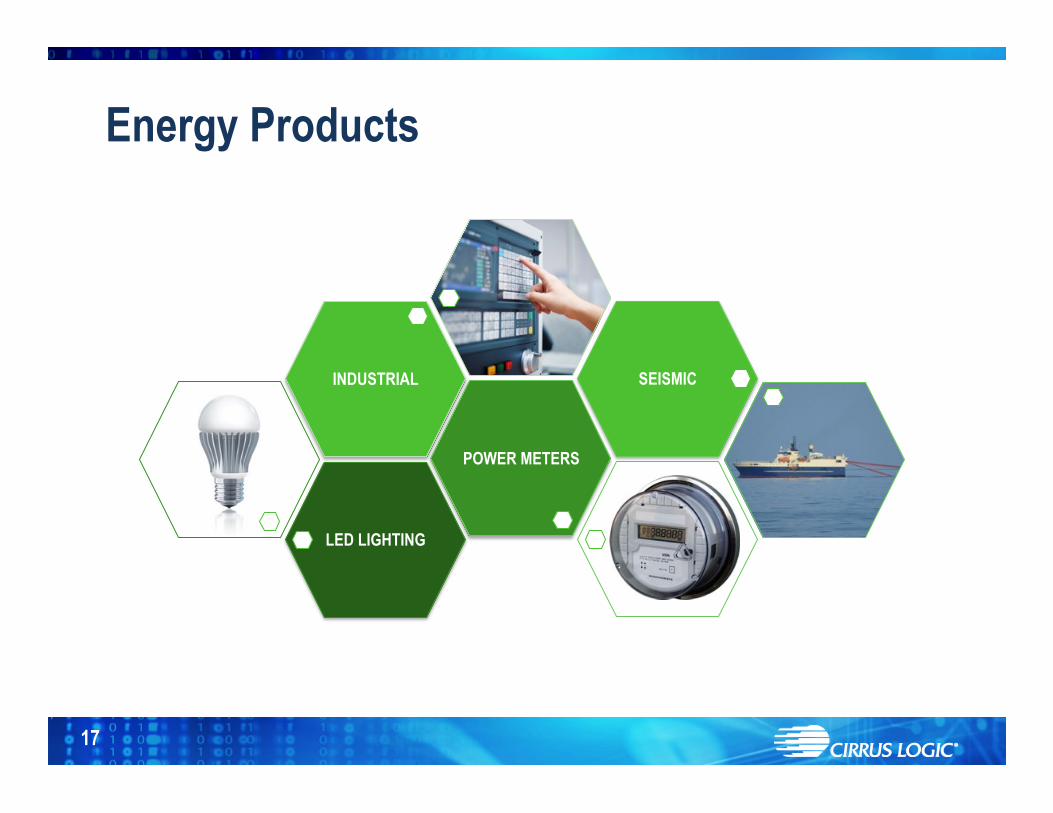
Energy Products
17
LED LIGHTING
POWER METERS
INDUSTRIAL SEISMIC
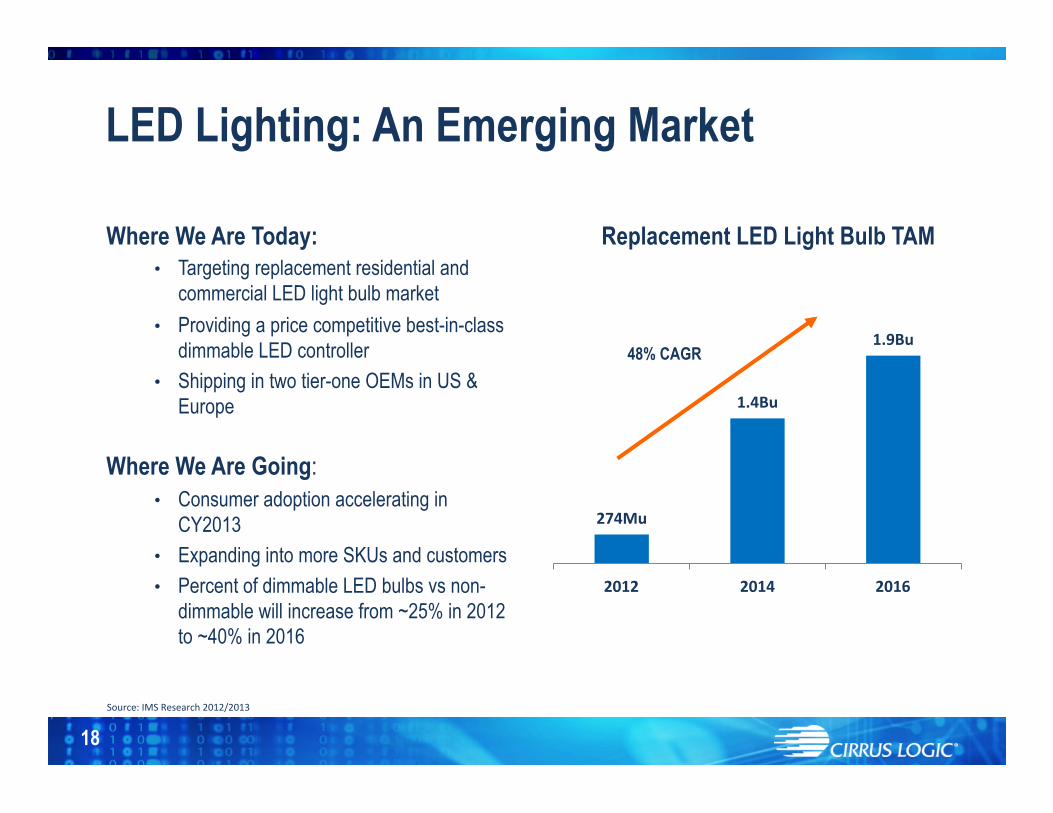
274Mu
1.4Bu
1.9Bu
2012 2014 2016
18
LED Lighting: An Emerging Market
48% CAGR
Replacement LED Light Bulb TAM
Source: IMS Research 2012/2013
Where We Are Today: • Targeting replacement residential and
commercial LED light bulb market • Providing a price competitive best-in-class
dimmable LED controller • Shipping in two tier-one OEMs in US &
Europe Where We Are Going:
• Consumer adoption accelerating in CY2013
• Expanding into more SKUs and customers • Percent of dimmable LED bulbs vs non-
dimmable will increase from ~25% in 2012 to ~40% in 2016

19
Key Issue: LED Dimmer Compatibility
Installed Base: +500M Worldwide
Standards: None
Different types: +1000 Worldwide
Incompatibility Issues:
High Product Returns: Impact OEM Brand
Slows Market Adoption
Flickering Light No Light No Dimming
Limited Dimming Range Inability to Turn On and Off

LED is the Future of Lighting
20
Cirrus Logic Advantage • Tested on over 200 dimmers: 98%
compatible • Better dimmer compatibility: less
flicker, good dimming range • Enables warm, natural light quality
across the dimming curve similar to an incandescent bulb
• Programmable platform • Extensive IP portfolio
SMALLER FOOTPRINT Reducing the cost delta of dimming vs. non-dimming
EXPANDING MARKET Flexible programmable
platform for other markets: MR16’s, commercial
and tubes
“INTELLIGENT” LED CONTROLLER Digital controller in the bulb recognizes type of dimmer

21
Cirrus Logic in Smart Meters
HIGH ACCURACY, LOW COST ANALOG FRONT END
FOCUS ON MARKET LEADERS
EXPANDING INTERNATIONAL FOOTPRINT
FLEXIBLE ARCHITECTURE ENABLES USE IN OTHER
SMART GRID APPLICATIONS

22
FINANCIALS
23
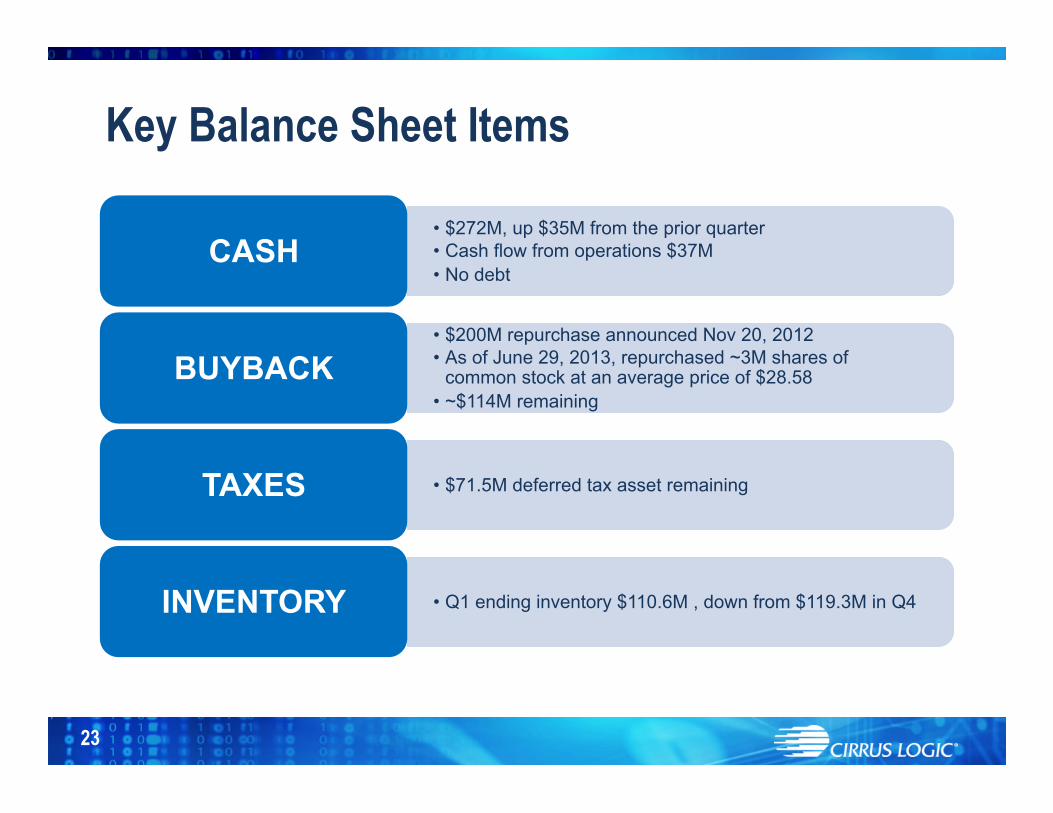
Key Balance Sheet Items
• $272M, up $35M from the prior quarter • Cash flow from operations $37M • No debt
CASH
• $200M repurchase announced Nov 20, 2012 • As of June 29, 2013, repurchased ~3M shares of
common stock at an average price of $28.58 • ~$114M remaining
BUYBACK
• $71.5M deferred tax asset remaining TAXES
• Q1 ending inventory $110.6M , down from $119.3M in Q4 INVENTORY
0
5
10
15
20
25
30
35
40
45
50
Q1/FY12
Q2/FY12
Q3/FY12
Q4/FY12
Q1/FY13
Q2/FY13
Q3/FY13
Q4/FY13
Q1/FY14
SG&A
R&D
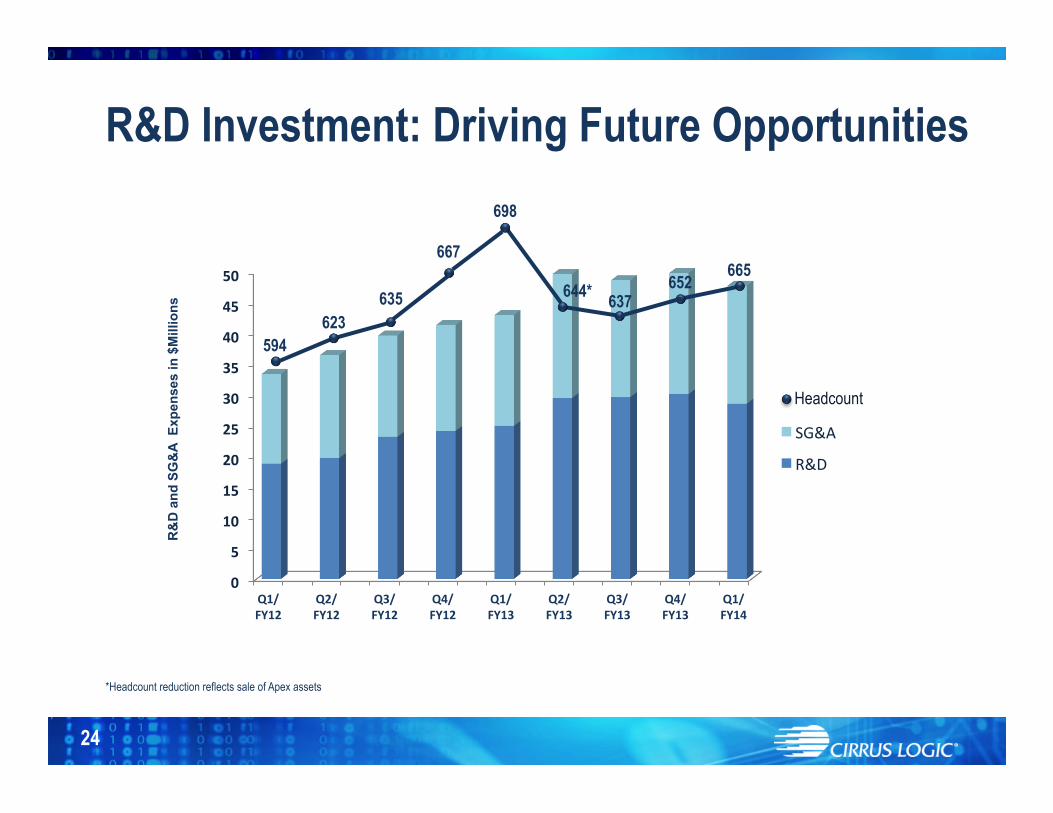
R&D Investment: Driving Future Opportunities R
&D
and
SG
&A
Exp
ense
s in
$M
illio
ns
667
623 635
594
644*
Headcount
698
665
637
*Headcount reduction reflects sale of Apex assets
652
24
25
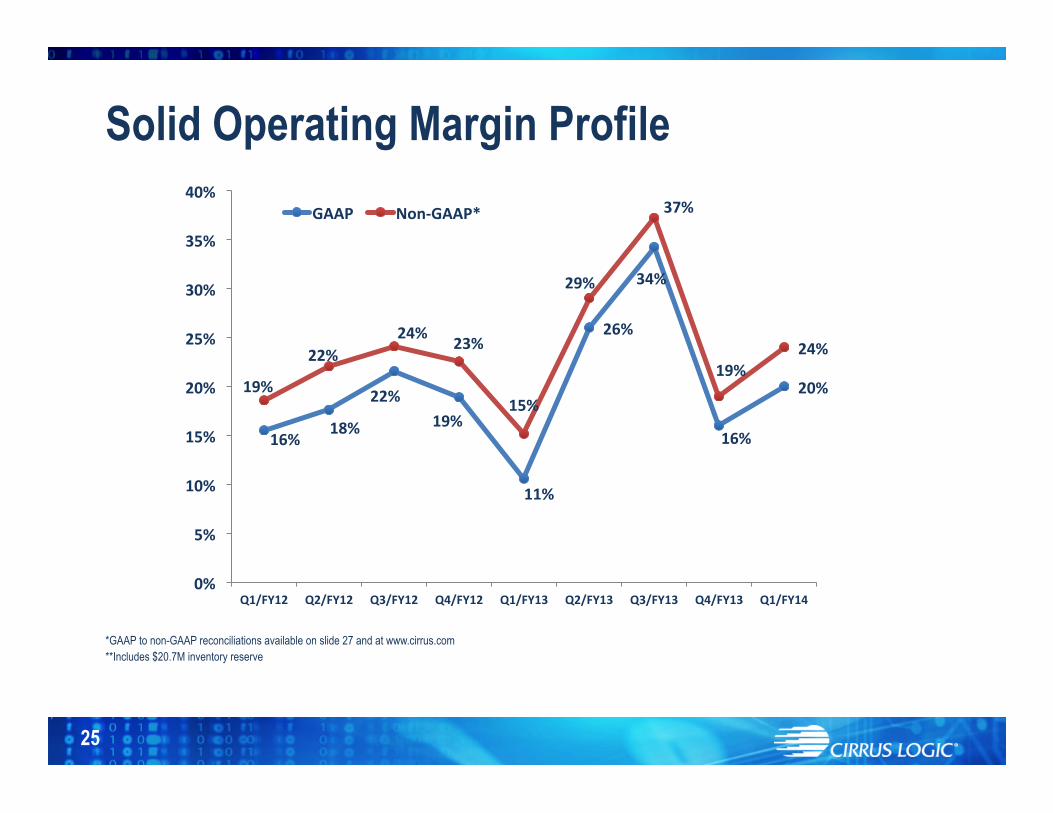
Solid Operating Margin Profile
*GAAP to non-GAAP reconciliations available on slide 27 and at www.cirrus.com **Includes $20.7M inventory reserve
16% 18%
22% 19%
11%
26%
34%
16%
20% 19%
22% 24% 23%
15%
29%
37%
19% 24%
0%
5%
10%
15%
20%
25%
30%
35%
40%
Q1/FY12 Q2/FY12 Q3/FY12 Q4/FY12 Q1/FY13 Q2/FY13 Q3/FY13 Q4/FY13 Q1/FY14
GAAP Non-‐GAAP*
Q1/FY13
Q2/FY13
Q3/FY13
Q4/FY13
Q1/FY14
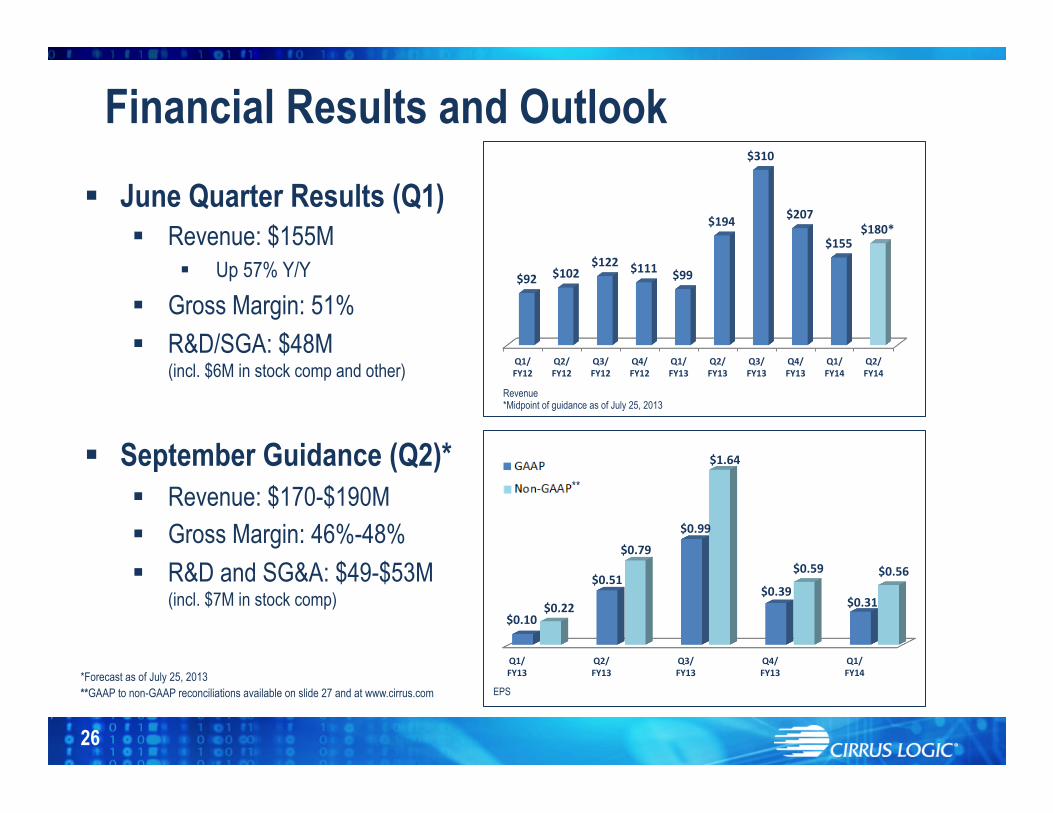
$0.10 $0.22
$0.51
$0.79
$0.99
$1.64
$0.39
$0.59
$0.31
$0.56
§ June Quarter Results (Q1) § Revenue: $155M
§ Up 57% Y/Y
§ Gross Margin: 51% § R&D/SGA: $48M
(incl. $6M in stock comp and other)
§ September Guidance (Q2)*
§ Revenue: $170-$190M
§ Gross Margin: 46%-48% § R&D and SG&A: $49-$53M
(incl. $7M in stock comp)
*Forecast as of July 25, 2013 **GAAP to non-GAAP reconciliations available on slide 27 and at www.cirrus.com
26
Financial Results and Outlook
Revenue *Midpoint of guidance as of July 25, 2013
EPS
**
Q1/FY12
Q2/FY12
Q3/FY12
Q4/FY12
Q1/FY13
Q2/FY13
Q3/FY13
Q4/FY13
Q1/FY14
Q2/FY14
$92 $102 $122 $111 $99
$194
$310
$207
$155 $180*
27
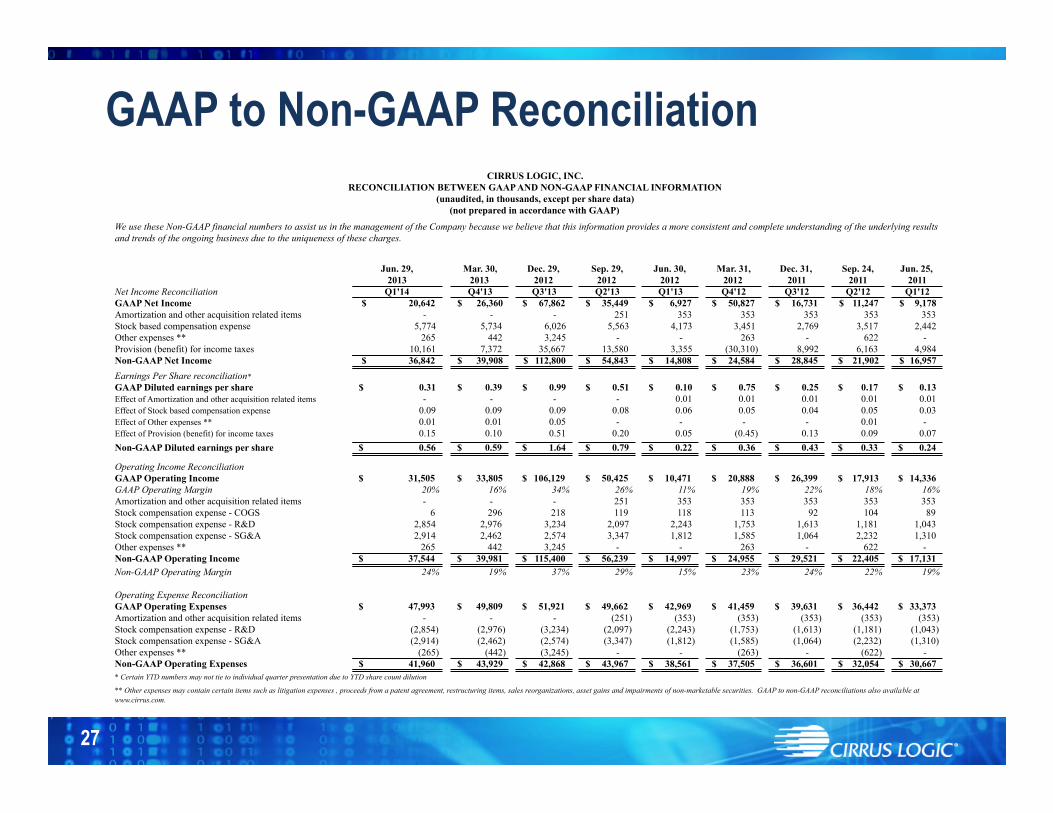
GAAP to Non-GAAP Reconciliation
Net Income ReconciliationGAAP Net IncomeAmortization and other acquisition related itemsStock based compensation expenseOther expenses **Provision (benefit) for income taxes
We use these Non-GAAP financial numbers to assist us in the and trends of the ongoing business due to the uniqueness of th
R
Jun. 29, Mar. 30, Dec. 29, Sep. 29, Jun. 30, Mar. 31, Dec. 31, Sep. 24, Jun. 25,2013 2013 2012 2012 2012 2012 2011 2011 2011
Q1'14 Q4'13 Q3'13 Q2'13 Q1'13 Q4'12 Q3'12 Q2'12 Q1'1220,642$ 26,360$ 67,862$ 35,449$ 6,927$ 50,827$ 16,731$ 11,247$ 9,178$
- - - 251 353 353 353 353 353 5,774 5,734 6,026 5,563 4,173 3,451 2,769 3,517 2,442
265 442 3,245 - - 263 - 622 - 10,161 7,372 35,667 13,580 3,355 (30,310) 8,992 6,163 4,984
CIRRUS LOGIC, INC.
management of the Company because we believe that this information provides a more consistent and complete understanding of the underlying results hese charges.
RECONCILIATION BETWEEN GAAP AND NON-GAAP FINANCIAL INFORMATION(unaudited, in thousands, except per share data)
(not prepared in accordance with GAAP)
Non-GAAP Net IncomeEarnings Per Share reconciliation*GAAP Diluted earnings per shareEffect of Amortization and other acquisition related itemsEffect of Stock based compensation expenseEffect of Other expenses **Effect of Provision (benefit) for income taxes
Non-GAAP Diluted earnings per share
Operating Income ReconciliationGAAP Operating IncomeGAAP Operating MarginAmortization and other acquisition related itemsStock compensation expense - COGSStock compensation expense - R&DStock compensation expense - SG&AOther expenses **Non-GAAP Operating IncomeNon-GAAP Operating Margin
Operating Expense ReconciliationGAAP Operating ExpensesAmortization and other acquisition related itemsStock compensation expense - R&DStock compensation expense - SG&AOther expenses **Non-GAAP Operating Expenses* Certain YTD numbers may not tie to individual quarter presentation due to Y
36,842$ 39,908$ 112,800$ 54,843$ 14,808$ 24,584$ 28,845$ 21,902$ 16,957$
0.31$ 0.39$ 0.99$ 0.51$ 0.10$ 0.75$ 0.25$ 0.17$ 0.13$ - - - - 0.01 0.01 0.01 0.01 0.01
0.09 0.09 0.09 0.08 0.06 0.05 0.04 0.05 0.03 0.01 0.01 0.05 - - - - 0.01 - 0.15 0.10 0.51 0.20 0.05 (0.45) 0.13 0.09 0.07 0.56$ 0.59$ 1.64$ 0.79$ 0.22$ 0.36$ 0.43$ 0.33$ 0.24$
31,505$ 33,805$ 106,129$ 50,425$ 10,471$ 20,888$ 26,399$ 17,913$ 14,336$ 20% 16% 34% 26% 11% 19% 22% 18% 16%- - - 251 353 353 353 353 353
6 296 218 119 118 113 92 104 89 2,854 2,976 3,234 2,097 2,243 1,753 1,613 1,181 1,043 2,914 2,462 2,574 3,347 1,812 1,585 1,064 2,232 1,310
265 442 3,245 - - 263 - 622 - 37,544$ 39,981$ 115,400$ 56,239$ 14,997$ 24,955$ 29,521$ 22,405$ 17,131$
24% 19% 37% 29% 15% 23% 24% 22% 19%
47,993$ 49,809$ 51,921$ 49,662$ 42,969$ 41,459$ 39,631$ 36,442$ 33,373$ - - - (251) (353) (353) (353) (353) (353)
(2,854) (2,976) (3,234) (2,097) (2,243) (1,753) (1,613) (1,181) (1,043) (2,914) (2,462) (2,574) (3,347) (1,812) (1,585) (1,064) (2,232) (1,310)
(265) (442) (3,245) - - (263) - (622) - 41,960$ 43,929$ 42,868$ 43,967$ 38,561$ 37,505$ 36,601$ 32,054$ 30,667$
YTD share count dilution
** Other expenses may contain certain items such as litigation expenses , proc www.cirrus.com.
ceeds from a patent agreement, restructuring items, sales reorganizations, asset gains and impairments of non-marketable securities. GAAP to non-GAAP reconciliations also available at
28