Embed Size (px)
Citation preview

C H I L D R E N ’ S L E A R N I N G I N S T I T U T E | | 7 0 0 0 F A N N I N , U C T 2 4 0 0 | H O U S T O N T E X A S 7 7 0 3 0 | ( 7 1 3 ) 5 0 0 - 3 7 0 9
CIRCLE (formerly C-PALLS+STEM)
The CIRCLE Phonological Awareness Language and Literacy
System + Science, Technology, Engineering & Math
Technical Manual
Susan H. Landry, Ph.D., Michael Assel, Ph.D., Jeffrey Williams, Ph.D.,
Tricia A. Zucker, Ph.D., Paul R. Swank, Ph.D., Susan Gunnewig
Copyright © 2014 University of Texas Health Science Center
1

C H I L D R E N ’ S L E A R N I N G I N S T I T U T E | | 7 0 0 0 F A N N I N , U C T 2 4 0 0 | H O U S T O N T E X A S 7 7 0 3 0 | ( 7 1 3 ) 5 0 0 - 3 7 0 9
Overview
INSTRUMENT DESCRIPTION
The CIRCLE assessment is a revision of the Center for Improving the Readiness of Children for Learning and Education (CIRCLE) Phonological Awareness Language and Literacy System (CIRCLE, 2004) that now incorporates Science, Technology, Engineering and Math (STEM) skills. CIRCLE includes individually administered screening and progress monitoring measures designed to efficiently evaluate and monitor growth of preschool children’s school readiness skills. This section outlines the history and revisions to the measures, appropriate uses of the measures and descriptions of each subtest. The CIRCLE assessment system was developed by researchers at the Children’s Learning Institute (CLI). The Institute is located at the University of Texas Health Science Center-Houston. The goal of CLI is to be the pre-eminent source for proven clinical and educational programs covering early childhood through late teens. While several centers, including CIRCLE, came together to form the Children’s Learning Institute in 2003, our documented research represents work beginning in 1990.
Measurement Approach Our goals in developing the CIRCLE assessment were to provide classroom teachers with a user-friendly and psychometrically sound screening and progress monitoring tool. This is not a diagnostic or norm-referenced measure. It is a standardized, criterion-referenced measure to screen and monitor preschool children’s learning. We ensured all CIRCLE measures met the following design criteria:
Progress monitoring (PM) measures should inform instructional practices
Measures contained within a PM system should be reliable and valid predictors of the underlying construct being measured
The time required to complete PM measures should be short
Areas assessed within the PM measure should be clearly linked to important educational constructs
In other words, the CIRCLE system was designed to put information about children’s early language, literacy, math and science skills into the hands of teachers in the classroom. Teachers benefit from the technology-based administration and scoring features that make data interpretation and usage efficient and effective. This manual provides information about the development of the CIRCLE, general administration instructions, interpretive guidelines, and psychometric properties of individual subtests (i.e. reliability and validity studies conducted in several studies in recent years).
The CIRCLE system of screening measures allow teachers to efficiently identify struggling learners and plan small group instruction for students with similar learning needs. As such, the CIRCLE system has been used by schools and researchers (e.g., Buysse & Peisner-Feinberg, 2010) interested in using multi-tiered instructional models or Response to Intervention (RTI) approaches. The entire system contains eight subtests in the following domains:
Literacy measures consist of a one-minute letter naming subtest and a phonological awareness subtest that takes approximately 7 minutes to complete, and two observational checklists of early writing and book/print knowledge
Language is measured with a one-minute vocabulary subtest
Mathematics skills are measured with 27 items that requires approximately 5 minutes
2

C H I L D R E N ’ S L E A R N I N G I N S T I T U T E | | 7 0 0 0 F A N N I N , U C T 2 4 0 0 | H O U S T O N T E X A S 7 7 0 3 0 | ( 7 1 3 ) 5 0 0 - 3 7 0 9
Science and engineering knowledge is measured with 21 items, requiring about 5 minutes
Social and emotional skills, as well as approaches to learning, is measured with a observational checklist
Importantly, all of these skills and abilities are measured using software that automatically scores the assessments for each child, develops ability level groupings, and recommends suggested activities for small group instruction.
Development and History of CIRCLE Much of our early work in early childhood settings occurred in Head Start agencies across the state of Texas when assessment of young children was less common. Over the past decade, we have provided professional development and training on monitoring young children’s skills to thousands of teachers across the country in Head Start, public school pre-K programs, and daycare settings. Whenever we initiated new professional development (PD) activities we have strived to evaluate the effectiveness of these efforts (e.g., Landry, Anthony, Swank & Monsegue-Bailey, 2009, Journal of Educational Psychology). Our training efforts have stressed aspects of early language, literacy, mathematics and science knowledge that have been proven to lead to positive academic outcomes for children. The design of most of our PD activities included researcher assessments of the children at the beginning and end of the school year to determine if the PD activities were successful in impacting children’s early literacy and language skills. While the utilization of child assessments within a pre- and post-test design allowed for an evaluation of the effectiveness of the teacher training activities, these types of research evaluations do not provide a teacher with information about the skills of individual children within a classroom. During our early work with early childhood teachers, it became clear that teachers needed access to information about the early literacy and math skills of children enrolled in classrooms. The only way to accomplish these goals was through the use a screening and progress monitoring system that met our design criteria of: a) informing instructional practice, b) reliable and valid predictors of child outcomes, and c) relatively brief administration time required.
Therefore, the CIRCLE system was developed by the staff of the Children’s Learning Institute to meet these instructional needs. We have collaborated with various software developers (e.g., Wireless Generation/Amplify, Tango Solutions, Teachscape) to provide the CIRCLE system in electronic format. In the early years of development, teachers scored child responses on personal digital assistants (i.e., PDAs) while administering the test with a flipbook. Currently, test administration and scoring is entirely electronic and available for a variety of devices including personal computers, laptops and tablets. Importantly, even the earliest versions of CIRCLE system provided instant tracking and tabulating of child scores on the progress monitoring measures, grouping children into ability levels, and most importantly providing teachers with suggested activities to address a child’s area of weakness.
Within this manual, we refer to the original version of this assessment system as C-PALLS, which contained only language and literacy subtests. In 2008, a Math Subtest was added to C-PALLS; at this time, the plus was added to name of the system (C-PALLS+) to indicate the addition of the math subtest. The Science, Technology and Engineering subtest was released in early 2014 and the new measure is referred to as C-PALLS+STEM.
3

C H I L D R E N ’ S L E A R N I N G I N S T I T U T E | | 7 0 0 0 F A N N I N , U C T 2 4 0 0 | H O U S T O N T E X A S 7 7 0 3 0 | ( 7 1 3 ) 5 0 0 - 3 7 0 9
Overview of this Technical Manual This manual was designed primarily to answer questions about the technical specifications of the measures contained within the CIRCLE system. Users who purchase the system from vendors licensed to market the system receive training and materials specific to the computerized platform produced by the Children’s Learning Institute in conjunction with software developers. Specifically, individuals who purchase systems from Amplify (i.e., Wireless Generation) are provided with a Quick Reference Guide (i.e., QRG) that details not only administration instructions but instructions about how to access the benefits of the computerized assessment system (e.g., producing reports, classroom summaries, etc.). Therefore, in depth discussion of administration instructions within this document would be redundant. However, as it is expected that this document will be provided to potential customers who might be considering purchasing the system, task demands and administration instructions will be summarized briefly for each subtest within the next section. Following a brief description of each measure, the manual will present information about the process that was used for development of cut scores that are used to determine ability level groupings for children. Reliability and validity information is also provided in the latter sections of the manual.
Age Ranges CIRCLE was designed to be used as a progress monitoring system within early childhood
education settings (e.g., Head Start, Public School Pre-Kindergarten Programs and Childcare). As there is an increasing national trend of younger children entering into preschool programs and Head Start, efforts were made to ensure that measures could accurately be administered to children who are at least 3.5 years of age. Use of CIRCLE for a younger 3 year old child (e.g., 3 years to 3 years, 5 months) is not recommended. In fact, analyses that were used to develop cut scores were excluded children who were less than 3 years, 6 months of age.
Using CIRCLE with Special Populations CIRCLE was not designed or evaluated for use for children with disabilities (e.g., language delays, Autistic Spectrum Disorders, or Intellectual Disabilities). Additionally, it is progress monitoring assessment, not a diagnostic test. Therefore, it should not be used to make determinations about whether or not children should be enrolled in Special Education. At best, data from CIRCLE could be used to help school officials make a determination about whether or not a child should be referred for a more comprehensive evaluation. For instance, if a child does not socially engage with peers or teachers, is not able to follow simple verbal instructions (even though the teacher is speaking in the same language that is used in the home), AND is not able to complete more than a few CIRCLE items, this information can be presented to the school administration as documentation that this the child would benefit from a more comprehensive evaluation. To summarize, it might be appropriate to use CIRCLE in determining if a referral for a comprehensive evaluation is indicated. To date, there is not enough information to allow us to determine if CIRCLE could effectively be used as part of an Individualized Educational Plan (IEP) for young children.
General Administration Guidelines Progress monitoring activities should be pleasant and enjoyable for children.
4

C H I L D R E N ’ S L E A R N I N G I N S T I T U T E | | 7 0 0 0 F A N N I N , U C T 2 4 0 0 | H O U S T O N T E X A S 7 7 0 3 0 | ( 7 1 3 ) 5 0 0 - 3 7 0 9
When completing any standardized assessment, following the scripts verbatim is extremely important.
It is also important to complete all sample items. Sample items on the PA subtest provide key information that can help children understand task demands (e.g., providing definitions and examples of when words sound the “same” or “different”.
Make an effort to ensure that progress monitoring assessments are completed in a work space that is comfortable and relatively quiet.
Prior to administering individual items, make sure that children are paying attention. Gentle reminders that pull for attention (e.g., “look at me”) are often effective at helping children regulate their attentional resources.
Teachers are also encouraged to monitor their vocal tone and volume during the progress monitoring assessments. For example, in the Listening and Rhyming sections of the PA Subtest, it is important for teachers annunciate clearly.
Progress monitoring assessments are not a time to teach children.
Keep progress monitoring materials (i.e., manuals, flipbook) in a safe and secure location. Do not allow children access to materials during the school day.
The Rapid Vocabulary Naming and Rapid Letter Naming subtests have clearly specified time limits (i.e., one minute). It is critical that time limits are strictly adhered to during these subtests. In addition, the Rapid Vocabulary and Rapid Letter Naming subtests have clearly specified rules for when to move on to the next item (i.e., see administration notes below).
Administer all items at each progress monitoring session.
If a child is unclear about expectations, feel free to repeat the item. When repeating an item, please read the script in the manual. A good rule of thumb is that teachers should not repeat items more than two times. For example, if a child appears confused or hesitant after you have read an item 1-time, feel free to reread the item once more (for a total of two times). If the child still does not provide a response, move on to the next item (e.g., “OK, let’s try another one”).
Please do not offer hints or potential strategies to children.
Children should be allowed to have some access to the materials. This is especially important when completing the Math Subtest. For example, if they are completing the last item of the Math Subtest (i.e., 5 butterflies and 2 fly away) they should be allowed, but not encouraged, to cover 2 butterflies and count the remaining butterflies. The problem solving strategy used by the child will provide you information about a child’s ability to solve problems abstractly versus a more concrete problem solving approach.
5

C H I L D R E N ’ S L E A R N I N G I N S T I T U T E | | 7 0 0 0 F A N N I N , U C T 2 4 0 0 | H O U S T O N T E X A S 7 7 0 3 0 | ( 7 1 3 ) 5 0 0 - 3 7 0 9
Description of Individual Subtests of CIRCLE
Phonological Awareness Subtest Research within early childhood classrooms has consistently shown that one of the key predictors of a child’s reading skills in kindergarten and beyond is phonological processing skills. In a general sense, phonological awareness skills include a child’s ability to detect and manipulate sounds within spoken language (e.g., identification of words that rhyme, blending, and elision). Children make progress in phonological awareness skills over the course of the school year and this progress usually follows a predictable path. That is, children are much better able to manipulate and understand large and concrete units of sound (e.g., compound words) prior to understanding how to manipulate smaller sounds (phonemes). Research over the last two decades has shown that phonological awareness skills are a strong predictor of early reading abilities (e.g., Adams, 1990; Anthony, Lonigan et al., 2002, 2003; Lonigan et al., 2000; MacLean et al., 1987; Storch & Whitehurst, 2002).
The Phonological Awareness Subtest (PA Subtest) evaluates a child’s skills in the following areas; 1) Listening, 2) Rhyme Recognition, 3) rhyme production, 4) Alliteration, 5) the ability to detect individual words within sentences, 6) the ability to separate words into syllables and onset rime. Individual sections of the PA Subtest will be described below.
I. Listening
The Listening section of the PA Subtest contains 5 items that evaluate whether a child can differentiate between similar sounding words. All of the subtests contained within the PA Subtest include a sample item. For example, the Listening subtest provides children with the following instructions:
I am going to say two words. Tell me if they are the same words or not. If you hear “car…car,” you say “yes;” they are the same word. If you hear “car…toy,” you say “No;” they are not the same.
Following administration of the sample items, teachers say a pair of words and ask children to say “yes” if the words are same and “no” if the words are not the same. In order to reduce the influence of verbal memory skills on the Listening subtest, children are first asked to repeat each word pair. Younger children (e.g., 3 years, 6 months) occasionally struggle with this task due to the fact that they do not understand the concept of “sameness”. Teachers should feel free to attempt to explain the concept of “sameness” during administration of sample items. However, once test items are started in earnest, teachers should administer the task as indicated (provide no additional assistance to children as they attempt to complete specific items). Teachers using the CIRCLE system should also recognize that children who are somewhat hesitant to answer should be encouraged to make an attempt to answer all questions (e.g., it’s OK to guess). This is important due to the fact that some of the items of the PA subtest have a chance component (i.e., Listening, Rhyming 1). Therefore, random responses (e.g., when a child says that none of word pairs sound the same or all of the word pairs sound the same should be scored). Teachers should also recognize that if children in their classrooms are struggling understanding the concept of “sameness” small group or individual activities can be developed to increase understanding of the language inherent in the measure.
6

C H I L D R E N ’ S L E A R N I N G I N S T I T U T E | | 7 0 0 0 F A N N I N , U C T 2 4 0 0 | H O U S T O N T E X A S 7 7 0 3 0 | ( 7 1 3 ) 5 0 0 - 3 7 0 9
II. Rhyming Part 1
The Rhyming 1 subtest of the PA Subtest contains 9 items that evaluate whether a child can identify whether or not two words rhyme. The subtest utilizes procedures that are very similar to the Listening subtest. The subtest begins with the following sample item.
I am going to say two words, then I would like for you to say the words and tell me if they rhyme? Are you ready? Practice: Teacher says: “cat… mat”. Child repeats: “cat… mat”. Teacher says: Do these words rhyme? Child responds with yes or no. If child responds correctly, say Good job, “cat” and “mat” do rhyme. Let’s try some other words. If the child responds incorrectly, say Good try, but “cat” and “mat” do rhyme or sound the same. In the Rhyming Part 1 subtest, teachers should spend an adequate time on the sample item to help ensure that children understand task demands. Like the Listening subtest, children who are unsure of an answer should be encouraged to guess. Children who struggle completing the subtest should NOT be provided help during the actual test administration. However, teachers would be encouraged to work on helping children understand how to differentiate rhyming words during appropriate small and large group activities.
III. Rhyming Part 2
The Rhyming Part 2 subtest is a production task, where children are asked to provide a word that rhymes with another word. There are 5 test items in this section of the measure. A sample item is also provided for the task (shown below).
Now, let’s play another rhyming game. I’m going to say a word like “frog.” Teacher should ask the child to repeat the word. You say “Frog”. Wait for child’s response. Now I would like for you to name a word that rhymes with “frog.” Practice 2: “can” You say “can”. Now name a word that rhymes with can. If the child responds correctly, say Good job. rhymes with can. If the child responds incorrectly, say… That was a good try, but “man” is a word that rhymes with can”.
In general, rhyme production activities are somewhat harder than making a determination of whether or not word pairs sound the same or rhyme. This will likely lead to instances when children respond to a directive (e.g., Now name a word that rhymes with can) by saying something to the effect of “I don’t know”. As a general rule, when students say, “I don’t know”, encourage children to guess. If the child is unable to provide a word spontaneously after a guess is encouraged, teachers should move on to the next item. However, children should be encouraged to answer every question.
7

C H I L D R E N ’ S L E A R N I N G I N S T I T U T E | | 7 0 0 0 F A N N I N , U C T 2 4 0 0 | H O U S T O N T E X A S 7 7 0 3 0 | ( 7 1 3 ) 5 0 0 - 3 7 0 9
IV. Alliteration
The Alliteration subtest is another task that asks children to provide a “yes” or “no” answer to whether or not a pair of words start with the same sound. This subtest contains a sample item and 7 test items. The sample item provides feedback for teachers to provide to children when they make a correct or incorrect response to the sample question.
I am going to say two words. Then I would like for you to say the words and tell me if they begin with the same sound” Practice: Teacher says the word pair. “silly, sun.” You say “silly, sun.” Child repeats the pair, “silly, sun”. Teacher says, Do these words begin with the same sound? Child responds. If the child responds correctly then the teacher should say Good job, “silly” and “sun” begin with the same sound. Let’s try some more. Teacher then moves on to the test items. If the child responds incorrectly or not at all, say “silly” and “sun” begin with the same sound.
As with previous subtests, teachers should encourage hesitant children to guess and provide no additional help or support to students once the sample item is completed.
V. Words in a Sentence
The Words in a Sentence subtest requires that teachers use simple manipulatives (e.g., single colored blocks, unifix cubes, counters, etc). In this task, children move the manipulatives to indicate how many words are in a sentence. Sentence length varies from two words to six words. The subtest contains on practice item and five test items. Most of the CIRCLE subtests can easily be administered in a variety of testing positions (e.g., sitting directly across from the child or sitting side by side). However, with the Words in a Sentence subtest, the best testing position is achieved by sitting directly across from the child. This position allows for a clear demonstration of moving blocks. In addition to sitting directly across from the child, teachers should ensure that they exaggerate block movements during sample items to ensure that the child understands what is expected. Like some of the previous subtests, teachers should have children repeat the sentence prior to attempting to segment the sentence. This reduces the impact of verbal memory demands on performance. Teachers should score each item by counting the number of blocks the child moved. In effect, the final number of blocks moved by the child is score. Children can receive credit for an item in the Words in a Sentence subtest without demonstrating accurate 1:1 correspondence in terms of the moving one block for each word. As this might seem somewhat counter-intuitive, an example is provided following the sample item. Teachers should put out a total of 8 blocks when presenting this task. In addition, blocks should be moved to the center of the work surface prior to beginning
8

C H I L D R E N ’ S L E A R N I N G I N S T I T U T E | | 7 0 0 0 F A N N I N , U C T 2 4 0 0 | H O U S T O N T E X A S 7 7 0 3 0 | ( 7 1 3 ) 5 0 0 - 3 7 0 9
each item. The sample item of the Words in a Sentence subtest of the PA Subtest includes the following procedures.
Teacher says, I am going to say a sentence and I am going to move my counters to show how many words are in the sentence.” “I like soup.” Teacher moves the three counters as she repeats the sentence. Ask the child to repeat the next sentence and move his/her counters. Now you are going to try the next one. Listen to this sentence and repeat it to me, “My books are new”. You say it. Child repeats the sentence, “My books are new.” Now move a block for each different word you hear in “My books are new”. NOTE: It is acceptable to have the child repeat the task one additional time to reinforce the concept. NOTE: Remember to have the child repeat the sentence prior to attempting to move the blocks. This ensures that the child has heard the sentence accurately.
Note: Score only the final number of blocks moved by the child. For example for the sentence “Mother reads to me”, a child might move two blocks while saying the word “Mother” and two blocks while saying “reads to me” (i.e., a total of 4 blocks moved). In this example the child moved 4 blocks and would receive credit for the item, even though they did not move one block for each specific word.
VI. Syllabication
In the Syllabication subtest, children are asked to demonstrate knowledge of how words can be broken down into syllables. There are 7 test items, as well as sample procedures. In the administration manual (i.e., flip book), teachers are encouraged to have the children clap syllables. This decision was made due to the fact that syllable clapping is fairly common in many preschool settings. However, teachers should feel free to adapt the specific procedure to methods that have been used in their classrooms. For instance, another perfectly acceptable way to evaluate this skill is by asking children to “move a block for each part of the word you hear” while some classroom teachers ask children to provide a number to indicate the syllable count. Sample item procedures for the Syllabication subtest are presented below.
Practice: Teacher says: We are going to play a clapping game. You can clap the word parts. I will say a word and you will say the word again while clapping it. I will play the first while you watch. How many parts do you hear in “/cow/ /boy/?” (clap two times while saying the word in two parts). Child should say cowboy while clapping twice, or say “2.” Practice as necessary to reinforce concept.
VII. Onset-Rime
Onset-Rime subtest of the PA subtest includes a sample item and five test items. This subtest evaluates one of the key components of phonological processing (i.e., blending) within single syllable words. Teachers should ensure that they utilize a one second gap between each phoneme presented. In addition, a relatively quiet work environment is particularly important when administering this task. Teachers should ensure that children are attending to the stimulus and repeat the phonemes prior to
9

C H I L D R E N ’ S L E A R N I N G I N S T I T U T E | | 7 0 0 0 F A N N I N , U C T 2 4 0 0 | H O U S T O N T E X A S 7 7 0 3 0 | ( 7 1 3 ) 5 0 0 - 3 7 0 9
attempting to blend the sounds. The most common mistake made by teachers when administering this task is that they tend to rush the sounds. This can be avoided by utilizing a “slow down” strategy such as mentally saying “one thousand and one” prior to saying the second sound in each word (e.g., /hhh/ one thousand and one…., /at/). Practice: Teacher says, I am going to break up a word into sounds. Repeat these parts and then say the word I ammaking.” Practice: Teacher says “/m/ /om/” Child repeats and provides the word “mom.” If the child responds correctly say…. Good job /mmm…om/ make “mom” If the child responds incorrectly say… That was a good try, but /mmm…om/ makes “mom.” Let’s try some other words. NOTE: Make sure that there is a clean break between word sounds- approximately 1 second. NOTE: Please remember to keep a 1 second delay in between the parts of the word.
Rapid Letter Naming
Research has demonstrated that knowledge of the alphabet at school entry is a strong predictor of reading ability in subsequent grades (e.g., Adams, 1990; Stevenson & Newman, 1986). While it is recognized that children’s understanding of print conventions is important, letter knowledge and letter sound correspondence tend to be somewhat more predictive of reading skills in later grades when compared to a child’s understand of print conventions (e.g., text moves from right to left, how to hold a book, etc.). Therefore, a decision was made to include a letter naming task in CIRCLE. Additionally, increasing children’s skills on letter naming activities within the context of activities that improve phonological processing skills tends to lead to stronger reading abilities at kindergarten. In short, letter knowledge, phonological awareness skills, and general language abilities are some of the key building blocks of early reading skills (i.e., what some refer to as “the big three of reading of early reading”). In addition, preliminary research has indicated that the automaticity of letter recall is also important for reading skills. The CIRCLE system was developed to evaluate a child’s ability to name letters within a time sensitive format that would provide a measure of automaticity or speed of recall. This was accomplished in the Rapid Letter Naming task by introducing a time component. Specifically, the subtest evaluates the number of upper and lower case letters that a child can name in 60 seconds. In electronic administrations (e.g., laptop, desktop, netbook) the timing demands are controlled by the technology, making the task significantly less cumbersome to administer as compared to paper and pencil administrations. However, both the Rapid Letter Naming subtest and the Rapid Vocabulary Naming subtest require a fair amount of effort for teachers to administer accurately. For instance, there are 4 rules that must be remembered during the administration that will be described below. These rules were all developed to keep the task moving smoothly and ensure that children are provided with a variety of opportunities to demonstrate Letter Naming skills. Teachers should flip the page of the CIRCLE administration manual (i.e., flip book) when the following conditions occur.
a. Flip the page when the child correctly labels a letter b. Flip the page when the child says “I don’t know” c. Flip the page when the child provides an incorrect response d. Flip the page if the child makes no response within 3 seconds
10

C H I L D R E N ’ S L E A R N I N G I N S T I T U T E | | 7 0 0 0 F A N N I N , U C T 2 4 0 0 | H O U S T O N T E X A S 7 7 0 3 0 | ( 7 1 3 ) 5 0 0 - 3 7 0 9
Note: Electronic versions automatically advance when correct or incorrect answers are entered by the classroom teacher. These rules indicate that each child should be administered at least 18 letters during the task (i.e., turning a page without hesitation every three seconds would like to exposure to 20 letters). The computerized versions of the measure provide prompts to teachers to indicate when the page should be flipped. However, as the task cannot progress until the teacher turns the stimulus page for the child, teachers are ultimately in control of the pacing of the measure.
Rapid Vocabulary Naming
Research is clear about the links between children’s oral language skills and literacy. A report from The National Research Council (Snow et al., 1998) maintained that most reading problems could be prevented by, among other things, increasing children’s oral language skills, and the National Reading Panel (2000) concluded that “vocabulary is critically important in oral reading instruction.” Research supports these conclusions by demonstrating positive correlations between differences in oral language skills and later differences in reading (Bishop & Adams, 1990; Pikulski & Tobin, 1989). In general, children who have larger vocabularies and a greater understanding of spoken language have higher reading scores. The Rapid Vocabulary Naming subtest attempts to gain insight into a child’s expressive vocabulary skills.
The Rapid Vocabulary Naming subtest utilizes procedures that are very similar to those for the Rapid Letter Naming subtest of CIRCLE. Specifically, children’s vocabulary knowledge is evaluated within a timed format (i.e., 60 seconds) and there are rules for when teachers need to present a new stimulus picture. The images that children are asked to name were derived from evaluation of vocabulary words within multiple pre-Kindergarten curricula. While some of the words might be considered to be more difficult for 4 year old children to identify, items were included that mapped onto content presented in commercially available curricula. Unlike the Rapid Letter Naming subtest there are three separate sets of vocabulary items with 55 pictures in each set. Prior to the fall of 2014, procedures existed that allowed teachers to provide partial credit for child responses that are logically related to the picture presented but not included in the list of acceptable answers provided in the Quick Reference Guide (QRG). However, following a recent review of data and expansion of acceptable word choices, the partial credit option was removed. In other words, all responses are immediately scored as correct or incorrect. Another rule/guideline that teachers must consider when administering the measure is some pictures have multiple correct answers (e.g., chef, cook, cooking) which are also provided in the QRG. The Rapid Vocabulary Naming subtest also accepts multiple forms of word as correct (e.g., for a picture of a man running, correct responses could include run, running, or runner). In addition, children should not be penalized for poor articulation (e.g., “lawnmober” is said for lawnmower or “ippopotamus” is said for hippopotamus). This rule was adopted due to the fact that articulation errors are fairly common in young children. A general guideline in terms of pronunciation can be stated as follows: Give credit for the item if another reasonable person would easily be able to decipher that the child was correctly identifying the picture. Timing of page turning is also critical to correct administration of the Rapid Vocabulary Naming subtest. The following rules should be applied.
a. Flip the page when the child correctly labels a picture b. If the child says “I don’t know” c. If the child provides an incorrect response
11

C H I L D R E N ’ S L E A R N I N G I N S T I T U T E | | 7 0 0 0 F A N N I N , U C T 2 4 0 0 | H O U S T O N T E X A S 7 7 0 3 0 | ( 7 1 3 ) 5 0 0 - 3 7 0 9
d. If 3 seconds elapse Note: Electronic versions automatically advance when correct or incorrect answers are entered by the classroom teacher.
Math Subtest
Like reading, there are clear links between a child’s early math abilities and later math skills. The development of competence in the area of mathematics involves numerous skills (e.g., geometry, counting, patterning, operations, etc.). However, children’s ability to count sets tends to be one of the better predictors of math skills and is relatively easy to assess in pre- kindergarten aged children.
While CIRCLE was used successfully to evaluate the early literacy and language skills within classrooms since 2003, many school districts and individual program directors have asked that math content be included into CIRCLE. This led to development of the Math Subtest in 2008, with release in 2009. The Math Subtest was designed to be used at each time point. In other words, the same 27 items are administered 3 times over the course of a school year.
The Math Subtest evaluates child skills across multiple math content domains including….
Counting (Rote Counting and Counting Sets)
Shape Naming
Operations
Number Identification Shape Discrimination
Teachers who are familiar with math standards might recognize that some skills that are considered to be important by many math educators are not included (e.g., patterning). Patterning is definitely an important skill for pre-K math students. However, one of the goals driving development of the Math Subtest was ease of administration. Additionally, we determined that the format of the Math Subtest should be similar to the CIRCLE and wanted to ensure that all administration materials could be included in our CIRCLE STEM manual. We piloted multiple choice pattern items and determined that these items were inappropriate for pre-Kindergarten students (i.e., young children needed to have manipulatives to successfully complete pattern items). Therefore, pattern items were not included in the Math Subtest.
The Math Subtest is relative easy to administer and instructions for item administration are included on the administration manual (i.e., separate flip book) and also included on electronic devices.
Science, Technology, and Engineering Subtest
Exposing young children to science and engineering topics is expected to capitalize on their curiosity about the surrounding world while providing a foundation for future scientific learning in school. However, observational research demonstrates that early childhood teachers devote limited instructional time to science and engineering, perhaps in part due to the limited number of available measures for monitoring children’s knowledge in these areas.
12

C H I L D R E N ’ S L E A R N I N G I N S T I T U T E | | 7 0 0 0 F A N N I N , U C T 2 4 0 0 | H O U S T O N T E X A S 7 7 0 3 0 | ( 7 1 3 ) 5 0 0 - 3 7 0 9
This subtest was designed to measure four disciplinary core ideas in the National Research Council’s (2012) framework for science education including: • Physical Sciences • Life Sciences • Earth and Space Sciences • Engineering and Technology Applications of Science
We used an iterative process to design the science subtest that included detailed feedback from pre- kindergarten teachers and an examination of pre-k curricula and state standards for several states to guide our development of the final subtest items (see Zucker et al., 2014 for detailed procedures). The testing format uses two receptive item types. For each item, the child is presented asked a question and presented with color illustrations of three possible answer choices. For example, with a picture of a butterfly presented, the examiner would say: “This butterfly is all grown up. Which picture shows how it looked when it was young?”. The child points to one of three answer choices (A-a caterpillar; B-a chick; C-a tadpole) to respond and the examiner records the response.
After examining the psychometric properties of a large pool of items, a final set of 21 items were retained for the final measure. This measure estimates young children’s science and engineering knowledge using a format that can be administered in 5-7 minutes by classroom teachers.
13

C H I L D R E N ’ S L E A R N I N G I N S T I T U T E | | 7 0 0 0 F A N N I N , U C T 2 4 0 0 | H O U S T O N T E X A S 7 7 0 3 0 | ( 7 1 3 ) 5 0 0 - 3 7 0 9
Observable Behaviors Checklists
The CIRCLE Observables checklists are designed to assess growth in child behaviors that can be easily observed during day-to-day interactions between teachers and preschool students. Importantly, this checklist includes attention to social and emotional domains that are not assessed with the other direct measures in CIRCLE. Understanding these domains is important for early childhood educators interested in understanding the development of the whole child across cognitive and social skills.
Observables Checklist Areas The CIRCLE Observables checklists include three constructs:
Book and Print Concepts – 12 items
o Sample items: Author role (Tell me what the author does.); Letters versus words (Show me one letter.)
Early Writing Skills – 10 items o Sample items: Makes letter-like symbols; Writes own name with approximate letters
Social and Emotional skills-Checklist – 31 items The SES-C is a 30 item checklist that allows teachers to rate their students on multiple domains considered to be important predictors of early academic and social success. The SES-C was updated in 2013 from 7 items to 30 items. In order to provide teachers with an easy to use and developmentally appropriate checklist, a decision was made to utilize a 3-point rating scale described below. Preliminary reliability and validity information on the SES-C is presented at the end of the Technical Manual. SES-C subscales include:
Positive Social Behaviors (e.g., positive interactions with peers and adults, initiation of conversation with the classroom, assisting or comforting peers, acceptance of compromise following input from others).
Classroom Community & Safety (e.g., following class and school rules, compliance with adult requests, respect classroom materials and space of others, assistance with classroom jobs).
Emotion and Behavior Regulation (e.g., use of emotional words, beginning to understand feelings of others, ability to transition appropriately, appropriate expressions of anger/frustration, taking pride in accomplishments).
Self-Care (e.g., dressing and toileting independence and hygiene)
Attention (e.g., listening attentively during story time, concentration when working with classroom materials, persistence on challenging tasks, completing activities before moving on to a new activity).
Observation Procedures Teachers should use ongoing, systematic observations of children’s behaviors to complete the observables checklist form. In considering the rating for each item, teachers will evaluate whether a behavior is:
(1) Emerging – the child never or rarely demonstrates the behavior, (2) Developing – the child sometimes demonstrates the behavior, but it inconsistent or requires assistance, or (3) Proficient – the child consistently demonstrates the behavior.
Using a portfolio system or anecdotal note taking system can facilitate ratings for this assessment. 14

C H I L D R E N ’ S L E A R N I N G I N S T I T U T E | | 7 0 0 0 F A N N I N , U C T 2 4 0 0 | H O U S T O N T E X A S 7 7 0 3 0 | ( 7 1 3 ) 5 0 0 - 3 7 0 9
ENGLISH AND SPANISH CUT POINTS
The next section of this document provides information on that is built into the programming software that guides the administration of CIRCLE. Specifically, three sets of tables are presented that provide information on the logic underlying when to determine children are at risk for academic difficulties. In prior versions of the software platform, children scoring at a certain level on one section of the assessment (e.g., Rapid Letter Naming) were categorized as being in a certain grouping level (i.e., red, yellow, or green). Children who scored in the green category displayed higher scores within a certain area and were not deemed to be “at-risk”. In contrast, children who scored within the ‘red” group, were to be considered at risk for difficulties within the content area (e.g., Vocabulary, Letter Naming, or PA). Based upon the efforts of our statistical support team, a new conceptualization of cut scores has emerged. As a general rule, we have moved away from Red, Yellow, and Green groupings secondary to the fact that this structure occasionally produced anomalies. Specifically, we have always had a clear notion of children in the Red and Green Groups were performing over time. However, a great deal of variance in the performance of children in the Yellow group over time made it difficult to predict their performance. Therefore, we have moved to a system where we are providing one cut score. Those children who score below the cut point for a given area (e.g., Vocabulary) should be provided appropriate activities to encourage skill development. Children scoring above the specified cut score will continue to need work in subject areas but their teachers will receive a general prompt from the software encouraging the teacher to use appropriate extension activities. The Cut Points developed for our software platforms include some features that have to be understood by users. For instance, the PA subtest includes 7 separate tests (e.g., rhyming, onset-rime). The raw scores for each of the 7 small subtests are summed to yield an overall score. This “total PA score” is used to determine whether or not a child is struggling within the area of phonological awareness. This is based upon the fact that the overall score on the PA subtest is a much better indicator of a child’s potential in this area (as compared to individual subtest scores). However, as a child might score better in some areas as compared to others on subtests contained within the PA Subtest, suggestion of appropriate activities is based upon a child’s score on individual subtests.
15

C H I L D R E N ’ S L E A R N I N G I N S T I T U T E | | 7 0 0 0 F A N N I N , U C T 2 4 0 0 | H O U S T O N T E X A S 7 7 0 3 0 | ( 7 1 3 ) 5 0 0 - 3 7 0 9
CUT POINTS FOR RAPID VOCABULARY NAMING
Rapid Vocabulary Naming Cut Points
Age as of Sept1
3.5-<4 4-<4.5 4.5 or Above
Wave English Spanish English Spanish English Spanish
Beginning of Year 10 7 16 12 20 14
Middle of Year 11 8 19 14 22 16
End of Year 12 9 22 16 24 17
Notes: Cut points for Rapid Vocabulary Naming were determined following examination of data over a course of several years. Data was examined from ongoing CLI research projects, Texas School Ready Classrooms, public school Title 1 Pre-K programs, and state subsidized daycare programs serving 4 year old children. Children who scored below the cut point threshold should be considered to be at-risk in
terms of vocabulary development. Risk status was determined to be children who scored below the 16th
percentile. The cut points for students assessed with the Spanish version of CIRCLE are lower due to
the fact that the 16th percentile was lower for this group of examinees.
Children’s age as of September 1st is used to determine which set of cut scores are examined for an individual child. For instance, a child assessed with the English Version of CIRCLE who is 4 years, 2 months at the beginning of the school year would be considered to be at risk if they knew less than 16 words at the beginning of the year, less than 19 words during the middle of the year, or less than 22 words at the end of the year.
16

C H I L D R E N ’ S L E A R N I N G I N S T I T U T E | | 7 0 0 0 F A N N I N , U C T 2 4 0 0 | H O U S T O N T E X A S 7 7 0 3 0 | ( 7 1 3 ) 5 0 0 - 3 7 0 9
CUT POINTS FOR RAPID LETTER NAMING Rapid Latter Naming Cut Points
Age as of Sept1
3.5-<4 4-<4.5 4.5 or Above
Wave English Spanish English Spanish English Spanish
Beginning of Year 7 5 8 6 10 7
Middle of Year 7 5 11 8 12 9
End of Year 8 6 14 10 15 11
Notes: Cut points for Rapid Letter Naming were determined following examination of data over a course of several years. Data was examined from ongoing CLI research projects, Texas School Ready Classrooms, public school Title 1 Pre-K programs, and state subsidized daycare programs serving 4 year old children. Children who scored below the cut point threshold should be considered to be at-risk in terms of the ability to name letters (i.e., a key predictor of early literacy skills). Risk status was
determined to be children who scored below the 16th percentile. The cut points for students assessed
with the Spanish version of CIRCLE are lower due to the fact that the 16th percentile was lower for this group of examinees.
Children’s age as of September 1st is used to determine which set of cut scores are examined for an individual child. For instance, a child assessed with the English Version of CIRCLE who is 4 years, 2 months at the beginning of the school year would be considered to be at risk if they knew less than 8 letters at the beginning of the year, less than 11 letters during the middle of the year, or less than 14 letters at the end of the year.
17

C H I L D R E N ’ S L E A R N I N G I N S T I T U T E | | 7 0 0 0 F A N N I N , U C T 2 4 0 0 | H O U S T O N T E X A S 7 7 0 3 0 | ( 7 1 3 ) 5 0 0 - 3 7 0 9
CUT POINTS FOR PHONOLOGICAL AWARENESS Phonological Awareness Cut Points
Age as of Sept1
3.5-<4 4-<4.5 4.5 or Above
Wave English Spanish English Spanish English Spanish
Beginning of Year 10 5 11 8 14 10
Middle of Year 13 11 17 15 20 17
End of Year 17 15 22 20 26 23
Notes: Cut points for the Phonological Awareness subtest were determined following examination of data over a course of several years. Data was examined from ongoing CLI research projects, Texas School Ready Classrooms, public school Title 1 Pre-K programs, and state subsidized daycare programs serving 4 year old children. Children who scored below the cut point threshold should be considered to be at-risk in terms of the ability to demonstrate phonological awareness skills (i.e., an important predictor of early reading readiness). Risk status was determined to be children who scored below the 16th percentile. The cut points for students assessed with the Spanish version of CIRCLE are lower due to the fact that the 16th percentile was lower for this group of examinees.
Children’s age as of September 1st is used to determine which set of cut scores are examined for an individual child. For instance, a child assessed with the English Version of CIRCLE who is 4 years, 2 months at the beginning of the school year would be considered to be at risk if they received a total raw score of less than 11 on the PA composite at the beginning of the year, less than 17 on the PA composite during the middle of the year assessment, or received a PA composite score of less than 22 at the end of the year.
18

C H I L D R E N ’ S L E A R N I N G I N S T I T U T E | | 7 0 0 0 F A N N I N , U C T 2 4 0 0 | H O U S T O N T E X A S 7 7 0 3 0 | ( 7 1 3 ) 5 0 0 - 3 7 0 9
MATH SUBTEST CUT POINTS
Math Cut Points
Age as of Sept1
3.5-<4 4-<4.5 4.5 or Above
Wave English Spanish English Spanish English Spanish
BOY 7 4 9 6 11 8
MOY 10 9 14 13 17 15
EOY 13 13 18 17 20 20
Notes: Cut points for the Math Subtest were determined following examination of data from Texas School Ready classrooms from 2009-2012. Children who scored below the cut point threshold should be considered to be at-risk in terms of the ability to demonstrate early mathematical skills. Risk status was determined to be children who scored below the 16th percentile. The cut points for students assessed with the Spanish version of CIRCLE are lower due to the fact that the 16th percentile was lower for this group of examinees.
Children’s age as of September 1st is used to determine which set of cut scores are examined for an individual child. For instance, a child assessed with the English Version of CIRCLE who is 4 years, 2 months at the beginning of the school year would be considered to be at risk if they received a total raw score of less than 9 on the Math Subtest.
19

C H I L D R E N ’ S L E A R N I N G I N S T I T U T E | | 7 0 0 0 F A N N I N , U C T 2 4 0 0 | H O U S T O N T E X A S 7 7 0 3 0 | ( 7 1 3 ) 5 0 0 - 3 7 0 9
SCIENCE SUBTEST CUT POINTS Science Subtest Cut Points
Age as of Sept1
3.5-<4
4-<4.5 4.5 or Above
English 8 10 13
Notes: Cut points for the Science Subtest were determined following examination of data from Texas School Ready classrooms in the spring of 2013. At the current time, only data from children completing the English version of the Science Subtest are reported. Efforts are currently occurring to recruit participants to evaluate the psychometric properties of Spanish Version of the Science Subtest. While data was only able to be collected at one time point (i.e., end of year), we were fortunate to be able to recruit children with a wide age range. This allowed for the ability to present separate cut scores for children across different age groups typically enrolled in early childhood programs. Most of the classrooms recruited were state funded pre-K programs serving low income children. However, approximately 18% of the sample had family income levels that were above the poverty line. Scores on the Science Subtest were compared with the only known comprehensive assessment of pre-K science skills (i.e., The Preschool Science Assessment; Greenfield, Domínguez, Fuccillo, Maier, & Penfield, 2013). Children who scored below the cut point threshold should be considered to be at-risk in terms of their early science conceptual knowledge. Children who were 4 years of age that received a score of less than 10 on the Science Subtest received scores on the Preschool Science Assessment that were at least one standard deviation below the mean (i.e., 16th percentile).
Children’s age as of September 1st is used to determine which set of cut scores are examined for an individual child. For instance, a child assessed with the English Version of CIRCLE who is 4 years, 2 months at the beginning of the school year would be considered to be at risk if they received a total raw score of less than 10 on the Science Subtest at the any point in the school year (i.e., beginning, middle, or end of year assessment).
20

C H I L D R E N ’ S L E A R N I N G I N S T I T U T E | | 7 0 0 0 F A N N I N , U C T 2 4 0 0 | H O U S T O N T E X A S 7 7 0 3 0 | ( 7 1 3 ) 5 0 0 - 3 7 0 9
TECHNICAL SUPPORT
RELIABILITY AND VALIDITY
Sample
The data used to support the reliability and validity of the CIRCLE progress monitoring system
came from numerous research studies done by the Children’ Learning Institute over the last four or five years. In particular, this data has come for our Interagency Education Research Initiative (IERI) study of professional development, Our TEA evaluation contracts, and the Texas Early Education Model (TEEM). Data for CIRCLE was also derived from the IERI project and our Preschool Curriculum Evaluation Research (PCER) grant. These research studies were done in, mostly, in preschools and day cares in low- income areas in Texas, Maryland, Ohio, and Florida. Children were between 3 and a half and 5 and a half years old although some of the variance in age is due to the longitudinal nature of the studies. The children represent a diverse set of racial and ethnic groups and include an approximately equal number of males and females. The tables (S1 and S2 below) show the breakdown of the sample by age, year and project.
Table S1. Number of Assessments by Study and Year.
2003-2004 2004-2005 2005-2006 IERI 2,412 434 TEA-C 10,856 4,337 TEA-D 5,335 1,589 TEEM 2,697 8,992 1,079
37,731 - Total
Table S2. Number of Assessments by Age and Time of Year
Beginning of year Middle of year End of Year 3 year olds 3,505 1,190 750 4 year olds 10,627 5,987 4,689 5 year olds 2,140 3,567 5,273 Total 16,272 10,744 10,712
21

C H I L D R E N ’ S L E A R N I N G I N S T I T U T E | | 7 0 0 0 F A N N I N , U C T 2 4 0 0 | H O U S T O N T E X A S 7 7 0 3 0 | ( 7 1 3 ) 5 0 0 - 3 7 0 9
w
RELIABILITY OF LANGUAGE & LITERACY SUBTESTS Reliability testing is used to assess the stability and consistency of test results. To assess reliability in the CIRCLE vocabulary, letter knowledge and phonological awareness scales, we have evaluated internal consistency as well as test-retest. Internal consistency measures how consistently individuals respond to the items within a scale. We measured this with the Cronbach coefficient alpha. Test-retest measures the consistency of a measure from one time to another. We measured test-retest reliability with both the intraclass correlation coefficient and the test-retest correlation coefficient.
Internal Consistency
Reliability statistics were calculated for the age groups independently. Internal consistency is not appropriate for speeded tests so we have used it only for phonological awareness.
Cronbach coefficient alpha
Cronbach’s alpha is a measure of the ratio between the true score variance and the observed score variance. It is also an intraclass correlation. Thus, it tells us an estimate of the proportion of the test variance that is attributable to true scores. We have used this procedure to measure the reliability of the subtests of phonological awareness. The raw and standardized alphas are presented in Table 1. These are shown for the combined samples and each age group separately. The coefficients are all greater than .90.
Test-Retest
The test-retest correlation demonstrates the stability of the tests over time periods.
Intraclass correlation coefficient.
The intraclass correlation coefficient is a measure of the proportion of variance which is attributed to variation in the same subject at different times, compared to the overall variance across times and subjects. The formula for this measure is
2
ICC b
2 2
b w
where 2b
2 is the pooled variance within
subjects. The interpretation of the ICC is the component of the variance attributed to the within subject variation (time). The ICCs for the individual tests for each age group separately and combined are presented in Table 2. These reliabilities are typically in the .60s. The reliabilities also show a general tendency to be more stable in the older groups.
22

C H I L D R E N ’ S L E A R N I N G I N S T I T U T E | | 7 0 0 0 F A N N I N , U C T 2 4 0 0 | H O U S T O N T E X A S 7 7 0 3 0 | ( 7 1 3 ) 5 0 0 - 3 7 0 9
Test-retest correlation coefficient.
Pearson correlations are reported for each pairwise combination of time points, beginning of year-middle of year, middle of year -end of year, beginning of year - of year end. This is done for each age group separately and all age groups combined. These results are presented in Table 3. TABLE 1 CRONBACH COEFFICIENT ALPHA PHONOLOGIC AWARENESS
Raw Standardized
ALL AGE GROUPS 0.93 0.93 3 YEAR OLDS 0.91 0.91 4 YEAR OLDS 0.91 0.91 5 YEAR OLDS 0.92 0.92
TABLE 2 INTRACLASS CORRELATION COEFFICIENTS (over time)
Vocabulary
Letters
Phonologic Awareness
ALL AGE GROUPS 0.66 0.74 0.66 3 YEAR OLDS 0.55 0.71 0.53 4 YEAR OLDS 0.67 0.72 0.60
5 YEAR OLDS 0.65 0.76 0.66
TABLE 3 TEST-RETEST CORRELATION COEFFICIENTS VOCABULARY
Fall and Winter Winter and Spring Fall and Spring
ALL AGE GROUPS 0.68 0.68 0.59 3 YEAR OLDS 0.60 0.61 0.47 4 YEAR OLDS 0.68 0.67 0.58 5 YEAR OLDS 0.66 0.62 0.58
LETTERS
Fall and Winter Winter and Spring Fall and Spring
ALL AGE GROUPS 0.80 0.83 0.66 3 YEAR OLDS 0.76 0.77 0.62 4 YEAR OLDS 0.78 0.82 0.65 5 YEAR OLDS 0.78 0.81 0.63
23

C H I L D R E N ’ S L E A R N I N G I N S T I T U T E | | 7 0 0 0 F A N N I N , U C T 2 4 0 0 | H O U S T O N T E X A S 7 7 0 3 0 | ( 7 1 3 ) 5 0 0 - 3 7 0 9
PHONOLOGIC AWARENESS
Fall and Winter Winter and Spring Fall and Spring
ALL AGE GROUPS 0.68 0.75 0.58 3 YEAR OLDS 0.56 0.57 0.50 4 YEAR OLDS 0.66 0.72 0.53 5 YEAR OLDS 0.66 0.73 0.57
RELIABILITY OF MATH AND SCIENCE SUBTESTS Interrater Agreement: Science, Technology & Engineering In a sample of 327 children (mean age 4.45 years), we examined the psychometric properties of the Science subtest detailed elsewhere (Zucker et al., 2014). Observations of trained research staff indicated item-level inter-scorer agreement was 98.84%.
Internal Consistency Reliability statistics examined indicated acceptable internal consistency = .81. The average item difficulty for the final item pool was -.81, corresponding to an average of 68.5% correct. This demonstrates that the subtest had more items with difficulties toward the lower end of children’s ability levels (theta, where average ability in the population equals zero). This is reflected in the conditional standard error of the scale in the Table below.
Summed Score to Scale Score (EAP) Conversion and Conditional Standard Error of Measurement Summed score EA P[ θ|x] SD[θ|x]
0 -2.79 0.51 1 -2.49 0.46 2 -2.24 0.42 3 -2.02 0.39 4 -1.83 0.37 5 -1.65 0.36 6 -1.48 0.35 7 -1.32 0.34 8 -1.17 0.34 9 -1.02 0.34 10 -0.86 0.34 11 -0.71 0.34 12 -0.54 0.35 13 -0.38 0.36 14 -0.20 0.38 15 -0.01 0.40 16 0.20 0.42
24

C H I L D R E N ’ S L E A R N I N G I N S T I T U T E | | 7 0 0 0 F A N N I N , U C T 2 4 0 0 | H O U S T O N T E X A S 7 7 0 3 0 | ( 7 1 3 ) 5 0 0 - 3 7 0 9
17 0.43 0.45
18 0.69 0.49 19 0.98 0.53 20 1.31 0.58
21 1.69 0.64 Note: EAP = Expected A Posteriori, which represents the expected theta scores for a child given a raw summed score. Theta scores of latent ability are standardized to a population mean of zero and standard deviation of 1. SD = standard deviation, which represents the error of the estimate of theta across the ability range.
Test-Retest Reliability The test-retest correlation in a randomly selected subsample of children (n =22, 6.73%), was calculated with an average of 50.59 days (SD = 24.25; Range = 12-80) between test administrations. Test-retest stability was high, r = .82.
25

C H I L D R E N ’ S L E A R N I N G I N S T I T U T E | | 7 0 0 0 F A N N I N , U C T 2 4 0 0 | H O U S T O N T E X A S 7 7 0 3 0 | ( 7 1 3 ) 5 0 0 - 3 7 0 9
VALIDITY OF LANGUAGE & LITERACY SUBTESTS
Validity testing is used to determine if a new test measures what it is expected to measure. This is assessed by comparing the new test, in this case the CIRCLE data, including both speeded tests (vocabulary and letter recognition) and non-speeded tests (phonological awareness), to established standardized tests.
For this analysis, we compared the CIRCLE data from all four component studies to standardized batteries that were also assessed on each student. We matched up the CIRCLE data with the standardized data that were obtained at the beginning and the end of the year. These measures were compared with the CIRCLE assessment at same time period. Correlations of the CIRCLE data with standardized tests measuring the same or nearly the same constructs is generally classified as concurrent validity. By also considering correlations between the CIRCLE variables and those standardized tests measuring different but related constructs, we also provide evidence of convergent validity. Also, by showing that the concurrent validity is greater than the convergent validity, we establish evidence of discriminant validity.
Concurrent validity is a measurement which assesses the degree of relation between tests that measure the same thing. In contrast, the discriminant validity is the ability to demonstrate variations in the correlations of the measures that theoretically exist. Both validity measurements are assessed with correlation coefficients. Valid tests would have high concurrent validity coefficients but lower discriminant validity coefficients.
The vocabulary test measured on the CIRCLE is expected to be correlated with the Expressive One Word Picture Vocabulary Test (EOWPVT), which is a standardized measure of vocabulary. Letter naming in the CIRCLE is expected to be correlated with the Preschool Comprehensive Test of Phonological Processing and Print Awareness (PreCTOPPP) Print awareness subscale. Phonological awareness and the component subtests are expected to be correlated with Developing Skills Checklist (DSC) and PreCTOPPP measures of blending and elision.
Expressive One Word Picture Vocabulary Test-III: The EOWPVT-III is an assessment of an individual's English speaking vocabulary acceptable for use between the ages of 24 months and 18 years, 11 months. The measure asks children to name objects, concepts, and actions. It is relatively easy to administer and interrater reliability has been assessed in multiple studies and found to be excellent. The test has a well thought out record form and can be administered in approximately 10 minutes.
The individual items in the EOWPVT-III were selected using analyses based on both Classical Test Theory (CTT) and Item Response Theory (IRT). The items were also analyzed for potential item bias based on demographic characteristics. The measure is internally consistent: coefficient alpha based on inter-correlations among test items (median of .96) and split-half reliability (median of .98) The EOWPVT-II also has high test-retest reliability based on an average time lag of 20 days between test
26

C H I L D R E N ’ S L E A R N I N G I N S T I T U T E | | 7 0 0 0 F A N N I N , U C T 2 4 0 0 | H O U S T O N T E X A S 7 7 0 3 0 | ( 7 1 3 ) 5 0 0 - 3 7 0 9
administrations (for ages 4 - 6 yrs mean alpha = .95). Inter-rater reliability is also high (reliability of scoring = 100%; reliability of response evaluation = 99.4%).
Validity has been established via comparisons of the EOWPVT and other measures. Correlations were found ranging from .64 to .90 with other measures of expressive language, measures of other areas of language development, academic achievement, and general cognitive ability.
Developing Skills Checklist (DSC): The DSC is an individually administered test of academic achievement for children in pre-k and k. The test is published by CTB/McGraw Hill and is most often administered by teachers. The DSC has one subtest (Auditory) that measures many of the central skills of phonological awareness. The auditory tasks (PA) are all clustered together, (recognition of words that sound different, rhyming, sentence-segmentation, and syllabication). Reliabilities (internal consistency) for the auditory subscale (21 items) on the DSC ranged from .84 to .86 from the spring of prekindergarten through the spring of kindergarten. Primary validity information was based on correlations with the Early School Assessment (ESA). These ranged from .41 to .50 for the auditory subscale of the ESA and from .70 to .79 for the total score on the ESA.
Preschool Comprehensive Test of Phonological Processing and Print Awareness, now the Test of Preschool Early Literacy (TOPEL): The Pre-CTOPPP’s Print Awareness subtest assesses similar things to the CIRCLE letter task. It evaluates many of the same areas as the TERA-3 (book awareness, differentiation of letter from other forms of print, differentiation of words, letter recognition, letter naming, and letter sounds) but is much quicker to administer. While this test was still in the pre-publication phase when we used it, there is information available now as to its reliability and validity. The Print Knowledge scale of the TOPEL reports coefficient alphas of .93 to .96 for children ages 3 to 5 with an average of .95. Test-retest reliability for this subscale was reported to be .89 over two weeks.
Blending and Elision are subscales of the Preschool CTOPPP that assess phonological awareness.
Table 4 provides the correlations between the CIRCLE component tests (Vocabulary, Letter and Phonologic Awareness). These correlations are high enough to show associations between similar constructs but not so high as to indicate one construct only. Table 5 shows the correlations between the CIRCLE component tests (Vocabulary, Letter and Phonologic Awareness) and the three standardized tests (EOWVPT, Print and DSC). In general, the subscales of the CIRCLE tend to correlate most highly with the appropriate measure, the vocabulary with the EOWPVT, the Letters with the Print knowledge scale, and phonological awareness with the DSC auditory subscale. In most instances, the phonological awareness scale correlates higher with the vocabulary and print awareness measures than with the DSC auditory scale but it does tend to correlate higher with this scale than does the CIRCLE vocabulary and letters scales.
27

C H I L D R E N ’ S L E A R N I N G I N S T I T U T E | | 7 0 0 0 F A N N I N , U C T 2 4 0 0 | H O U S T O N T E X A S 7 7 0 3 0 | ( 7 1 3 ) 5 0 0 - 3 7 0 9
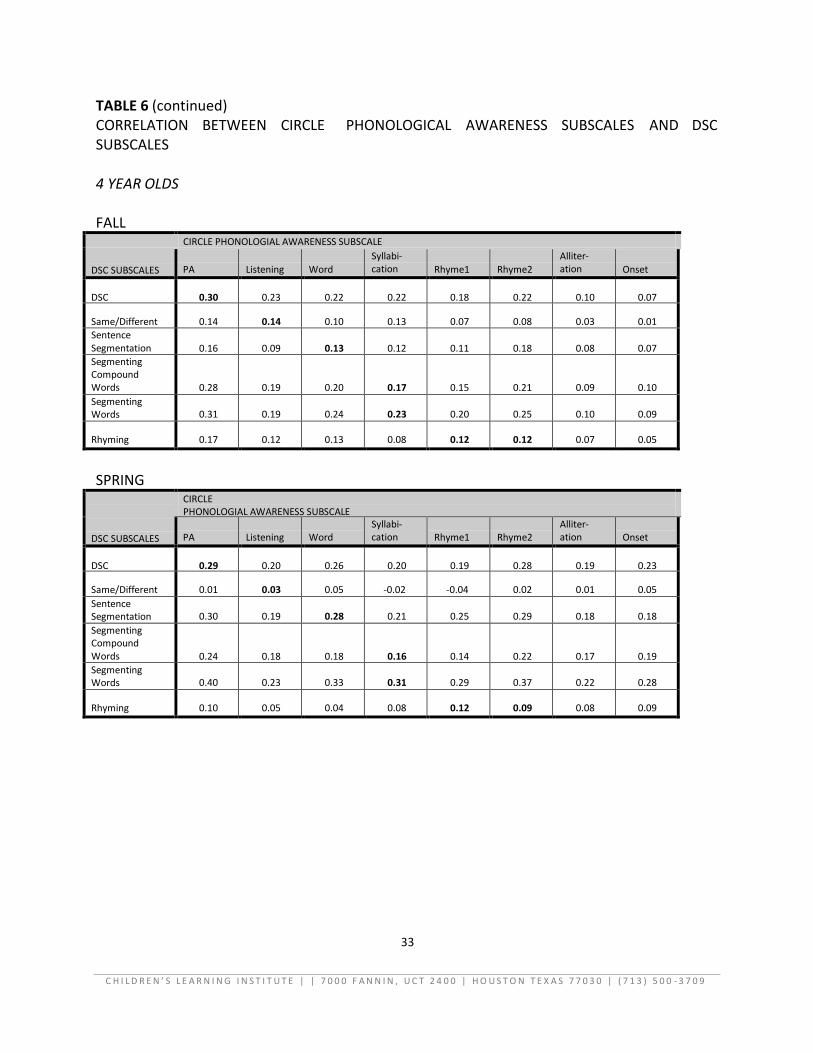
Table 6 provides the correlations between the sub-tests of the phonological awareness and the sub-test of the DSC. There is not a direct convergent validity measurement for the alliteration and onset subscales of the Phonological Awareness. For Tables 5 and 6, the convergent validity measures are bolded in the tables and the data are presented overall as well as separated by 3 year olds, 4 years old and 5 year olds. There are separate Fall and Spring tables.
Table 7 gives correlations between the CIRCLE phonological awareness scales and the blending and elision scales of the Preschool CTOPPP from a study of 154 preschool children. These correlations in general seem to be a little higher than with the DSC.
TABLE 4 CORRELATION BETWEEN CIRCLE SCALES FALL
Vocabulary
Letters
Phonologic Awareness
Vocabulary 1.00
Letters 0.48 1.00
Phonologic Awareness 0.58 0.46 1.00
SPRING
Vocabulary
Letters
Phonologic Awareness
Vocabulary 1.00
Letters 0.42 1.00
Phonologic Awareness 0.47 0.48 1.00
28

C H I L D R E N ’ S L E A R N I N G I N S T I T U T E | | 7 0 0 0 F A N N I N , U C T 2 4 0 0 | H O U S T O N T E X A S 7 7 0 3 0 | ( 7 1 3 ) 5 0 0 - 3 7 0 9
TABLE 5 CORRELATION BETWEEN CIRCLE SCALES AND STANDARDIZED SCALES ALL AGE GROUPS FALL
Standardized Scales
CIRCLE
Vocabulary
Letter
Phonologic Awareness
EOWPVT 0.59 0.37 0.46 Print 0.36 0.76 0.50 DSC 0.25 0.30 0.39
SPRING
Standardized Scales
CIRCLE
Vocabulary
Letter
Phonologic Awareness
EOWPVT 0.45 0.40 0.47 Print 0.32 0.79 0.61 DSC 0.17 0.37 0.37
3 YEAR OLDS FALL
Standardized Scales
CIRCLE
Vocabulary
Letter
Phonologic Awareness
EOWPVT 0.50 0.31 0.37 Print 0.40 0.73 0.40 DSC 0.31 0.27 0.40
SPRING
Standardized Scales
CIRCLE
Vocabulary
Letter
Phonologic Awareness
EOWPVT 0.58 0.29 0.35 Print 0.24 0.40 0.56 DSC 0.26 0.21 0.28
29

C H I L D R E N ’ S L E A R N I N G I N S T I T U T E | | 7 0 0 0 F A N N I N , U C T 2 4 0 0 | H O U S T O N T E X A S 7 7 0 3 0 | ( 7 1 3 ) 5 0 0 - 3 7 0 9
TABLE 5 (continued)
CORRELATION BETWEEN CIRCLE SCALES AND STANDARDIZED SCALES 4 YEARS OLD
FALL
Standardized Scales
CIRCLE
Vocabulary
Letter
Phonologic Awareness
EOWPVT 0.58 0.34 0.41 Print 0.31 0.77 0.46 DSC 0.28 0.23 0.30
SPRING
Standardized Scales
CIRCLE
Vocabulary
Letter
Phonologic Awareness
EOWPVT 0.43 0.39 0.39 Print 0.33 0.80 0.55 DSC 0.14 0.30 0.29
5 YEAR OLDS
FALL
Standardized Scales
CIRCLE
Vocabulary
Letter
Phonologic Awareness
EOWPVT 0.57 0.30 0.52 Print 0.33 0.67 0.51 DSC 0.22 0.41 0.40
SPRING
Standardized Scales
CIRCLE
Vocabulary
Letter
Phonologic Awareness
EOWPVT 0.39 0.25 0.47 Print 0.22 0.73 0.61 DSC 0.13 0.32 0.37
30

C H I L D R E N ’ S L E A R N I N G I N S T I T U T E | | 7 0 0 0 F A N N I N , U C T 2 4 0 0 | H O U S T O N T E X A S 7 7 0 3 0 | ( 7 1 3 ) 5 0 0 - 3 7 0 9
TABLE 6 CORRELATION BETWEEN CIRCLE PHONOLOGICAL AWARENESS SUBSCALES AND DSC SUBSCALES
ALL AGE GROUPS
FALL
DSC SUBSCALES
CIRCLE PHONOLOGIAL AWARENESS SUBSCALE
PA
Listening
Word
Syllabi- cation
Rhyme1
Rhyme2
Alliter- ation
Onset
DSC
0.39
0.32
0.25
0.27
0.24
0.26
0.15
0.13
Same/Different
0.24
0.23
0.12
0.17
0.12
0.12
0.08
0.06
Sentence Segmentation
0.20
0.13
0.15
0.15
0.14
0.19
0.11
0.09
Segmenting Compound Words
0.33
0.26
0.22
0.20
0.21
0.24
0.13
0.12
Segmenting Words
0.45
0.25
0.28
0.25
0.25
0.27
0.15
0.13
Rhyming
0.19
0.14
0.12
0.10
0.13
0.14
0.08
0.06
SPRING
DSC SUBSCALES
CIRCLE PHONOLOGIAL AWARENESS SUBSCALE
PA
Listening
Word
Syllabi- cation
Rhyme1
Rhyme2
Alliter- ation
Onset
DSC
0.37
0.27
0.31
0.26
0.27
0.32
0.15
0.29
Same/Different
0.01
0.04
0.04
0.00
-0.02
0.01
0.08
0.04
Sentence Segmentation
0.38
0.24
0.33
0.25
0.28
0.33
0.11
0.25
Segmenting Compound Words
0.29
0.23
0.22
0.21
0.21
0.23
0.13
0.18
Segmenting Words
0.43
0.28
0.36
0.34
0.32
0.36
0.15
0.30
Rhyming
0.22
0.13
0.13
0.15
0.20
0.19
0.16
0.17
31

C H I L D R E N ’ S L E A R N I N G I N S T I T U T E | | 7 0 0 0 F A N N I N , U C T 2 4 0 0 | H O U S T O N T E X A S 7 7 0 3 0 | ( 7 1 3 ) 5 0 0 - 3 7 0 9
TABLE 6 (continued) CORRELATION BETWEEN CIRCLE PHONOLOGICAL AWARENESS SUBSCALES AND DSC SUBSCALES
3 YEAR OLDS
FALL
DSC SUBSCALES
CIRCLE PHONOLOGIAL AWARENESS SUBSCALE
PA
Listening
Word
Syllabi- cation
Rhyme1
Rhyme2
Alliter- ation
Onset
DSC
0.40
0.35
0.43
0.29
0.29
0.29
0.19
0.25
Same/Different
0.35
0.32
0.12
0.24
0.18
0.18
0.15
0.21
Sentence Segmentation
0.24
0.19
0.14
0.18
0.24
0.14
0.16
0.14
Segmenting Compound Words
0.31
0.36
0.18
0.20
0.32
0.35
0.18
0.28
Segmenting Words
0.30
0.22
0.20
0.19
0.34
0.25
0.17
0.26
Rhyming
0.09
0.08
-0.07
0.14
0.07
0.12
-0.00
-0.07
SPRING
DSC SUBSCALES
CIRCLE PHONOLOGIAL AWARENESS SUBSCALE
PA
Listening
Word
Syllabi- cation
Rhyme1
Rhyme2
Alliter- ation
Onset
DSC
0.28
0.27
0.26
0.28
0.26
0.28
0.19
0.28
Same/Different
0.06
0.01
0.11
0.13
0.07
0.15
0.11
0.14
Sentence Segmentation
0.31
0.19
0.33
0.27
0.12
0.23
0.19
0.21
Segmenting Compound Words
0.23
0.28
0.11
0.12
0.26
0.16
0.06
0.16
Segmenting Words
0.33
0.28
0.35
0.30
0.38
0.28
0.19
0.28
Rhyming
0.13
0.14
-0.02
0.16
0.11
0.10
0.07
0.15
32
C H I L D R E N ’ S L E A R N I N G I N S T I T U T E | | 7 0 0 0 F A N N I N , U C T 2 4 0 0 | H O U S T O N T E X A S 7 7 0 3 0 | ( 7 1 3 ) 5 0 0 - 3 7 0 9
TABLE 6 (continued) CORRELATION BETWEEN CIRCLE PHONOLOGICAL AWARENESS SUBSCALES AND DSC SUBSCALES
4 YEAR OLDS
FALL
DSC SUBSCALES
CIRCLE PHONOLOGIAL AWARENESS SUBSCALE
PA
Listening
Word
Syllabi- cation
Rhyme1
Rhyme2
Alliter- ation
Onset
DSC
0.30
0.23
0.22
0.22
0.18
0.22
0.10
0.07
Same/Different
0.14
0.14
0.10
0.13
0.07
0.08
0.03
0.01
Sentence Segmentation
0.16
0.09
0.13
0.12
0.11
0.18
0.08
0.07
Segmenting Compound Words
0.28
0.19
0.20
0.17
0.15
0.21
0.09
0.10
Segmenting Words
0.31
0.19
0.24
0.23
0.20
0.25
0.10
0.09
Rhyming
0.17
0.12
0.13
0.08
0.12
0.12
0.07
0.05
SPRING
DSC SUBSCALES
CIRCLE PHONOLOGIAL AWARENESS SUBSCALE
PA
Listening
Word
Syllabi- cation
Rhyme1
Rhyme2
Alliter- ation
Onset
DSC
0.29
0.20
0.26
0.20
0.19
0.28
0.19
0.23
Same/Different
0.01
0.03
0.05
-0.02
-0.04
0.02
0.01
0.05
Sentence Segmentation
0.30
0.19
0.28
0.21
0.25
0.29
0.18
0.18
Segmenting Compound Words
0.24
0.18
0.18
0.16
0.14
0.22
0.17
0.19
Segmenting Words
0.40
0.23
0.33
0.31
0.29
0.37
0.22
0.28
Rhyming
0.10
0.05
0.04
0.08
0.12
0.09
0.08
0.09
33

C H I L D R E N ’ S L E A R N I N G I N S T I T U T E | | 7 0 0 0 F A N N I N , U C T 2 4 0 0 | H O U S T O N T E X A S 7 7 0 3 0 | ( 7 1 3 ) 5 0 0 - 3 7 0 9
TABLE 6 (continued) CORRELATION BETWEEN CIRCLE PHONOLOGICAL AWARENESS SUBSCALES AND DSC SUBSCALES
5 YEAR OLDS
FALL
DSC SUBSCALES
CIRCLE PHONOLOGIAL AWARENESS SUBSCALE
PA
Listening
Word
Syllabi- cation
Rhyme1
Rhyme2
Alliter- ation
Onset
DSC
0.40
0.25
0.29
0.35
0.22
0.32
0.26
0.27
Same/Different
0.22
0.08
0.16
0.27
0.06
0.16
0.12
0.20
Sentence Segmentation
0.24
0.12
0.17
0.20
0.16
0.19
0.18
0.11
Segmenting Compound Words
0.23
0.28
0.19
0.15
0.22
0.22
0.19
0.02
Segmenting Words
0.38
0.29
0.33
0.28
0.28
0.28
0.26
0.18
Rhyming
0.25
0.15
0.08
0.15
0.08
0.23
0.13
0.31
SPRING
DSC SUBSCALES
CIRCLE PHONOLOGIAL AWARENESS SUBSCALE
PA
Listening
Word
Syllabi- cation
Rhyme1
Rhyme2
Alliter- ation
Onset
DSC
0.34
0.21
0.26
0.20
0.23
0.26
0.25
0.23
Same/Different
-0.03
0.02
-0.02
-0.04
-0.5
-0.05
0.02
0.00
Sentence Segmentation
0.38
0.21
0.29
0.19
0.25
0.31
0.28
0.25
Segmenting Compound Words
0.22
0.13
0.17
0.18
0.17
0.18
0.15
0.07
Segmenting Words
0.35
0.20
0.29
0.26
0.23
0.27
0.20
0.23
Rhyming
0.29
0.14
0.17
0.16
0.23
0.25
0.19
0.20
34

C H I L D R E N ’ S L E A R N I N G I N S T I T U T E | | 7 0 0 0 F A N N I N , U C T 2 4 0 0 | H O U S T O N T E X A S 7 7 0 3 0 | ( 7 1 3 ) 5 0 0 - 3 7 0 9
TABLE 7
CORRELATION BETWEEN CIRCLE PHONOLOGICAL AWARENESS SUBSCALES AND PRESCHOOL CTOPPP BLENDING AND ELISION
DSC SUBSCALES
PA
Listening
Word
Syllabi- cation
Rhyme
Alliter- ation
Onset
Blending
0.34
**
0.21
0.23
0.33
0.18
0.18
Elision
0.45
**
0.30
0.38
0.39
0.24
0.16
Blending + Elision
0.47
**
0.30
0.35
0.41
0.24
0.20
** Listening task was not used in this analysis.
35

C H I L D R E N ’ S L E A R N I N G I N S T I T U T E | | 7 0 0 0 F A N N I N , U C T 2 4 0 0 | H O U S T O N T E X A S 7 7 0 3 0 | ( 7 1 3 ) 5 0 0 - 3 7 0 9
VALIDITY OF MATH AND SCIENCE SUBTESTS
Math Subtest: The concurrent validity of the Math Subtest was assessed via comparison with two standardized measures (i.e., The Child Math Assessment and WJ-III Tests of Academic Achievement Applied Problems subtest). The Child Math Assessment (CMA, Starkey, Klein, and Wakeley, 2004) evaluate children’s informal and formal math skills that are deemed important by standards set forth by the National Council of Teachers of Mathematics (i.e., NCTM). The CMA evaluates a child’s ability to count objects, construct equivalent sets, one-set addition and subtraction, division, two-set addition and subtraction, shape recognition, geometric reasoning, direct measurement, and pattern duplication. The WJ-III Applied Problems subtest uses pictures and diagrams to evaluate children’s ability to construct mental mathematical models via language comprehension, calculation skills, and quantitative reasoning abilities. To date, initial efforts to evaluate the validity of the Math subtest support its convergent validity. Specifically, the Math Subtest was found to correlate strongly (i.e., r = .77) with the Child Math Assessment (see Starkey, Klein, & Wakeley, 2004), and it was found moderately correlated with the Applied Problems subtest of the WJ-III (i.e., r = .55).
Science, Technology & Engineering Subtest Validity We used a previously validated measure of young children’s science content and process knowledge, the Preschool Science Assessment (PSA; Greenfield et al., 2013), to establish convergent validity. We found a strong correlation between children’s science scores and PSA total raw scores (r = .84) and PSA standard scores (r = .81), suggesting good convergent validity with another measure designed for more comprehensive, diagnostic testing purposes.
VALIDITY OF SOCIAL & EMOTIONAL SKILLS-CHECKLIST
Validity of the Social & Emotional Scale-Checklist (SES-C) was established via a comparison of teacher reports on the SES-C to measures evaluating similar constructs (i.e., Social Competence and Behavioral Evaluation-Preschool Edition and the Children’s Behavior Questionnaire). The SES-C demonstrated strong correlations with the Social Competence and Behavior Evaluation (i.e., SCBE). Convergent validity is demonstrated in the fact that higher correlations between the SES-C and SCBE are achieved on scales that are purported to measure similar constructs. Specifically, the Social Competence scale from the SCBE was correlated with the SES-C Positive Social Behavior subscale the highest (i.e., .61). In contrast, less similar scales had much lower correlations. For instance, the SES-C Self-Care Subscale only correlated with the SCBE Social Competence Scale with a correlation of .29. However, as the table demonstrates, teacher ratings of child behavior were relatively consistent (i.e., all correlations significant at the .001 level). The 80-item Social Competence and Behavior Evaluation (La Freniere, Dumas, Capuano, & Dubeau, 1992) was designed for use with preschool aged children (i.e., 2.5 to age 6), has been successfully validated, used in numerous studies in a number of countries (e.g., La Freniere & Dumas, 1996; La Freniere et al., 2002), and in intervention studies (e.g., La Freniere & Capulano, 1997). Initial analyses evaluating reliability (i.e., internal consistency) of the SES-C were quite encouraging. Specifically, internal consistency (i.e., Cronback Alpha) was .96.
36

C H I L D R E N ’ S L E A R N I N G I N S T I T U T E | | 7 0 0 0 F A N N I N , U C T 2 4 0 0 | H O U S T O N T E X A S 7 7 0 3 0 | ( 7 1 3 ) 5 0 0 - 3 7 0 9
Correlations between the SES-C and the SCBE are presented in the following table:
SES- Positive
Social Behavior
SES-Classroom Community & Safety
SES-Emotion and Behavior Regulation
SES-Self- Care
SES- Attention
SCBE-Social Competence .61** .51** .60** .29** .58** SCBE-Internalizing Problems .49** .41** .46** .25** .38** Externalizing Problems .32** .46** .34** .31** .33** General Adaptation .59** .55** .58** .58** .55** Note: ** indicates correlations are significant at the .0001 level.
The SES-C was also compared to the 3 subscales of the Children’s Behavior Questionnaire. Results of these analyses revealed findings similar to the comparison of the SES-C to the SCBE. That is, the SES-C demonstrates a pattern of strong correlations with similar constructs (i.e., SES-C Attention subscale is strongly correlated to the Attentional Focusing subscale of the CBQ). In addition, the Anger/Frustration subscale was negatively correlated with all SES-C subscales, revealing that teachers who report that children are angrier and have difficulty dealing with frustration tended to have lower ratings of social competence on the SES-C. Selected subscales from the Child Behavior Questionnaire (Rothbart, Ahadi, Hershey, & Fisher, 2001) were used to evaluate the validity of the SES-C including Anger/Frustration, Attentional Focusing, and Inhibitory Control. The CBQ is a well research and valid teacher report questionnaire with good reliability (i.e., Cronbach alphas for all CBQ scales generally have been .72 or higher).
SES- Positive Social Behavior
SES- Classroom Community & Safety
SES-Emotion and Behavior Regulation
SES-Self- Care
SES- Attention
CBQ-Anger/Frustration -.41** -.55** -.42** -.38** -.42** CBQ-Attentional Focusing .49** .48** .48** .29** .65** CBQ-Inhibitory Control .44** .56** .45** .34** .45**
Note: ** indicates correlations are significant at the .0001 level.
37

C H I L D R E N ’ S L E A R N I N G I N S T I T U T E | | 7 0 0 0 F A N N I N , U C T 2 4 0 0 | H O U S T O N T E X A S 7 7 0 3 0 | ( 7 1 3 ) 5 0 0 - 3 7 0 9
GROWTH MODELS
If these measures assess characteristics that change as a result of preschool education, then we should see changes in the scores over time. Since we have multiple assessments (up to three) on children who are nested within classrooms, we applied a mixed models approach. Change over time was modeled as growth by regressing each child’s score on the time of the assessment. We centered the regression at the mid-year assessment point so that the intercept represented the level of the child at the mid-year point and the slope represented the rate of change in scores occurring at the mid-year point. In other words, time represented the time since the mid-year assessment. To control for the age of the child, we included the child’s age at the mid-year assessment as a fixed effect in the model.
Since the intercept and slope were considered as random effects, we estimated the variance at the child and classroom levels. Since there was instruction relevant to the assessments occurring during instruction, we would expect classroom variation in the model parameters. Results are broken into two parts, the estimation of random effects (variances of the growth parameters and covariance between them) and fixed effects (the mean level and slope as well as the relation of age to the slope and intercept. Each measure is reported separately.
Letters: Results of the analysis are presented in Table 8. A large amount of variance in the intercept is at the child level. This would indicate that a large amount of the variability in the number of letters a child knows at the middle of the year assessment comes from what they brought to the classroom with them. On the other hand, the slope variances are very similar, indicating that half of the variability in the growth rates over time come from the classroom level. The fact that the slopes and intercepts are correlated (significant covariance between slope and intercept) indicates that those children who know more letters at the mid-year assessment tend to be the students whose rate of growth is greater. Thus, the rate of growth in rapid letter naming is a function of how many letters you know but also is influenced by the differences in classrooms, presumably classroom instruction.
Since the items are scored as 2 for correct and 1 for incorrect (because in initial version of the C-PALS Rapid Vocabulary items were previously considered to be partially correct), the intercept means that the average child (4.7 years old) can correctly identify almost 17 upper and lower case letters by the middle of the year. This would be almost a half a letter higher for each month the child was over 4.7 years. The sample was increasing at a rate of 2.4 letters per month so that three months after the middle of year assessment, we would expect the average child (now 4.95 years old) to be able to identify almost 24 upper and lower case letters within one minute.
Phonological Awareness: Results for this analysis are reported in Table 9. There is still more variance in the level of phonological awareness at the child level than the classroom level but the discrepancy is not as great for letters. In addition, variance in the rate of growth is greater
38

C H I L D R E N ’ S L E A R N I N G I N S T I T U T E | | 7 0 0 0 F A N N I N , U C T 2 4 0 0 | H O U S T O N T E X A S 7 7 0 3 0 | ( 7 1 3 ) 5 0 0 - 3 7 0 9
at the classroom level than at the child level. This makes sense since phonological awareness is much less likely to be explicitly taught in the home. However, as with letters, those with greater phonological awareness scores at the middle of year assessment are growing in phonological awareness at a faster rate.
The average number of items correct for a child of average age at the middle of the year was about 26.5 items out of 42. Older children had scores that were higher by about a half a point per month of age. Children were on average growing at a rate of 2 items per month. The rate of growth did not depend on the age of the child.
Vocabulary: Variance in the level of vocabulary was about equally divided between the child and the classroom (Table 10). However there was much more variability in the growth at the classroom level. The level and slope were significantly related so that those with higher vocabulary scores at the mid-year assessment tended to be those whose vocabulary was growing at a faster rate. The average child (4.7 years) tended to get about 17 vocabulary items in one minute and to be increasing about one vocabulary item per month. Older children tended to get higher scores but only about one item per every four months. The rate of growth did not depend on the age.
Summary: All of the scales showed growth over time and scores indicated that there were no serious ceiling or floor effects. This is as expected if the scales are assessing aspects of language and literacy.
39

C H I L D R E N ’ S L E A R N I N G I N S T I T U T E | | 7 0 0 0 F A N N I N , U C T 2 4 0 0 | H O U S T O N T E X A S 7 7 0 3 0 | ( 7 1 3 ) 5 0 0 - 3 7 0 9
Table 8: Growth Models – Phonological Awareness
Parameter
Parameter Estimate
Std Error
Statistic
p value
Child
Var (Intercept) 106.34 2.65 40.19 <0.0001
Var (Slope) 0.37 0.12 3.10 0.0010
Cov (Intercept, Slope) 0.19 0.35 0.54 0.5911
Class
Var (Intercept) 61.38 4.99 12.30 <0.0001
Var (Slope) 2.76 0.23 12.17 <0.0001
Cov (Intercept, Slope) 2.42 0.76 3.16 0.0016
Residual 65.56 1.28 51.24 <0.0001
Fixed Effects
Intercept 52.86 0.40 131.00 <0.0001
Age 3.97 0.09 46.59 <0.0001
MOY Age 1.01 0.04 27.89 <0.0001
Age * MOY Age -0.005 0.007 -0.81 0.4161
Table 9: Growth Models – Letters
Parameter Parameter Estimate
Std Error
Statistic
p value
Child
Var (Intercept) 298.77 6.52 45.84 <0.0001
Var (Slope) 3.38 0.21 15.84 <0.0001
Cov (Intercept, Slope) 12.13 0.80 15.11 <0.0001
Class
Var (Intercept) 82.35 1.15 7.49 <0.0001
Var (Slope) 3.61 0.30 11.99 <0.0001
Cov (Intercept, Slope) 8.63 1.15 7.49 <0.0001
Residual 90.66 1.76 51.58 <0.0001
Fixed Effects
Intercept 33.48 0.49 68.77 <0.0001
Age 4.83 0.10 49.21 <0.0001
MOY Age 0.92 0.05 17.19 <0.0001
Age * MOY Age 0.04 0.01 3.83 0.0001
40

C H I L D R E N ’ S L E A R N I N G I N S T I T U T E | | 7 0 0 0 F A N N I N , U C T 2 4 0 0 | H O U S T O N T E X A S 7 7 0 3 0 | ( 7 1 3 ) 5 0 0 - 3 7 0 9
Table 10: Growth Models - Vocabulary
Parameter
Parameter Estimate
Std Error
Statistic
p value
Child
Var (Intercept) 62.69 1.40 44.63 <0.0001
Var (Slope) 0.00
Cov (Intercept, Slope) 0.69 0.20 3.40 <0.0001
Class
Var (Intercept) 62.37 4.48 13.92 <0.0001
Var (Slope) 2.16 0.16 13.48 <0.0001
Cov (Intercept, Slope) 4.68 0.65 7.22 <0.0001
Residual 51.47 0.63 81.70 <0.0001
Fixed Effects
Intercept 33.97 0.37 91.07 <0.0001
Age 2.16 0.07 30.40 <0.0001
MOY Age 0.56 0.02 23.22 <0.0001
Age * MOY Age -0.007 0.004 -1.52 0.1281
41

C H I L D R E N ’ S L E A R N I N G I N S T I T U T E | | 7 0 0 0 F A N N I N , U C T 2 4 0 0 | H O U S T O N T E X A S 7 7 0 3 0 | ( 7 1 3 ) 5 0 0 - 3 7 0 9
FACTOR ANALYSES
PHONOLOGICAL AWARENESS SUBTEST FACTOR STRUCTURE
A confirmatory factor analysis was done to examine the factor structure of the phonological awareness scale. The initial model was conceived of as a single phonological construct with secondary constructs accounting for specific variance due to each subscale: listening, rhyme1, rhyme2, alliteration, words, syllables, and onset-rime. MPlus was used for the analysis, particularly since the items are dichotomies and MPlus has a nice facility for analyzing this type of data without resorting to asymptotic estimates and nonparametric methods. Unfortunately, this model failed to converge. However, by looking at the final estimates of the parameters and the threshold values for each item, it became evident that certain items were behaving differently than others. Examination of the items indicated that those items that were supply response items, such as “what rhymes with can”, tended to be more similar to each other, but select response items, such as “Do cat and mat rhyme” depended on the nature of the response to some extent. Children seemed to respond correctly more often when the words rhymed than when they didn’t and likewise, when the words started with the same letter they were more likely to get the item correct. Therefore, it seemed that some students were more likely to agree or pick the first answer and this was causing some problems with the solution. To model this, we broke the items from the subscales with select responses into two parts, those that rhymed, or began with the same letter, or those words that sounded the same, or those with only one syllable versus the remaining items.
This model for the initial observations (one per student) fit the data reasonably well considering the sample size was 10,596. The amount of missing data was small, with no items having less
than 95% of the data present. While the chi-square test of model fit was significant (χ2(476, n=10,596) = 2684.262; p < .0001, the other fit indices were excellent: CFI = .984; TLI = .996; RMSEA = .017. The chi-square test is largely a function of the sample size and the degrees of freedom, both of which are large in this case, making the test highly sensitive. All of the items had significant coefficients with the overall PA factor as well as with their specific factor. See Figure 1.
42

C H I L D R E N ’ S L E A R N I N G I N S T I T U T E | | 7 0 0 0 F A N N I N , U C T 2 4 0 0 | H O U S T O N T E X A S 7 7 0 3 0 | ( 7 1 3 ) 5 0 0 - 3 7 0 9
Figure 1: Structural measurement model for Phonological Awareness Scale.
43

C H I L D R E N ’ S L E A R N I N G I N S T I T U T E | | 7 0 0 0 F A N N I N , U C T 2 4 0 0 | H O U S T O N T E X A S 7 7 0 3 0 | ( 7 1 3 ) 5 0 0 - 3 7 0 9
MATH SUBTEST FACTOR STRUCTURE
To examine the assumption of unidimensionality, we first performed exploratory factor analysis (EFA) of the 27 categorical item data (i.e., correct vs. incorrect) that had been collected. EFA was performed using Mplus (version 7; Muthén & Muthén, 2012) using means- and variance-adjusted weighted least squares estimation. Examination of the eigenvalues revealed strong evidence for a single dominant factor (eigenvalues = 11.5, 2.7, 2.0, 1.6, 1.6, 1.1, 1.0, .9, …; ratio of first to second eigenvalue = 4.3). However, the one-factor model did not characterize the data well (CFI=.86, TLI=.85, RMSEA=.08), given that CFIs greater than .95, TLIs greater than .95, and RMSEAs less than .05 are generally considered indicative of excellent fitting models (Hu & Bentler, 1999).
SCIENCE, TECHNOLOGY & ENGINEERING FACTOR STRUCTURE
An exploratory factor analysis was done to examine the factor structure of the Science subtest using Mplus (version 7; Muthén & Muthén, 2012) using means- and variance-adjusted weighted least squares estimation. Examination of the eigenvalues revealed strong evidence for a single dominant factor (eigenvalues = 9.3, 2.3, 2.0, 1.9, 1.7, 1.5, 1.5, 1.4, 1.4, 1.3, 1.3, 1.2, 1.1, 1.0, .95, …; ratio of first to second eigenvalue = 4.0). In addition, the one-factor model did characterize the data well (CFI=.97, TLI=.97, RMSEA=.015), given that CFIs greater than .95, TLIs greater than .95, and RMSEAs less than .05 are generally considered indicative of excellent fitting models (Hu & Bentler, 1999). Item response theory was used to exclude items with poor discriminations. After weighing the item discrimination information against considerations of content exclusion, we decided to exclude items that either had a significant item misfit (p < .05) or had a factor loading of less than .40, yielding a set of 21 items. Examination of the factor loadings on additional factors revealed no consistent pattern with regard to content, difficulty, or question format. Therefore, the one-factor solution was deemed the most appropriate for this data.
44

C H I L D R E N ’ S L E A R N I N G I N S T I T U T E | | 7 0 0 0 F A N N I N , U C T 2 4 0 0 | H O U S T O N T E X A S 7 7 0 3 0 | ( 7 1 3 ) 5 0 0 - 3 7 0 9
Acknowledgments
The CIRCLE assessment could not have been developed without the support of numerous individuals within the Children’s Learning Institute who have trained teachers across the state to use these measures since 2003. Additionally, the Texas Education Agency and the state legislature have continued to provide our organization with the financial means to conduct large scale program evaluation studies that have aided in improving the pre-kindergarten instruction across the state of Texas. Individuals that deserve recognition include Dr. Paul Swank, Dr. Jeff Williams and Dr. Teri King for their examination of psychometric characteristics of the measure. A special thank you goes to the thousands of teachers who have used the system over and provided feedback on ways to design a more user-friendly measure. Finally, we would be remiss without thanking the children of Texas who have participated in our studies over the last several years.
For More Information
Visit the Children’s Learning Institute website to learn more information about how to purchase the C- PALLS+STEM system for use in your preschool classrooms: http://www.childrenslearninginstitute.org/our-programs/program-overview/TX-school-ready/progress- monitoring/default.html
Copyright © 2014 University of Texas Health Science Center
45