Embed Size (px)
Citation preview

in partnership with
SURVEY REPORT
Resourcing and Talent Planning
2015
The CIPD is the professional body for HR and people development. The not-for-profit organisation champions better work and working lives and has been setting the benchmark for excellence in people and organisation development for more than 100 years. It has more than 135,000 members across the world, provides thought leadership through independent research on the world of work, and offers professional training and accreditation for those working in HR and learning and development.
1 cipd.co.uk/resourcingandtalentplanningsurvey
Resourcing and talent planning Survey report 2015
Contents
Foreword from CIPD 2
Foreword from Hays 3
Summary of key findings 4
Resourcing and talent management in the current economy 7
Make or buy? 7
Growing demand for labour 8
Availability of labour 10
Recruitment difficulties 1 1
Addressing recruitment difficulties 13
Attracting employees 14
Employer brand 14
Case study: L’Oreal 15
Diversity 16
An age-diverse workforce 17
Case study: Timpson Group (Timpson & Max Spielmann) 18
The recruitment process 21
Sourcing candidates 21
Selecting candidates 22
Case study: Xtravirt 25
Candidates’ integrity and behaviour 26
Recruitment costs 26
Talent management 28
Talent management spend 29
Retaining employees 29
Cost of labour turnover 30
Conclusions 32
Background to the survey 34
Sample profile 34
Calculation of labour turnover 34
Note on abbreviations, statistics and figures used 36
Endnotes 37

2 Resourcing and Talent Planning Survey 2015
The Resourcing and Talent Planning survey is now in its nineteenth year. It is a valued survey that provides HR professionals and their organisations with benchmarking data on recruitment costs, resourcing and talent management practice and employee turnover.
It is widely known that the ‘war for talent’ remains and that organisations recognise the importance for their continued survival to have the best people. At the same time the advances in technology are changing the skills that organisations need. In this survey, we wanted to understand more about how the improved economic situation might be impacting organisations’ resourcing and talent management strategy and practice. Maybe it’s too early to tell fully, but what is clear from this survey is that organisations continue to recruit for niche talent and that resourcing budgets have increased to help them compete to fill key roles. Some roles, particularly those that are highly specialist or senior, are proving difficult to fill due to lack of skills and experience. At the same time, organisations are concerned about older workers leaving the workplace with valuable skills and with a pipeline of young people who don’t have the necessary skills to fill existing or new roles.
The survey highlights talent management becoming a higher priority for CEOs with an increased focus on talent development and retention planned for 2015, but talent management spend seems on the whole to have stayed the same (51%). We would encourage organisations to continue investment in their people, with a forward-focused view on how their skill requirements may develop in coming years to ensure they have a pipeline of talent, both internal and external, to meet these requirements and help them remain competitive.
I would like to thank the group of CIPD members whose valued experience helped shape the direction of this survey.
Jessica CooperResearch Adviser, CIPD
Foreword from the CIPD
3 cipd.co.uk/resourcingandtalentplanningsurvey
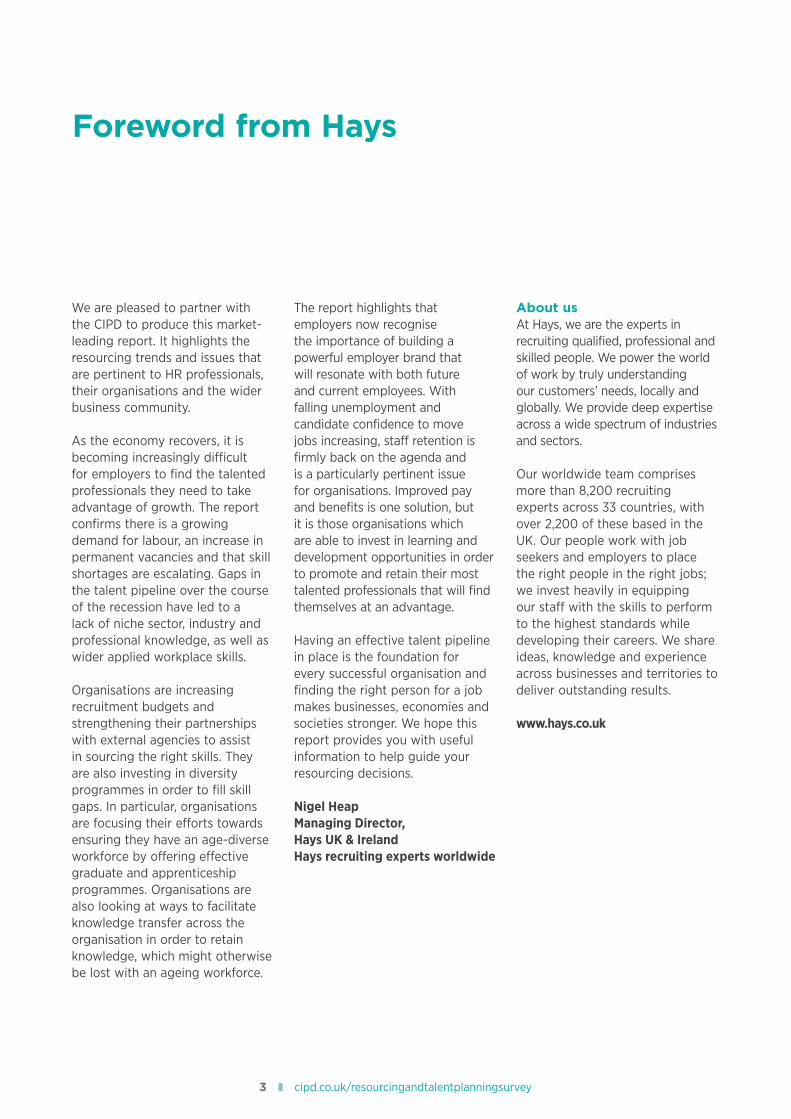
We are pleased to partner with the CIPD to produce this market-leading report. It highlights the resourcing trends and issues that are pertinent to HR professionals, their organisations and the wider business community.
As the economy recovers, it is becoming increasingly difficult for employers to find the talented professionals they need to take advantage of growth. The report confirms there is a growing demand for labour, an increase in permanent vacancies and that skill shortages are escalating. Gaps in the talent pipeline over the course of the recession have led to a lack of niche sector, industry and professional knowledge, as well as wider applied workplace skills.
Organisations are increasing recruitment budgets and strengthening their partnerships with external agencies to assist in sourcing the right skills. They are also investing in diversity programmes in order to fill skill gaps. In particular, organisations are focusing their efforts towards ensuring they have an age-diverse workforce by offering effective graduate and apprenticeship programmes. Organisations are also looking at ways to facilitate knowledge transfer across the organisation in order to retain knowledge, which might otherwise be lost with an ageing workforce.
The report highlights that employers now recognise the importance of building a powerful employer brand that will resonate with both future and current employees. With falling unemployment and candidate confidence to move jobs increasing, staff retention is firmly back on the agenda and is a particularly pertinent issue for organisations. Improved pay and benefits is one solution, but it is those organisations which are able to invest in learning and development opportunities in order to promote and retain their most talented professionals that will find themselves at an advantage.
Having an effective talent pipeline in place is the foundation for every successful organisation and finding the right person for a job makes businesses, economies and societies stronger. We hope this report provides you with useful information to help guide your resourcing decisions.
Nigel HeapManaging Director, Hays UK & IrelandHays recruiting experts worldwide
About usAt Hays, we are the experts in recruiting qualified, professional and skilled people. We power the world of work by truly understanding our customers’ needs, locally and globally. We provide deep expertise across a wide spectrum of industries and sectors.
Our worldwide team comprises more than 8,200 recruiting experts across 33 countries, with over 2,200 of these based in the UK. Our people work with job seekers and employers to place the right people in the right jobs; we invest heavily in equipping our staff with the skills to perform to the highest standards while developing their careers. We share ideas, knowledge and experience across businesses and territories to deliver outstanding results.
www.hays.co.uk
Foreword from Hays

4 Resourcing and Talent Planning Survey 2015
Resourcing and talent management in the current economy • Half of CEOs have talent
management as a key priority.• Organisations are increasingly
looking for talent outside of their organisation – three-quarters are recruiting key talent/niche areas.
• There is little change in the proportion of organisations developing more talent in-house or focusing on retaining rather than recruiting.
• There is a more positive outlook for resourcing budgets – at least for the private sector.
• There is a growing demand for labour – more than half of the private sector expect headcounts to increase in 2015, while two-fifths of the public sector anticipate decreases.
• There was an increase in permanant vacancies in 2014 – except in very large organisations. There is also considerable difference across sectors.
• The median number of short-term vacancies was higher than in 2013 but lower than the previous year – the median number of short-term vacancies in the public sector remains considerably lower than in 2012.
• There is not an obvious trend towards the greater use of a temporary or contract workforce – or an increased desire by employees for this type of employment relationship.
Recruitment difficulties• Skill shortages are escalating
– over four-fifths feel that competition for talent has increased over the past two years. Nearly two-thirds report that the skills needed for jobs in their organisation are changing.
• Over three-quarters experienced recruitment difficulties last year – an increasing proportion reported difficulties recruiting all staff categories, although, as in previous years, ‘other managers and professionals/specialists’ and ‘technical staff’ were the most difficult staff categories to fill, followed by ‘senior managers/directors’.
• Lack of specialist or technical skills and lack of sector/industry or general experience were common reasons for recruitment difficulties – although these varied according to the role. A fifth of those who have difficulty recruiting administrative or manual workers report pay is the main concern.
• There is little change in the practices employed to reduce recruitment difficulties – sponsoring relevant professional qualifications, up-skilling existing employees and recruiting candidates from different sectors or industries remain the most common practices organisations employ to reduce recruitment difficulties.
Summary of key findings
The CIPD’s Resourcing and Talent Planning survey, in partnership with Hays, examines organisations’ resourcing and talent planning strategies and practices and the key challenges and issues they face. The 2015 survey report is based on responses from 520 organisations.
5 cipd.co.uk/resourcingandtalentplanningsurvey
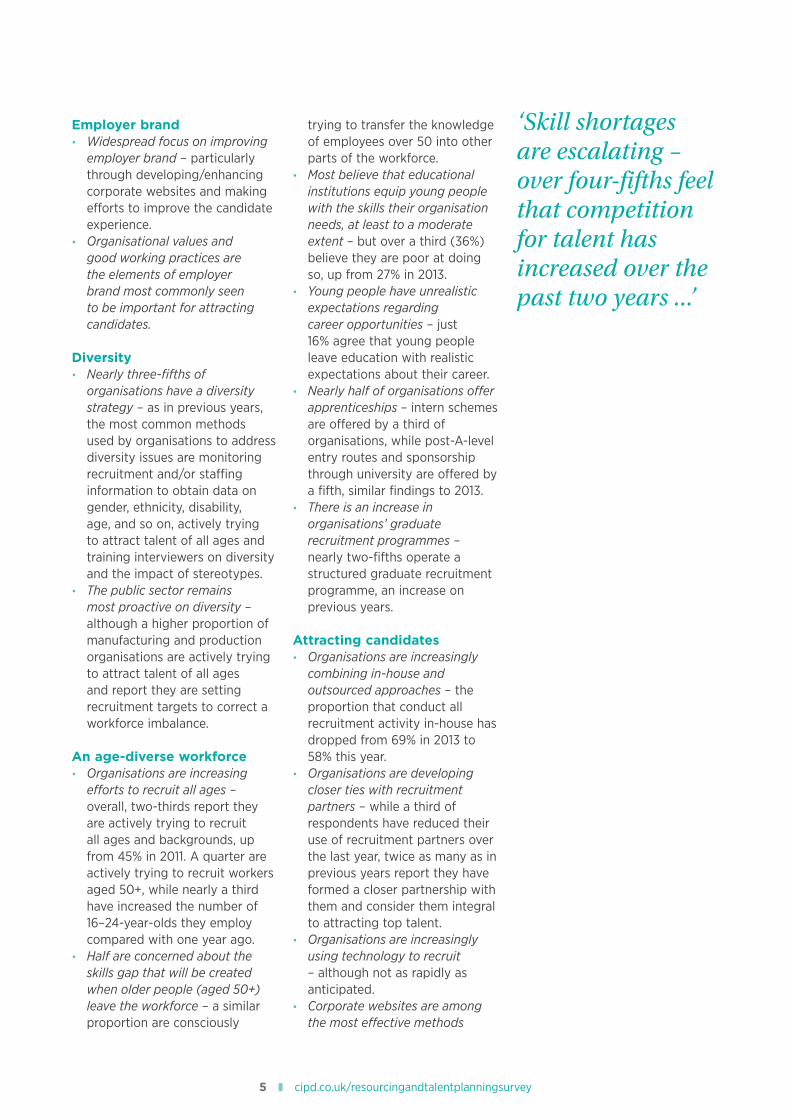
Employer brand• Widespread focus on improving
employer brand – particularly through developing/enhancing corporate websites and making efforts to improve the candidate experience.
• Organisational values and good working practices are the elements of employer brand most commonly seen to be important for attracting candidates.
Diversity• Nearly three-fifths of
organisations have a diversity strategy – as in previous years, the most common methods used by organisations to address diversity issues are monitoring recruitment and/or staffing information to obtain data on gender, ethnicity, disability, age, and so on, actively trying to attract talent of all ages and training interviewers on diversity and the impact of stereotypes.
• The public sector remains most proactive on diversity – although a higher proportion of manufacturing and production organisations are actively trying to attract talent of all ages and report they are setting recruitment targets to correct a workforce imbalance.
An age-diverse workforce• Organisations are increasing
efforts to recruit all ages – overall, two-thirds report they are actively trying to recruit all ages and backgrounds, up from 45% in 2011. A quarter are actively trying to recruit workers aged 50+, while nearly a third have increased the number of 16–24-year-olds they employ compared with one year ago.
• Half are concerned about the skills gap that will be created when older people (aged 50+) leave the workforce – a similar proportion are consciously
trying to transfer the knowledge of employees over 50 into other parts of the workforce.
• Most believe that educational institutions equip young people with the skills their organisation needs, at least to a moderate extent – but over a third (36%) believe they are poor at doing so, up from 27% in 2013.
• Young people have unrealistic expectations regarding career opportunities – just 16% agree that young people leave education with realistic expectations about their career.
• Nearly half of organisations offer apprenticeships – intern schemes are offered by a third of organisations, while post-A-level entry routes and sponsorship through university are offered by a fifth, similar findings to 2013.
• There is an increase in organisations’ graduate recruitment programmes – nearly two-fifths operate a structured graduate recruitment programme, an increase on previous years.
Attracting candidates• Organisations are increasingly
combining in-house and outsourced approaches – the proportion that conduct all recruitment activity in-house has dropped from 69% in 2013 to 58% this year.
• Organisations are developing closer ties with recruitment partners – while a third of respondents have reduced their use of recruitment partners over the last year, twice as many as in previous years report they have formed a closer partnership with them and consider them integral to attracting top talent.
• Organisations are increasingly using technology to recruit – although not as rapidly as anticipated.
• Corporate websites are among the most effective methods
‘Skill shortages are escalating – over four-fifths feel that competition for talent has increased over the past two years ...’

6 Resourcing and Talent Planning Survey 2015
for attracting all employee groups – search and recruitment consultants are also among the most effective methods, particularly for more senior roles.
Selecting candidates• Interviews remain the most
common selection method – with interviews following CVs/application forms increasing in use over the last few years. More organisations are conducting interviews by telephone, video or Skype (although virtually all also conduct interviews face-to-face).
• The majority of candidates arrive promptly for interviews, behave with sincerity and provide accurate CVs – although this is not always the case. Similar to previous findings, organisations were less positive about the quality and promptness of candidates’ communications.
• Recruiting senior managers/directors remains considerably more expensive than other employees – the median cost per hire was £7,250 for senior managers/directors, an increase on 2013 but a decrease on previous years. For other employees the median cost was £2,000, the same as in 2013 but, as with senior managers, lower than in previous years.
Talent management• There has been an increase
in labour turnover in 2014 – reversing the steady decline observed in previous years.
• Nearly half of the private sector increased their talent management spend last year – while just a small minority report it decreased. The situation was considerably more mixed in the public and not-for-profit sectors.
• More than three-quarters of organisations had challenges retaining staff – similar to findings from the 2013 survey but showing an increase on previous years. ‘Other managers and professionals/specialists’ and ‘technical staff’ were the most difficult roles to retain as in previous years but different retention issues affected different sectors.
• Most made specific efforts to address retention through improvements to pay, benefits, learning and development opportunities and improving line managers’ people skills – the proportion attempting to address retention through improved pay and benefits has increased steadily since 2009, back to pre-recession levels (although this was significantly less common in the public sector). Increasing learning and development opportunities and improving line managers’ people skills were also common strategies to improve retention.
• Only 15% of respondents report their organisation calculates the cost of labour turnover.
‘Nearly half of the private sector increased their talent management spend last year.’
7 cipd.co.uk/resourcingandtalentplanningsurvey
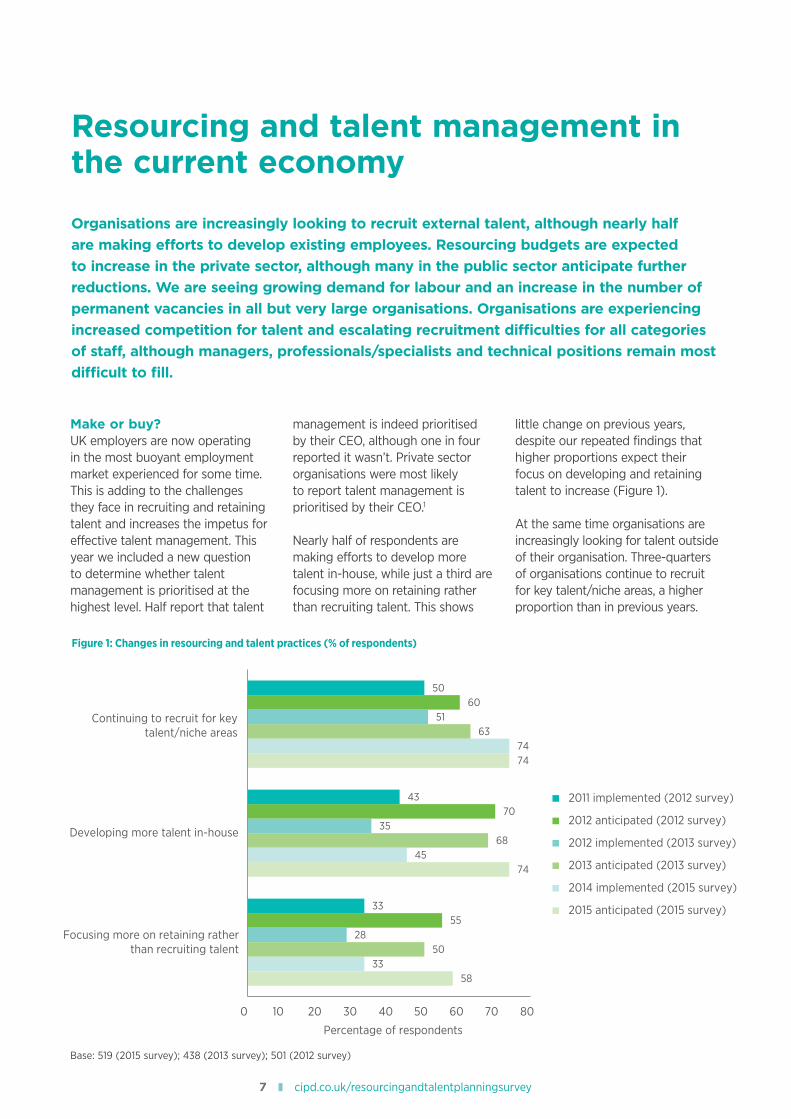
Make or buy?UK employers are now operating in the most buoyant employment market experienced for some time. This is adding to the challenges they face in recruiting and retaining talent and increases the impetus for effective talent management. This year we included a new question to determine whether talent management is prioritised at the highest level. Half report that talent
management is indeed prioritised by their CEO, although one in four reported it wasn’t. Private sector organisations were most likely to report talent management is prioritised by their CEO.1
Nearly half of respondents are making efforts to develop more talent in-house, while just a third are focusing more on retaining rather than recruiting talent. This shows
little change on previous years, despite our repeated findings that higher proportions expect their focus on developing and retaining talent to increase (Figure 1).
At the same time organisations are increasingly looking for talent outside of their organisation. Three-quarters of organisations continue to recruit for key talent/niche areas, a higher proportion than in previous years.
Resourcing and talent management in the current economy
Organisations are increasingly looking to recruit external talent, although nearly half are making efforts to develop existing employees. Resourcing budgets are expected to increase in the private sector, although many in the public sector anticipate further reductions. We are seeing growing demand for labour and an increase in the number of permanent vacancies in all but very large organisations. Organisations are experiencing increased competition for talent and escalating recruitment difficulties for all categories of staff, although managers, professionals/specialists and technical positions remain most difficult to fill.
Figure 1: Changes in resourcing and talent practices (% of respondents)
58
74
74
33
45
74
50
68
63
28
35
51
55
70
60
33
43
50
0 10 20 30 40 50 60 70 80
Focusing more on retaining ratherthan recruiting talent
Developing more talent in-house
Continuing to recruit for keytalent/niche areas
Percentage of respondents
2011 implemented (2012 survey)
2012 anticipated (2012 survey)
2012 implemented (2013 survey)
2013 anticipated (2013 survey)
2014 implemented (2015 survey)
2015 anticipated (2015 survey)
Base: 519 (2015 survey); 438 (2013 survey); 501 (2012 survey)
8 Resourcing and Talent Planning Survey 2015
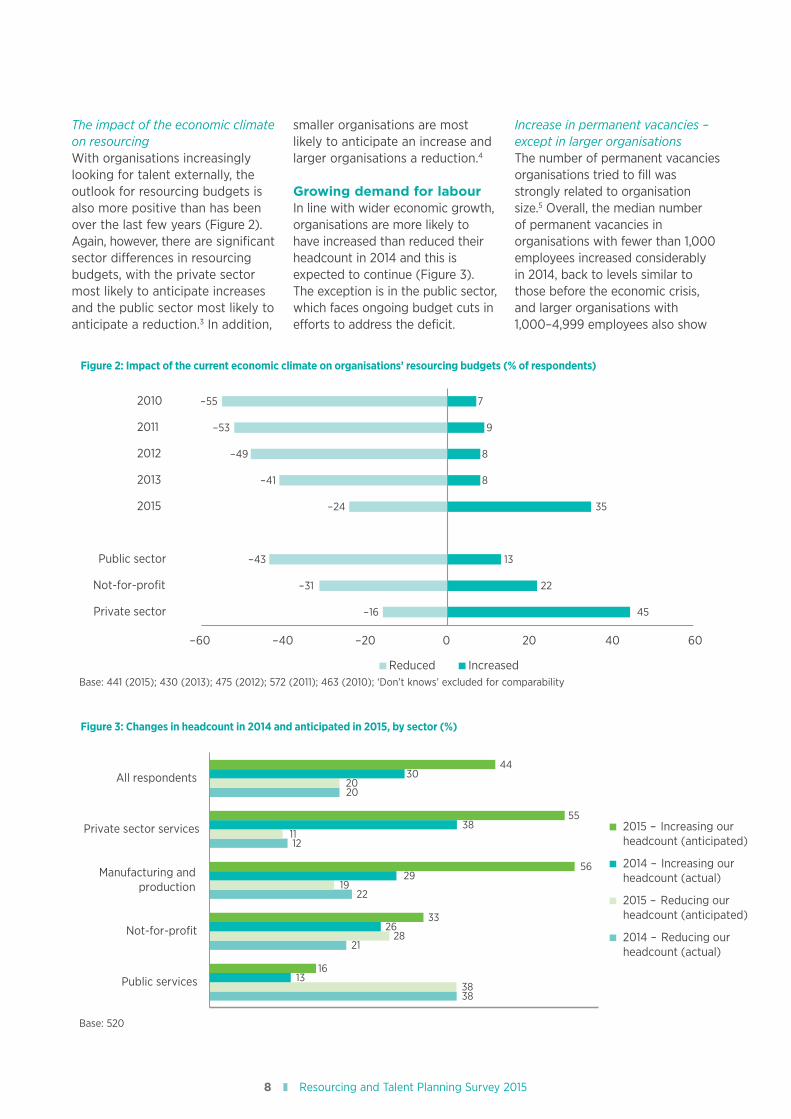
The impact of the economic climate on resourcingWith organisations increasingly looking for talent externally, the outlook for resourcing budgets is also more positive than has been over the last few years (Figure 2). Again, however, there are significant sector differences in resourcing budgets, with the private sector most likely to anticipate increases and the public sector most likely to anticipate a reduction.3 In addition,
smaller organisations are most likely to anticipate an increase and larger organisations a reduction.4
Growing demand for labourIn line with wider economic growth, organisations are more likely to have increased than reduced their headcount in 2014 and this is expected to continue (Figure 3). The exception is in the public sector, which faces ongoing budget cuts in efforts to address the deficit.
Increase in permanent vacancies – except in larger organisationsThe number of permanent vacancies organisations tried to fill was strongly related to organisation size.5 Overall, the median number of permanent vacancies in organisations with fewer than 1,000 employees increased considerably in 2014, back to levels similar to those before the economic crisis, and larger organisations with 1,000–4,999 employees also show
Figure 2: Impact of the current economic climate on organisations’ resourcing budgets (% of respondents)
Figure 3: Changes in headcount in 2014 and anticipated in 2015, by sector (%)
Private sector
Not-for-profit
Public sector
2015
2013
2012
2011
2010
-16
-31
-43
-24
-41
-49
-53
45
22
13
35
8
8
9
7
-60 -40 -20 0 20 40 60
Reduced Increased
-55
38
21
22
12
20
38
28
19
11
20
13
26
29
38
30
16
33
56
55
44
0 20 40 60
Public services
Not-for-profit
Manufacturing andproduction
Private sector services
All respondents
2015 - Increasing ourheadcount (anticipated)
2014 - Increasing ourheadcount (actual)
2015 - Reducing ourheadcount (anticipated)
2014 - Reducing ourheadcount (actual)
Base: 441 (2015); 430 (2013); 475 (2012); 572 (2011); 463 (2010); ‘Don’t knows’ excluded for comparability
Base: 520

9 cipd.co.uk/resourcingandtalentplanningsurvey
an increase on the last few years (Table 1).
There are, however, considerable differences across sectors. The median number of vacancies that the public and not-for-profit sectors tried to fill in 2014 show an increase on 2013 but remain lower than previous years.
Moreover, the median number of vacancies in very large organisations (more than 5,000 employees) remains comparatively low. As noted below (see ‘Availability of labour’, page 10), larger organisations are more likely to report that
technology and automation is replacing some jobs. It is also likely that larger organisations, which have more scope for belt-tightening and efficiencies, are retaining the focus on costs necessitated by the economic downturn and uncertainty of the last few years.
Short-term job vacancies – dramatic decline in the public sectorAs with permanent vacancies, the number of short-term vacancies was strongly related to organisation size6 and varied considerably within and between sectors (Table 2). The median number of short-term vacancies
Table 1: Median number of permanent vacancies organisations tried to fill, by size of organisation and sector
Number of permanent employees
Vacancies in 2014
(2015 survey, base: 328)
Vacancies in 2013
(2015 survey, base: 223)
Vacancies in 2012
(2013 survey, base: 422)
Vacancies in 2011
(2012 survey, base: 500)
Vacancies in 2010
(2011 survey, base: 577)
Vacancies in 2009
(2010 survey, base: 442)
Vacancies in 2008
(2009 survey, base: 683)
All sectors 20 10 25 25 20 20 30
1–49 2 2 3 2 3 310b
50–249 20 12 15 15 12 12
250–999 60 35 45 40 45 46 60b
1,000–4,999 200 123 150 120 110 100 300b
More than 5,000 293 380a 600 300 200 550 800
Private sector 21 10 18 22 20 20 20
1–49 2 2 3 2 3 310b
50–249 20 16 15 15 12 10
250–999 60 38 44 40 50 45 52b
1,000–4,999 204c 200e 250 150 150 100 300b
More than 5,000 250d 260f 550 400 500 850 800
Public sector 33 25 85 40 30 80 100
Not-for- profit 15 10 20 20 20 20 22
a Only 14 organisations were in this category, so the median should be considered with caution.b The categories for number of permanent staff employed in the UK differed slightly in the 2009 survey (250 or fewer; 251–500, 501–1,000, 1,001–5,000, 5,001–
10,000, 10,001+). 2009 categories have been combined where appropriate and otherwise matched with the best corresponding category of 2010–11.c Only 19 organisations were in this category, so the median should be considered with caution.d Only 17 organisations were in this category, so the median should be considered with caution.e Only 10 organisations were in this category, so the median should be considered with caution.f Only 11 organisations were in this category, so the median should be considered with caution.
‘... there are significant sector differences in resourcing budgets with the private sector most likely to anticipate increases and the public sector most likely to anticipate a reduction.’
10 Resourcing and Talent Planning Survey 2015
is highest in the public sector, as would be expected given that public sector organisations tend to be larger.7 Nevertheless, the median number of short-term vacancies in the public sector has declined dramatically since 2012.
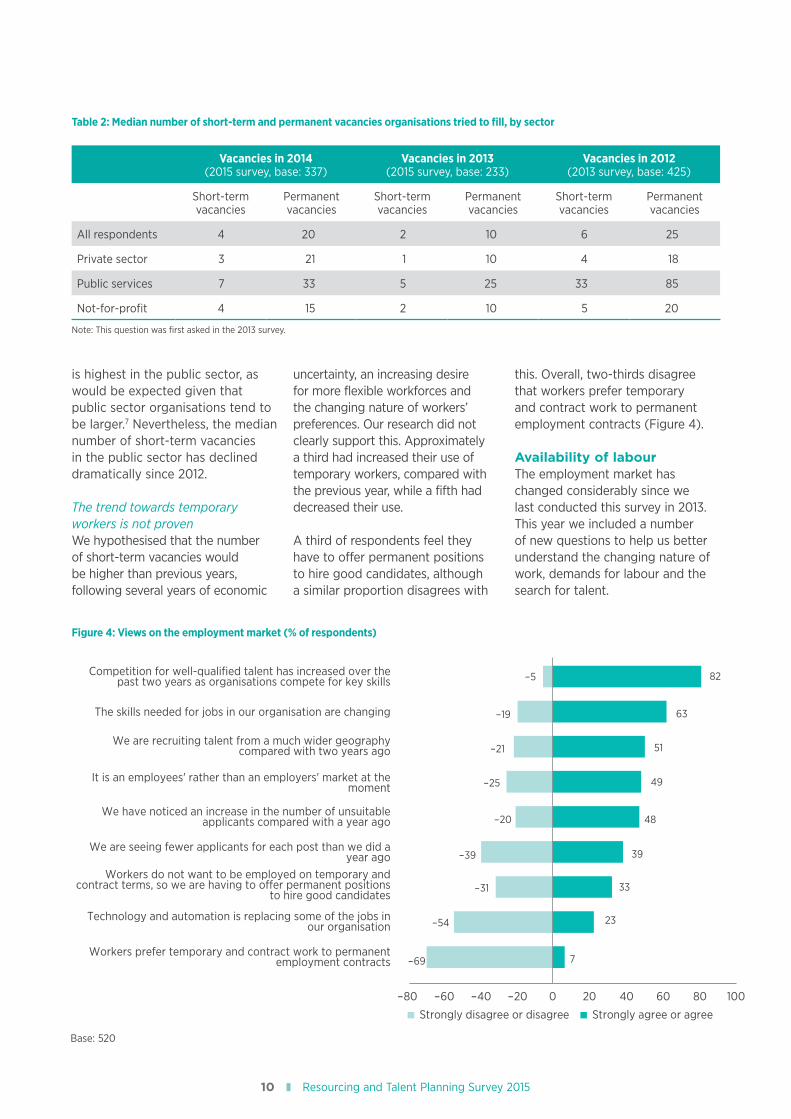
The trend towards temporary workers is not provenWe hypothesised that the number of short-term vacancies would be higher than previous years, following several years of economic
uncertainty, an increasing desire for more flexible workforces and the changing nature of workers’ preferences. Our research did not clearly support this. Approximately a third had increased their use of temporary workers, compared with the previous year, while a fifth had decreased their use.
A third of respondents feel they have to offer permanent positions to hire good candidates, although a similar proportion disagrees with
this. Overall, two-thirds disagree that workers prefer temporary and contract work to permanent employment contracts (Figure 4).
Availability of labourThe employment market has changed considerably since we last conducted this survey in 2013. This year we included a number of new questions to help us better understand the changing nature of work, demands for labour and the search for talent.
Table 2: Median number of short-term and permanent vacancies organisations tried to fill, by sector
Vacancies in 2014 (2015 survey, base: 337)
Vacancies in 2013 (2015 survey, base: 233)
Vacancies in 2012 (2013 survey, base: 425)
Short-term vacancies
Permanent vacancies
Short-term vacancies
Permanent vacancies
Short-term vacancies
Permanent vacancies
All respondents 4 20 2 10 6 25
Private sector 3 21 1 10 4 18
Public services 7 33 5 25 33 85
Not-for-profit 4 15 2 10 5 20
Note: This question was first asked in the 2013 survey.
Figure 4: Views on the employment market (% of respondents)
7
23
33
39
48
49
51
63
82 -5Competition for well-qualified talent has increased over the past two years as organisations compete for key skills
The skills needed for jobs in our organisation are changing
We are recruiting talent from a much wider geography compared with two years ago
It is an employees' rather than an employers' market at the moment
We have noticed an increase in the number of unsuitable applicants compared with a year ago
We are seeing fewer applicants for each post than we did a year ago
Workers do not want to be employed on temporary and contract terms, so we are having to o�er permanent positions
to hire good candidates
Technology and automation is replacing some of the jobs in our organisation
Workers prefer temporary and contract work to permanent employment contracts
-80 -60 -40 -20 0 20 40 60 80 100
Strongly agree or agreeStrongly disagree or disagree
-21
-19
-25
-69
-54
-31
-39
-20
Base: 520
11 cipd.co.uk/resourcingandtalentplanningsurvey
The majority of organisations report that competition for talent has increased over the past two years (Figure 4). Competition for talent is most commonly seen to be increasing in the private sector, where more recruitment is taking place (86% report that competition for talent is greater now compared with 73% of the public sector and 72% of not-for-profits).8 This trend may be exacerbated by the growth in employment, but it also reflects changes in organisations that are resulting in a growing demand for specific or technical skills that are not readily available in the labour market. A quarter of organisations report that technology and automation is replacing some jobs in their organisation, but this is more common in larger businesses, which are also most likely to report
that the skills needed for jobs in their organisation are changing.9
Organisations are twice as likely to agree than disagree that it is an employees’ rather than an employers’ market at the moment. Many, particularly large organisations, are responding to skill shortages by recruiting from a wider geography.10
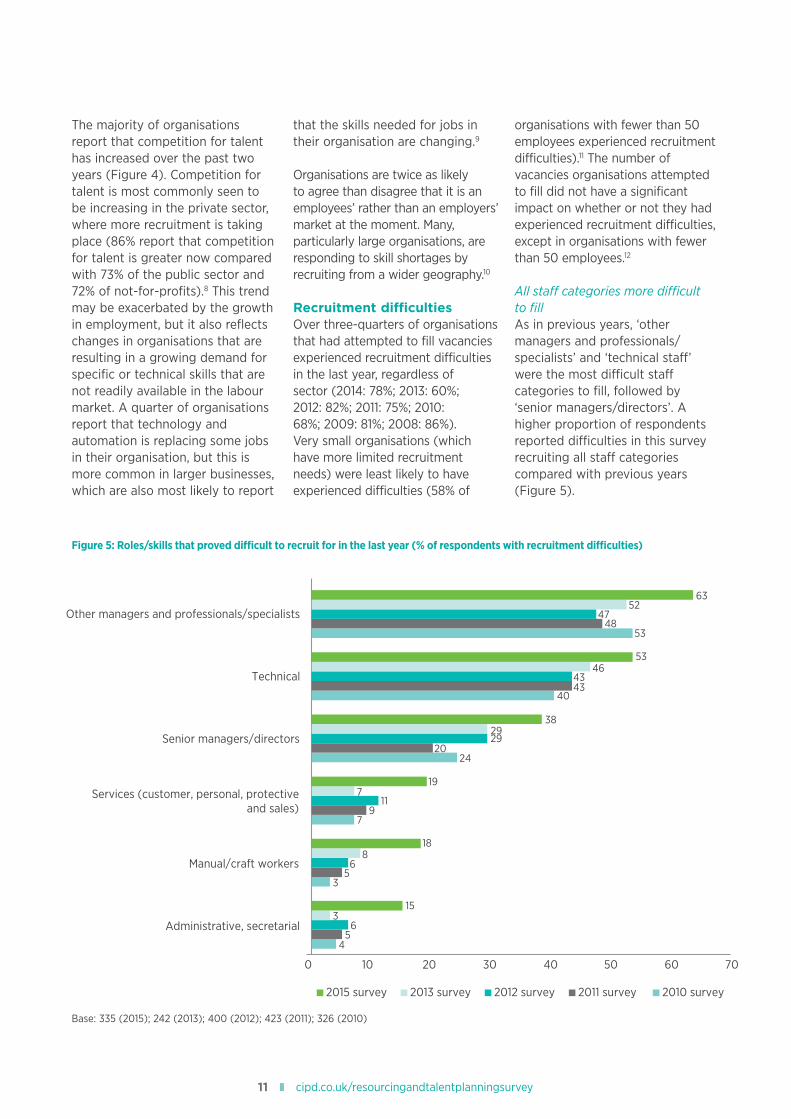
Recruitment difficultiesOver three-quarters of organisations that had attempted to fill vacancies experienced recruitment difficulties in the last year, regardless of sector (2014: 78%; 2013: 60%; 2012: 82%; 2011: 75%; 2010: 68%; 2009: 81%; 2008: 86%). Very small organisations (which have more limited recruitment needs) were least likely to have experienced difficulties (58% of
organisations with fewer than 50 employees experienced recruitment difficulties).11 The number of vacancies organisations attempted to fill did not have a significant impact on whether or not they had experienced recruitment difficulties, except in organisations with fewer than 50 employees.12
All staff categories more difficult to fillAs in previous years, ‘other managers and professionals/specialists’ and ‘technical staff’ were the most difficult staff categories to fill, followed by ‘senior managers/directors’. A higher proportion of respondents reported difficulties in this survey recruiting all staff categories compared with previous years (Figure 5).
Figure 5: Roles/skills that proved difficult to recruit for in the last year (% of respondents with recruitment difficulties)
4
3
7
24
40
53
5
5
9
20
48
6
6
11
29
4343
47
3
8
7
29
46
52
15
18
19
38
53
63
0 10 20 30 40 50 60 70
Administrative, secretarial
Manual/craft workers
Services (customer, personal, protectiveand sales)
Senior managers/directors
Technical
Other managers and professionals/specialists
2015 survey 2013 survey 2012 survey 2011 survey 2010 survey
Base: 335 (2015); 242 (2013); 400 (2012); 423 (2011); 326 (2010)
12 Resourcing and Talent Planning Survey 2015
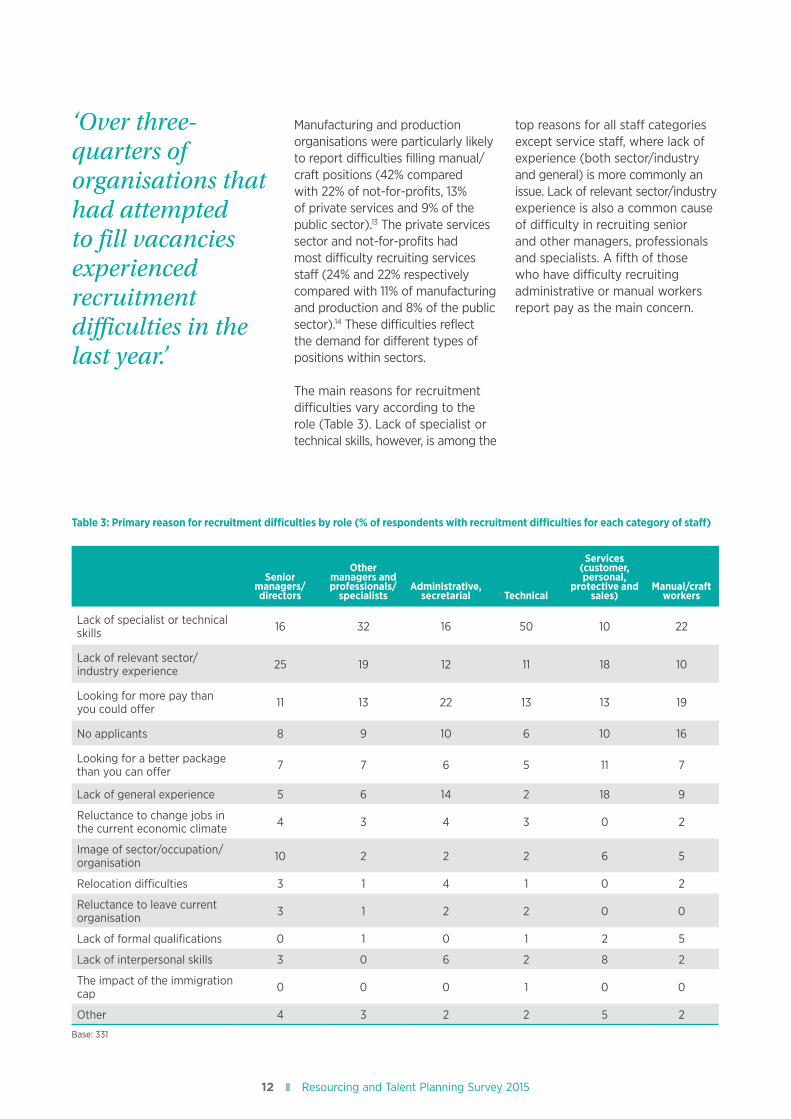
Manufacturing and production organisations were particularly likely to report difficulties filling manual/craft positions (42% compared with 22% of not-for-profits, 13% of private services and 9% of the public sector).13 The private services sector and not-for-profits had most difficulty recruiting services staff (24% and 22% respectively compared with 11% of manufacturing and production and 8% of the public sector).14 These difficulties reflect the demand for different types of positions within sectors.
The main reasons for recruitment difficulties vary according to the role (Table 3). Lack of specialist or technical skills, however, is among the
top reasons for all staff categories except service staff, where lack of experience (both sector/industry and general) is more commonly an issue. Lack of relevant sector/industry experience is also a common cause of difficulty in recruiting senior and other managers, professionals and specialists. A fifth of those who have difficulty recruiting administrative or manual workers report pay as the main concern.
Table 3: Primary reason for recruitment difficulties by role (% of respondents with recruitment difficulties for each category of staff)
Senior managers/ directors
Other managers and professionals/
specialistsAdministrative,
secretarial Technical
Services (customer, personal,
protective and sales)
Manual/craft workers
Lack of specialist or technical skills 16 32 16 50 10 22
Lack of relevant sector/industry experience 25 19 12 11 18 10
Looking for more pay than you could offer 11 13 22 13 13 19
No applicants 8 9 10 6 10 16
Looking for a better package than you can offer 7 7 6 5 11 7
Lack of general experience 5 6 14 2 18 9
Reluctance to change jobs in the current economic climate 4 3 4 3 0 2
Image of sector/occupation/organisation 10 2 2 2 6 5
Relocation difficulties 3 1 4 1 0 2
Reluctance to leave current organisation 3 1 2 2 0 0
Lack of formal qualifications 0 1 0 1 2 5
Lack of interpersonal skills 3 0 6 2 8 2
The impact of the immigration cap 0 0 0 1 0 0
Other 4 3 2 2 5 2
Base: 331
‘Over three-quarters of organisations that had attempted to fill vacancies experienced recruitment difficulties in the last year.’
13 cipd.co.uk/resourcingandtalentplanningsurvey
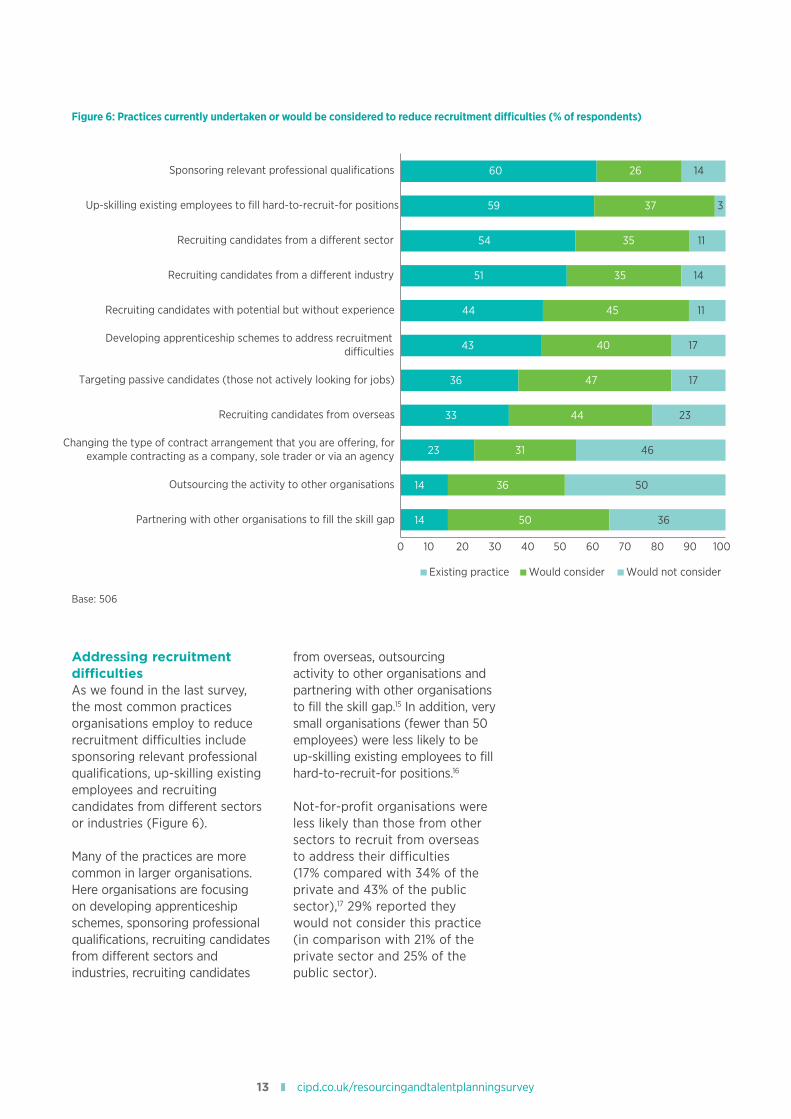
Addressing recruitment difficultiesAs we found in the last survey, the most common practices organisations employ to reduce recruitment difficulties include sponsoring relevant professional qualifications, up-skilling existing employees and recruiting candidates from different sectors or industries (Figure 6).
Many of the practices are more common in larger organisations. Here organisations are focusing on developing apprenticeship schemes, sponsoring professional qualifications, recruiting candidates from different sectors and industries, recruiting candidates
from overseas, outsourcing activity to other organisations and partnering with other organisations to fill the skill gap.15 In addition, very small organisations (fewer than 50 employees) were less likely to be up-skilling existing employees to fill hard-to-recruit-for positions.16
Not-for-profit organisations were less likely than those from other sectors to recruit from overseas to address their difficulties (17% compared with 34% of the private and 43% of the public sector),17 29% reported they would not consider this practice (in comparison with 21% of the private sector and 25% of the public sector).
Figure 6: Practices currently undertaken or would be considered to reduce recruitment difficulties (% of respondents)
14
14
23
33
36
43
44
51
54
59
60
50
36
31
44
47
40
45
35
35
26
36
50
46
23
17
17
11
14
11
3
14
100 20 30 40 50 60 70 80 90 100
Partnering with other organisations to fill the skill gap
Outsourcing the activity to other organisations
Changing the type of contract arrangement that you are o�ering, forexample contracting as a company, sole trader or via an agency
Recruiting candidates from overseas
Targeting passive candidates (those not actively looking for jobs)
Developing apprenticeship schemes to address recruitmentdi�culties
Recruiting candidates with potential but without experience
Recruiting candidates from a di�erent industry
Recruiting candidates from a di�erent sector
Up-skilling existing employees to fill hard-to-recruit-for positions
Sponsoring relevant professional qualifications
Existing practice Would consider Would not consider
37
Base: 506
14 Resourcing and Talent Planning Survey 2015
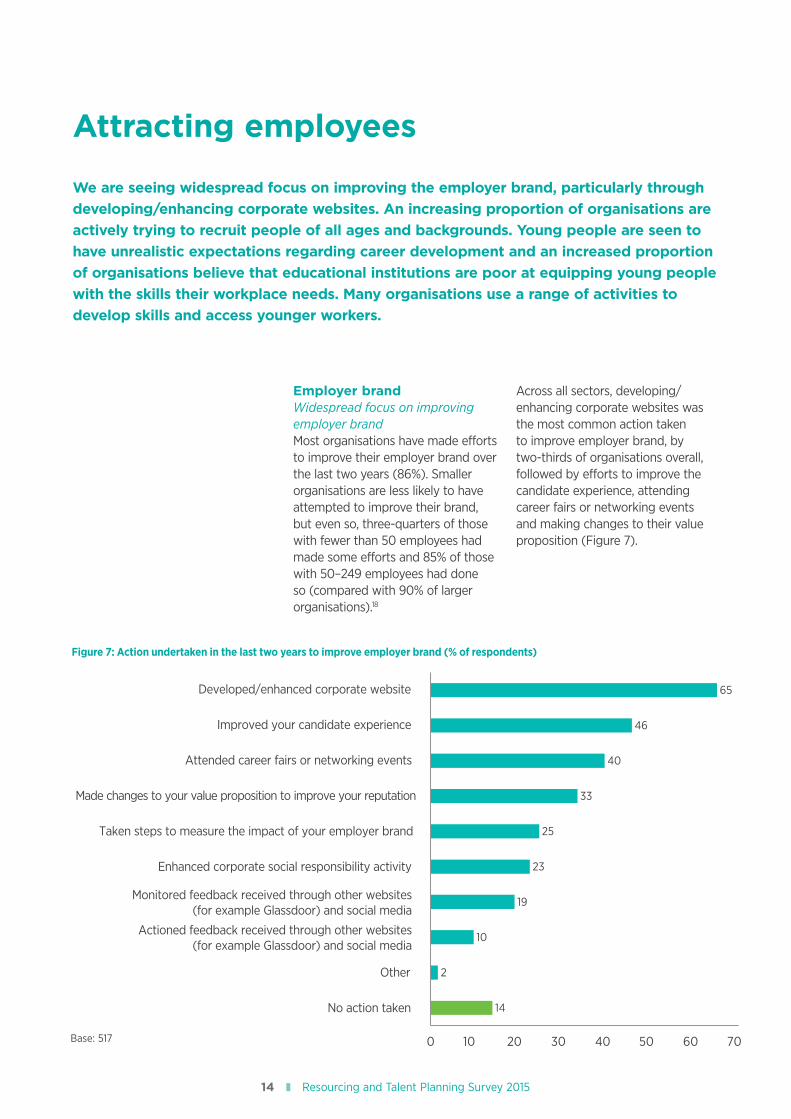
Employer brand Widespread focus on improving employer brandMost organisations have made efforts to improve their employer brand over the last two years (86%). Smaller organisations are less likely to have attempted to improve their brand, but even so, three-quarters of those with fewer than 50 employees had made some efforts and 85% of those with 50–249 employees had done so (compared with 90% of larger organisations).18
Across all sectors, developing/enhancing corporate websites was the most common action taken to improve employer brand, by two-thirds of organisations overall, followed by efforts to improve the candidate experience, attending career fairs or networking events and making changes to their value proposition (Figure 7).
Attracting employees
We are seeing widespread focus on improving the employer brand, particularly through developing/enhancing corporate websites. An increasing proportion of organisations are actively trying to recruit people of all ages and backgrounds. Young people are seen to have unrealistic expectations regarding career development and an increased proportion of organisations believe that educational institutions are poor at equipping young people with the skills their workplace needs. Many organisations use a range of activities to develop skills and access younger workers.
Figure 7: Action undertaken in the last two years to improve employer brand (% of respondents)
14
2
10
19
23
25
33
40
46
65
0 10 20 30 40 50 60 70
Developed/enhanced corporate website
Improved your candidate experience
Attended career fairs or networking events
Made changes to your value proposition to improve your reputation
Taken steps to measure the impact of your employer brand
Enhanced corporate social responsibility activity
Monitored feedback received through other websites (for example Glassdoor) and social media
Actioned feedback received through other websites (for example Glassdoor) and social media
Other
No action taken
Base: 517
15 cipd.co.uk/resourcingandtalentplanningsurvey
Case study: L’Oréal – their people are worth it!
L’Oréal is the world’s number one beauty company, present in 130 countries, five continents, employing over 77,000 people globally and 3,500 in the UK and Ireland. By 2020 the group aims to recruit 1 billion new consumers globally as part of its universalisation strategy.
Pivotal to the group’s success is its culture of innovation and entrepreneurialism. The belief that people rather than processes fuel ideas is a mantra that allows L’Oréal to attract and retain the best talent.
Catrin Roberts, Recruitment Director for L’Oréal UK&I, explains: ‘We find talent are equally attracted to our position as industry leader of 28 different beauty brands, as they are to our fast-moving innovative culture. We’re clear we want people who are bold, daring and creative – people who have an innovative flair and believe “nothing is impossible”.’
Alongside world-leading brands, L’Oréal realises that as part of the company’s attraction and retention strategy are its CSR commitments. The group’s sustainability commitment for 2020 – ‘Sharing beauty with all’ – revolves around producing, living and developing sustainably. Clear targets have been set for 2020 to reduce CO2 emissions by 60%, to enable 100,000 people from underprivileged communities to access work and to give employees access to health care, social protection and training, wherever they are in the world.
‘People are becoming savvier about CSR. They want to know what we’re committing to, and what we’re doing to give back to our communities. We support over 250 charities at L’Oréal UK&I alone,’ explains Negin Lankarani, Graduate & Intern Manager.
Diversity plays a huge part in L’Oréal’s ability to recruit a range of talents, with the company believing that a diverse workforce is key to promoting a creative and innovative environment. The company actively works to attract a gender balance by supporting the Male Undergraduate of the Year Programme, encouraging an agile approach to working, and it also works with the Army Career Service to offer individuals work experience opportunities to support their integration back into the world of work following serious or life-changing injuries. As Negin Lankarani states, ‘it’s not about a one-size-fits-all approach, it’s about offering a whole range of different initiatives to create an inclusive environment … that’s what our experienced hires as well as our interns and graduates want and expect from us.’
L’Oréal also strives to create opportunities for young people coming from diverse social and academic backgrounds through industrial placements, internships and graduate management trainee schemes.
Every year they recruit over 100 industrial placements, including summer internships, and over the last two years they have offered over 70% of the management trainee places to previous interns. The management trainee scheme is a 12-month rotational programme where individuals get to experience different divisions and functions within the business. All management trainees have a structured training programme and receive an HR sponsor throughout their time on the programme. Their performance and development on the scheme is frequently tracked, ensuring that top talent is recognised and retained.
L’Oréal offers tailor-made career paths across 28 of its international brands because, as Catrin Roberts explains, ‘people have different needs and wants at different points in their career and as a company we need to be flexible and agile to meet the individuals’ needs.’ Career paths are tailored to meet people’s competencies and aspirations to promote mobility within country as well as at group level across the different divisions and functions. Regular appraisal of performance where technical skills, key job accountabilities and behavioural competencies are evaluated is fundamental to supporting individuals with their next step and designing a development plan that supports their longer-term career aspirations.
16 Resourcing and Talent Planning Survey 2015
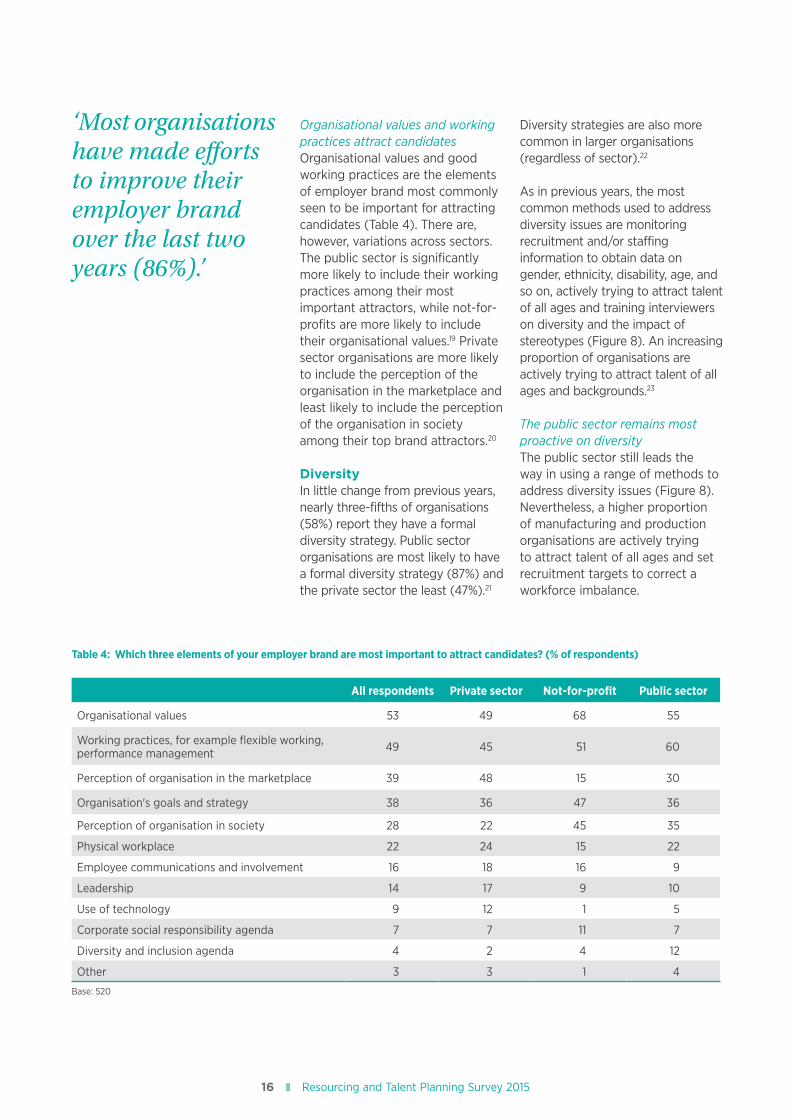
Organisational values and working practices attract candidatesOrganisational values and good working practices are the elements of employer brand most commonly seen to be important for attracting candidates (Table 4). There are, however, variations across sectors. The public sector is significantly more likely to include their working practices among their most important attractors, while not-for-profits are more likely to include their organisational values.19 Private sector organisations are more likely to include the perception of the organisation in the marketplace and least likely to include the perception of the organisation in society among their top brand attractors.20
DiversityIn little change from previous years, nearly three-fifths of organisations (58%) report they have a formal diversity strategy. Public sector organisations are most likely to have a formal diversity strategy (87%) and the private sector the least (47%).21
Diversity strategies are also more common in larger organisations (regardless of sector).22
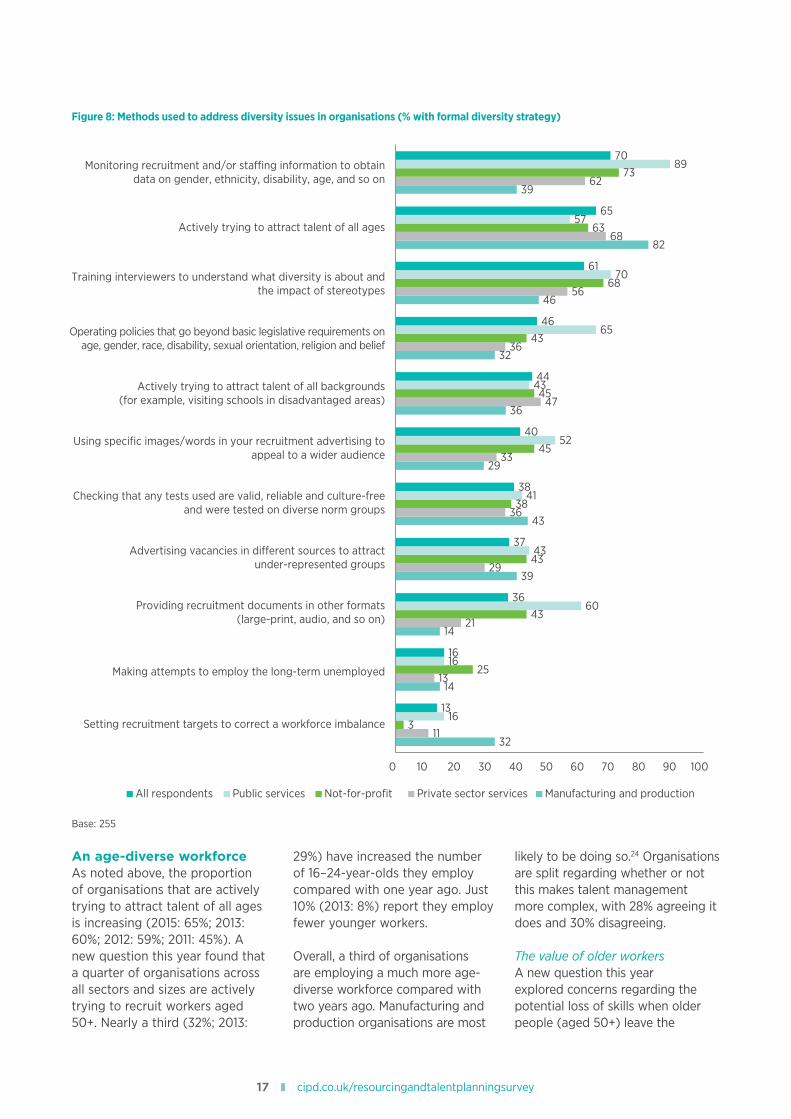
As in previous years, the most common methods used to address diversity issues are monitoring recruitment and/or staffing information to obtain data on gender, ethnicity, disability, age, and so on, actively trying to attract talent of all ages and training interviewers on diversity and the impact of stereotypes (Figure 8). An increasing proportion of organisations are actively trying to attract talent of all ages and backgrounds.23
The public sector remains most proactive on diversityThe public sector still leads the way in using a range of methods to address diversity issues (Figure 8). Nevertheless, a higher proportion of manufacturing and production organisations are actively trying to attract talent of all ages and set recruitment targets to correct a workforce imbalance.
Table 4: Which three elements of your employer brand are most important to attract candidates? (% of respondents)
All respondents Private sector Not-for-profit Public sector
Organisational values 53 49 68 55
Working practices, for example flexible working, performance management 49 45 51 60
Perception of organisation in the marketplace 39 48 15 30
Organisation's goals and strategy 38 36 47 36
Perception of organisation in society 28 22 45 35
Physical workplace 22 24 15 22
Employee communications and involvement 16 18 16 9
Leadership 14 17 9 10
Use of technology 9 12 1 5
Corporate social responsibility agenda 7 7 11 7
Diversity and inclusion agenda 4 2 4 12
Other 3 3 1 4
Base: 520
‘Most organisations have made efforts to improve their employer brand over the last two years (86%).’
17 cipd.co.uk/resourcingandtalentplanningsurvey
An age-diverse workforceAs noted above, the proportion of organisations that are actively trying to attract talent of all ages is increasing (2015: 65%; 2013: 60%; 2012: 59%; 2011: 45%). A new question this year found that a quarter of organisations across all sectors and sizes are actively trying to recruit workers aged 50+. Nearly a third (32%; 2013:
29%) have increased the number of 16–24-year-olds they employ compared with one year ago. Just 10% (2013: 8%) report they employ fewer younger workers.
Overall, a third of organisations are employing a much more age-diverse workforce compared with two years ago. Manufacturing and production organisations are most
likely to be doing so.24 Organisations are split regarding whether or not this makes talent management more complex, with 28% agreeing it does and 30% disagreeing.
The value of older workersA new question this year explored concerns regarding the potential loss of skills when older people (aged 50+) leave the
Figure 8: Methods used to address diversity issues in organisations (% with formal diversity strategy)
32
14
14
39
43
29
36
32
46
82
39
11
13
21
29
36
33
47
36
56
68
62
3
25
43
43
38
45
45
43
68
63
73
16
16
60
43
41
52
43
65
70
57
89
13
16
36
37
38
40
44
46
61
65
70
0 10 20 30 40 50 60 70 80 90 100
Monitoring recruitment and/or sta�ng information to obtain data on gender, ethnicity, disability, age, and so on
Actively trying to attract talent of all ages
Training interviewers to understand what diversity is about and the impact of stereotypes
Operating policies that go beyond basic legislative requirements on age, gender, race, disability, sexual orientation, religion and belief
Actively trying to attract talent of all backgrounds (for example, visiting schools in disadvantaged areas)
Using specific images/words in your recruitment advertising to appeal to a wider audience
Checking that any tests used are valid, reliable and culture-free and were tested on diverse norm groups
Advertising vacancies in di�erent sources to attract under-represented groups
Providing recruitment documents in other formats (large-print, audio, and so on)
Making attempts to employ the long-term unemployed
Setting recruitment targets to correct a workforce imbalance
All respondents Public services Not-for-profit Private sector services Manufacturing and production
Base: 255
18 Resourcing and Talent Planning Survey 2015
workforce. Overall, just over half of organisations that responded in the survey are concerned about the skills gap that will be created, but this rises to two-thirds of those in manufacturing and production and the public sector.25
Just over half are consciously trying to transfer the knowledge of employees over 50 into other parts of the workforce. Manufacturing and production organisations are particularly likely to be doing this (73% compared with half of those in other sectors).26 Those who are
concerned about the skills gap that will be created when employees aged 50+ leave are most likely to be proactive in attempting to transfer their knowledge to other parts of the workforce.27 Nevertheless, 29% of those who have concerns about the skills gap are not consciously
Case study: Timpson Group (Timpson & Max Spielmann)
Timpson is a family-owned multi-service operation, best known for their 1,300+ branches repairing shoes, jewellery, watches, cutting keys and photo services in Ireland and the UK, where they employ over 3,500 people.
Timpson does not have an HR department but a colleague support team with similar functions, explains Louise Plevin, Colleague Support Advisor at Manchester. They assist and help area managers, the area teams and also colleagues with regards to any issues.
Timpson uses the word ‘colleagues’ rather than ‘staff’ or ‘employees’ with a view to building and maintaining a collaborative and supportive working environment far from traditional hierarchies.
Diversity is a value deeply rooted into their culture.
Age diversity within the organisation is wide, as they hire young people wanting to work straight after college but also long-serving colleagues that are nearing retirement age.
They are also an ex-offender-friendly employer, as 10% of their workforce is composed of colleagues with criminal records. Women- and age-friendly policies and practices are also in place.
To cater for the diverse workforce, Timpson offers agile solutions such as flexible working or homeworking. These are potentially open to anyone and have been successfully adopted by women returning from maternity leave or colleagues with caring responsibilities for older relatives.
From a diversity perspective, any recruitment strategy set in stone is avoided, as well as formal diversity metrics, in order to be open to any business need and brilliant candidate.
‘What really matters is the attitude and the personality of our colleagues,’ says Louise. Avoiding positive and negative discrimination to create an inclusive environment is considered important. Branches have clear guidelines and training is provided, but they also need to be flexible while filling vacancies in order to ensure the best match.
‘It’s about finding the right colleagues that are going to operate in a branch comfortably. The right person could be anybody from any walk of life and with any sort of background,’ she specifies. Successful candidates are then provided with technical training to ensure they have the right set of skills.
Performance is measured through customer feedback and branch figures, with the colleague support team providing insight on turnover and other factors to each area. High-performing colleagues are rewarded accordingly. Branches are composed of only one or two people, therefore it is easier to monitor their performance and recognise the people responsible for their success.
Timpson’s recruitment strategy is business-proofed; they want to ensure that every single time a customer visits a branch, they are provided with great service by great colleagues.
19 cipd.co.uk/resourcingandtalentplanningsurvey
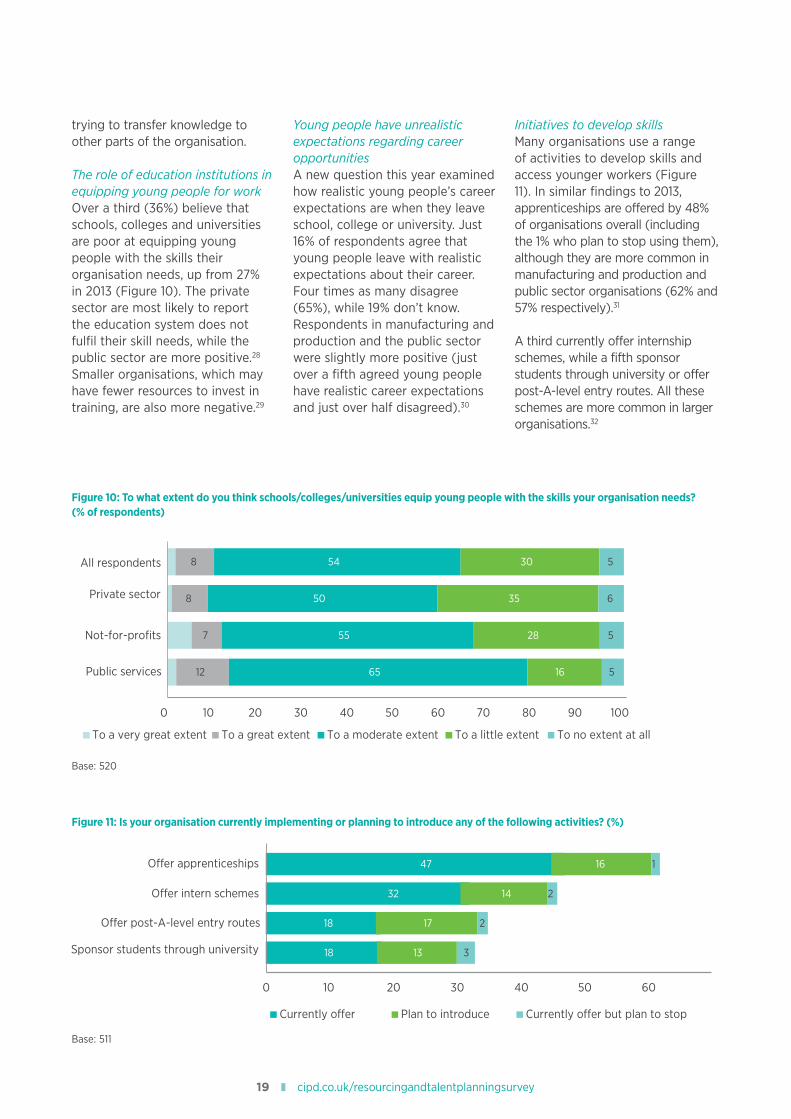
Figure 10: To what extent do you think schools/colleges/universities equip young people with the skills your organisation needs? (% of respondents)
Figure 11: Is your organisation currently implementing or planning to introduce any of the following activities? (%)
12 65 16 5
7 55 28 5
8 50 35 6
8 54 30 5
Public services
Not-for-profits
Private sector
All respondents
0 10 20 30 40 50 60 70 80 90 100
To a very great extent To a great extent To a moderate extent To a little extent To no extent at all
18 13 3
18 17 2
32 14 2
47 16 1
Sponsor students through university
O�er post-A-level entry routes
O�er intern schemes
O�er apprenticeships
Currently o�er Plan to introduce Currently o�er but plan to stop
0 10 20 30 40 50 60
Base: 520
Base: 511
trying to transfer knowledge to other parts of the organisation.
The role of education institutions in equipping young people for workOver a third (36%) believe that schools, colleges and universities are poor at equipping young people with the skills their organisation needs, up from 27% in 2013 (Figure 10). The private sector are most likely to report the education system does not fulfil their skill needs, while the public sector are more positive.28 Smaller organisations, which may have fewer resources to invest in training, are also more negative.29
Young people have unrealistic expectations regarding career opportunitiesA new question this year examined how realistic young people’s career expectations are when they leave school, college or university. Just 16% of respondents agree that young people leave with realistic expectations about their career. Four times as many disagree (65%), while 19% don’t know. Respondents in manufacturing and production and the public sector were slightly more positive (just over a fifth agreed young people have realistic career expectations and just over half disagreed).30
Initiatives to develop skillsMany organisations use a range of activities to develop skills and access younger workers (Figure 11). In similar findings to 2013, apprenticeships are offered by 48% of organisations overall (including the 1% who plan to stop using them), although they are more common in manufacturing and production and public sector organisations (62% and 57% respectively).31
A third currently offer internship schemes, while a fifth sponsor students through university or offer post-A-level entry routes. All these schemes are more common in larger organisations.32

20 Resourcing and Talent Planning Survey 2015
Increases in graduate recruitment programmesOverall, nearly two-fifths of organisations operate a structured graduate recruitment programme. This shows an increase on most previous years, mainly due to increases in the public and not-for-profit sectors, although structured graduate programmes remain considerably less common in the latter (Table 5).33 Larger
organisations are most likely to have graduate programmes.34
Figure 12 suggests that intake onto graduate programmes has also increased. Two-fifths (42%) of those with graduate recruitment programmes have increased their intake over the last 12 months, while 13% have reduced their intake. Private sector organisations were most likely to have increased
their intake (49% compared with 31% of non-profits and 26% of the public sector). There were no significant differences across sizes of organisation.
Just 3% of those without graduate recruitment programmes report they have recently closed their schemes.
Table 5: Organisations operating a structured graduate recruitment programme, by sector (% of respondents)
2015 2013 2012 2011 2010 2009 2008
All 38 24 31 27 34 22 23
Manufacturing and production 34 28 44 35 35 23 24
Private sector services 41 27 33 29 37 24 27
Public services 46 29 32 26 33 23 24
Not-for-profit 19 7 6 6 18 5 7
Base: 497 (2015); 521 (2012); 614 (2011); 472 (2010); 752 (2009)
Figure 12: Changes to intake of graduate recruitment programmes, by year (% of those with structured graduate recruitment programmes)
15
31 33 3542
-43
-24-20 -23
-13
-50
-40
-30
-20
-10
0
10
20
30
40
50
2010 survey 2011 survey 2012 survey 2013 survey 2015 survey
Increased intake Decreased intake
Base: 497 (2015); 521 (2012); 614 (2011); 472 (2010)
21 cipd.co.uk/resourcingandtalentplanningsurvey
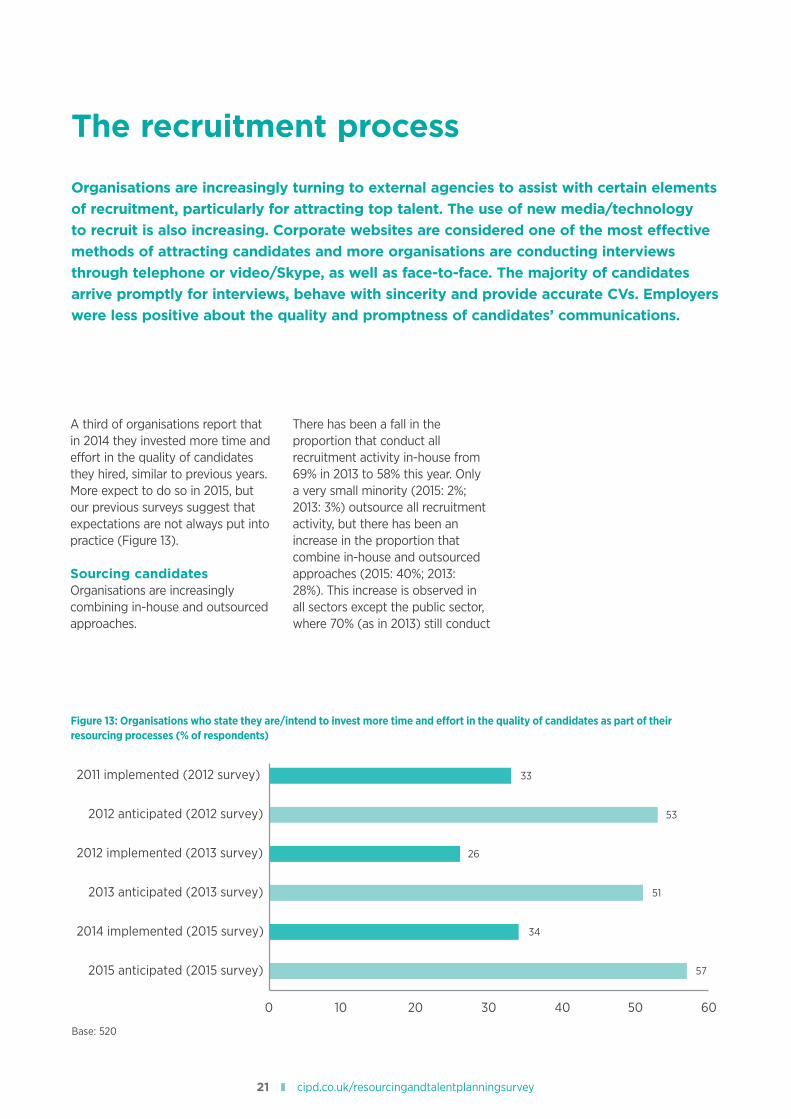
A third of organisations report that in 2014 they invested more time and effort in the quality of candidates they hired, similar to previous years. More expect to do so in 2015, but our previous surveys suggest that expectations are not always put into practice (Figure 13).
Sourcing candidatesOrganisations are increasingly combining in-house and outsourced approaches.
There has been a fall in the proportion that conduct all recruitment activity in-house from 69% in 2013 to 58% this year. Only a very small minority (2015: 2%; 2013: 3%) outsource all recruitment activity, but there has been an increase in the proportion that combine in-house and outsourced approaches (2015: 40%; 2013: 28%). This increase is observed in all sectors except the public sector, where 70% (as in 2013) still conduct
The recruitment process
Organisations are increasingly turning to external agencies to assist with certain elements of recruitment, particularly for attracting top talent. The use of new media/technology to recruit is also increasing. Corporate websites are considered one of the most effective methods of attracting candidates and more organisations are conducting interviews through telephone or video/Skype, as well as face-to-face. The majority of candidates arrive promptly for interviews, behave with sincerity and provide accurate CVs. Employers were less positive about the quality and promptness of candidates’ communications.
Figure 13: Organisations who state they are/intend to invest more time and effort in the quality of candidates as part of their resourcing processes (% of respondents)
57
34
51
33
26
53
0 10 20 30 40 50 60
2015 anticipated (2015 survey)
2014 implemented (2015 survey)
2013 anticipated (2013 survey)
2012 implemented (2013 survey)
2012 anticipated (2012 survey)
2011 implemented (2012 survey)
Base: 520
22 Resourcing and Talent Planning Survey 2015
all recruitment activity in-house. Manufacturing and production organisations are least likely to conduct all recruitment activity in-house (38% compared with 59% of private sector services, 62% of not-for-profits and 70% of the public sector).35
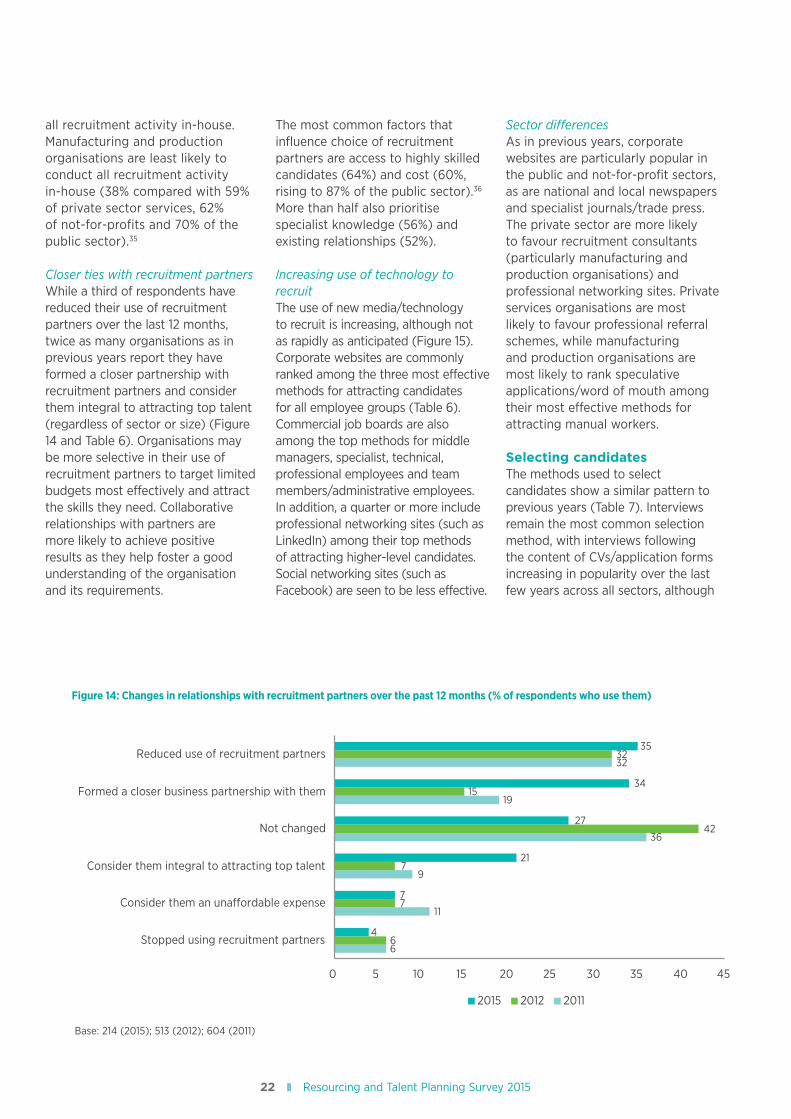
Closer ties with recruitment partnersWhile a third of respondents have reduced their use of recruitment partners over the last 12 months, twice as many organisations as in previous years report they have formed a closer partnership with recruitment partners and consider them integral to attracting top talent (regardless of sector or size) (Figure 14 and Table 6). Organisations may be more selective in their use of recruitment partners to target limited budgets most effectively and attract the skills they need. Collaborative relationships with partners are more likely to achieve positive results as they help foster a good understanding of the organisation and its requirements.
The most common factors that influence choice of recruitment partners are access to highly skilled candidates (64%) and cost (60%, rising to 87% of the public sector).36
More than half also prioritise specialist knowledge (56%) and existing relationships (52%).
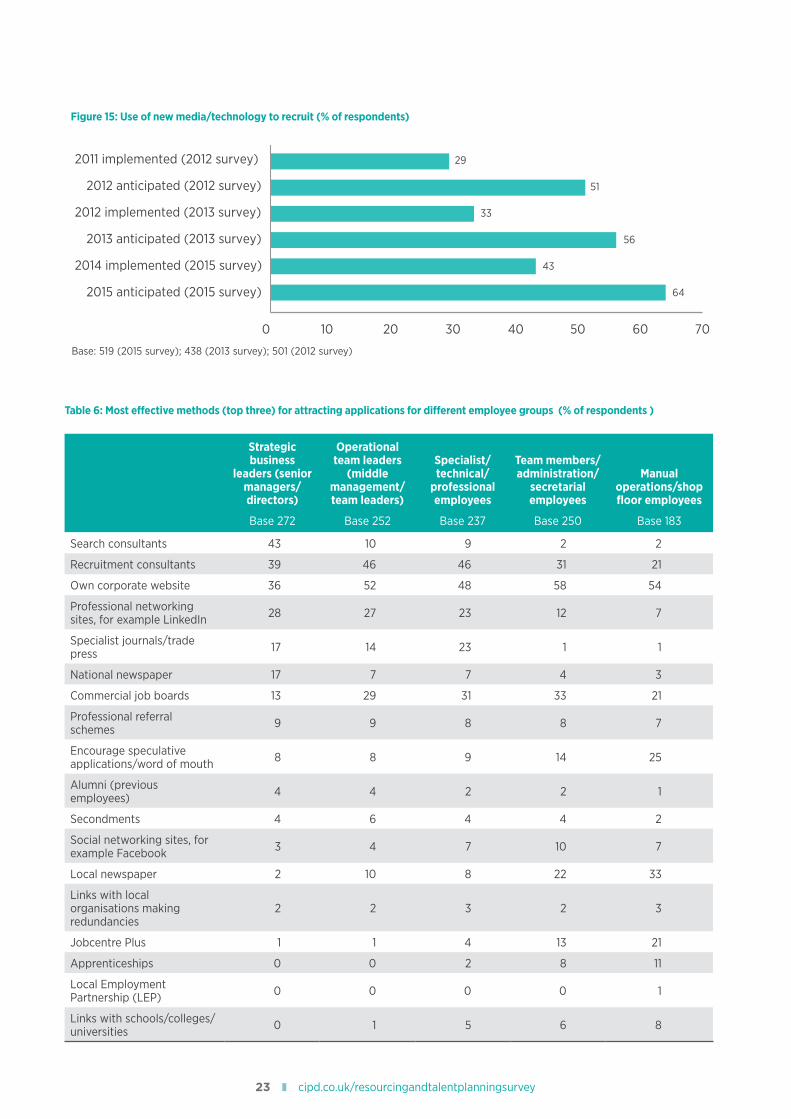
Increasing use of technology to recruitThe use of new media/technology to recruit is increasing, although not as rapidly as anticipated (Figure 15). Corporate websites are commonly ranked among the three most effective methods for attracting candidates for all employee groups (Table 6). Commercial job boards are also among the top methods for middle managers, specialist, technical, professional employees and team members/administrative employees. In addition, a quarter or more include professional networking sites (such as LinkedIn) among their top methods of attracting higher-level candidates. Social networking sites (such as Facebook) are seen to be less effective.
Sector differencesAs in previous years, corporate websites are particularly popular in the public and not-for-profit sectors, as are national and local newspapers and specialist journals/trade press. The private sector are more likely to favour recruitment consultants (particularly manufacturing and production organisations) and professional networking sites. Private services organisations are most likely to favour professional referral schemes, while manufacturing and production organisations are most likely to rank speculative applications/word of mouth among their most effective methods for attracting manual workers.
Selecting candidatesThe methods used to select candidates show a similar pattern to previous years (Table 7). Interviews remain the most common selection method, with interviews following the content of CVs/application forms increasing in popularity over the last few years across all sectors, although
Figure 14: Changes in relationships with recruitment partners over the past 12 months (% of respondents who use them)
Stopped using recruitment partners
Consider them an una ordable expense
Consider them integral to attracting top talent
Not changed
Formed a closer business partnership with them
Reduced use of recruitment partners
6
11
9
36
19
32
6
7
7
42
15
32
4
7
21
27
34
35
0 5 10 15 20 25 30 35 40 45
2015 2012 2011
Base: 214 (2015); 513 (2012); 604 (2011)
23 cipd.co.uk/resourcingandtalentplanningsurvey
Figure 15: Use of new media/technology to recruit (% of respondents)
2015 anticipated (2015 survey)
2014 implemented (2015 survey)
2013 anticipated (2013 survey)
2012 implemented (2013 survey)
2012 anticipated (2012 survey)
2011 implemented (2012 survey)
64
43
56
33
51
29
0 10 20 30 40 50 60 70
Base: 519 (2015 survey); 438 (2013 survey); 501 (2012 survey)
Table 6: Most effective methods (top three) for attracting applications for different employee groups (% of respondents )
Strategic business
leaders (senior managers/directors)
Base 272
Operational team leaders
(middle management/team leaders)
Base 252
Specialist/ technical/
professional employees
Base 237
Team members/ administration/
secretarial employees
Base 250
Manual operations/shop floor employees
Base 183
Search consultants 43 10 9 2 2
Recruitment consultants 39 46 46 31 21
Own corporate website 36 52 48 58 54
Professional networking sites, for example LinkedIn 28 27 23 12 7
Specialist journals/trade press 17 14 23 1 1
National newspaper 17 7 7 4 3
Commercial job boards 13 29 31 33 21
Professional referral schemes 9 9 8 8 7
Encourage speculative applications/word of mouth 8 8 9 14 25
Alumni (previous employees) 4 4 2 2 1
Secondments 4 6 4 4 2
Social networking sites, for example Facebook 3 4 7 10 7
Local newspaper 2 10 8 22 33
Links with local organisations making redundancies
2 2 3 2 3
Jobcentre Plus 1 1 4 13 21
Apprenticeships 0 0 2 8 11
Local Employment Partnership (LEP) 0 0 0 0 1
Links with schools/colleges/universities 0 1 5 6 8

24 Resourcing and Talent Planning Survey 2015
they remain most widely used in the private sector (89% compared with 70% of the public sector and 72% of not-for-profits).37
Just over half of organisations use tests for specific skills, while just under half use general ability and literacy and/or numeracy tests, although the use of all these tests is more prevalent in larger organisations.38 Larger organisations are also more likely to use personality/aptitude questionnaires, online tests, assessment centres and group exercises.39 Only a small minority are making use of tools to enable self-selection, to go through a process to select themselves out of the recruitment
process. Also, only a small minority of organisations are using analytical algorithms to match people to roles or gamification in selection, which are considered to be new, innovative ways of selecting candidates.
Pre-interview references are used by just over a fifth of organisations overall, rising to 37% of the public sector (19% of the private sector, 15% of not-for-profits).40
Increasing use of distance interviewsVirtually all organisations that use interviews use face-to-face techniques, but an increasing proportion also make use of telephone interviews (2015: 62%;
2013: 56%; 2011: 43%; 2010: 47%; 2009: 38%) and video or Skype (2015: 46%; 2013: 30%).41
Organisations that recruit from overseas are more likely (and increasingly so) to use video or Skype interviews than those who recruit nationally (2015: 71% vs. 36%;42 2013: 42% vs. 30%). Telephone interviews are also more common among those who recruit from overseas (71% vs. 60%).43 In addition, private sector organisations are particularly likely to use telephone interviews (private sector services: 78%; manufacturing and production: 69%; not-for-profit: 44%; public services: 29%).44
Table 7: Methods used to select applicants (% of respondents)
2015 survey
2013 survey
2011 survey*
2010 survey
2009 survey
Interviews following contents of CV/application form 83 71 63 64 68
Competency-based interviews 77 82 70 78 69
Tests for specific skills 52 55 49 48 50
General ability tests 47 45 23 27 44
Literacy and/or numeracy tests 45 45 38 43 39
Assessment centres 38 43 35 42 35
Personality/aptitude questionnaires 36 42 35 44 35
Group exercises (for example role-playing) 27 28 21 30 26
Online tests (selection)** 24 22 n/a n/a n/a
Pre-interview references (academic or employment) 22 22 9 16 19
Tools to enable self-selection*** 3 n/a n/a n/a n/a
Analytical algorithms to match people to roles*** 1 n/a n/a n/a n/a
Gamification*** 1 n/a n/a n/a n/a
Other 5 6 3 4 6
Base: 505 (2015); 460 (2013); 605 (2011); 473 (2010); 754 (2009) *This question was not included in the 2012 survey **This response option was added in 2013 ***This response option was added in 2015
25 cipd.co.uk/resourcingandtalentplanningsurvey
Case study: Xtravirt
Xtravirt is a leading independent provider of enterprise virtualisation solutions, delivering data centre, workspace and cloud transformational solutions to customers throughout the UK and internationally. Their consulting organisation is partnered with organisations such as VMWare, Citrix and Microsoft and is recognised globally for contributions to the industry and community.
This highly specialised small business (50–100 employees) has grown exponentially since it was founded eight years ago and relies on the deep expertise of its consultants. ‘We have an extremely high calibre of candidates, the best ones on the market,’ explains Mike Jones, Talent Acquisition Manager at Xtravirt.
Talent acquisition and planning is at the core of their business strategy and three years ago Xtravirt requested and undertook the shift from external agencies to in-house recruitment.
In a limited talent pool, the biggest challenge is to find highly skilled people with a wealth of expertise who also have the right attitude. Talent shortages need to be overcome with a streamlined process managed by a specialist who knows the nature of what they do, the type of people they need, the engagement requested and understands the technology and company’s background.
Fifty per cent of their workforce has been hired through online channels, ranging from job boards to social media platforms such as LinkedIn, Google+ and Twitter, which have been used to attract candidates and direct them to job ads on the company website. Social media helps broaden the message thanks also to shares and re-tweets by employees and word of mouth. Exploiting the wider network of current employees, who are well known in the industry, and among their colleagues, is essential according to Xtravirt.
Their employee referral scheme and internal contact database helps them secure the remaining 50% of the workforce.
Xtravirt has a strong reputation in the virtualisation and cloud industry and as an employer which is leveraged when it comes to talent acquisition. Their candidates, who are in high demand in the market, know that this is one of the best companies to work for, according to Mike Jones. They get exposure to a wide range of work and projects and can use their skills to the fullest. Training plans and opportunities for progression are provided, to ensure they continually update their knowledge and skills.
Their presence on social media is further enhanced by a ‘social media welcome’, where new hires are introduced to colleagues and clients through posts on social media. ‘This is our way of welcoming new employees to Xtravirt and informing the wider community that they have joined the company. Our people are spread across the territory, as consultants are often based on client sites or work from home, therefore using social media helps bring the Xtravirt community together,’ explains Jainie Morar, Marketing Assistant, who is responsible for social media monitoring.
‘Regarding the use of social media, the best advice I can give is to use it as a tool. Don’t rely on it 100%, otherwise you won’t find the best candidates. Social media is a great addition to the recruitment cycle, but you still need some of the traditional methods such as referrals,’ suggests Mike Jones.
26 Resourcing and Talent Planning Survey 2015
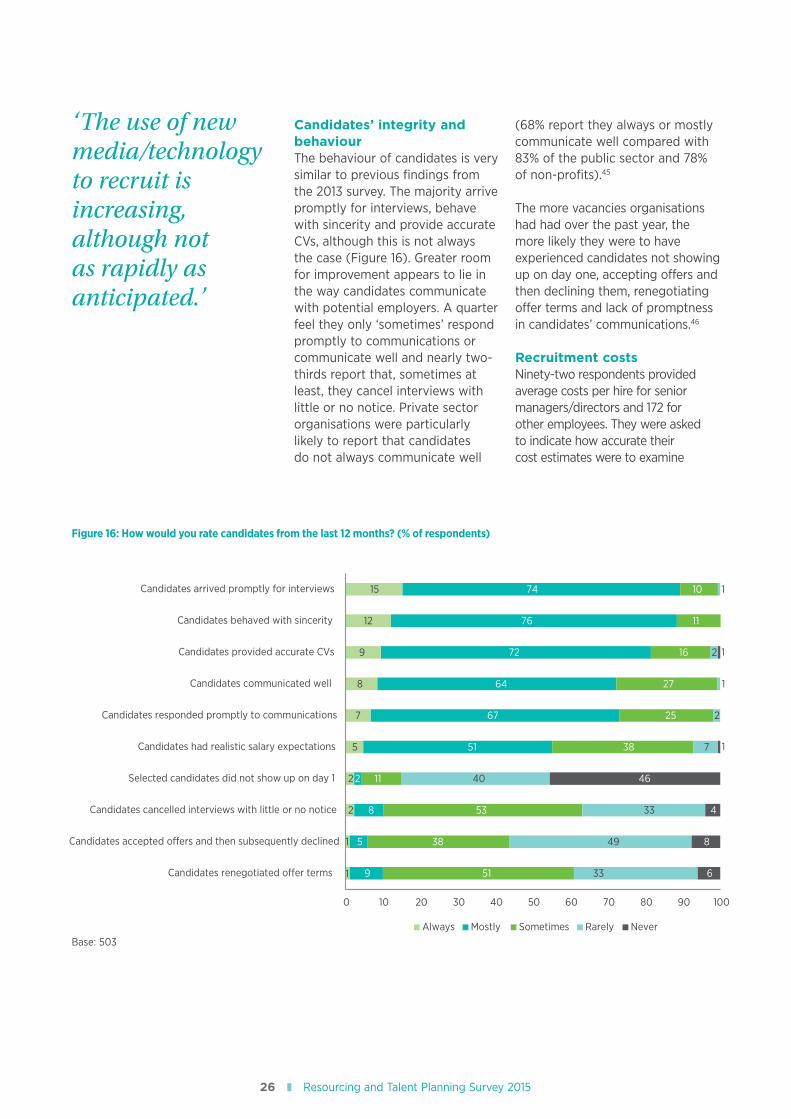
Candidates’ integrity and behaviourThe behaviour of candidates is very similar to previous findings from the 2013 survey. The majority arrive promptly for interviews, behave with sincerity and provide accurate CVs, although this is not always the case (Figure 16). Greater room for improvement appears to lie in the way candidates communicate with potential employers. A quarter feel they only ‘sometimes’ respond promptly to communications or communicate well and nearly two-thirds report that, sometimes at least, they cancel interviews with little or no notice. Private sector organisations were particularly likely to report that candidates do not always communicate well
(68% report they always or mostly communicate well compared with 83% of the public sector and 78% of non-profits).45
The more vacancies organisations had had over the past year, the more likely they were to have experienced candidates not showing up on day one, accepting offers and then declining them, renegotiating offer terms and lack of promptness in candidates’ communications.46
Recruitment costsNinety-two respondents provided average costs per hire for senior managers/directors and 172 for other employees. They were asked to indicate how accurate their cost estimates were to examine
Figure 16: How would you rate candidates from the last 12 months? (% of respondents)
Candidates renegotiated o�er terms
Candidates accepted o�ers and then subsequently declined
Candidates cancelled interviews with little or no notice
Selected candidates did not show up on day 1
Candidates had realistic salary expectations
Candidates responded promptly to communications
Candidates communicated well
Candidates provided accurate CVs
Candidates behaved with sincerity
Candidates arrived promptly for interviews
0 10 20 30 40 50 60 70 80 90 100
5
7
8
9
12
15
9
5
8
2
51
67
64
72
76
74
51
38
53
11
38
25
27
16
11
10
33
49
33
40
7
2
1
1
2
1
1
6
8
4
46
Always Mostly Sometimes Rarely Never
1
1
2
2
Base: 503
‘The use of new media/technologyto recruit is increasing, although notas rapidly as anticipated.’
27 cipd.co.uk/resourcingandtalentplanningsurvey
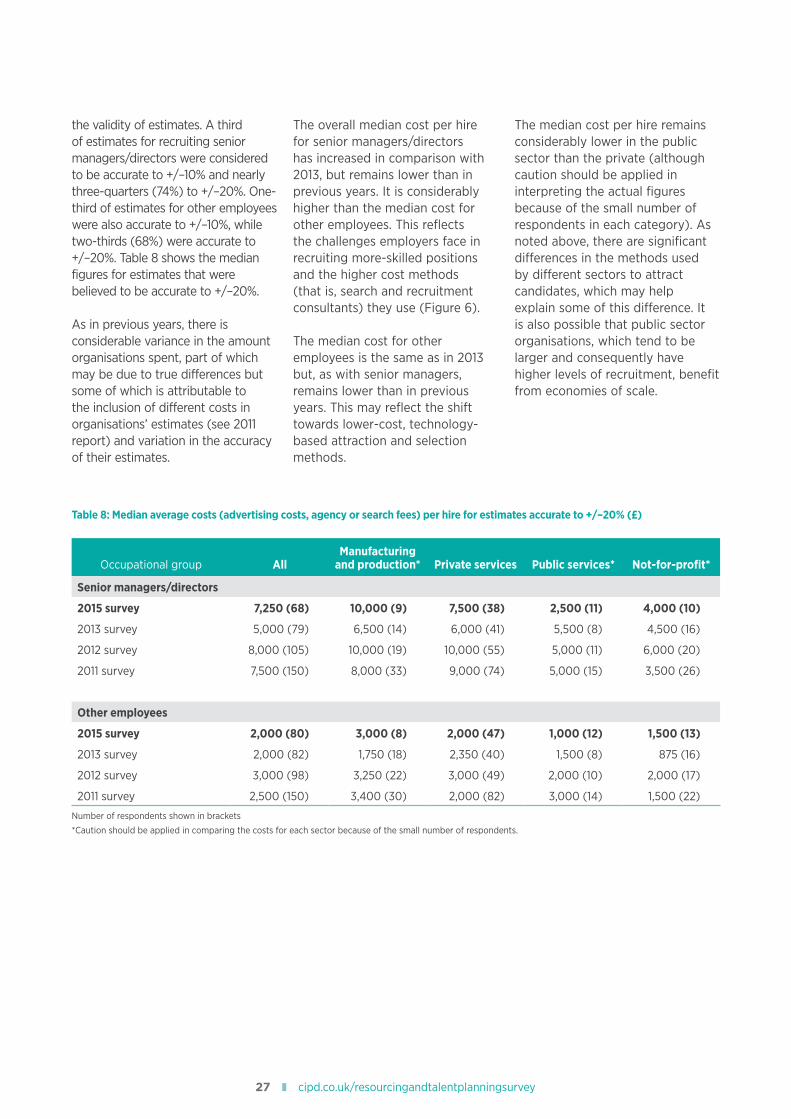
the validity of estimates. A third of estimates for recruiting senior managers/directors were considered to be accurate to +/–10% and nearly three-quarters (74%) to +/–20%. One-third of estimates for other employees were also accurate to +/–10%, while two-thirds (68%) were accurate to +/–20%. Table 8 shows the median figures for estimates that were believed to be accurate to +/–20%.
As in previous years, there is considerable variance in the amount organisations spent, part of which may be due to true differences but some of which is attributable to the inclusion of different costs in organisations’ estimates (see 2011 report) and variation in the accuracy of their estimates.
The overall median cost per hire for senior managers/directors has increased in comparison with 2013, but remains lower than in previous years. It is considerably higher than the median cost for other employees. This reflects the challenges employers face in recruiting more-skilled positions and the higher cost methods (that is, search and recruitment consultants) they use (Figure 6).
The median cost for other employees is the same as in 2013 but, as with senior managers, remains lower than in previous years. This may reflect the shift towards lower-cost, technology-based attraction and selection methods.
The median cost per hire remains considerably lower in the public sector than the private (although caution should be applied in interpreting the actual figures because of the small number of respondents in each category). As noted above, there are significant differences in the methods used by different sectors to attract candidates, which may help explain some of this difference. It is also possible that public sector organisations, which tend to be larger and consequently have higher levels of recruitment, benefit from economies of scale.
Table 8: Median average costs (advertising costs, agency or search fees) per hire for estimates accurate to +/–20% (£)
Occupational group AllManufacturing
and production* Private services Public services* Not-for-profit*
Senior managers/directors
2015 survey 7,250 (68) 10,000 (9) 7,500 (38) 2,500 (11) 4,000 (10)
2013 survey 5,000 (79) 6,500 (14) 6,000 (41) 5,500 (8) 4,500 (16)
2012 survey 8,000 (105) 10,000 (19) 10,000 (55) 5,000 (11) 6,000 (20)
2011 survey 7,500 (150) 8,000 (33) 9,000 (74) 5,000 (15) 3,500 (26)
Other employees
2015 survey 2,000 (80) 3,000 (8) 2,000 (47) 1,000 (12) 1,500 (13)
2013 survey 2,000 (82) 1,750 (18) 2,350 (40) 1,500 (8) 875 (16)
2012 survey 3,000 (98) 3,250 (22) 3,000 (49) 2,000 (10) 2,000 (17)
2011 survey 2,500 (150) 3,400 (30) 2,000 (82) 3,000 (14) 1,500 (22)
Number of respondents shown in brackets
*Caution should be applied in comparing the costs for each sector because of the small number of respondents.
28 Resourcing and Talent Planning Survey 2015
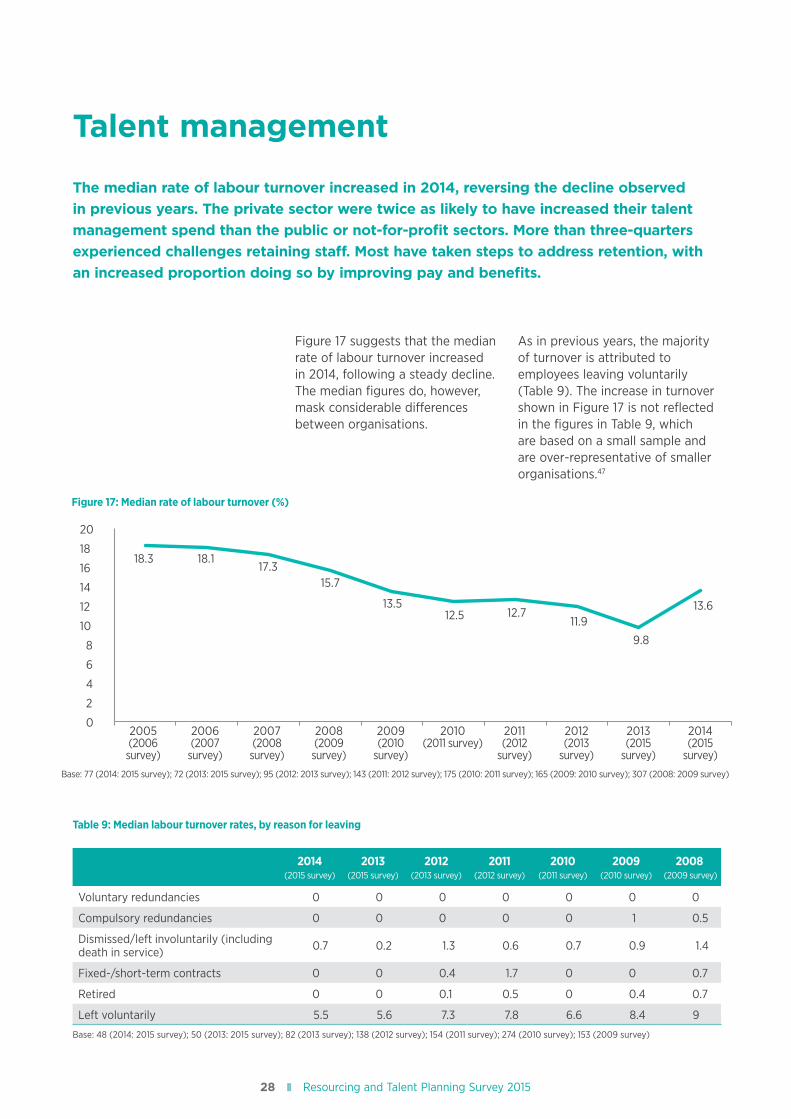
Figure 17 suggests that the median rate of labour turnover increased in 2014, following a steady decline. The median figures do, however, mask considerable differences between organisations.
As in previous years, the majority of turnover is attributed to employees leaving voluntarily (Table 9). The increase in turnover shown in Figure 17 is not reflected in the figures in Table 9, which are based on a small sample and are over-representative of smaller organisations.47
Talent management
The median rate of labour turnover increased in 2014, reversing the decline observed in previous years. The private sector were twice as likely to have increased their talent management spend than the public or not-for-profit sectors. More than three-quarters experienced challenges retaining staff. Most have taken steps to address retention, with an increased proportion doing so by improving pay and benefits.
Figure 17: Median rate of labour turnover (%)
0
2
4
6
8
10
12
14
16
18
20
18.3 18.117.3
15.7
13.512.5 12.7
11.9
9.8
13.6
2005(2006 survey)
Base: 77 (2014: 2015 survey); 72 (2013: 2015 survey); 95 (2012: 2013 survey); 143 (2011: 2012 survey); 175 (2010: 2011 survey); 165 (2009: 2010 survey); 307 (2008: 2009 survey)
2006(2007
survey)
2007(2008 survey)
2008(2009 survey)
2009(2010
survey)
2010(2011 survey)
2011(2012
survey)
2012(2013
survey)
2013(2015
survey)
2014(2015
survey)
Table 9: Median labour turnover rates, by reason for leaving
2014 (2015 survey)
2013 (2015 survey)
2012 (2013 survey)
2011 (2012 survey)
2010 (2011 survey)
2009 (2010 survey)
2008 (2009 survey)
Voluntary redundancies 0 0 0 0 0 0 0
Compulsory redundancies 0 0 0 0 0 1 0.5
Dismissed/left involuntarily (including death in service) 0.7 0.2 1.3 0.6 0.7 0.9 1.4
Fixed-/short-term contracts 0 0 0.4 1.7 0 0 0.7
Retired 0 0 0.1 0.5 0 0.4 0.7
Left voluntarily 5.5 5.6 7.3 7.8 6.6 8.4 9
Base: 48 (2014: 2015 survey); 50 (2013: 2015 survey); 82 (2013 survey); 138 (2012 survey); 154 (2011 survey); 274 (2010 survey); 153 (2009 survey)
29 cipd.co.uk/resourcingandtalentplanningsurvey
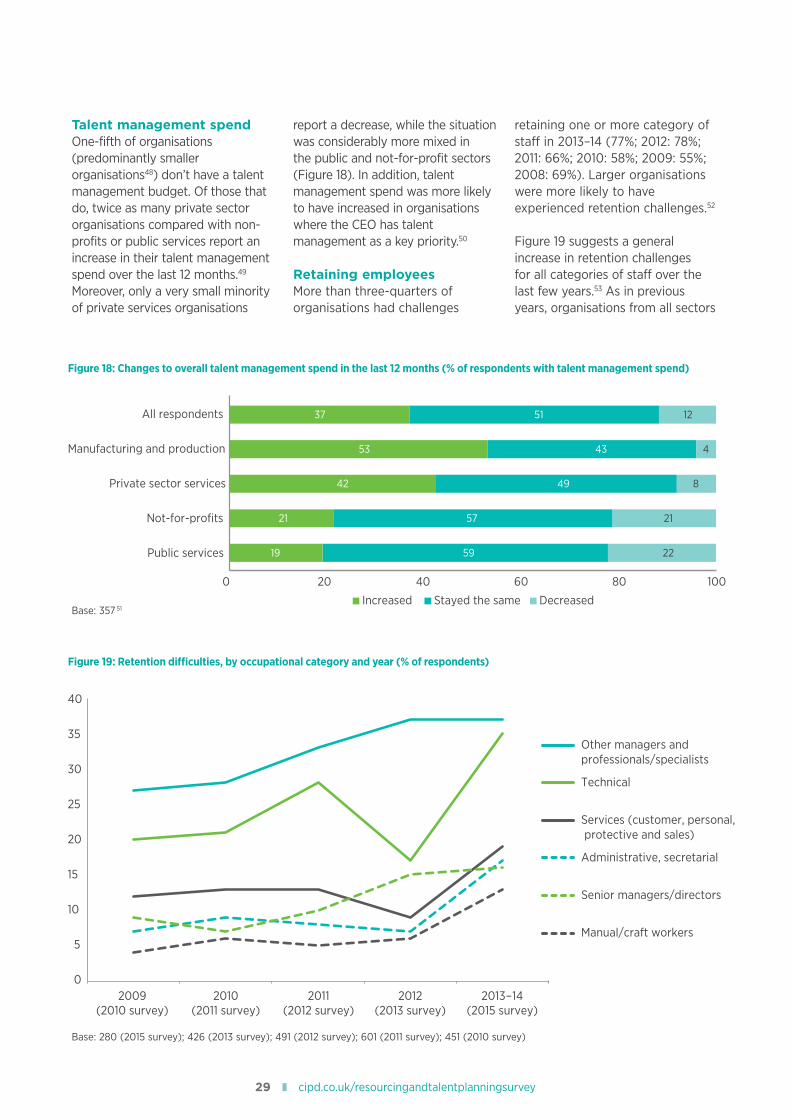
Talent management spendOne-fifth of organisations (predominantly smaller organisations48) don’t have a talent management budget. Of those that do, twice as many private sector organisations compared with non-profits or public services report an increase in their talent management spend over the last 12 months.49 Moreover, only a very small minority of private services organisations
report a decrease, while the situation was considerably more mixed in the public and not-for-profit sectors (Figure 18). In addition, talent management spend was more likely to have increased in organisations where the CEO has talent management as a key priority.50
Retaining employeesMore than three-quarters of organisations had challenges
retaining one or more category of staff in 2013–14 (77%; 2012: 78%; 2011: 66%; 2010: 58%; 2009: 55%; 2008: 69%). Larger organisations were more likely to have experienced retention challenges.52
Figure 19 suggests a general increase in retention challenges for all categories of staff over the last few years.53 As in previous years, organisations from all sectors
Figure 18: Changes to overall talent management spend in the last 12 months (% of respondents with talent management spend)
Figure 19: Retention difficulties, by occupational category and year (% of respondents)
19 59 22
21 57 21
42 49 8
53 43 4
37 51 12
Public services
Not-for-profits
Private sector services
Manufacturing and production
All respondents
Increased
0 20 40 60 80 100
Stayed the same Decreased
2009 (2010 survey)
2010(2011 survey)
2011(2012 survey)
2012(2013 survey)
2013-14(2015 survey)
Other managers andprofessionals/specialists
Services (customer, personal, protective and sales)
Administrative, secretarial
Senior managers/directors
Manual/craft workers
10
15
20
25
30
35
40
0
5
Technical
Base: 357 51
Base: 280 (2015 survey); 426 (2013 survey); 491 (2012 survey); 601 (2011 survey); 451 (2010 survey)
30 Resourcing and Talent Planning Survey 2015
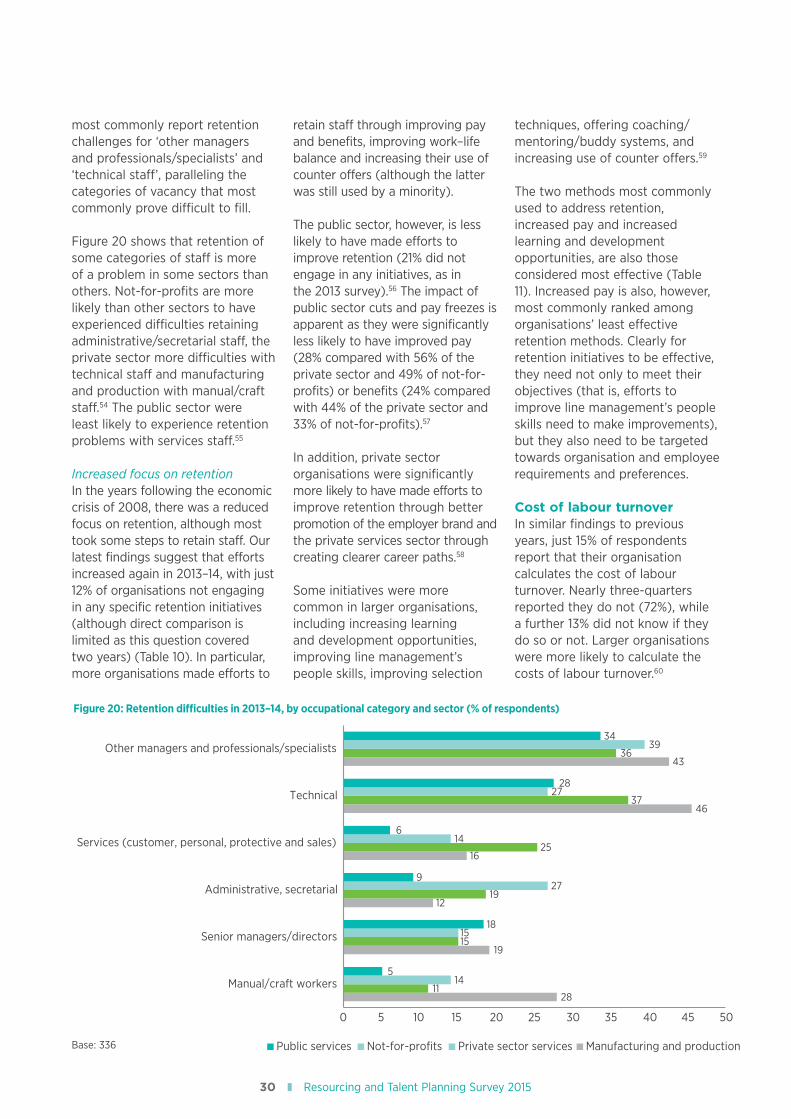
most commonly report retention challenges for ‘other managers and professionals/specialists’ and ‘technical staff’, paralleling the categories of vacancy that most commonly prove difficult to fill.
Figure 20 shows that retention of some categories of staff is more of a problem in some sectors than others. Not-for-profits are more likely than other sectors to have experienced difficulties retaining administrative/secretarial staff, the private sector more difficulties with technical staff and manufacturing and production with manual/craft staff.54 The public sector were least likely to experience retention problems with services staff.55
Increased focus on retention In the years following the economic crisis of 2008, there was a reduced focus on retention, although most took some steps to retain staff. Our latest findings suggest that efforts increased again in 2013–14, with just 12% of organisations not engaging in any specific retention initiatives (although direct comparison is limited as this question covered two years) (Table 10). In particular, more organisations made efforts to
retain staff through improving pay and benefits, improving work–life balance and increasing their use of counter offers (although the latter was still used by a minority).
The public sector, however, is less likely to have made efforts to improve retention (21% did not engage in any initiatives, as in the 2013 survey).56 The impact of public sector cuts and pay freezes is apparent as they were significantly less likely to have improved pay (28% compared with 56% of the private sector and 49% of not-for-profits) or benefits (24% compared with 44% of the private sector and 33% of not-for-profits).57
In addition, private sector organisations were significantly more likely to have made efforts to improve retention through better promotion of the employer brand and the private services sector through creating clearer career paths.58
Some initiatives were more common in larger organisations, including increasing learning and development opportunities, improving line management’s people skills, improving selection
techniques, offering coaching/mentoring/buddy systems, and increasing use of counter offers.59
The two methods most commonly used to address retention, increased pay and increased learning and development opportunities, are also those considered most effective (Table 11). Increased pay is also, however, most commonly ranked among organisations’ least effective retention methods. Clearly for retention initiatives to be effective, they need not only to meet their objectives (that is, efforts to improve line management’s people skills need to make improvements), but they also need to be targeted towards organisation and employee requirements and preferences.
Cost of labour turnoverIn similar findings to previous years, just 15% of respondents report that their organisation calculates the cost of labour turnover. Nearly three-quarters reported they do not (72%), while a further 13% did not know if they do so or not. Larger organisations were more likely to calculate the costs of labour turnover.60
Figure 20: Retention difficulties in 2013–14, by occupational category and sector (% of respondents)
28
19
12
16
46
43
11
1515
19
25
37
36
14
27
14
27
39
5
18
9
6
28
34
0 5 10 15 20 25 30 35 40 45 50
Manual/craft workers
Senior managers/directors
Administrative, secretarial
Services (customer, personal, protective and sales)
Technical
Other managers and professionals/specialists
Public services Not-for-profits Private sector services Manufacturing and productionBase: 336
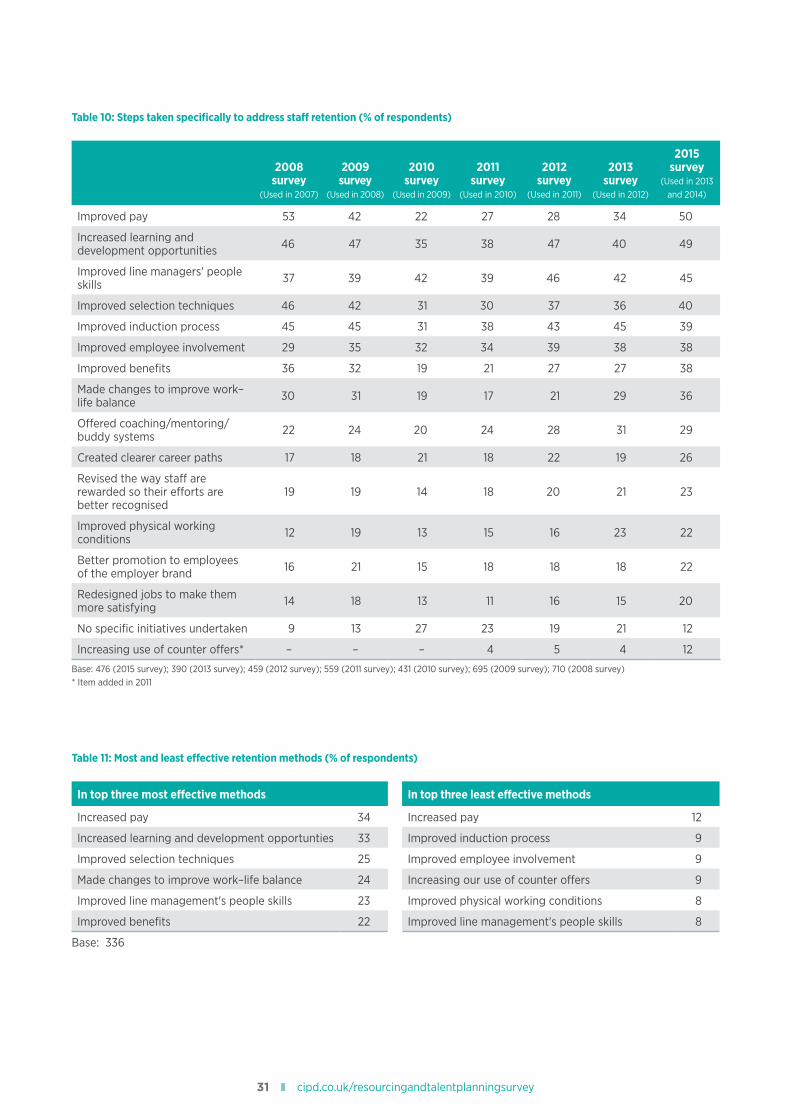
31 cipd.co.uk/resourcingandtalentplanningsurvey
Table 10: Steps taken specifically to address staff retention (% of respondents)
2008 survey
(Used in 2007)
2009 survey
(Used in 2008)
2010 survey
(Used in 2009)
2011 survey
(Used in 2010)
2012 survey
(Used in 2011)
2013 survey
(Used in 2012)
2015 survey
(Used in 2013 and 2014)
Improved pay 53 42 22 27 28 34 50
Increased learning and development opportunities 46 47 35 38 47 40 49
Improved line managers' people skills 37 39 42 39 46 42 45
Improved selection techniques 46 42 31 30 37 36 40
Improved induction process 45 45 31 38 43 45 39
Improved employee involvement 29 35 32 34 39 38 38
Improved benefits 36 32 19 21 27 27 38
Made changes to improve work–life balance 30 31 19 17 21 29 36
Offered coaching/mentoring/buddy systems 22 24 20 24 28 31 29
Created clearer career paths 17 18 21 18 22 19 26
Revised the way staff are rewarded so their efforts are better recognised
19 19 14 18 20 21 23
Improved physical working conditions 12 19 13 15 16 23 22
Better promotion to employees of the employer brand 16 21 15 18 18 18 22
Redesigned jobs to make them more satisfying 14 18 13 11 16 15 20
No specific initiatives undertaken 9 13 27 23 19 21 12
Increasing use of counter offers* – – – 4 5 4 12
Base: 476 (2015 survey); 390 (2013 survey); 459 (2012 survey); 559 (2011 survey); 431 (2010 survey); 695 (2009 survey); 710 (2008 survey) * Item added in 2011
Table 11: Most and least effective retention methods (% of respondents)
In top three most effective methods In top three least effective methods
Increased pay 34 Increased pay 12
Increased learning and development opportunties 33 Improved induction process 9
Improved selection techniques 25 Improved employee involvement 9
Made changes to improve work–life balance 24 Increasing our use of counter offers 9
Improved line management's people skills 23 Improved physical working conditions 8
Improved benefits 22 Improved line management's people skills 8
Base: 336
32 Resourcing and Talent Planning Survey 2015
Changes in the nature of jobs are further exacerbating demand for key skills and the vast majority of organisations are experiencing increased competition for talent. More skilled roles (managers, professionals/specialists, and technical staff) remain most difficult to fill and retain, although an increasing proportion report difficulties filling all staff categories. At the same time, half of organisations are seeing an increase in the number of unsuitable candidates. These trends highlight the increasing imperative for organisations to focus more strongly on their recruitment and talent management strategies. Many are responding to their challenges through a range of strategies:
Widening the search for skills Half of organisations are recruiting from a much wider geography and an increasing proportion are actively trying to attract talent of all ages and backgrounds. There is, however, variation in how proactive organisations are in ensuring attraction and selection methods are unbiased (for example, two-fifths don’t train interviewers in diversity issues and three-fifths don’t check that tests used are unbiased). The shortage of skills has increased the impetus for organisations to ensure that hidden biases do not prevent talent from joining the organisation. Processes
and systems should be regularly reviewed to ensure that any bias is removed.
Increased use of technology to recruitWe are seeing an increase in the use of new media/technology to attract candidates. Corporate websites are among organisations’ most effective methods for attracting candidates and many also find commercial job boards and professional networking sites (such as LinkedIn) very effective. Social networking sites (such as Facebook) are considered less effective.
Organisations are also increasingly conducting interviews by phone or video/Skype, although most also still use face-to-face interviews, perhaps at latter stages or for particular categories of vacancy. There has been little change, however, in the proportion using technology in other phases of selection, such as online selection tests or tools to enable self-selection. These methods can offer cost-effective ways to speed up and automate processes.
Widespread focus on improving employer brand Competition for talent is increasing the need for organisations to position themselves as an employer of choice and our findings point to a widespread focus on improving the employer brand. As part of
Conclusions
The past year has seen the record broken for the most people in work at any point in the UK’s history. This is good news for the economy, but the strong labour market is adding to the recruitment challenges organisations face, as many, at least in the private sector, attempt to increase their headcount. The upturn in the economy has also resulted in increased turnover. Presumably individuals who were reluctant to move in more unsettled times are now considering other opportunities.

33 cipd.co.uk/resourcingandtalentplanningsurvey
these efforts, nearly half have made efforts to improve their candidate experience. The rise of social media has heightened the importance of leaving a positive impression of the company, as one negative experience can instantly be relayed to a wide number of people.
Developing skills in younger workersFew employers agree that the current education system is meeting their skill requirements to any great extent. Many are responding with approaches to develop skills and access younger workers, including apprenticeship and intern schemes, post-A-level entry routes and sponsoring students through university. These initiatives are, however, less common in smaller businesses, although these organisations are most negative regarding how well equipped young people are when they leave education.
These findings highlight the need for closer links between employers and schools. Larger organisations are often seen to be in a better position to do this, but initiatives such as the CIPD’s Learning to Work and Inspiring the Future programmes help provide opportunities to smaller organisations (cipd.co.uk/learningtowork).
Developing talent in-houseAs the mismatch between the skills available in the labour market and those required by organisations grows, businesses need to get better at building and developing their existing talent to meet their current and future requirements. As well as reducing reliance on the external labour market and the associated recruitment costs, developing existing talent has the additional benefit of allowing organisations to tailor the skills
acquired to meet their specific needs while promoting engagement and retention. Our findings suggest that organisations recognise the value of developing talent but many fail to act. Year-on-year higher proportions anticipate they will develop more talent in-house, but our findings show little change in the proportion that actually do so.
Increased focus on retentionOrganisations are stepping up their focus on retention (at least in the private and non-profit sectors), particularly through improving pay and benefits. The stronger labour market means they will have to work harder to keep their skilled employees. The public sector, which faces ongoing pay freezes and reduced budgets, may need to step up their efforts to avoid a talent drain as those who were prepared to sit out more turbulent times start to look for jobs elsewhere. Smaller resourcing budgets may prohibit financial incentives, but other approaches such as increasing learning and development opportunities and improving line managers’ people skills remain popular. Moreover, views regarding the effectiveness of pay in retaining staff are mixed. Recent CIPD research, Show Me the Money! The behavioural science of reward, emphasises the value of non-financial and intangible rewards (such as recognition and praise) in ensuring employees feel valued and appreciated.
The key to maintaining engagement and improving retention is understanding employees’ needs and preferences and designing a reward structure that is flexible enough to take account of these. Ongoing monitoring of engagement, reasons for leaving and the effectiveness of retention strategies is vital to ensure resources are directed most effectively.
Of course, an effective retention strategy needs to start with finding the right candidates. Our findings show that two-fifths are making efforts to improve their selection and induction processes in their efforts to address retention. Organisations need to provide adequate information about the organisation and role requirements so that applicants can self-select out where appropriate. This is not only important for reducing the number of unsuitable applicants, but also for managing the expectations of successful candidates who might leave if the job does not meet their aspirations.
Looking forwardMany organisations are making efforts to meet the increasing recruitment and retention challenges they face, but our findings also suggest a year-on-year mismatch between organisations’ intentions (that is, to focus more on improving recruitment, retaining and developing staff) and what is actually put into practice. It is not clear whether this mismatch occurs because these processes are not prioritised or adequately resourced or for other reasons. What is clear is that organisations that fail to prioritise talent management risk losing out as demand for key skills escalates.
Moving forward, organisations will need to develop a solid understanding of their existing talent profile and their current and future requirements. Targeting resources effectively will remain a key priority, despite the more positive outlook for resourcing budgets (at least in the private sector). Ongoing monitoring and evaluation will be key to ensure that the methods used to attract, select and retain employees are effective.
34 Resourcing and Talent Planning Survey 2015
The CIPD Resourcing and Talent Planning survey (formerly known as the CIPD Recruitment and Retention survey) has been running since 1997. The survey, last conducted in 2013, examines organisations’ resourcing and talent planning strategies and practices and the key challenges and issues they face. This year it consisted of 29 questions completed through an online questionnaire.
The majority of questions remain the same as in previous years, to provide useful benchmarking data on topics including recruitment practices, difficulties and costs, selection methods, diversity strategies, the impact of the economic climate on resourcing and talent planning practices, labour turnover and retention strategies. This year we also included a range of new questions reflecting how changes in the economy and the labour market might impact on organisations’ recruitment and retention strategies. We also explored in more depth how employer brand helps attract candidates.
Sample profileRespondents represent organisations of all sizes (Figure A1). In a similar distribution to previous years, half work in the private services sector, a fifth in the public sector and the rest are evenly split between manufacturing and production and non-profit organisations (Table A1).
As in previous years, most refer to a particular UK region in their responses (with London and the south-east particularly well represented), while over a quarter refer to the whole of the UK (see Table A2). A minority refer to countries or regions outside of the United Kingdom.
Calculation of labour turnoverA total of 77 survey respondents were able to supply all the information necessary to calculate labour turnover on a whole-organisation basis for 2014 and 72 for 2013.
This report uses the standard ‘crude wastage’ method to calculate the rate of turnover. This method is calculated as follows:
Labour turnover =
Number of leavers in a set period____________________ x 100Average number employed in the same period
(‘Leavers’ include those leaving the organisation on a permanent basis by way of voluntary or involuntary severance, redundancies or retirements, but does not include internal transfers.)
Readers should be aware that this method has some shortcomings. For example, it takes no account of the characteristics of the workforce or the length of service of the leaver.
Background to the survey
This survey was conducted in March and April 2015. It was sent to a sample of UK-based HR professionals from a wide range of organisations. In total, 520 people responded to the survey.

35 cipd.co.uk/resourcingandtalentplanningsurvey
Table A1: Profile of respondents, by industrial sector
Number of respondents %
Manufacturing and production 73 14
Agriculture and forestry 2 0
Chemicals, oils and pharmaceuticals 7 1
Construction 10 2
Electricity, gas and water 1 0
Engineering, electronics and metals 21 4
Food, drink and tobacco 13 3
General manufacturing 2 0
Mining and quarrying 2 0
Paper and printing 1 0
Textiles 0 0
Other manufacturing/production 14 3
Private services 267 51
Professional services (accountancy, advertising, consultancy, legal, etc.) 77 15
Finance, insurance and real estate 34 7
Hotels, catering and leisure 10 2
IT services 31 6
Call centres 4 1
Media (broadcasting and publishing, etc.) 5 1
Retail and wholesale 18 3
Transport, distribution and storage 9 2
Communications 7 1
Other private services 72 14
Public sector 104 20
Central government 12 2
Education 43 8
Health 20 4
Local government 18 3
Other public services 11 2
Voluntary, community and not-for-profit sector 76 15
Care services 4 1
Charity services 18 3
Housing association 16 3
Other 38 7
Base: 520
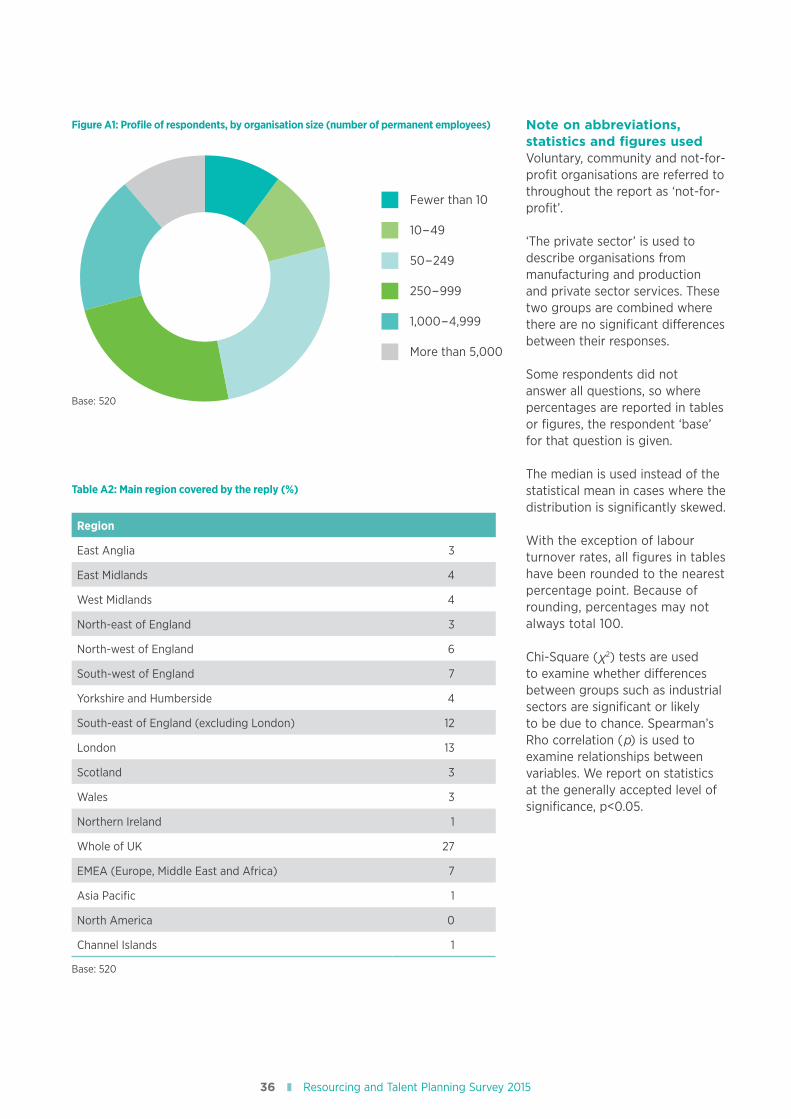
36 Resourcing and Talent Planning Survey 2015
Table A2: Main region covered by the reply (%)
Region
East Anglia 3
East Midlands 4
West Midlands 4
North-east of England 3
North-west of England 6
South-west of England 7
Yorkshire and Humberside 4
South-east of England (excluding London) 12
London 13
Scotland 3
Wales 3
Northern Ireland 1
Whole of UK 27
EMEA (Europe, Middle East and Africa) 7
Asia Pacific 1
North America 0
Channel Islands 1
Base: 520
Figure A1: Profile of respondents, by organisation size (number of permanent employees)
Fewer than 10
10-49
50-249
250-999
1,000-4,999
More than 5,000
Base: 520
Note on abbreviations, statistics and figures usedVoluntary, community and not-for-profit organisations are referred to throughout the report as ‘not-for-profit’.
‘The private sector’ is used to describe organisations from manufacturing and production and private sector services. These two groups are combined where there are no significant differences between their responses.
Some respondents did not answer all questions, so where percentages are reported in tables or figures, the respondent ‘base’ for that question is given.
The median is used instead of the statistical mean in cases where the distribution is significantly skewed.
With the exception of labour turnover rates, all figures in tables have been rounded to the nearest percentage point. Because of rounding, percentages may not always total 100.
Chi-Square (X2) tests are used to examine whether differences between groups such as industrial sectors are significant or likely to be due to chance. Spearman’s Rho correlation (p) is used to examine relationships between variables. We report on statistics at the generally accepted level of significance, p<0.05.

37 cipd.co.uk/resourcingandtalentplanningsurvey
Endnotes
1 55% of the private sector, 39% of not-for-profits and 40% of the public sector: χ2 = 12.7, df = 4, p < 0.05, n = 520.
2 Organisations that were continuing to recruit for key talent/niche areas were more likely to report their resourcing budget would increase in 2015–16: ρ = 0.19, p < 0.001, n = 441.
3 χ2 = 48.4, df = 4, p < 0.001, n = 441. 4 ρ = 0.23, p < 0.001, n = 441. 5 2014: ρ = 0.76, p < 0.001, n = 328; 2013: ρ = 0.75, p < 0.001,
n = 223. 6 2014: ρ = 0.55, p < 0.001, n = 257; 2013: ρ = 0.50, p < 0.001,
n = 180. 7 Sample size did not permit valid comparison of sectors by size. 8 χ2 = 17.4, df = 4, p < 0.01, n = 520. 9 Organisational size and technology and automation is replacing
jobs: ρ = 0.14, p < 0.01, n = 520; organisational size and the skills need for jobs in our organisation is changing: ρ = 0.13, p < 0.01, n = 520.
10 ρ = 0.13, p < 0.01, n = 520.11 χ2 = 27.6, df = 4, p < 0.001, n = 431.12 ρ = 0.34, p < 0.01, n = 74. 13 χ2 = 27.0, df = 3, p < 0.001, n = 335.14 χ2 = 10.5, df = 3, p < 0.05, n = 335.15 Developing apprenticeship schemes: χ2 = 34.4, df = 8, p < 0.001,
n = 470; sponsoring professional qualifications: χ2 = 26.6, df = 8, p < 0.001, n = 466; recruiting candidates from different sectors: χ2 = 29.7, df = 8, p < 0.001, n = 469; recruiting candidates from different industries: χ2 = 19.3, df = 8, p < 0.05, n = 468; recruiting candidates from overseas: χ2 = 28.5, df = 8, p < 0.001, n = 469; outsourcing activity to other organisations: χ2 = 19.7, df = 8, p < 0.05, n = 442; and partnering with other organisations to fill the skill gap: χ2 = 22.3, df = 8, p < 0.01, n = 449.
16 χ2 =18.4, df = 8, p < 0.05, n = 479.17 χ2 =14.1, df = 4, p < 0.001, n = 469.18 χ2 = 13.5, df = 4, p < 0.01, n = 517.19 Working practices: χ2 = 7.5, df = 2, p < 0.05, n = 520;
organisational values: χ2 = 8.4, df = 2, p < 0.05, n = 520.20 Perception of the organisation in the marketplace: χ2 = 31.6,
df = 2, p < 0.001, n = 520; perception of the organisation in society: χ2 = 19.3, df = 2, p < 0.001, n = 520.
21 χ2 = 49.8, df = 2, p < 0.001, n = 453 (Don’t know responses removed for comparability).
22 ρ = 0.23, p < 0.001, n = 453 (Don’t know responses excluded).23 Backgrounds – 2015: 44%; 2013: 38%; 2012: 17%; Ages: 2015:
65%; 2013: 60%; 2012: 59%; 2011: 45%.24 Manufacturing and production: 45% compared with 26% of
private services, 33% of not-for-profits and 37% of the public sector: χ2 = 19.0, df = 6, p < 0.01, n = 520.
25 χ2 = 17.9, df = 3, p < 0.001, n = 520.26 χ2 = 12.1, df = 3, p < 0.01, n = 520.27 χ2 = 69.4 with continuity correction, df = 1, p < 0.001, n = 520.28 χ2 = 14.7, df = 4, p < 0.01, n = 520.29 ρ = 0.21, p < 0.001, n = 520.30 χ2 = 8.8, df = 3, p < 0.05, n = 423 (Don’t know responses were
removed from the χ2 analysis as a smaller proportion of private services organisations reported they don’t know).
31 χ2 = 15.3, df = 6, p < 0.05, n = 511. 32 Use of apprentices: ρ = 0.32, p < 0.001, n = 504; sponsor
students through university: ρ = 0.18, p < 0.001, n = 503; offer
intern schemes: ρ = 0.18, p < 0.001, n = 503; offer post-A-level entry routes: ρ = 0.24, p < 0.001, n = 502.
33 χ2 = 15.9, df = 3, p < 0.01, n = 497.34 Size: ρ = 0.36, p < 0.001, n = 497.35 χ2 = 19.0 df = 3, p < 0.001, n = 518.36 χ2 = 11.2 df = 3, p < 0.05, n = 214.37 χ2 = 25.7, df = 2, p < 0.001, n = 505.38 Tests for specific skills: ρ = 0.09, p < 0.05, n = 505; general
ability tests: ρ = 0.20, p < 0.001, n = 505; literacy and/or numeracy tests: ρ = 0.19, p < 0.001, n = 505.
39 Personality/aptitude questionnaires: ρ = 0.13, p < 0.01, n = 505; online tests: ρ = 0.25, p < 0.001, n = 50; assessment centres: ρ = 0.31, p < 0.001, n = 505; group exercises: ρ = 0.16, p < 0.001, n = 505.
40 χ2 = 16.7, df = 2, p < 0.001, n = 505. 41 This option was not included prior to 2013.42 χ2 = 48.4, with continuity correction, df = 1 p < 0.001, n = 457.43 χ2 = 4.6, with continuity correction, df = 1 p < 0.05, n = 457.44 χ2 = 87.2, df = 3 p < 0.001, n = 499.45 χ2 = 9.7, df = 2 p < 0.01, n = 501.46 Total number of permanent vacancies and selected candidates
not showing up on day one: ρ = 0.25, p < 0.001, n = 317; candidates accepted offers and then subsequently declined: ρ = 0.24, p < 0.001, n = 316; candidates renegotiated offer terms: ρ = 0.14, p < 0.05, n = 318; candidates responded promptly to communications: ρ = –0.16, p < 0.01, n = 332.
47 Only 5 respondents gave turnover data for the public sector, so a meaningful sector comparison is not possible.
48 ρ = 0.13, p < 0.01, n = 447.49 χ2 = 29.7, df = 6, p < 0.001, n = 357.50 ρ = 0.24, p < 0.001, n = 357.51 Overall, 73 respondents (14%) didn’t know how their talent
management spend had changed. They are excluded from these figures for comparability across sectors.
52 ρ = 0.23, p < 0.001, n = 489.53 Although this year’s survey asked about retention challenges in
the last two years and previous surveys about the last one year, reducing direct comparability.
54 Administrative/secretarial staff: χ2 = 10.9, df = 3, p < 0.05, n = 489; technical staff: χ2 = 8.5, df = 3, p < 0.05, n = 489; manual/craft staff: χ2 = 20.1 df = 3, p < 0.001, n = 489.
55 χ2 = 19.0, df = 3, p < 0.001, n = 489.56 χ2 = 8.2, df = 2, p < 0.05, n = 476.57 Pay: χ2 = 24.2, df = 2, p < 0.001, n = 476; benefits: χ2 = 14.2,
df = 2, p < 0.01, n = 476.58 Better promotion to employees of the employer brand: χ2 = 9.3,
df = 2, p < 0.01, n = 476; Created clearer career paths: χ2 = 9.3, df = 2, p < 0.05, n = 476.
59 Increased learning and development opportunities: ρ = 0.11, p < 0.05, n = 476; improved line management’s people skills: ρ = 0.16, p < 0.001, n = 476; improved selection techniques: ρ = 0.09, p < 0.05, n = 476; offered coaching/mentoring/buddy systems: ρ = 0.16, p < 0.001, n = 476; and increased use of counter offers: ρ = 0.10, p < 0.05, n = 476.
60 ρ = 0.22, p < 0.05, n = 82 (Question was only asked of respondents who were able to provide turnover data. Don’t know responses excluded).

Chartered Institute of Personnel and Development151 The Broadway London SW19 1JQ United Kingdom T +44 (0)20 8612 6200 F +44 (0)20 8612 6201E [email protected] W cipd.co.uk Incorporated by Royal CharterRegistered as a charity in England and Wales (1079797) and Scotland (SC045154)
Issued: June 2015 Reference: 7015 © CIPD 2015