Embed Size (px)
Citation preview
DI
SC
US
SI
ON
P
AP
ER
S
ER
IE
S
Forschungsinstitut zur Zukunft der ArbeitInstitute for the Study of Labor
Cigarette Taxes and the Social Market
IZA DP No. 5580
March 2011
Benjamin HansenJoseph J. SabiaDaniel I. Rees
Cigarette Taxes and the Social Market
Benjamin Hansen University of Oregon
Joseph J. Sabia
U.S. Military Academy
Daniel I. Rees University of Colorado Denver
and IZA
Discussion Paper No. 5580 March 2011
IZA
P.O. Box 7240 53072 Bonn
Germany
Phone: +49-228-3894-0 Fax: +49-228-3894-180
E-mail: [email protected]
Any opinions expressed here are those of the author(s) and not those of IZA. Research published in this series may include views on policy, but the institute itself takes no institutional policy positions. The Institute for the Study of Labor (IZA) in Bonn is a local and virtual international research center and a place of communication between science, politics and business. IZA is an independent nonprofit organization supported by Deutsche Post Foundation. The center is associated with the University of Bonn and offers a stimulating research environment through its international network, workshops and conferences, data service, project support, research visits and doctoral program. IZA engages in (i) original and internationally competitive research in all fields of labor economics, (ii) development of policy concepts, and (iii) dissemination of research results and concepts to the interested public. IZA Discussion Papers often represent preliminary work and are circulated to encourage discussion. Citation of such a paper should account for its provisional character. A revised version may be available directly from the author.
IZA Discussion Paper No. 5580 March 2011
ABSTRACT
Cigarette Taxes and the Social Market* Previous researchers have argued that the social market for cigarettes insulates its participants from policies designed to curb youth smoking. Using state Youth Risk Behavior Survey data, we examine whether recent changes in state cigarette taxes affected how young smokers obtained their cigarettes. Our estimates suggest that tax increases reduce youth smoking participation primarily through their effect on third-party purchase, although there is evidence that they are negatively related to borrowing among younger teenagers and negatively related to direct purchase among older teenagers.
NON-TECHNICAL SUMMARY Most teenage smokers in the United States participate in what is called the social market for cigarettes. In fact, 70 to 90 percent of teenage smokers report borrowing, stealing, or buying cigarettes from friends, family or strangers as opposed to buying their cigarettes directly from a commercial establishment. Despite the importance of the social market, we know very little about its interaction with policies designed to curb youth smoking. Analyzing data on U.S. high school students for the period 1995-2009, we find evidence that state cigarette taxes reduce youth smoking participation primarily through their effect on third-party purchases, an important component of the social market. In addition, we find that taxes are negatively related to the probability that younger teenagers borrow cigarettes. These results do not support the claim made by previous researchers that the social market should insulate young smokers against anti-smoking policies by serving as an alternative source of cigarettes. JEL Classification: I10, I12 Keywords: youth smoking, cigarette taxes Corresponding author: Benjamin Hansen Department of Economics 1285 University of Oregon Eugene, OR 9740 USA E-mail: [email protected]
* The views expressed herein are those of the authors and do not reflect the position of the United States Military Academy, the Department of the Army, or the Department of Defense.
1. INTRODUCTION
Most teenage smokers participate in what is called the social market for cigarettes.
In fact, 70 to 90 percent of teenage smokers report borrowing, stealing, or buying ciga-
rettes from friends, family or strangers as opposed to buying their cigarettes directly from a
commercial establishment (Croghan et al. 2003; Forster et al. 2003).
Despite the importance of the social market, we know very little about its interaction
with policies designed to curb youth smoking. Previous researchers have argued that the
social market should insulate young smokers against such policies by serving as an alternative
source of cigarettes (Friend et al. 2001; Ribisl 2003). However, there are several reasons
to view this argument with a certain degree of skepticism. For instance, if commercial
establishments are required to diligently check IDs, then the supply of cigarettes to the
social market could decrease.
Our analysis uses state YRBS data at the individual level for the period 1995 though
2009 to estimate the e¤ect of state cigarette taxes, an important policy tool, on the social
market. Because we have more observations per state-year than were available to previ-
ous researchers, and because cigarette tax increases were substantially larger in the 2000s
than during the mid-to-late 1990s (Carpenter and Cook 2008), we are able to account for
unobserved heterogeneity by including state �xed e¤ects and state-speci�c time trends. In
addition, we are able to distinguish between borrowing, direct purchase, third-party purchase,
and obtaining cigarettes through other sources including vending machines and stealing.
We begin our analysis by con�rming that there was a negative relationship between
state cigarette taxes and youth smoking during the period under study. Next, we turn to
1
estimating the e¤ect of taxes on how youth usually obtained their cigarettes. Multinomial
logit estimates suggest that taxes reduce youth smoking participation primarily through their
e¤ect on third-party purchases, although they are negatively related to the probability that
younger teenagers (14- and 15-year-olds) borrow cigarettes, and negatively related to the
probability that older teenagers (16- through 18-year-olds) directly purchase cigarettes from
a commercial establishment. When we condition on frequent or everyday smoking, there
is strong evidence that tax increases push teenage smokers away from third-party purchase
and toward obtaining their cigarettes from other sources.
2. BACKGROUND
Until recently, researchers believed that teenage smoking participation was highly
sensitive to changes in the price of cigarettes. In fact, the �conventional wisdom�held that
teenagers were more sensitive to changes in the price of cigarettes than adults (Carpenter
and Cook 2008).1
The results of recent studies by DeCicca, Kenkel and Mathios (2002) and Carpenter
and Cook (2008) have cast doubt on the conventional wisdom. Using data from the National
Educational Longitudinal Study, DeCicca, Kenkel and Mathios (2002) found that di¢ cult-
to-measure factors at the state level could explain nearly the entire relationship between
youth smoking participation and cigarette taxes. Using data from state YRBS surveys,
Carpenter and Cook (2008) found that a 10 percent increase in the price of cigarettes was
1There is evidence that state cigarette tax increases are passed on to consumers almost dollar for dollar.For instance, Barnett, Keeler and Hu (1995) estimated that a one-dollar increase in the state cigarette taxleads to a 90 cent increase in the price paid by consumers. Using data from The Tax Burden on Tobacco:Historical Compilation (Orzechowsku and Walker 2009) for the period 1995 through 2009, we �nd that aone-dollar increase in the per-pack cigarette tax is associated with an increase in the per-pack retail price of97 cents. See also Hanson and Sullivan (2009) and DeCicca, Kenkel and Liu (2010).
2
associated with only a 2.5% decrease in youth smoking participation� an estimate that
suggests teenagers are considerably less sensitive to changes in the price of cigarettes than
adults (Evans, Ringel and Stech 1999; Franz 2008).
Most teenage smokers depend, at least in part, on the social market to obtain ciga-
rettes. According to previous studies such as Croghan et al. (2003) and Forster et al. (2003),
70 to 90 percent of teenage smokers report borrowing, buying, or stealing cigarettes. Could
the importance of the social market explain the results of DeCicca, Kenkel and Mathios
(2002) and Carpenter and Cook (2008)? In other words, is it possible that the social market
insulates young smokers by serving as an alternative source of cigarettes when the price
charged by commercial establishments goes up? A number of authors have argued that the
social market for cigarettes dampens the e¤ectiveness of anti-smoking policies (Friend et al.
2001; Ribisl 2003). For instance, according to Ribisl (2003, p. 115),
When there are �crackdowns�on sales to minors at stores, many youth simplyswitch their usual source of cigarettes. Social sources have simply �lled the void.2
If social sources serve as a substitute to direct purchase from commercial establishments,
then increases in the cigarette tax should encourage participation in the social market. On
the other hand, if tax increases make obtaining cigarettes through the social market more
di¢ cult, then we should observe the opposite relationship.
2In a similar vein, Friend et al. (2001, p. 507) wrote:
One of the reasons that retail-based policies have failed to signi�cantly reduce youth smokingrates is attributable in part to youths substituting social or non-retail sources of cigarettes forretail supply. The widespread availability of cigarettes through social sources such as borrow-ing, stealing, or buying cigarettes from parents, older siblings, and peers, and requesting olderstrangers to purchase them highlights the di¢ culty of eliminating all supplies of youth ciga-rettes. Strategies should be implemented that are developed speci�cally to reduce access fromsocial sources.
3

There are, in fact, several reasons to expect the relative cost of obtaining cigarettes
through the social market to be positively related to taxes: parents, siblings and friends may
quit smoking if it becomes too expensive, increasing the relative cost of participation in the
social market through reducing opportunities to steal and borrow; third-party sellers may
charge more in response to new taxes3; or smokers may become increasingly reluctant to
lend cigarettes as the price charged by commercial establishments goes up, leaving smokers
without su¢ cient social capital (in particular, younger smokers) unable to borrow.
In an often-cited article, Coleman (1988, p. S98) de�ned social capital as constituting
a �particular kind of resource available to an actor... making possible the achievement of
certain ends that in its absence would not be possible.�He went on to explain that social
capital
comes about through changes in the relations among persons that facilitate ac-tion. If physical capital is wholly tangible, being embodied in observable materialform, and human capital is less tangible, being embodied in the skills and knowl-edge acquired by an individual, social capital is less tangible yet, for it exists inthe relations among persons (Coleman 1988, pp. S100-S101).4
Below, we explore the e¤ect of taxes on how youth obtain their cigarettes, paying special
attention to the roles of age and intensity of tobacco use. We hypothesize that, because
they have had less time to accrue social capital, younger smokers may be pushed out of the
social market when cigarette prices rise. Similarly, if the act of smoking itself increases
3If, for instance, third-party sellers impose a markup over the commercial price, but can compete withcommercial establishments because they do not check IDs, then a new tax will result in an increase in therelative cost of third-party purchase.
4There are, of course, alternative de�nitions of social capital. For instance, Bourdieu (1986, p. 248)de�ned social capital as the �aggregate of the actual or potential resources which are linked to possession ofa durable network of more or less institutionalized relationships of mutual acquaintance and recognition...�;and Woolcock and Narayan (2000, p. 226) de�ned social capital as referring to the �norms and networksthat enable people to act collectively.� See Woolcock and Narayan (2000) for more information on socialcapital and its applications.
4
social status or helps to promote friendships with other smokers, then we would expect
experimental and light smokers to have less social capital on which to draw than frequent
smokers and therefore be more susceptible to being pushed out of the social market.5
To our knowledge, only one previous study has explored the relationship between
cigarette taxes and the social market. Using data from the national Youth Risk Behavior
Survey (YRBS), Katzman, Markowitz and McGeary (2007) found that state excise taxes
on cigarettes taxes have little impact on borrowing or �bumming.�However, these authors
examined data from only four national YRBS surveys (1995, 1997, 1999 and 2001) conducted
during a period when there was limited within-state variation in cigarette taxes. As a
consequence, they were forced to rely on cross-state variation for identi�cation, and their
estimates, although intriguing, could re�ect di¢ cult-to-measure factors at the state level
such as anti-smoking sentiment.6
3. DATA AND MEASURES5We are not the �rst researchers to hypothesize that there is a link between social capital and smoking
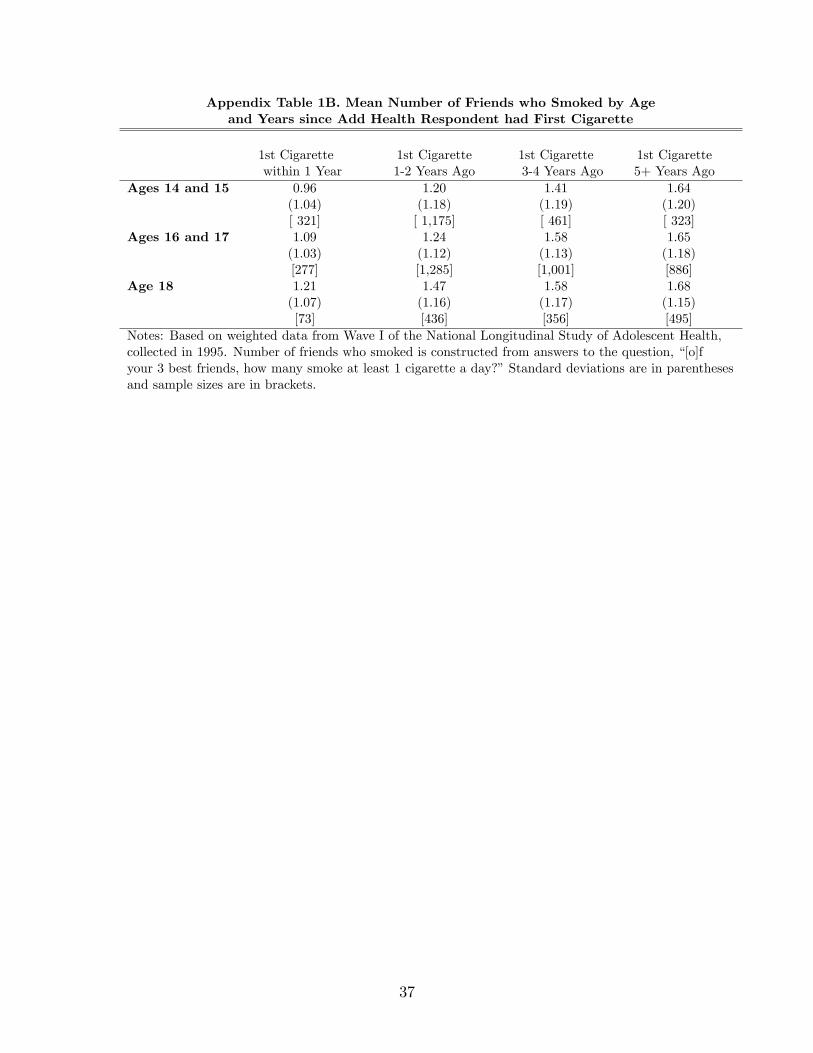
behavior. Lindström (2003) found that daily smoking was negatively associated with social participation,whereas intermittent smoking was positively associated with social participation; and Brown et al. (2006, p.1159) found that the �proportion of community social capital attributable to religious groups�was negativelyrelated to smoking intensity.Neither the state nor national YRBS asks about the smoking behavior of friends or acquaintances. In an
e¤ort to explore the extent to which age and smoking intensity might impact access to the social market, weturned to data from Wave I of the National Longitudinal Study of Adolescent Health (Add Health), a school-based nationally representative survey of 7th-12th graders conducted in 1995. Add Health respondents wereasked, �[o]f your 3 best friends, how many smoke at least 1 cigarette a day?�Not surprisingly, we found that 14- and 15-year-olds reported fewer friends who smoked than 16-, 17-, and
18-year-olds. In addition, we found that 14- and 15-year-old smokers reported fewer friends who smokedthan 16-, 17-, and 18-year-old smokers. Finally, we found that, conditional on age, both smoking intensityand years since �rst cigarette were positively related to how many friends the respondent had who smoked.These results are presented in Appendix Tables 1A and 1B. Although far from de�nitive, we view themas consistent with the notion that older teenagers and more frequent/dedicated smokers should have easieraccess to the social market for cigarettes.
6Using data on young adults drawn from the National Education Longitudinal Study, DeCicca, Kenkeland Mathios (2008) found that anti-smoking sentiment can explain much of the cross-state relationshipbetween taxes and youth smoking participation.
5
The current study relies on state Youth Risk Behavior Survey (YRBS) data at the
individual level for the period 1995-2009. The state versions of the YRBS are school-based,
and contain many of the same questions as the national YRBS. They are coordinated by the
Centers for Disease Control, and are typically administered to high school students every
other year.
A number of previous studies have used national YRBS data to examine the rela-
tionship between cigarette taxes and youth smoking participation (Gruber and Zinman 2001;
Bishai, Mercer and Athena Tapales 2005; Carpenter and Cook 2008). To our knowledge, the
only previous study in this area to use state YRBS data is by Carpenter and Cook (2008).
These authors, however, did not have access to information at the individual level from the
state surveys.
The principal advantage to using state, as opposed to national, YRBS data is that
we often have 1000s of observations per state-year.7 Estimating a non-linear model with
state �xed e¤ects requires more observations per state-year than linear models in which
the state �xed e¤ects are eliminated through mean di¤erencing. States typically provide
hundreds, and occasionally only dozens, of observations to the national YRBS in any given
year, posing an obstacle to obtaining consistent parameter estimates from a non-linear model
such as a multinomial logit. For instance, 18 of 25 states contributed fewer than 1,000
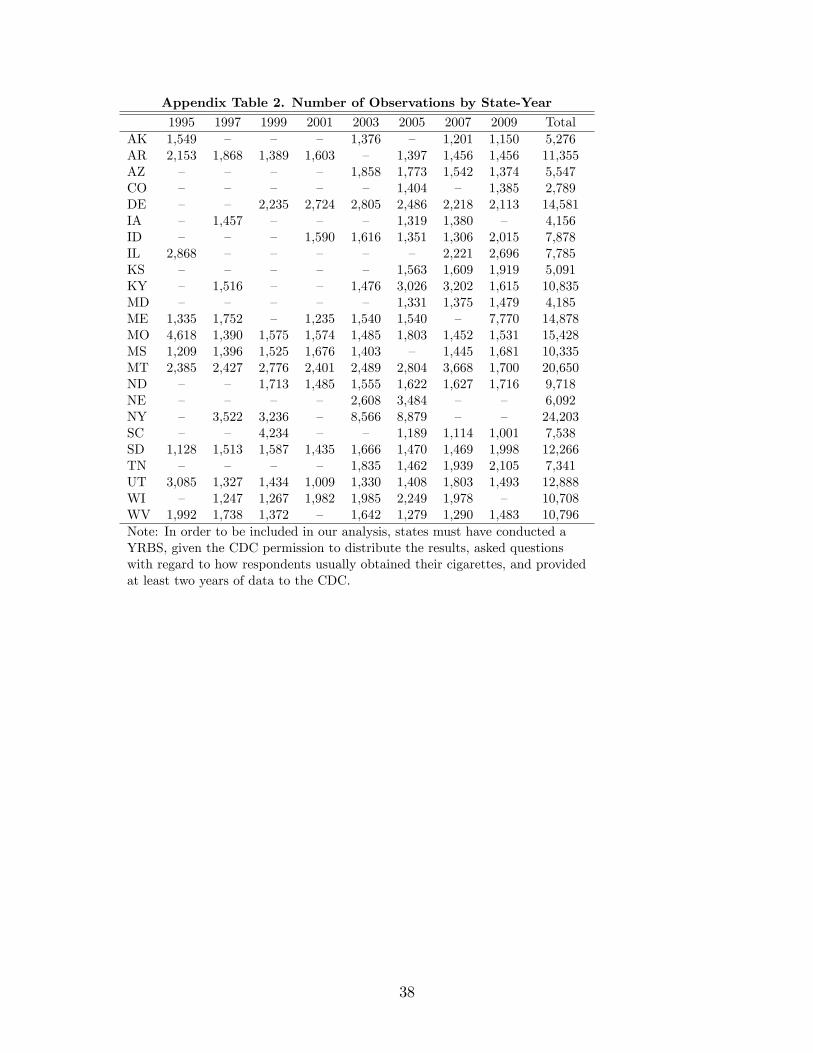
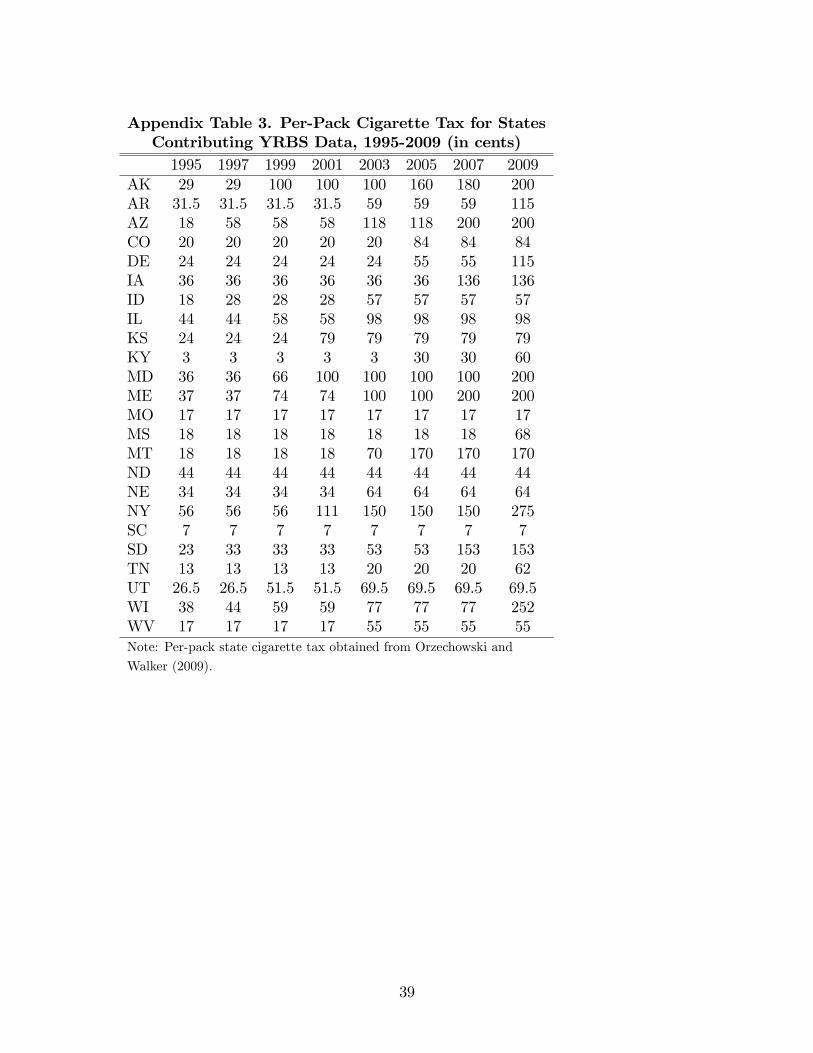
7For more information on the state YRBS data collection e¤ort see:http://www.cdc.gov/HealthyYouth/yrbs/index.htm. Appendix Table 2 shows which states collectedand released data to the Centers for Disease Control and Prevention (CDC) on how young smokers usuallyobtained their cigarettes by year. It also shows sample size by state and year. Importantly, no statecontributed fewer than 1,000 observations in any given year. Our focus is restricted to the 24 states that:conducted a YRBS, gave the CDC permission to distribute the results, asked questions with regard to howrespondents usually obtained their cigarettes, and provided at least two years of individual-level data to theCDC. Among these states, the mean cigarette tax increase was 34 cents (in 2005 dollars) during the period1995- 2001. In comparison, the mean cigarette tax increase was 59 cents during the period 2002-2009.Appendix Table 3 shows nominal cigarette taxes by state and year.
6
observations to the 2009 national YRBS; 9 contributed fewer than 300 observations; and
2 contributed 100 or fewer observations. In their seminal work, Neyman and Scott (1948)
showed that estimating non-linear models with limited data can result in problems with
incidental parameters, raising both theoretical and computational concerns.8
The principal disadvantage to using state YRBS data is that they are not designed to
be nationally representative. However, comparing the information contained in state surveys
with that from other sources can help gauge the severity of any potential bias. Table 1A
shows the prevalence of smoking among state YRBS respondents for the period 1995-2009.
In addition, it shows the prevalence of frequent smoking (de�ned as having smoked on 20 of
the past 30 days) and everyday smoking.9 Twenty-�ve percent of the respondents in our
sample smoked at least once in the past 30 days; 12 percent were frequent smokers; and
9 percent were everyday smokers.10 Despite the fact that the state YRBS data are not
designed to be nationally representative, these �gures are quite similar to those obtained
using weighted data from the national YRBS for the same period (Table 1B).
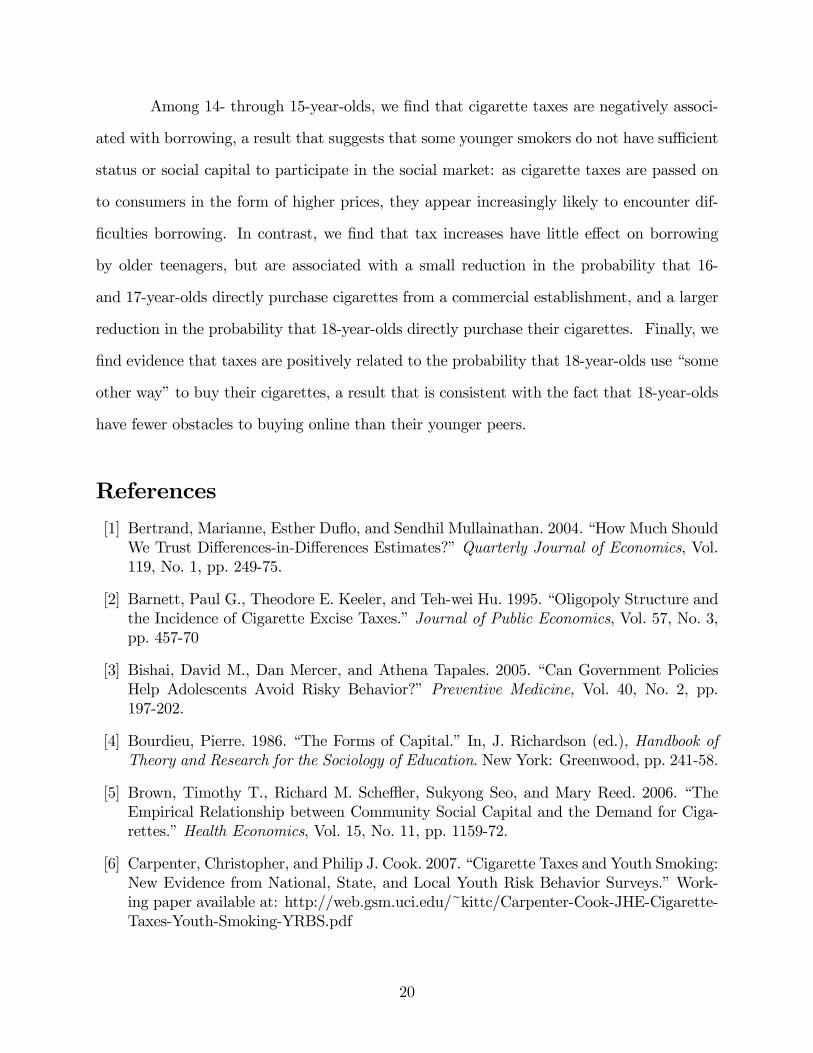
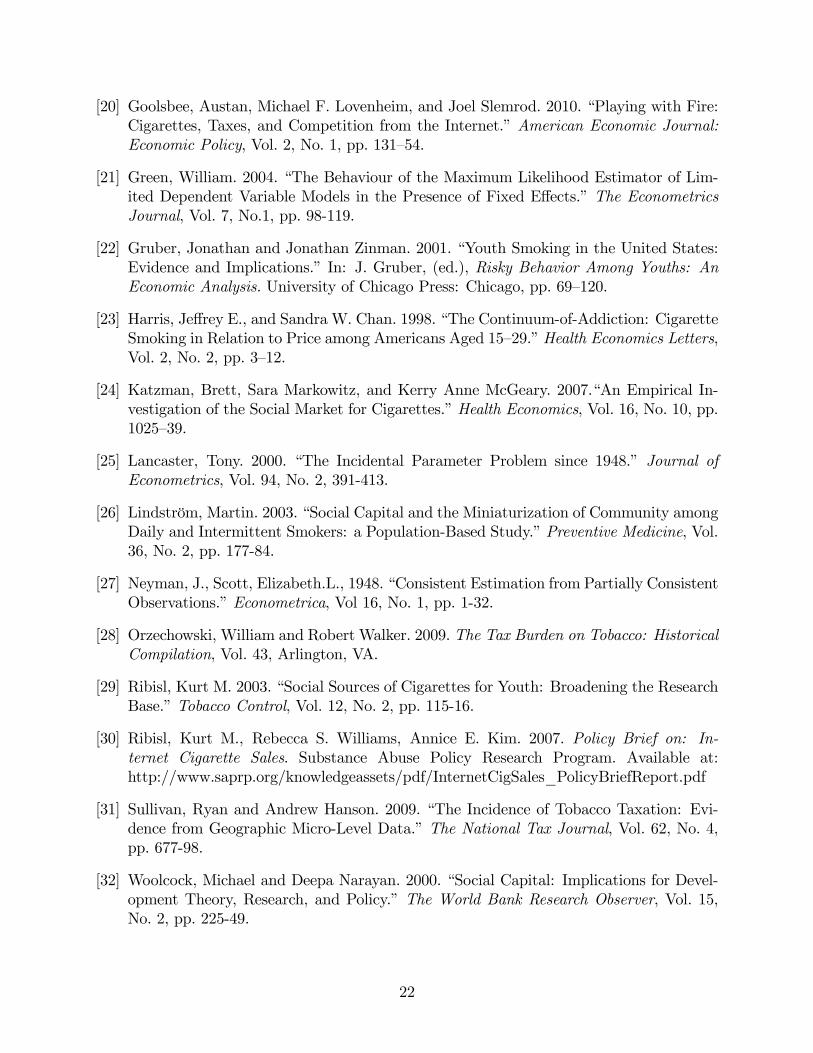
In a further e¤ort to explore this issue, we examine smoking participation trends
for 10th and 12th graders based on state YRBS data, weighted national YRBS data, and
weighted data from Monitoring the Future (MTF), a school-based, nationally representative
survey (Figures 1 and 2).11 Although smoking participation rates in the state and national
8Lancaster (2000) provides an excellent overview of this issue. See also Green (2004), who showed viasimulation that the bias resulting from incidental parameters is reduced considerably as group size increases.Green�s Monte-Carlo �ndings for discrete choice models �including logits and ordered logits �highlight thebene�ts to using data from the state, as opposed to the national, YRBS.
9This is the same de�nition of frequent smoking as was used by Carpenter and Cook (2008).10These �gures were based on unweighted answers to the question, �[d]uring the past 30 days, on how
many days did you smoke cigarettes?�11We focus on 10th and 12th graders because the MTF interviews 8th, 10th, and 12th graders, while the
state and national YRBS data contain information on 9th, 10th, 11th, and 12th graders.
7
YRBS data are 3 to 8 percentage points higher than those in MTF, the trends in participation
are similar across all three surveys, suggesting that they captured the same broad changes
in preferences and responses to policy.12
In addition to asking how many cigarettes were consumed in the past 30 days,
state and national YRBS respondents were asked about how they obtained their cigarettes.
Speci�cally, they were asked: �[d]uring the past 30 days, how did you usually get your own
cigarettes?�The possible answers were:
(1) I did not smoke cigarettes during the past 30 days.(2) I bought them in a store such as a convenience store, supermarket, discount store,
or gas station.(3) I gave someone else money to buy them for me.(4) I borrowed (or bummed) them from someone else.(5) A person 18 years old or older gave them to me.(6) I bought them from a vending machine.(7) I took them from a store or family member.(8) I got them some other way.
By combining responses (4) and (5), and combining responses (6), (7) and (8), we created
four outcomes: Direct Purchase, Third-Party Purchase, Borrowed, and Vending Machine,
Stealing or Other.13
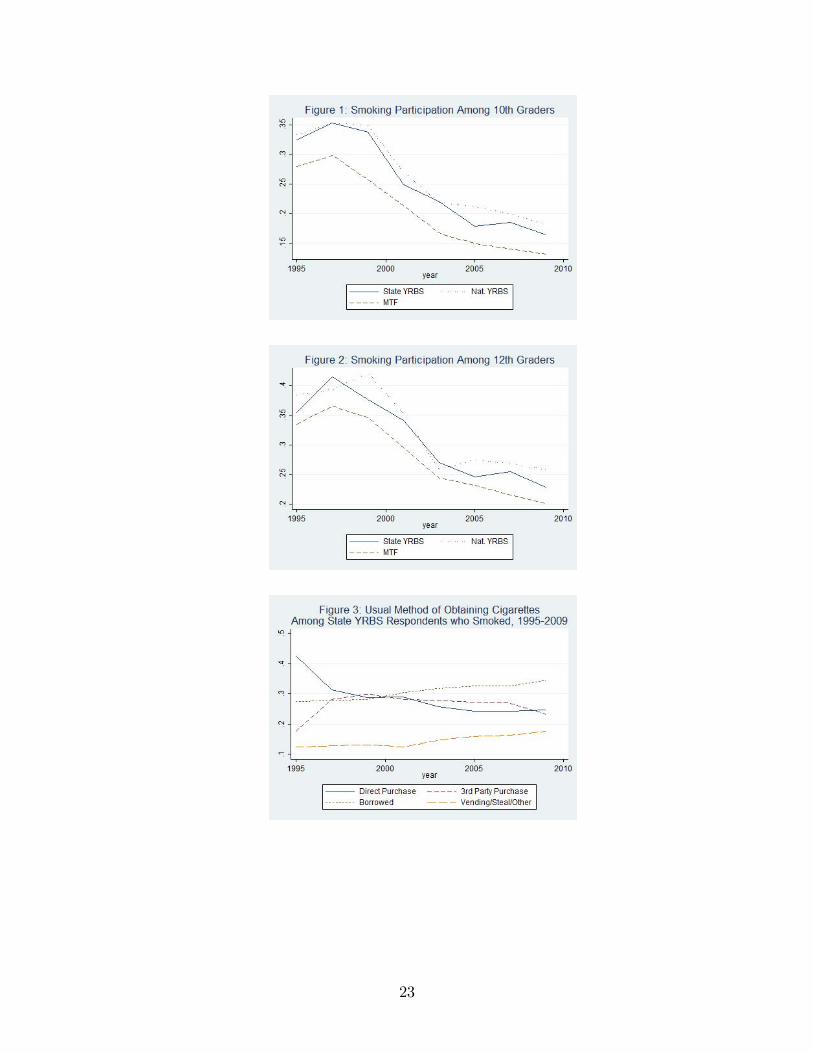
Figure 3 presents trends in these outcomes for state YRBS respondents who smoked.
It is clear from Figure 3 that the social market has become more important since the mid-
1990s. In 1995, more than 40 percent of state YRBS respondents who smoked obtained
their cigarettes through direct purchase; by 2009, only 25 percent obtained their cigarettes
through direct purchase. Over the same period, third-party purchase, borrowing and other
methods of obtaining cigarettes including stealing and vending machines increased in relative
12Although the national YRBS has been an important source of data for researchers in this area, becauseneither MTF nor the National Survey on Drug Use and Health (NSDUH) typically provide state-identi�ers,they have been of less value to researchers interested in cigarette taxes and the smoking behavior of youths.Our attempts at obtaining individual-level MTF and NSDUH data with state identi�ers were politely re-bu¤ed.
13Table 1C presents means for these outcomes.
8
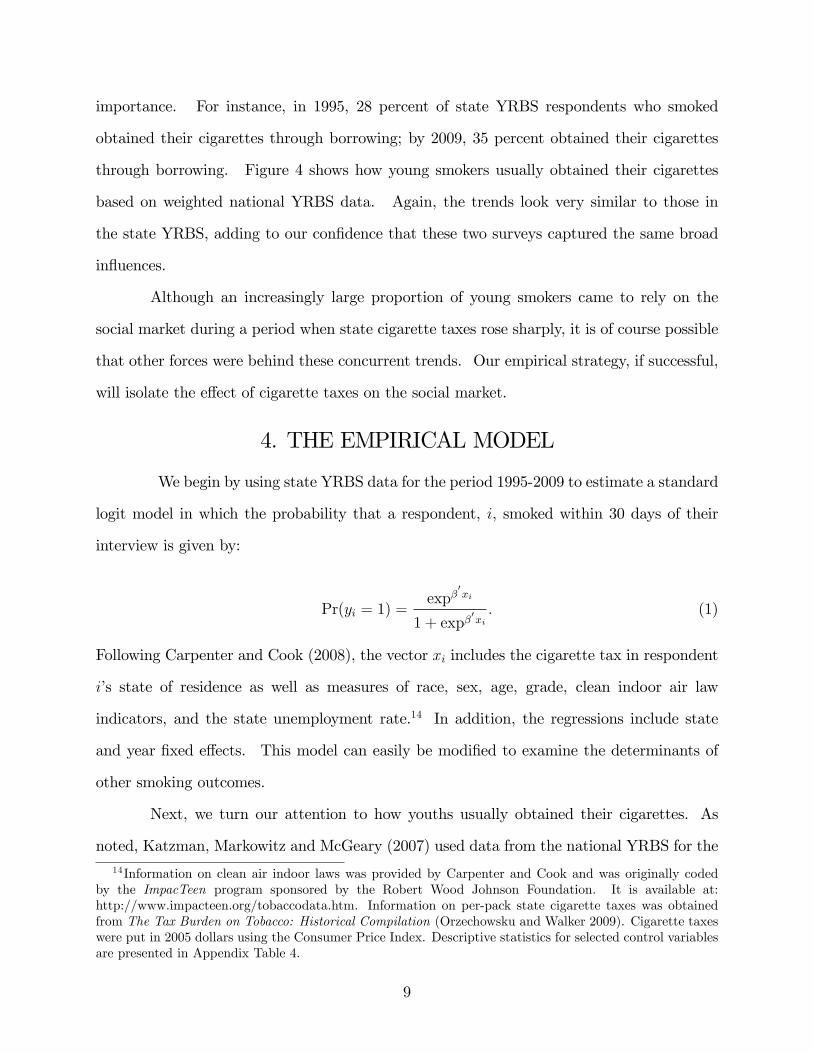
importance. For instance, in 1995, 28 percent of state YRBS respondents who smoked
obtained their cigarettes through borrowing; by 2009, 35 percent obtained their cigarettes
through borrowing. Figure 4 shows how young smokers usually obtained their cigarettes
based on weighted national YRBS data. Again, the trends look very similar to those in
the state YRBS, adding to our con�dence that these two surveys captured the same broad
in�uences.
Although an increasingly large proportion of young smokers came to rely on the
social market during a period when state cigarette taxes rose sharply, it is of course possible
that other forces were behind these concurrent trends. Our empirical strategy, if successful,
will isolate the e¤ect of cigarette taxes on the social market.
4. THE EMPIRICAL MODEL
We begin by using state YRBS data for the period 1995-2009 to estimate a standard
logit model in which the probability that a respondent, i, smoked within 30 days of their
interview is given by:
Pr(yi = 1) =exp�
0xi
1 + exp�0xi: (1)
Following Carpenter and Cook (2008), the vector xi includes the cigarette tax in respondent
i�s state of residence as well as measures of race, sex, age, grade, clean indoor air law
indicators, and the state unemployment rate.14 In addition, the regressions include state
and year �xed e¤ects. This model can easily be modi�ed to examine the determinants of
other smoking outcomes.
Next, we turn our attention to how youths usually obtained their cigarettes. As
noted, Katzman, Markowitz and McGeary (2007) used data from the national YRBS for the14Information on clean air indoor laws was provided by Carpenter and Cook and was originally coded
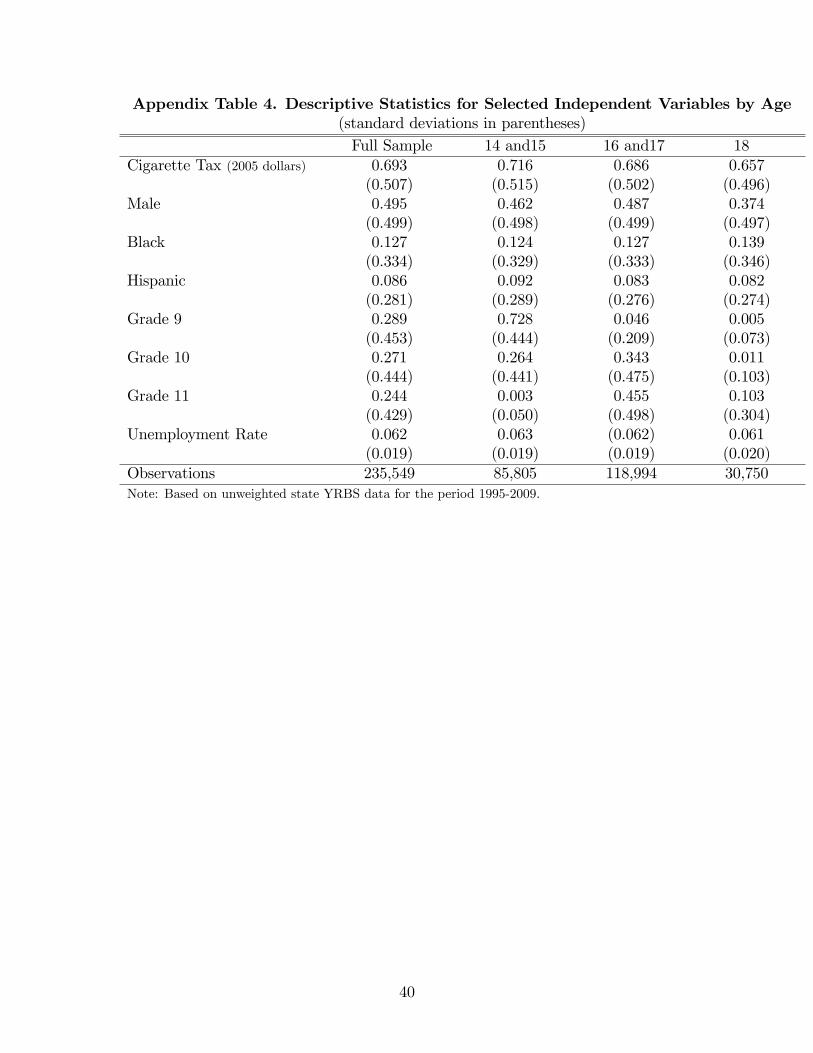
by the ImpacTeen program sponsored by the Robert Wood Johnson Foundation. It is available at:http://www.impacteen.org/tobaccodata.htm. Information on per-pack state cigarette taxes was obtainedfrom The Tax Burden on Tobacco: Historical Compilation (Orzechowsku and Walker 2009). Cigarette taxeswere put in 2005 dollars using the Consumer Price Index. Descriptive statistics for selected control variablesare presented in Appendix Table 4.
9
period 1995-2001. Restricting their sample respondents who had smoked at least once in
their lives, they estimated the following multinomial logistic model:
Pr(yi = j) =exp�
0jxi
1 +JXj=1
exp�0jxi
; (2)
where j indexes the choice between borrowing, purchasing, and not smoking. They found
little evidence that cigarette taxes were related to borrowing, and concluded that cigarette
tax increases �are ine¤ective in reaching the group of light smokers who primarily obtain
cigarettes through the social market, thus indicating that alternative measures should be
explored in an e¤ort to reduce the number of smokers in the future�(p. 1025).15
However, there is reason to take this conclusion with a grain of salt. Katzman,
Markowitz and McGeary (2007) had available to them data from a period when there was
limited within-state variation in cigarette taxes. Moreover, many states contributed only
a few hundred observations to the national YRBS in any given year. As a result of these
limitations, Katzman, Markowitz and McGeary (2007) were forced to rely on cross-state
variation in taxes for identi�cation and could not control for di¢ cult-to-measure factors at
the state level such as anti-smoking sentiment.16
Our empirical strategy is similar to that adopted by Katzman, Markowitz and
McGeary (2007), who focused on the decision to borrow versus buy cigarettes. Speci�-
15Katzman, Markowitz and McGeary (2007) also examined a sample composed of all respondents regard-less of smoking history. The results were similar to the results obtained when the sample was restricted torespondents who had smoked at least once in their lives. That is, there was little evidence that cigarette taxeswere related to borrowing. In both the full sample and the sample composed of �light smokers�, cigarettetaxes were negatively related to the probability of buying cigarettes.
16Although these authors attempted to �further account for the potential endogeneity of prices and taxes�by including state �xed e¤ects as controls, they discovered that
the inclusion of state �xed e¤ects in conjunction with the time �xed e¤ects eliminated vir-tually all the independent variation in cigarette prices. An ordinary least squares regressionof cigarette prices on state and time e¤ects alone yields an R2 of 0.97. The R2 when taxesare considered is 0.87. These results imply that there is not enough variation within states toinclude state �xed e¤ects in the models (Katzman, Markowitz and McGeary 2007, p. 1030).
10
cally, in order to examine the relationship between taxes and how youths obtained their
cigarettes, we estimate a multinomial logistic model with state and year �xed e¤ects, but
outcomes that correspond to those introduced in the previous section. Estimation of this
model is aided by the fact that our data often contain more observations per state-year than
do the national YRBS data. It is also aided by the fact that almost every state increased
its per-pack cigarette tax during the 2000s.17
5. THE RESULTS
Regression results are presented in Tables 2 through 10. Standard errors corrected
for clustering at the state level are reported (Bertrand, Du�o and Mullainathan 2004). Al-
though we always employ the controls proposed by Carpenter and Cook (2008), our focus is
on estimating the impact of a one-dollar increase in state cigarette taxes.18
5.1 Cigarette taxes and participation
Table 2 presents estimated marginal probabilities from the standard logit model
described above. We examine the e¤ects of cigarette tax increases on three binary outcomes:
smoking participation, frequent smoking, and everyday smoking.
When the full sample of 9th through 12th graders is examined, a one-dollar increase
in the cigarette tax is associated with a 9 percent (0.022/0.246) reduction in youth smok-
ing participation, a 14 percent (0.017/0.12) reduction frequent smoking, and an 18 percent
(0.016/0.088) reduction everyday smoking.
17The exceptions are California, Missouri, North Dakota, and South Carolina. As a result of these in-creases in the per-pack cigarette tax, we are able to introduce state �xed e¤ects without losing as muchidentifying variation as did Katzman, Markowitz and McGeary (2007). In fact, an ordinary least squares re-gression of cigarette taxes on state and time e¤ects for the period 1995-2009 yields an R2 of 0.78, considerablylower than the R2 obtained by Katzman, Markowitz and McGeary (2007).
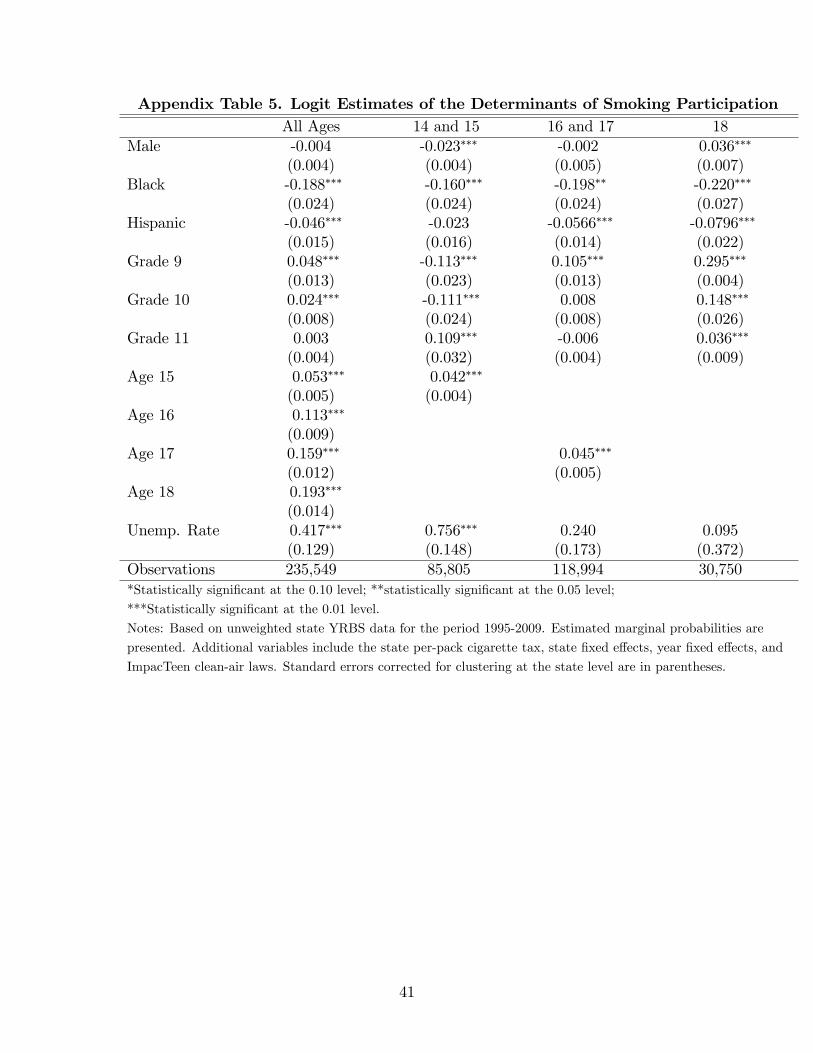
18The mean cigarette tax was 69.3 cents in our sample. Estimated marginal probabilities (from a smokingparticipation equation) are shown in Appendix Table 5. We �nd that blacks and Hispanics are less likelyto smoke than whites. In addition, we �nd that age is positively related to the probability of smoking.These results are consistent with those of previous studies (Chaloupka and Grossman 1996; Carpenter andCook 2007). Male 14- and 15-year-olds are less likely to smoke than female 14- and 15-year-olds, but male18-year-olds are more likely to smoke than female 18-year-olds. When we estimated a smoking participationequation using national YRBS data, the results were similar to those presented in Appendix Table 5.
11

These estimates are comparable in magnitude to those obtained by Carpenter and
Cook (2008) when using state YRBS data for the period 1993-2005. Carpenter and Cook
(2008) found that a one-dollar increase in cigarette taxes was associated with a 9 percent
reduction in youth smoking participation and an 18 percent reduction in frequent smoking.
Using data from the national YRBS for the period 1991-2005, Carpenter and Cook (2008)
found that a one-dollar increase in cigarette taxes was associated with a 20 percent reduc-
tion in youth smoking participation and a 30 percent reduction in frequent smoking. The
comparison of our estimates with those of Carpenter and Cook (2008) suggests that the
responsiveness of youth smoking to cigarette tax increases has remained roughly constant
through the 1990s and 2000s.19
Fourteen- and 15-year-old smokers relied more heavily on the social market than
their older peers. In fact, only 11 percent of 14- and 15-year-old state YRBS respondents
who smoked usually obtained their cigarettes through direct purchase from a commercial
establishment.20 Despite this reliance on the social market, cigarette taxes appear to have
had comparable e¤ects on the smoking behavior of younger teenagers and their older coun-
terparts. When the sample is restricted to 14- and 15-year-olds, a one-dollar increase in the
state cigarette tax is associated with an 11 percent (0.022/0.196) reduction in participation
and a 17 percent (0.013/0.077) reduction in frequent smoking. In comparison, among 16-
through 17-year-olds, a one-dollar tax increase is associated with a 7 percent (0.018/0.263)
reduction in participation and a 13 percent (0.017/0.130) reduction in frequent smoking.
Among 18-year-olds, a one-dollar tax increase is associated with a 12 percent (0.039/0.319)
19However, it is interesting to note that when we restrict our attention to state YRBS data for the period2001-2009, there is very little evidence that cigarette taxes are related to smoking behavior. For instance,among 14- through 18-year-olds, a one-dollar increase in the cigarette tax is associated with a statisticallyinsigni�cant 0.08 decrease in smoking participation and a statistically insigni�cant 0.09 decrease in frequentsmoking.
20Younger teens presumably had more di¢ culty buying from commercial outlets. The minimum legalpurchase age (MLPA) for cigarette was 18 in all but a handful of states (Alabama, Alaska, New Jersey,Pennsylvania, and Utah) during the period 1995-2009, although the state legislatures of Massachusetts andIllinois have recently debated raising the MLPA to 19. If the full cost of obtaining cigarettes includes thetime and e¤ort spent trying to evade MLPA restrictions, then a one-dollar increase in the cigarette tax wouldrepresent a smaller proportional increase in cost for younger teens than for older teens. Thus, we mightexpect cigarette tax increases to have a smaller impact on the smoking behavior of younger teens.
12
reduction in participation and an 18 percent (0.031/0.177) reduction in frequent smoking.
Next, we explore the sensitivity of these estimates to controlling for anti-smoking
sentiment measured using the Tobacco Use Supplements of the Current Population Survey
(CPS). The CPS asked respondents about their views on the promotion and advertising of
tobacco products, policies that restrict smoking on public or private property, and whether
they permit smoking in their homes. DeCicca et al. (2008) used the answers to these
questions to produce a measure of anti-smoking sentiment at the state level.21
The results of this exercise are reported in the top panel of Table 3. Although our
estimates of the relationship between cigarette taxes and smoking are, in a few cases, slightly
reduced in magnitude, it is clear that anti-smoking sentiment is not the primary diver of the
results reported in Table 2.
Finally, we explore the sensitivity of the estimated relationship between taxes and
smoking to including state-speci�c linear time trends on the right-hand-side. Their inclusion
is intended to control for tastes and other determinants of smoking that moved smoothly
over time. The bottom panel of Table 3 reports the results of this exercise. Controlling for
state-speci�c linear time trends often reduces the precision of our estimates; nevertheless,
there is a clear negative relationship between taxes and smoking.
Taken together, the results in Tables 2 and 3 provide strong evidence that state
cigarette tax increases during the 1995-2009 period led to reductions in youth smoking.
Despite the fact that 14-and 15-year-olds relied primarily on the social market for cigarettes,
their response to these tax increases appears to have been comparable to that of their older
peers who relied more heavily on direct purchase from a commercial establishment.
5.2. Cigarette taxes and the social market
In Table 4, we present estimated marginal probabilities from the multinomial logit
21The anti-smoking sentiment variable was provided to us by DeCicca, Kenkel, Mathios, Shin, and Lim(i.e., DeCicca et al. 2008). As noted by DeCicca, Kenkel and Mathios (2008, p. 909), �[i]f public anti-smokingsentiment is itself an important determinant of smoking, failing to control for di¤erences in anti-smokingsentiment across states will bias estimates towards �nding stronger tax-responsiveness.�
13

model. The baseline category is composed of non-smokers. Our results suggest that, in
addition to discouraging smoking, cigarette taxes in�uence how youth obtain their ciga-
rettes, presumably through their impact on relative cost. The largest e¤ect is on third-party
purchase. A one-dollar increase in taxes is associated with a 20 percent (0.013/0.065) re-
duction in the probability that 14- through 18-year-olds usually �gave someone else money�
to buy cigarettes. In addition, a one-dollar increase in taxes is associated with a 9 percent
(0.006/0.070) reduction in the probability that they obtained cigarettes through direct pur-
chase.22 There is little evidence in the full sample that taxes are associated with borrowing
or using other sources including vending machines and stealing.
Among 14- and 15-year-olds, taxes appear to work almost entirely through the so-
cial market. A one-dollar increase in the cigarette tax is associated with an 14 percent
(0.010/0.074) reduction in the probability that 14- and 15-year-olds borrowed or �bummed�
cigarettes. It is also associated with an 11 percent (0.007/0.061) reduction in the probability
that they usually obtained their cigarettes through third-party purchase. The estimated
relationship between taxes and direct purchase is small and not statistically signi�cant at
conventional levels. This pattern of results is consistent with the hypothesis that younger
teens were, in e¤ect, squeezed out of the social market as newly imposed cigarette taxes were
passed on to consumers in the form of higher prices.
When we turn our focus to older teenagers, who presumably had greater status or
social capital on which to draw, we �nd almost no evidence that borrowing was negatively
impacted by cigarette taxes. Instead, cigarette taxes appear to work primarily through
third-party and direct purchase. When the sample is restricted to 16-and 17-year-olds, a
one-dollar increase in cigarette taxes is associated with a 22 percent (0.018/0.083) reduction
in the probability of third-party purchase and an 11 percent (0.007/0.061) reduction in the
probability of direct purchase. Among 18-year-olds, who could legally buy cigarettes in all
22The estimated marginal e¤ect of taxes on third-party purchase is di¤erent from the estimated marginale¤ect on direct purchase at the 0.05 level.
14

but a handful of states, cigarette taxes appear to work primarily through direct purchase.23
In Table 5, we examine the robustness of the multinomial logit estimates to control-
ling for anti-smoking sentiment and state-speci�c linear time trends. These results con�rm
that an increase in cigarette taxes is associated with a reduction in the probability of third-
party purchase. However, the estimated relationship between cigarette taxes and borrowing
by 14- and 15-year-olds becomes smaller and statistically indistinguishable from zero at con-
ventional levels when state-speci�c trends are included. Even controlling for state-speci�c
linear trends, there is still strong evidence that cigarette taxes reduce smoking participation
by 18-year-olds primarily through direct purchase.
5.3. Vending machine, stealing and other methods of obtaining cigarettes
A 1993 study by the Texas Department of Public Health found that most vending
machines were unattended, and attempts by underage consumers to purchase cigarettes from
vending machines were almost always successful (Centers for Disease Control and Prevention
1994). During the mid-1990s, a number of states and localities mandated electronic locking
devices on vending machines, increased licensing fees for vending machines, and raised �nes
on businesses that did not monitor vending machines. In March 2006, new federal regulations
required vending machines to be placed within sight of service counters, and a June 2010
Food and Drug Administration regulation restricted vending machine access to locations
where patrons must be at least 18 years of age, such as bars, casinos and strip clubs.
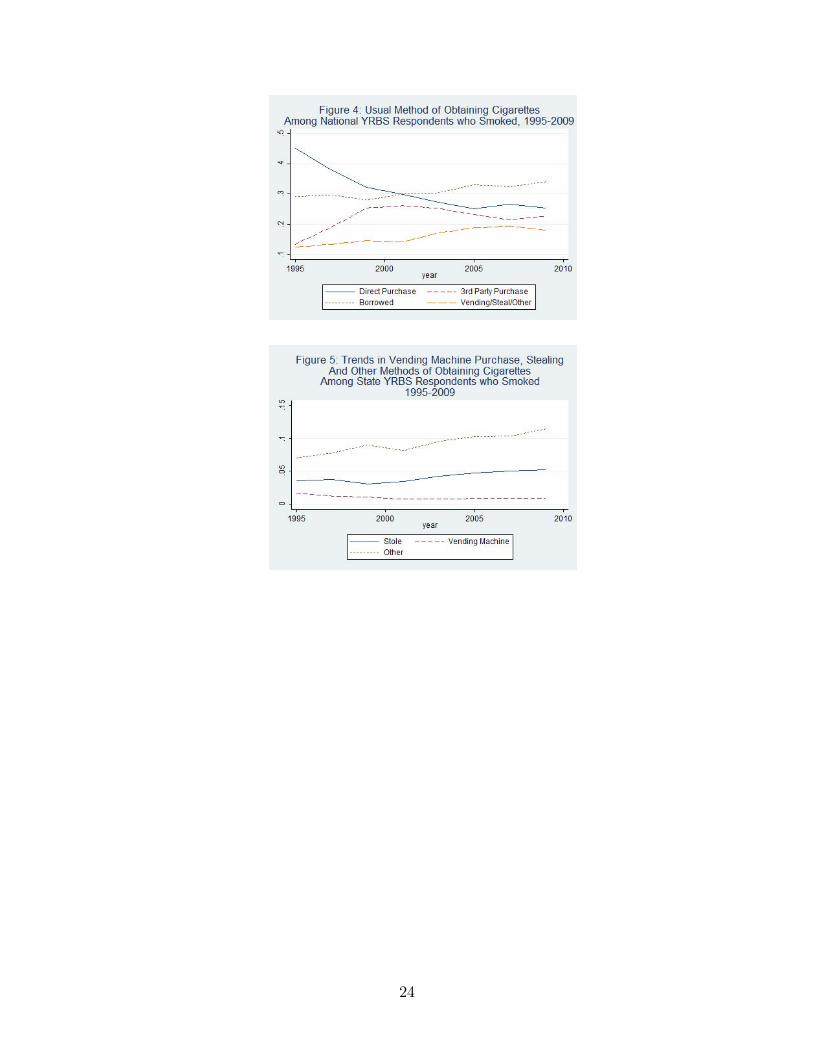
In Figure 5, we show the trend in vending machine use among state YRBS respon-
dents who smoked. With the introduction of the new restrictions described above, reliance
on vending machines appears to have declined (although it was never particularly high). In
1995, two percent of state YRBS respondents who smoked usually obtained their cigarettes
23The multinomial logit estimates suggest that a one-dollar increase in cigarette taxes is associated witha 0.034 reduction in the probability of smoking participation among 18-year-olds. A one-dollar increasein the cigarette tax is also associated with small, statistically insigni�cant increases in the probability ofborrowing and the probability of obtaining cigarettes through vending machine purchase, stealing or othermeans, but a 0.038 reduction in the probability of direct purchase and a 0.008 reduction in the probabilityof third-party purchase.
15
via vending machine purchase; by 2009, a little over one percent obtained their cigarettes
via vending machine purchase.
In contrast, reliance on other methods to obtain cigarettes increased during the 1995-
2009 period, perhaps due to internet sales (on which the state tax is e¤ectively zero).24 In
1995, 7 percent of state YRBS respondents who smoked reported usually using �some other
way� to obtain their cigarettes; by 2009, 11 percent belonged to this category (Figure 5).
There was also an increase in stealing. In 1995, 4 percent of state YRBS respondents who
smoked reported that they usually �took them from a store or family member�; by 2009, 5
percent reported stealing their cigarettes (Figure 5).
Could these trends have been, at least in part, the result of state cigarette tax
increases taking place between 1995 and 2009? In an e¤ort to answer this question, we esti-
mate two variations on our original multinomial logit model: in the �rst, stealing cigarettes
is treated as a separate category; in the second, obtaining cigarettes �some other way� is
treated as a separate category (the baseline category is, in both models, composed of state
YRBS respondents who did not smoke).25
The results of these experiments are reported in Tables 6 and 7. When stealing is
treated as a separate category, there is evidence that its use is negatively related to taxes,
suggesting that the increase in stealing over the period 1995-2009 was due to another factor.
However, when �some other way� is treated as a separate category, there is evidence that
its use by 18-year-olds is positively related to taxes, a result that is consistent with the fact
that 18-year-olds have fewer obstacles to buying online than their younger peers.26
24According to Goolsbee, Lovenheim and Slemrod (2010), although legally required to pay state cigarettetaxes, online buyers rarely comply with this requirement. Data with regard to the volume of online cigarettesales are nonexistent, but �[v]irtually all expert observers agree...that online cigarette sales have been growingvery rapidly in the last several years�(Goolsbee, Lovenheim, and Slemrod 2010, p.135).
25There were too few respondents who reported that they usually obtained their cigarettes from vendingmachines to constitute a separate category.
26Although cigarette retailers are required to verify the age of their customers, internet vendors often failto comply with this requirement. Nonetheless, internet sales to minors are still at a low level (Ribisl et al.2007). The results of Goolsbee, Lovenheim and Slemrod (2010) suggest that internet users are particularlysensitive to cigarette taxes.
16
5.4. Conditional estimates
Katzman, Markowitz and McGeary (2007) focused their attention on youth who
had smoked at least once in their lives, arguing that they had demonstrated a preference for
smoking and should therefore be �considered at risk for purchasing cigarettes� (p. 1031).
Forty-four percent of state YRBS respondents reported that they had never experimented
with cigarettes. In Table 8 we report marginal e¤ects based on a sample from which these
respondents were excluded. The results look similar to those reported in Tables 4 and 5:
among 14- through 18-year-old respondents who had smoked at least once in their lives, a
one-dollar increase in the cigarette tax is associated with a statistically signi�cant reduction
in third-party purchase; among 14- and 15 year-olds who had smoked at least once, it is
associated with an 8 percent (0.013/0.154) reduction in the probability of borrowing, but
this estimate is not signi�cant at conventional levels; and among 18-year-olds who smoked
at least once, it is associated with a 30 percent (0.008/0.027) increase in the probability of
obtaining cigarettes through other means including vending machines and stealing.27
Next, we focus on frequent and everyday smokers, who may have more social capital
on which to draw as compared to lighter smokers. Tables 9 and 10 present multinomial
estimates of the relationship between taxes and how frequent and everyday smokers obtain
their cigarettes. The baseline category is composed of frequent/everyday smokers who re-
ported usually obtaining cigarettes though direct purchase. We note that caution should be
exercised when interpreting the estimates presented in Tables 9 and 10. Because we do not
have longitudinal data, we cannot explore changes in the behavior of frequent and everyday
smokers in response to tax increases. Rather, we are limited to examining a select group
of frequent/everyday smokers who were arguably more committed to their habit than those
who quit or reduced their smoking intensity as taxes went up.
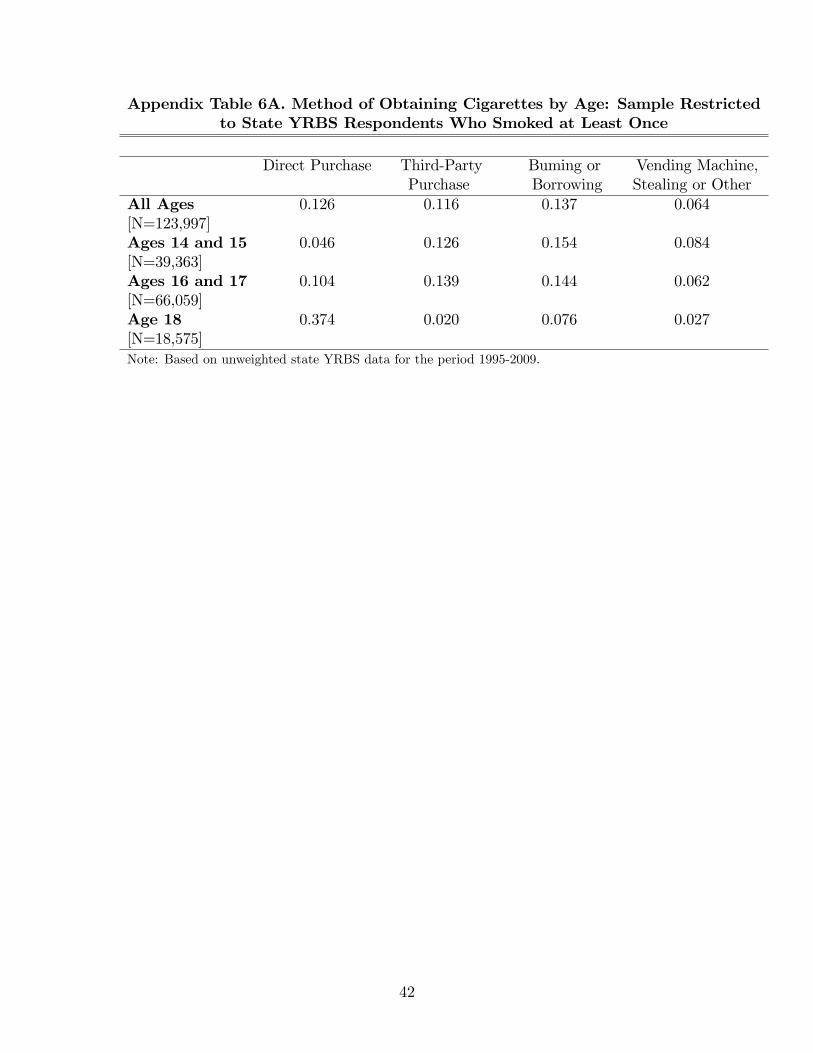
The results in Table 9 provide little evidence of a relationship between taxes and how
27Appendix Table 6A shows where state YRBS respondents who smoked at least once in their lives usuallyobtained their cigarettes.
17
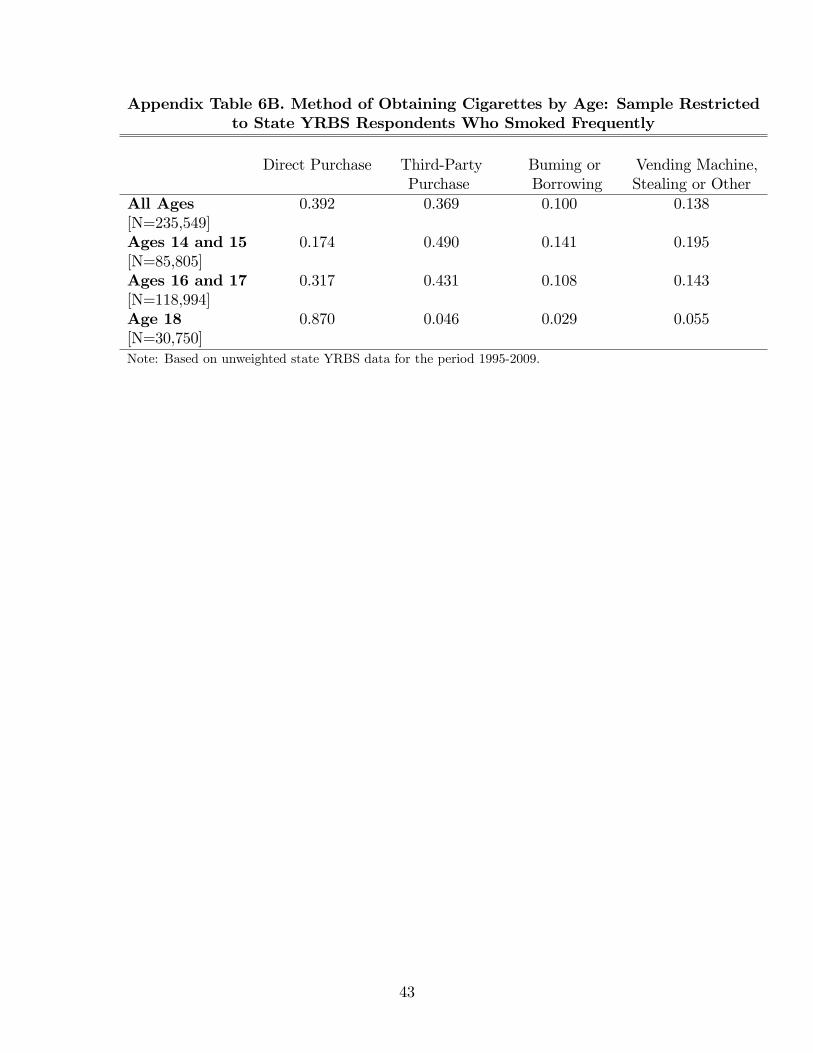
frequent smokers between the ages of 14 and 15 usually obtain their cigarettes.28 However,
when the sample is restricted to 16- and 17-year-old frequent smokers, a one-dollar increase
in cigarette taxes is associated with an 8 percent (0.035/0.431) reduction in the probability of
third-party purchase, but a 7 percent (0.023/0.317) increase in the probability of direct pur-
chase.29 This pattern of results suggests that some frequent smokers, perhaps those without
su¢ cient social capital, actually turn to direct purchase from a commercial establishment
as the per-pack price of cigarettes rises. Direct purchase would be a natural alternative to
third-party purchase for teenagers who, for instance, lacked friends or acquaintances able
to legally purchase and then resell cigarettes. Among 18-year-old frequent smokers, a one-
dollar increase in cigarette taxes is associated with a 39 percent (0.018/0.046) reduction in
the probability of third-party purchase.
The focus of Table 10 is on respondents who reported smoking everyday for the past
month.30 Among everyday smokers ages 14 through 18, we �nd that a one-dollar increase in
cigarette taxes is associated with a 10 percent (0.036/0.357) reduction in the probability of
third-party purchase. When the sample is restricted to 16- and 17-year-old everyday smokers,
a one-dollar increase in the cigarette tax is associated with an 11 percent (0.046/0.423)
reduction in the probability of third-party purchase, but an 11 percent (0.035/0.332) increase
in the probability of direct purchase.31 Interestingly, when the sample is restricted to 18-
year-old daily smokers, who presumably had the most social capital on which to draw of
any group in our sample, a one-dollar increase in the cigarette tax is associated with a 71
percent (0.017/0.024) increase in the probability of borrowing. In addition, a one-dollar
increase in the cigarette tax is associated with a 31 percent (0.019/0.061) increase in the
28Although the results in Table 9 suggest that younger frequent smokers were less sensitive to taxes thantheir older counterparts, we cannot formally reject the hypothesis that our estimated e¤ects are equal acrossthe three age groups.
29Appendix Table 6B shows where state YRBS respondents who smoked frequently usually obtained theircigarettes. The estimated relationship between taxes and direct purchase by 16- and 17-year-old frequentsmokers is statistically signi�cant at the 0.05 level (standard error = 0.008).
30Appendix Table 6C shows where state YRBS respondents who smoked everyday usually obtained theircigarettes.
31The estimated relationship between taxes and direct purchase by 16- and 17-year-old everyday smokersis statistically signi�cant at the 0.05 level (standard error = 0.017).
18

probability that 18-year-old everyday smokers usually obtained cigarettes through other
sources including vending machines and stealing.32
6. CONCLUSION
Carpenter and Cook (2008) noted that most high school students obtain their
cigarettes from social sources and are therefore, at least to some degree, insulated from
increases in the price charged by commercial establishments. Nevertheless, their results
suggest that recent cigarette tax increases have had the e¤ect of reducing youth smoking
participation. Carpenter and Cook (2008) speculated that �[a]n increase in cigarette taxes
may make potential sources more reluctant to provide youths with cigarettes�(p. 298), but
acknowledged that, without better data, it was impossible to pinpoint the mechanism (or
mechanisms) through which tax increases led to reduced smoking participation.
The goal of this study was to look inside this �black box�by exploring the impact of
cigarette taxes on the social market using state YRBS data for the period 1995-2009 . Did
tax increases encourage participation in the social market or did they dampen borrowing
and/or third-party purchases? If increases in the cigarette excise tax are not an e¤ective
means of reducing social market participation, it would argue for the development of policies
aimed speci�cally at discouraging adolescents from borrowing, stealing, and buying from
friends, family and strangers (Friend et al. 2001; Katzman, Markowitz and McGeary 2007).
Exploiting recent and sizeable increases in state excise taxes on cigarettes, we �nd
evidence that teenagers respond to having to pay more to smoke by reducing their reliance
on third-party purchases, an important component of the social market. In fact, it appears
that tax increases taking place between 1995 and 2009 reduced youth smoking participation
primarily through third-party purchases.
32See Appendix Tables 7-10 for conditional estimates in which �some other way�and stealing are treatedas separate categories. Among 18-year-old frequent and everyday smokers, we �nd that taxes are positivelyrelated to using �some other way�to obtain cigarettes. We �nd no evidence that sealing by frequent andeveryday smokers is related to taxes.
19
Among 14- through 15-year-olds, we �nd that cigarette taxes are negatively associ-
ated with borrowing, a result that suggests that some younger smokers do not have su¢ cient
status or social capital to participate in the social market: as cigarette taxes are passed on
to consumers in the form of higher prices, they appear increasingly likely to encounter dif-
�culties borrowing. In contrast, we �nd that tax increases have little e¤ect on borrowing
by older teenagers, but are associated with a small reduction in the probability that 16-
and 17-year-olds directly purchase cigarettes from a commercial establishment, and a larger
reduction in the probability that 18-year-olds directly purchase their cigarettes. Finally, we
�nd evidence that taxes are positively related to the probability that 18-year-olds use �some
other way�to buy their cigarettes, a result that is consistent with the fact that 18-year-olds
have fewer obstacles to buying online than their younger peers.
References
[1] Bertrand, Marianne, Esther Du�o, and Sendhil Mullainathan. 2004. �How Much ShouldWe Trust Di¤erences-in-Di¤erences Estimates?�Quarterly Journal of Economics, Vol.119, No. 1, pp. 249-75.
[2] Barnett, Paul G., Theodore E. Keeler, and Teh-wei Hu. 1995. �Oligopoly Structure andthe Incidence of Cigarette Excise Taxes.�Journal of Public Economics, Vol. 57, No. 3,pp. 457-70
[3] Bishai, David M., Dan Mercer, and Athena Tapales. 2005. �Can Government PoliciesHelp Adolescents Avoid Risky Behavior?� Preventive Medicine, Vol. 40, No. 2, pp.197-202.
[4] Bourdieu, Pierre. 1986. �The Forms of Capital.� In, J. Richardson (ed.), Handbook ofTheory and Research for the Sociology of Education. New York: Greenwood, pp. 241-58.
[5] Brown, Timothy T., Richard M. Sche er, Sukyong Seo, and Mary Reed. 2006. �TheEmpirical Relationship between Community Social Capital and the Demand for Ciga-rettes.�Health Economics, Vol. 15, No. 11, pp. 1159-72.
[6] Carpenter, Christopher, and Philip J. Cook. 2007. �Cigarette Taxes and Youth Smoking:New Evidence from National, State, and Local Youth Risk Behavior Surveys.�Work-ing paper available at: http://web.gsm.uci.edu/~kittc/Carpenter-Cook-JHE-Cigarette-Taxes-Youth-Smoking-YRBS.pdf
20

[7] Carpenter, Christopher, and Philip J. Cook. 2008. �Cigarette Taxes and Youth Smoking:New Evidence from National, State, and Local Youth Risk Behavior Surveys.�Journalof Health Economics, Vol. 27, No. 2, pp. 287-99.
[8] Centers for Disease Control and Prevention. 1994. �Minors�Access to Cigarette VendingMachines �Texas.�Morbidity and Mortality Weekly Report, Vol. 43, No. 34, pp. 625-627.
[9] Chaloupka, Frank, and Michael Grossman. 1996. �Price, Tobacco Control Policies, andYouth Smoking.�NBER Working Paper No. 5740.
[10] Croghan, Emma, Aveyard, P., Gri¢ n, C., and Cheng, K.K. 2003. �The Importance ofSocial Sources of Cigarettes to High School Students.�Tobacco Control, Vol. 12, No. 1,pp. 67�73.
[11] Coleman, James S. 1988. �Social Capital in the Creation of Human Capital.� TheAmerican Journal of Sociology, Vol. 94, Supplement: Organizations and Institutions:Sociological and Economic Approaches to the Analysis of Social Structure, pp. S95-S120.
[12] DeCicca, Philip, Donald Kenkel, and Alan Mathios. 2002. �Putting Out the Fires: WillHigher Taxes Reduce the Onset of Youth Smoking?�Journal of Political Economy, Vol.110, No. 1, pp. 144-69.
[13] DeCicca, Philip, Donald Kenkel, and Alan Mathios. 2008. �Cigarette Taxes and theTransition from Youth to Adult Smoking: Smoking Initiation, Cessation, and Partici-pation.�Journal of Health Economics, Vol. 27, No. 4, pp. 904-17.
[14] Decicca, Philip, Donald Kenkel, Alan Mathios, Yoon-Jeong Shin, and Jae-Young Lim.2008. �Youth Smoking, Cigarette Prices, and Anti-Smoking Sentiment.�Health Eco-nomics, Vol. 17, No. 6, pp.733-41.
[15] Decicca, Philip, Donald Kenkel, and Feng Liu. 2010 �Who Pays Ciga-rette Taxes? The Impact of Consumer Price Search.� Working paper avail-able at: http://www.economics.mcmaster.ca/documents/Who-20Pays-20Cigarette-20Taxes_March-202010.pdf
[16] Evans, William N., Jeanne S. Ringel, and Diana Stech. 1999. �Tobacco Taxes and PublicPolicy to Discourage Smoking.�Tax Policy and the Economy, Vol. 13, pp. 1-55.
[17] Forster, J., Chen, V., Blaine, T., Perry, C., and Toomey, T. 2003. �Social Exchange ofCigarettes by Youth.�Tobacco Control, Vol. 12, No 2, pp. 148�54.
[18] Franz, Gregor A. 2008. �Price E¤ects on the Smoking Behaviour of Adult Age Groups.�Public Health, Vol. 122, No. 12, pp.1343-48.
[19] Friend, Karen, Maria Carmona, Philip Wilbur, and David Levy. 2001. �Youths�So-cial Sources of Cigarettes: the Limits of Youth-Access Policies.�Contemporary DrugProblems, Vol. 28, pp. 507�26.
21
[20] Goolsbee, Austan, Michael F. Lovenheim, and Joel Slemrod. 2010. �Playing with Fire:Cigarettes, Taxes, and Competition from the Internet.�American Economic Journal:Economic Policy, Vol. 2, No. 1, pp. 131�54.
[21] Green, William. 2004. �The Behaviour of the Maximum Likelihood Estimator of Lim-ited Dependent Variable Models in the Presence of Fixed E¤ects.�The EconometricsJournal, Vol. 7, No.1, pp. 98-119.
[22] Gruber, Jonathan and Jonathan Zinman. 2001. �Youth Smoking in the United States:Evidence and Implications.� In: J. Gruber, (ed.), Risky Behavior Among Youths: AnEconomic Analysis. University of Chicago Press: Chicago, pp. 69�120.
[23] Harris, Je¤rey E., and Sandra W. Chan. 1998. �The Continuum-of-Addiction: CigaretteSmoking in Relation to Price among Americans Aged 15�29.�Health Economics Letters,Vol. 2, No. 2, pp. 3�12.
[24] Katzman, Brett, Sara Markowitz, and Kerry Anne McGeary. 2007.�An Empirical In-vestigation of the Social Market for Cigarettes.�Health Economics, Vol. 16, No. 10, pp.1025�39.
[25] Lancaster, Tony. 2000. �The Incidental Parameter Problem since 1948.� Journal ofEconometrics, Vol. 94, No. 2, 391-413.
[26] Lindström, Martin. 2003. �Social Capital and the Miniaturization of Community amongDaily and Intermittent Smokers: a Population-Based Study.�Preventive Medicine, Vol.36, No. 2, pp. 177-84.
[27] Neyman, J., Scott, Elizabeth.L., 1948. �Consistent Estimation from Partially ConsistentObservations.�Econometrica, Vol 16, No. 1, pp. 1-32.
[28] Orzechowski, William and Robert Walker. 2009. The Tax Burden on Tobacco: HistoricalCompilation, Vol. 43, Arlington, VA.
[29] Ribisl, Kurt M. 2003. �Social Sources of Cigarettes for Youth: Broadening the ResearchBase.�Tobacco Control, Vol. 12, No. 2, pp. 115-16.
[30] Ribisl, Kurt M., Rebecca S. Williams, Annice E. Kim. 2007. Policy Brief on: In-ternet Cigarette Sales. Substance Abuse Policy Research Program. Available at:http://www.saprp.org/knowledgeassets/pdf/InternetCigSales_PolicyBriefReport.pdf
[31] Sullivan, Ryan and Andrew Hanson. 2009. �The Incidence of Tobacco Taxation: Evi-dence from Geographic Micro-Level Data.�The National Tax Journal, Vol. 62, No. 4,pp. 677-98.
[32] Woolcock, Michael and Deepa Narayan. 2000. �Social Capital: Implications for Devel-opment Theory, Research, and Policy.�The World Bank Research Observer, Vol. 15,No. 2, pp. 225-49.
22
23
24

Table 1A. Smoking Behavior by Age of State YRBS Respondent
Participation Frequent Smoking Everyday SmokingAll Ages 0.246 0.120 0.088[N=235,549]Ages 14 and 15 0.196 0.077 0.054[N=85,805]Ages 16 and 17 0.263 0.130 0.099[N=118,994]Age 18 0.319 0.177 0.141[N=30,750]Note: Based on unweighted state YRBS data for the period 1995-2009.
Table 1B. Smoking Behavior by Age of National YRBS Respondent
Participation Frequent Smoking Everyday SmokingAll Ages 0.272 0.121 0.091[N=102,609]Ages 14 and 15 0.212 0.074 0.053[N=32,217]Ages 16 and 17 0.291 0.136 0.102[N=53,473]Age 18 0.354 0.185 0.146[N=16,919]Note: Based on weighted national YRBS data for the period 1995-2009.
25

Table 1C. Method of Obtaining Cigarettes by Age of State YRBS Respondent
Direct Purchase Third-Party Buming or Vending Machine,Purchase Borrowing Stealing or Other
All Ages 0.070 0.065 0.076 0.036[N=235,549]Ages 14 and 15 0.022 0.061 0.074 0.041[N=85,805]Ages 16 and 17 0.061 0.083 0.084 0.036[N=118,994]Age 18 0.241 0.013 0.049 0.017[N=30,750]Note: Based on unweighted state YRBS data for the period 1995-2009.
26
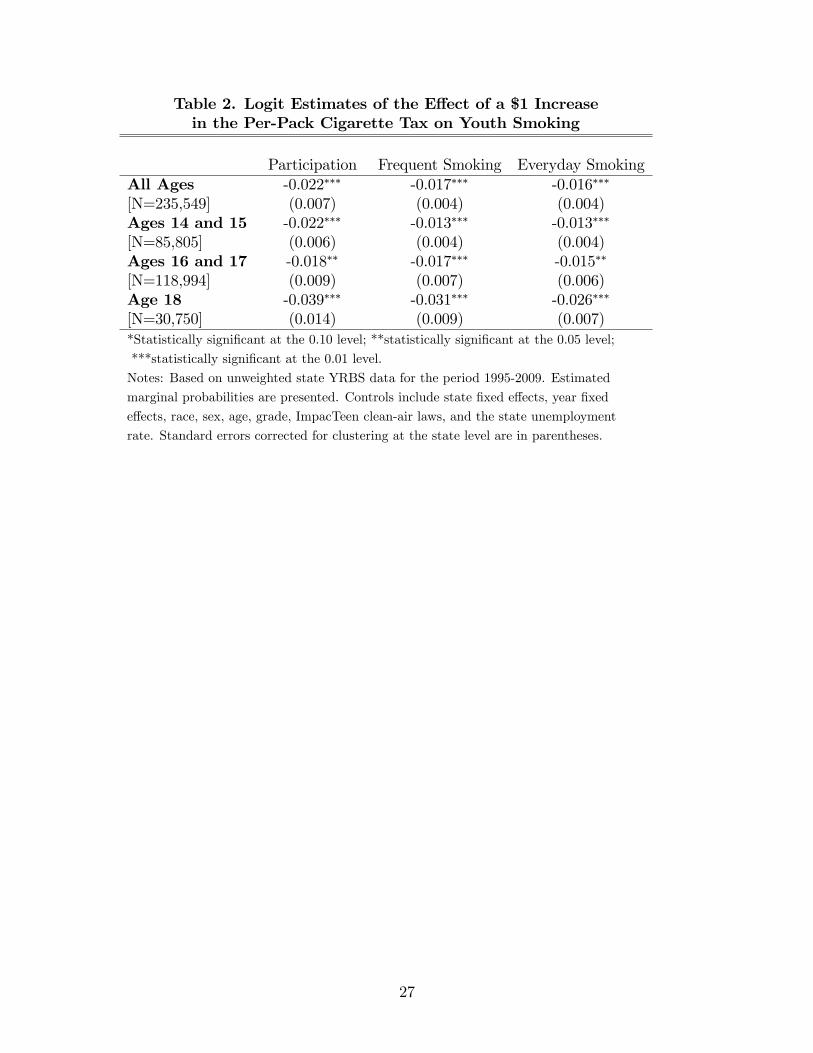
Table 2. Logit Estimates of the E¤ect of a $1 Increasein the Per-Pack Cigarette Tax on Youth Smoking
Participation Frequent Smoking Everyday SmokingAll Ages -0.022��� -0.017��� -0.016���
[N=235,549] (0.007) (0.004) (0.004)Ages 14 and 15 -0.022��� -0.013��� -0.013���
[N=85,805] (0.006) (0.004) (0.004)Ages 16 and 17 -0.018�� -0.017��� -0.015��
[N=118,994] (0.009) (0.007) (0.006)Age 18 -0.039��� -0.031��� -0.026���
[N=30,750] (0.014) (0.009) (0.007)*Statistically signi�cant at the 0.10 level; **statistically signi�cant at the 0.05 level;
***statistically signi�cant at the 0.01 level.
Notes: Based on unweighted state YRBS data for the period 1995-2009. Estimated
marginal probabilities are presented. Controls include state �xed e¤ects, year �xed
e¤ects, race, sex, age, grade, ImpacTeen clean-air laws, and the state unemployment
rate. Standard errors corrected for clustering at the state level are in parentheses.
27

Table 3. Logit Estimates of the E¤ect of a $1 Increasein the Per-Pack Cigarette Tax on Youth Smoking
Panel I: Controlling for Anti-Smoking SentimentParticipation Frequent Smoking Everyday Smoking
All Ages -0.021��� -0.017��� -0.015���
[N=235,549] (0.007) (0.005) (0.004)Ages 14 and 15 -0.021��� -0.012��� -0.013��
[N=85,805] (0.006) (0.004) (0.004)Ages 16 and 17 -0.019�� -0.017��� -0.016��
[N=118,994] (0.006) (0.006) (0.006)Age 18 -0.034�� -0.027�� -0.022���
[N=30,750] (0.014) (0.010) (0.008)
Panel II: Controlling for State-Speci�c Linear Time TrendsAll Ages -0.027�� -0.023��� -0.022���
[N=235,549] (0.008) (0.006) (0.006)Ages 14 and 15 -0.018�� -0.013� -0.016�
[N=85,805] (0.008) (0.007) (0.009)Ages 16 and 17 -0.029�� -0.023��� -0.022��
[N=118,994] (0.012) (0.006) (0.005)Age 18 -0.046��� -0.051��� -0.039���
[N=30,750] (0.014) (0.013) (0.009)*Statistically signi�cant at the 0.10 level; **statistically signi�cant at the 0.05 level;
***statistically signi�cant at the 0.01 level.
Notes: Based on unweighted state YRBS data for the period 1995-2009. Estimated
marginal probabilities are presented. Controls include state �xed e¤ects, year �xed
e¤ects, race, sex, age, grade, ImpacTeen clean-air laws, and the state unemployment
rate. Standard errors corrected for clustering at the state level are in parentheses.
28
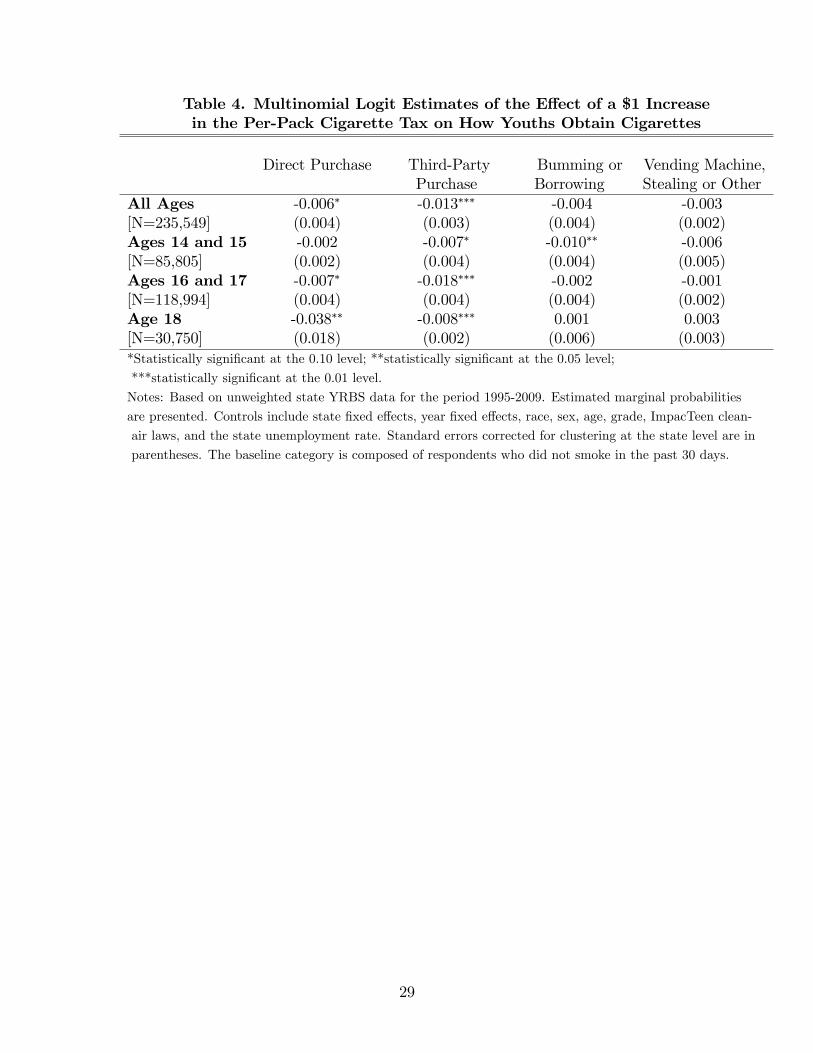
Table 4. Multinomial Logit Estimates of the E¤ect of a $1 Increasein the Per-Pack Cigarette Tax on How Youths Obtain Cigarettes
Direct Purchase Third-Party Bumming or Vending Machine,Purchase Borrowing Stealing or Other
All Ages -0.006� -0.013��� -0.004 -0.003[N=235,549] (0.004) (0.003) (0.004) (0.002)Ages 14 and 15 -0.002 -0.007� -0.010�� -0.006[N=85,805] (0.002) (0.004) (0.004) (0.005)Ages 16 and 17 -0.007� -0.018��� -0.002 -0.001[N=118,994] (0.004) (0.004) (0.004) (0.002)Age 18 -0.038�� -0.008��� 0.001 0.003[N=30,750] (0.018) (0.002) (0.006) (0.003)*Statistically signi�cant at the 0.10 level; **statistically signi�cant at the 0.05 level;
***statistically signi�cant at the 0.01 level.
Notes: Based on unweighted state YRBS data for the period 1995-2009. Estimated marginal probabilities
are presented. Controls include state �xed e¤ects, year �xed e¤ects, race, sex, age, grade, ImpacTeen clean-
air laws, and the state unemployment rate. Standard errors corrected for clustering at the state level are in
parentheses. The baseline category is composed of respondents who did not smoke in the past 30 days.
29
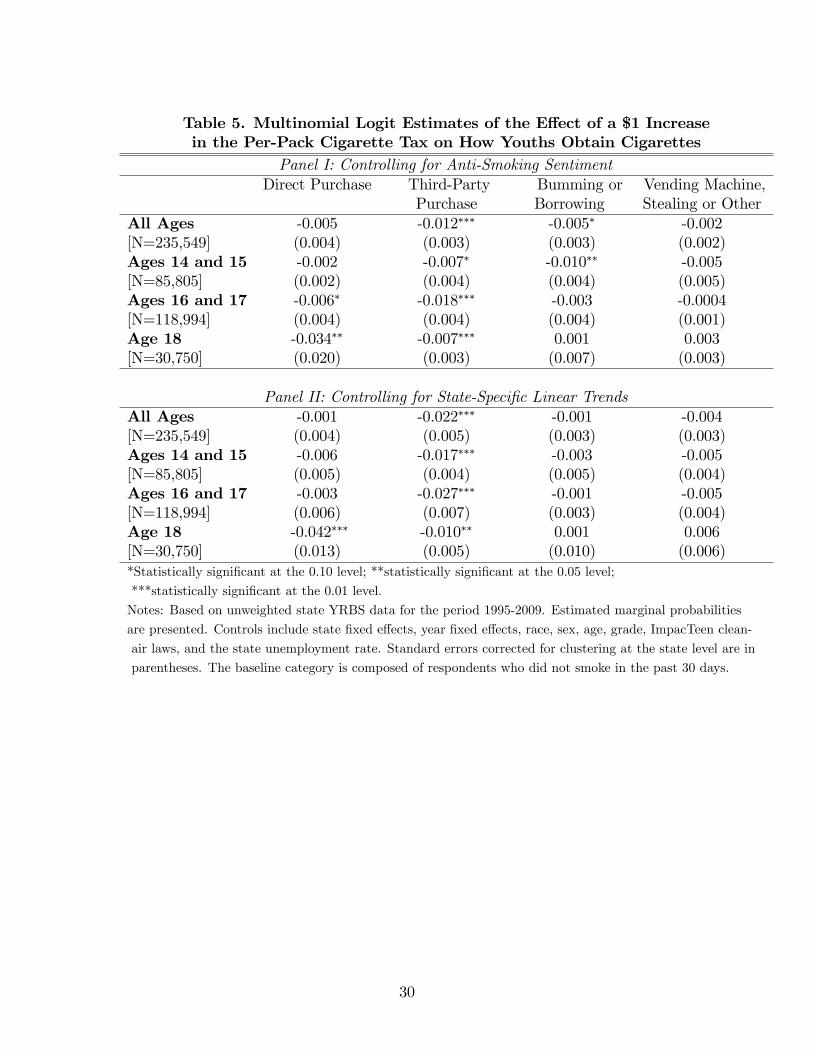
Table 5. Multinomial Logit Estimates of the E¤ect of a $1 Increasein the Per-Pack Cigarette Tax on How Youths Obtain Cigarettes
Panel I: Controlling for Anti-Smoking SentimentDirect Purchase Third-Party Bumming or Vending Machine,
Purchase Borrowing Stealing or OtherAll Ages -0.005 -0.012��� -0.005� -0.002[N=235,549] (0.004) (0.003) (0.003) (0.002)Ages 14 and 15 -0.002 -0.007� -0.010�� -0.005[N=85,805] (0.002) (0.004) (0.004) (0.005)Ages 16 and 17 -0.006� -0.018��� -0.003 -0.0004[N=118,994] (0.004) (0.004) (0.004) (0.001)Age 18 -0.034�� -0.007��� 0.001 0.003[N=30,750] (0.020) (0.003) (0.007) (0.003)
Panel II: Controlling for State-Speci�c Linear TrendsAll Ages -0.001 -0.022��� -0.001 -0.004[N=235,549] (0.004) (0.005) (0.003) (0.003)Ages 14 and 15 -0.006 -0.017��� -0.003 -0.005[N=85,805] (0.005) (0.004) (0.005) (0.004)Ages 16 and 17 -0.003 -0.027��� -0.001 -0.005[N=118,994] (0.006) (0.007) (0.003) (0.004)Age 18 -0.042��� -0.010�� 0.001 0.006[N=30,750] (0.013) (0.005) (0.010) (0.006)*Statistically signi�cant at the 0.10 level; **statistically signi�cant at the 0.05 level;
***statistically signi�cant at the 0.01 level.
Notes: Based on unweighted state YRBS data for the period 1995-2009. Estimated marginal probabilities
are presented. Controls include state �xed e¤ects, year �xed e¤ects, race, sex, age, grade, ImpacTeen clean-
air laws, and the state unemployment rate. Standard errors corrected for clustering at the state level are in
parentheses. The baseline category is composed of respondents who did not smoke in the past 30 days.
30

Table 6. Multinomial Logit Estimates of the E¤ect of a $1 Increase in the Per-PackCigarette Tax on How Youths Obtain Cigarettes: Stealing as a Separate Category
Direct PurchaseThird-PartyPurchase
Bumming orBorrowing
StealingVending Machine/Other Source
All Ages -0.005 -0.012��� -0.005� -0.0013� -0.001[235,549] (0.004) (0.003) (0.003) (0.00074) (0.001)Age 14 to 15 -0.002 -0.007� -0.010�� -0.002 -0.003[85,805] (0.002) (0.004) (0.004) (0.002) (0.004)Age 16 to 17 -0.006 -0.018��� -0.003 0.000 -0.0004[118,994] (0.004) (0.004) (0.004) (0.001) (0.001)Age 18 -0.034� -0.007��� 0.001 -0.001 0.004�
[30,750] (0.019) (0.003) (0.007) (0.002) (0.002)*Statistically signi�cant at the 0.10 level; **statistically signi�cant at the 0.05 level;
***statistically signi�cant at the 0.01 level.
Notes: Based on unweighted state YRBS data for the period 1995-2009. Estimated marginal probabilities are
presented. Controls include state �xed e¤ects, year �xed e¤ects, race, sex, age, grade, ImpacTeen clean-air laws,
and the state unemployment rate. The baseline category is composed of respondents who did not smoke in the
past 30 days.
31
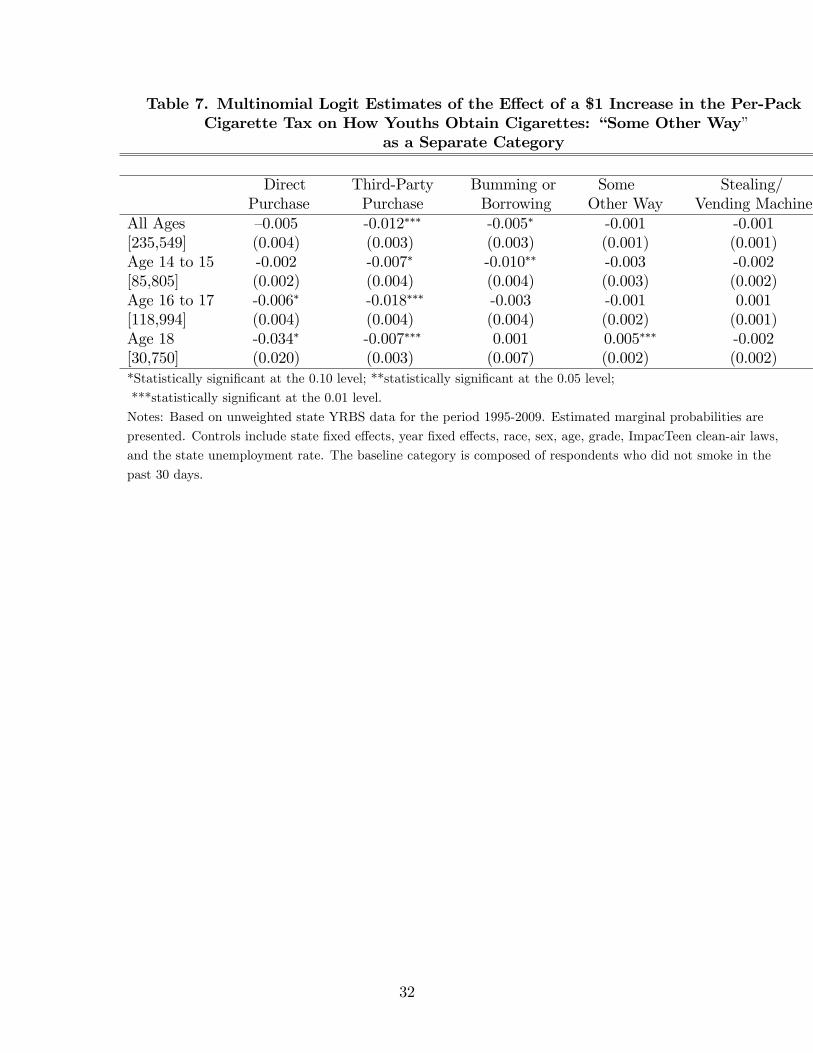
Table 7. Multinomial Logit Estimates of the E¤ect of a $1 Increase in the Per-PackCigarette Tax on How Youths Obtain Cigarettes: �Some Other Way�
as a Separate Category
DirectPurchase
Third-PartyPurchase
Bumming orBorrowing
SomeOther Way
Stealing/Vending Machine
All Ages �0.005 -0.012��� -0.005� -0.001 -0.001[235,549] (0.004) (0.003) (0.003) (0.001) (0.001)Age 14 to 15 -0.002 -0.007� -0.010�� -0.003 -0.002[85,805] (0.002) (0.004) (0.004) (0.003) (0.002)Age 16 to 17 -0.006� -0.018��� -0.003 -0.001 0.001[118,994] (0.004) (0.004) (0.004) (0.002) (0.001)Age 18 -0.034� -0.007��� 0.001 0.005��� -0.002[30,750] (0.020) (0.003) (0.007) (0.002) (0.002)*Statistically signi�cant at the 0.10 level; **statistically signi�cant at the 0.05 level;
***statistically signi�cant at the 0.01 level.
Notes: Based on unweighted state YRBS data for the period 1995-2009. Estimated marginal probabilities are
presented. Controls include state �xed e¤ects, year �xed e¤ects, race, sex, age, grade, ImpacTeen clean-air laws,
and the state unemployment rate. The baseline category is composed of respondents who did not smoke in the
past 30 days.
32
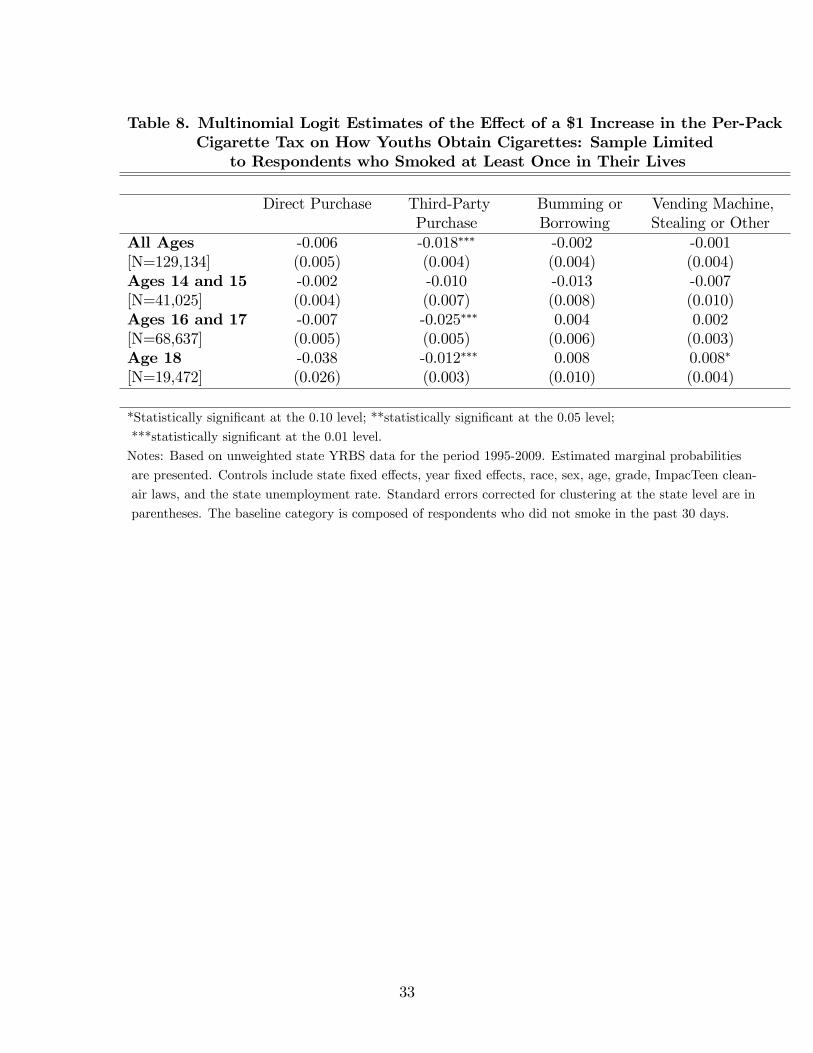
Table 8. Multinomial Logit Estimates of the E¤ect of a $1 Increase in the Per-PackCigarette Tax on How Youths Obtain Cigarettes: Sample Limited
to Respondents who Smoked at Least Once in Their Lives
Direct Purchase Third-Party Bumming or Vending Machine,Purchase Borrowing Stealing or Other
All Ages -0.006 -0.018��� -0.002 -0.001[N=129,134] (0.005) (0.004) (0.004) (0.004)Ages 14 and 15 -0.002 -0.010 -0.013 -0.007[N=41,025] (0.004) (0.007) (0.008) (0.010)Ages 16 and 17 -0.007 -0.025��� 0.004 0.002[N=68,637] (0.005) (0.005) (0.006) (0.003)Age 18 -0.038 -0.012��� 0.008 0.008�
[N=19,472] (0.026) (0.003) (0.010) (0.004)
*Statistically signi�cant at the 0.10 level; **statistically signi�cant at the 0.05 level;
***statistically signi�cant at the 0.01 level.
Notes: Based on unweighted state YRBS data for the period 1995-2009. Estimated marginal probabilities
are presented. Controls include state �xed e¤ects, year �xed e¤ects, race, sex, age, grade, ImpacTeen clean-
air laws, and the state unemployment rate. Standard errors corrected for clustering at the state level are in
parentheses. The baseline category is composed of respondents who did not smoke in the past 30 days.
33
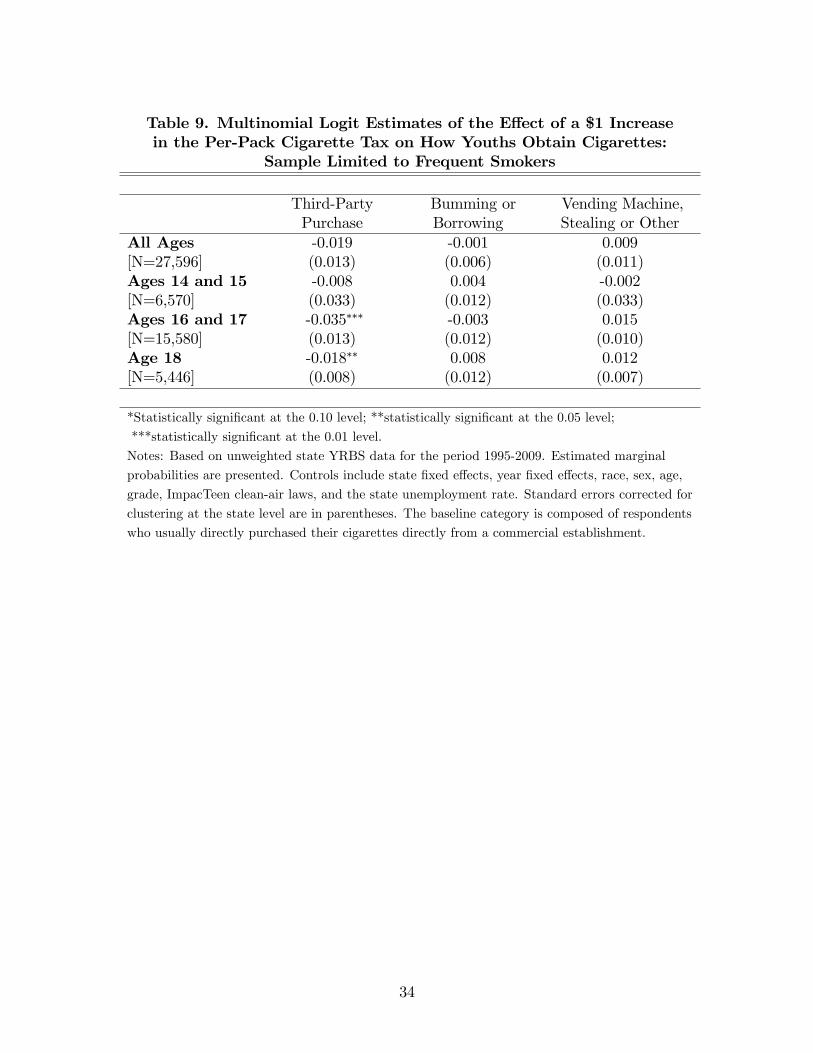
Table 9. Multinomial Logit Estimates of the E¤ect of a $1 Increasein the Per-Pack Cigarette Tax on How Youths Obtain Cigarettes:
Sample Limited to Frequent Smokers
Third-Party Bumming or Vending Machine,Purchase Borrowing Stealing or Other
All Ages -0.019 -0.001 0.009[N=27,596] (0.013) (0.006) (0.011)Ages 14 and 15 -0.008 0.004 -0.002[N=6,570] (0.033) (0.012) (0.033)Ages 16 and 17 -0.035��� -0.003 0.015[N=15,580] (0.013) (0.012) (0.010)Age 18 -0.018�� 0.008 0.012[N=5,446] (0.008) (0.012) (0.007)
*Statistically signi�cant at the 0.10 level; **statistically signi�cant at the 0.05 level;
***statistically signi�cant at the 0.01 level.
Notes: Based on unweighted state YRBS data for the period 1995-2009. Estimated marginal
probabilities are presented. Controls include state �xed e¤ects, year �xed e¤ects, race, sex, age,
grade, ImpacTeen clean-air laws, and the state unemployment rate. Standard errors corrected for
clustering at the state level are in parentheses. The baseline category is composed of respondents
who usually directly purchased their cigarettes directly from a commercial establishment.
34
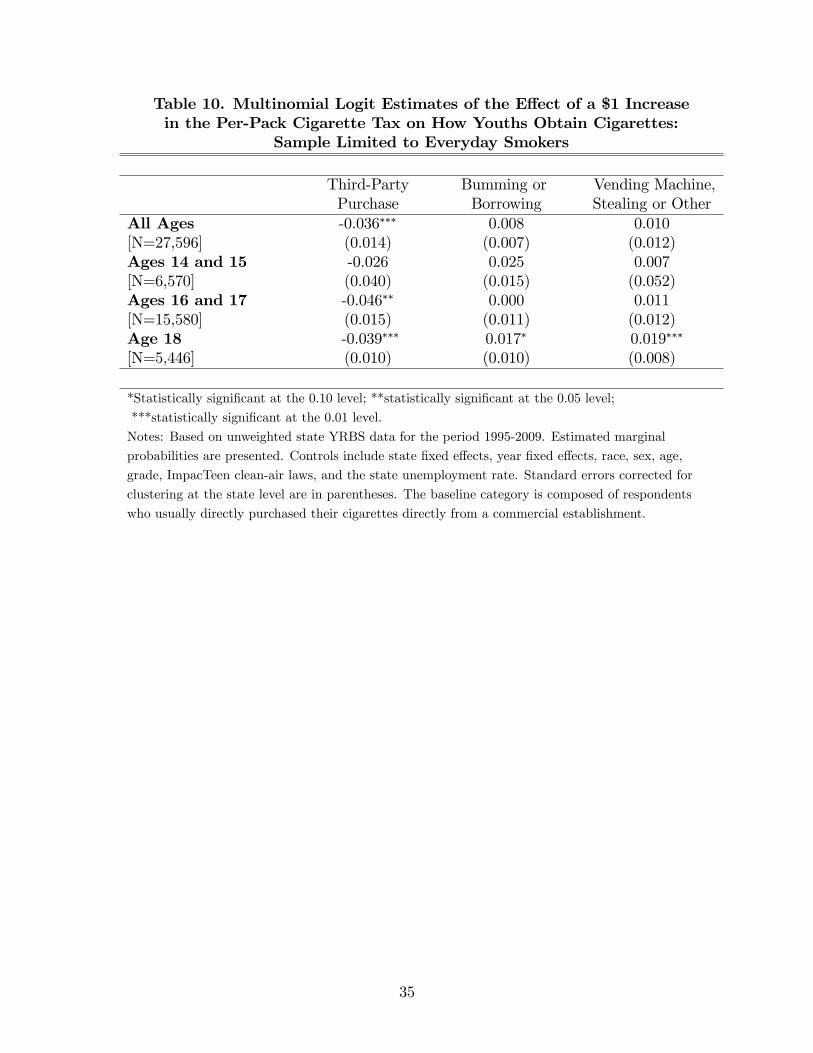
Table 10. Multinomial Logit Estimates of the E¤ect of a $1 Increasein the Per-Pack Cigarette Tax on How Youths Obtain Cigarettes:
Sample Limited to Everyday Smokers
Third-Party Bumming or Vending Machine,Purchase Borrowing Stealing or Other
All Ages -0.036��� 0.008 0.010[N=27,596] (0.014) (0.007) (0.012)Ages 14 and 15 -0.026 0.025 0.007[N=6,570] (0.040) (0.015) (0.052)Ages 16 and 17 -0.046�� 0.000 0.011[N=15,580] (0.015) (0.011) (0.012)Age 18 -0.039��� 0.017� 0.019���
[N=5,446] (0.010) (0.010) (0.008)
*Statistically signi�cant at the 0.10 level; **statistically signi�cant at the 0.05 level;
***statistically signi�cant at the 0.01 level.
Notes: Based on unweighted state YRBS data for the period 1995-2009. Estimated marginal
probabilities are presented. Controls include state �xed e¤ects, year �xed e¤ects, race, sex, age,
grade, ImpacTeen clean-air laws, and the state unemployment rate. Standard errors corrected for
clustering at the state level are in parentheses. The baseline category is composed of respondents
who usually directly purchased their cigarettes directly from a commercial establishment.
35

Appendix Table 1A. Mean Number of Friends who Smoked by Ageand Smoking Behavior of the Add Health Respondent
All Add Health Frequent EverydayRespondents Smokers Smokers Smokers
Ages 14 and 15 0.79 1.68 2.22 2.30(1.05) (1.13) (0.96) (0.94)[ 5,662] [1,352] [ 557] [ 376]
Ages 16 and 17 1.00 1.78 2.18 2.26(1.12) (1.09) (0.92) (0.87)[7,226] [2,141] [1,112] [804]
Age 18 1.12 1.84 2.15 2.21(1.14) (1.11) (1.01) (0.99)[2,771] [914] [520] [413]
Notes: Based on weighted data from Wave I of the National Longitudinal Study of Adolescent Health,collected in 1995. Number of friends who smoked is constructed from answers to the question, �[o]fyour 3 best friends, how many smoke at least 1 cigarette a day?�Standard deviations are in parenthesesand sample sizes are in brackets.
36
Appendix Table 1B. Mean Number of Friends who Smoked by Ageand Years since Add Health Respondent had First Cigarette
1st Cigarette 1st Cigarette 1st Cigarette 1st Cigarettewithin 1 Year 1-2 Years Ago 3-4 Years Ago 5+ Years Ago
Ages 14 and 15 0.96 1.20 1.41 1.64(1.04) (1.18) (1.19) (1.20)[ 321] [ 1,175] [ 461] [ 323]
Ages 16 and 17 1.09 1.24 1.58 1.65(1.03) (1.12) (1.13) (1.18)[277] [1,285] [1,001] [886]
Age 18 1.21 1.47 1.58 1.68(1.07) (1.16) (1.17) (1.15)[73] [436] [356] [495]
Notes: Based on weighted data from Wave I of the National Longitudinal Study of Adolescent Health,collected in 1995. Number of friends who smoked is constructed from answers to the question, �[o]fyour 3 best friends, how many smoke at least 1 cigarette a day?�Standard deviations are in parenthesesand sample sizes are in brackets.
37
Appendix Table 2. Number of Observations by State-Year1995 1997 1999 2001 2003 2005 2007 2009 Total
AK 1,549 � � � 1,376 � 1,201 1,150 5,276AR 2,153 1,868 1,389 1,603 � 1,397 1,456 1,456 11,355AZ � � � � 1,858 1,773 1,542 1,374 5,547CO � � � � � 1,404 � 1,385 2,789DE � � 2,235 2,724 2,805 2,486 2,218 2,113 14,581IA � 1,457 � � � 1,319 1,380 � 4,156ID � � � 1,590 1,616 1,351 1,306 2,015 7,878IL 2,868 � � � � � 2,221 2,696 7,785KS � � � � � 1,563 1,609 1,919 5,091KY � 1,516 � � 1,476 3,026 3,202 1,615 10,835MD � � � � � 1,331 1,375 1,479 4,185ME 1,335 1,752 � 1,235 1,540 1,540 � 7,770 14,878MO 4,618 1,390 1,575 1,574 1,485 1,803 1,452 1,531 15,428MS 1,209 1,396 1,525 1,676 1,403 � 1,445 1,681 10,335MT 2,385 2,427 2,776 2,401 2,489 2,804 3,668 1,700 20,650ND � � 1,713 1,485 1,555 1,622 1,627 1,716 9,718NE � � � � 2,608 3,484 � � 6,092NY � 3,522 3,236 � 8,566 8,879 � � 24,203SC � � 4,234 � � 1,189 1,114 1,001 7,538SD 1,128 1,513 1,587 1,435 1,666 1,470 1,469 1,998 12,266TN � � � � 1,835 1,462 1,939 2,105 7,341UT 3,085 1,327 1,434 1,009 1,330 1,408 1,803 1,493 12,888WI � 1,247 1,267 1,982 1,985 2,249 1,978 � 10,708WV 1,992 1,738 1,372 � 1,642 1,279 1,290 1,483 10,796Note: In order to be included in our analysis, states must have conducted aYRBS, given the CDC permission to distribute the results, asked questionswith regard to how respondents usually obtained their cigarettes, and providedat least two years of data to the CDC.
38
Appendix Table 3. Per-Pack Cigarette Tax for StatesContributing YRBS Data, 1995-2009 (in cents)1995 1997 1999 2001 2003 2005 2007 2009
AK 29 29 100 100 100 160 180 200AR 31.5 31.5 31.5 31.5 59 59 59 115AZ 18 58 58 58 118 118 200 200CO 20 20 20 20 20 84 84 84DE 24 24 24 24 24 55 55 115IA 36 36 36 36 36 36 136 136ID 18 28 28 28 57 57 57 57IL 44 44 58 58 98 98 98 98KS 24 24 24 79 79 79 79 79KY 3 3 3 3 3 30 30 60MD 36 36 66 100 100 100 100 200ME 37 37 74 74 100 100 200 200MO 17 17 17 17 17 17 17 17MS 18 18 18 18 18 18 18 68MT 18 18 18 18 70 170 170 170ND 44 44 44 44 44 44 44 44NE 34 34 34 34 64 64 64 64NY 56 56 56 111 150 150 150 275SC 7 7 7 7 7 7 7 7SD 23 33 33 33 53 53 153 153TN 13 13 13 13 20 20 20 62UT 26.5 26.5 51.5 51.5 69.5 69.5 69.5 69.5WI 38 44 59 59 77 77 77 252WV 17 17 17 17 55 55 55 55Note: Per-pack state cigarette tax obtained from Orzechowski and
Walker (2009).
39
Appendix Table 4. Descriptive Statistics for Selected Independent Variables by Age(standard deviations in parentheses)Full Sample 14 and15 16 and17 18
Cigarette Tax (2005 dollars) 0.693 0.716 0.686 0.657(0.507) (0.515) (0.502) (0.496)
Male 0.495 0.462 0.487 0.374(0.499) (0.498) (0.499) (0.497)
Black 0.127 0.124 0.127 0.139(0.334) (0.329) (0.333) (0.346)
Hispanic 0.086 0.092 0.083 0.082(0.281) (0.289) (0.276) (0.274)
Grade 9 0.289 0.728 0.046 0.005(0.453) (0.444) (0.209) (0.073)
Grade 10 0.271 0.264 0.343 0.011(0.444) (0.441) (0.475) (0.103)
Grade 11 0.244 0.003 0.455 0.103(0.429) (0.050) (0.498) (0.304)
Unemployment Rate 0.062 0.063 (0.062) 0.061(0.019) (0.019) (0.019) (0.020)
Observations 235,549 85,805 118,994 30,750Note: Based on unweighted state YRBS data for the period 1995-2009.
40
Appendix Table 5. Logit Estimates of the Determinants of Smoking ParticipationAll Ages 14 and 15 16 and 17 18
Male -0.004 -0.023��� -0.002 0.036���
(0.004) (0.004) (0.005) (0.007)Black -0.188��� -0.160��� -0.198�� -0.220���
(0.024) (0.024) (0.024) (0.027)Hispanic -0.046��� -0.023 -0.0566��� -0.0796���
(0.015) (0.016) (0.014) (0.022)Grade 9 0.048��� -0.113��� 0.105��� 0.295���
(0.013) (0.023) (0.013) (0.004)Grade 10 0.024��� -0.111��� 0.008 0.148���
(0.008) (0.024) (0.008) (0.026)Grade 11 0.003 0.109��� -0.006 0.036���
(0.004) (0.032) (0.004) (0.009)Age 15 0.053��� 0.042���
(0.005) (0.004)Age 16 0.113���
(0.009)Age 17 0.159��� 0.045���
(0.012) (0.005)Age 18 0.193���
(0.014)Unemp. Rate 0.417��� 0.756��� 0.240 0.095
(0.129) (0.148) (0.173) (0.372)Observations 235,549 85,805 118,994 30,750*Statistically signi�cant at the 0.10 level; **statistically signi�cant at the 0.05 level;
***Statistically signi�cant at the 0.01 level.
Notes: Based on unweighted state YRBS data for the period 1995-2009. Estimated marginal probabilities are
presented. Additional variables include the state per-pack cigarette tax, state �xed e¤ects, year �xed e¤ects, and
ImpacTeen clean-air laws. Standard errors corrected for clustering at the state level are in parentheses.
41
Appendix Table 6A. Method of Obtaining Cigarettes by Age: Sample Restrictedto State YRBS Respondents Who Smoked at Least Once
Direct Purchase Third-Party Buming or Vending Machine,Purchase Borrowing Stealing or Other
All Ages 0.126 0.116 0.137 0.064[N=123,997]Ages 14 and 15 0.046 0.126 0.154 0.084[N=39,363]Ages 16 and 17 0.104 0.139 0.144 0.062[N=66,059]Age 18 0.374 0.020 0.076 0.027[N=18,575]Note: Based on unweighted state YRBS data for the period 1995-2009.
42
Appendix Table 6B. Method of Obtaining Cigarettes by Age: Sample Restrictedto State YRBS Respondents Who Smoked Frequently
Direct Purchase Third-Party Buming or Vending Machine,Purchase Borrowing Stealing or Other
All Ages 0.392 0.369 0.100 0.138[N=235,549]Ages 14 and 15 0.174 0.490 0.141 0.195[N=85,805]Ages 16 and 17 0.317 0.431 0.108 0.143[N=118,994]Age 18 0.870 0.046 0.029 0.055[N=30,750]Note: Based on unweighted state YRBS data for the period 1995-2009.
43

Appendix Table 6C. Method of Obtaining Cigarettes by Age: Sample Restrictedto State YRBS Respondents Who Smoked Everyday
Direct Purchase Third-Party Buming or Vending Machine,Purchase Borrowing Stealing or Other
All Ages 0.414 0.357 0.082 0.146[N=235,549]Ages 14 and 15 0.195 0.480 0.118 0.206[N=85,805]Ages 16 and 17 0.332 0.423 0.090 0.154[N=118,994]Age 18 0.872 0.043 0.024 0.061[N=30,750]Note: Based on unweighted state YRBS data for the period 1995-2009.
44
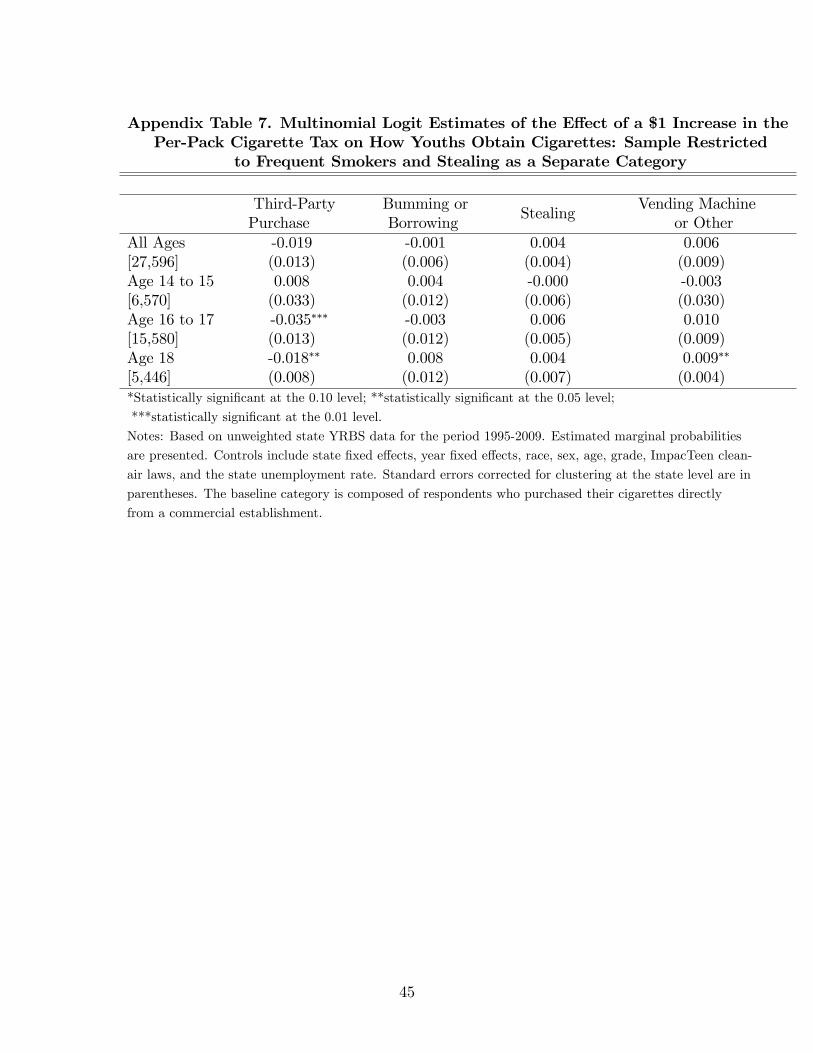
Appendix Table 7. Multinomial Logit Estimates of the E¤ect of a $1 Increase in thePer-Pack Cigarette Tax on How Youths Obtain Cigarettes: Sample Restricted
to Frequent Smokers and Stealing as a Separate Category
Third-PartyPurchase
Bumming orBorrowing
StealingVending Machine
or OtherAll Ages -0.019 -0.001 0.004 0.006[27,596] (0.013) (0.006) (0.004) (0.009)Age 14 to 15 0.008 0.004 -0.000 -0.003[6,570] (0.033) (0.012) (0.006) (0.030)Age 16 to 17 -0.035��� -0.003 0.006 0.010[15,580] (0.013) (0.012) (0.005) (0.009)Age 18 -0.018�� 0.008 0.004 0.009��
[5,446] (0.008) (0.012) (0.007) (0.004)*Statistically signi�cant at the 0.10 level; **statistically signi�cant at the 0.05 level;
***statistically signi�cant at the 0.01 level.
Notes: Based on unweighted state YRBS data for the period 1995-2009. Estimated marginal probabilities
are presented. Controls include state �xed e¤ects, year �xed e¤ects, race, sex, age, grade, ImpacTeen clean-
air laws, and the state unemployment rate. Standard errors corrected for clustering at the state level are in
parentheses. The baseline category is composed of respondents who purchased their cigarettes directly
from a commercial establishment.
45

Appendix Table 8. Multinomial Logit Estimates of the E¤ect of a $1 Increase in thePer-Pack Cigarette Tax on How Youths Obtain Cigarettes: Sample Restricted
to Everyday Smokers and Stealing as a Separate Category
Third-PartyPurchase
Bumming orBorrowing
StealingVending Machine
or OtherAll Ages -0.037��� 0.007 0.005 0.007[20,790] (0.014) (0.007) (0.005) (0.009)Age 14 to 15 -0.025 0.025� -0.008 0.013[4,658] (0.040) (0.015) (0.016) (0.041)Age 16 to 17 -0.046��� -0.000 0.008 0.005[11,794] (0.015) (0.011) (0.005) (0.013)Age 18 -0.039��� 0.017� 0.007 0.014���
[4,338] (.010) (0.010) (0.008) (0.005)*Statistically signi�cant at the 0.10 level; **statistically signi�cant at the 0.05 level;
***statistically signi�cant at the 0.01 level.
Notes: Based on unweighted state YRBS data for the period 1995-2009. Estimated marginal probabilities
are presented. Controls include state �xed e¤ects, year �xed e¤ects, race, sex, age, grade, ImpacTeen clean-
air laws, and the state unemployment rate. Standard errors corrected for clustering at the state level are in
parentheses. The baseline category is composed of respondents who purchased their cigarettes directly
from a commercial establishment.
46
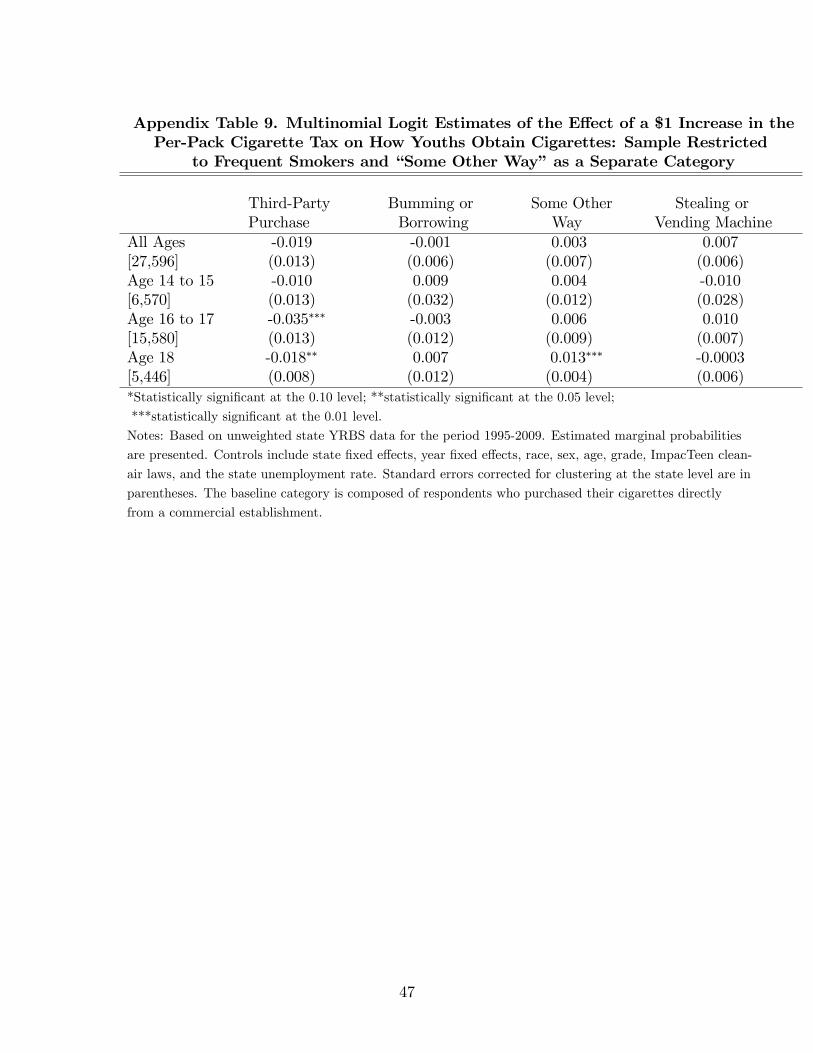
Appendix Table 9. Multinomial Logit Estimates of the E¤ect of a $1 Increase in thePer-Pack Cigarette Tax on How Youths Obtain Cigarettes: Sample Restricted
to Frequent Smokers and �Some Other Way�as a Separate Category
Third-PartyPurchase
Bumming orBorrowing
Some OtherWay
Stealing orVending Machine
All Ages -0.019 -0.001 0.003 0.007[27,596] (0.013) (0.006) (0.007) (0.006)Age 14 to 15 -0.010 0.009 0.004 -0.010[6,570] (0.013) (0.032) (0.012) (0.028)Age 16 to 17 -0.035��� -0.003 0.006 0.010[15,580] (0.013) (0.012) (0.009) (0.007)Age 18 -0.018�� 0.007 0.013��� -0.0003[5,446] (0.008) (0.012) (0.004) (0.006)*Statistically signi�cant at the 0.10 level; **statistically signi�cant at the 0.05 level;
***statistically signi�cant at the 0.01 level.
Notes: Based on unweighted state YRBS data for the period 1995-2009. Estimated marginal probabilities
are presented. Controls include state �xed e¤ects, year �xed e¤ects, race, sex, age, grade, ImpacTeen clean-
air laws, and the state unemployment rate. Standard errors corrected for clustering at the state level are in
parentheses. The baseline category is composed of respondents who purchased their cigarettes directly
from a commercial establishment.
47

Appendix Table 10. Multinomial Logit Estimates of the E¤ect of a $1 Increase in thePer-Pack Cigarette Tax on How Youths Obtain Cigarettes: Sample Restricted
to Everyday Smokers and �Some Other Way�as Separate Category
Third-PartyPurchase
Bumming orBorrowing
Some OtherWay
Stealing orVending Machine
All Ages -0.036��� 0.008 0.003 0.008[20,790] (0.014) (0.007) (0.008) (0.006)Age 14 to 15 -0.025 0.025* -0.002 0.007[4,658] (0.040) (0.015) (0.040) (0.017)Age 16 to 17 -0.045��� 0.000 0.001 0.010[11,794] (0.015) (0.011) (0.013) (0.006)Age 18 -0.039��� 0.017� 0.018��� 0.003[4,338] (0.010) (0.010) (0.005) (0.007)*Statistically signi�cant at the 0.10 level; **statistically signi�cant at the 0.05 level;
***statistically signi�cant at the 0.01 level.
Notes: Based on unweighted state YRBS data for the period 1995-2009. Estimated marginal probabilities
are presented. Controls include state �xed e¤ects, year �xed e¤ects, race, sex, age, grade, ImpacTeen clean-
air laws, and the state unemployment rate. Standard errors corrected for clustering at the state level are in
parentheses. The baseline category is composed of respondents who purchased their cigarettes directly
from a commercial establishment.
48