Embed Size (px)
Citation preview

CIE Software Check of luox.app
prepared by
BA Ad hoc Task Group luox Software Check 05/2021

CIE software check of luox.app
ii CIE 2021, All rights reserved
The following member(s) of the ad hoc Task Group took part in the preparation of this report. The task group comes under the CIE Board of Administration.
Veitch, J.A. (Chair) Canada Vice-President Technical
Bergen, T. Australia Director of Division 2
Blattner, P. Switzerland President
Gibbons, R. USA Vice-President
Kwak, Y. South Korea Director of Division 1
Ohno, Y. USA Past-President
Schlangen, L.J.M. Netherlands Director of Division 6
Whitehead, L.A. Canada Vice-President
The task group also thanks S. Oh (South Korea) for his assistance in data compilation and analysis.

CIE software check of luox.app
CIE 2021, All rights reserved iii
CONTENTS
Summary ............................................................................................................................... iv
1 Introduction ........................................................................................................................1
2 Test details ........................................................................................................................1
2.1 Software under test .....................................................................................................1
2.2 Reference spectra .......................................................................................................2
2.3 Reference software .....................................................................................................3
2.4 Evaluation criteria........................................................................................................3
3 Results ...............................................................................................................................4
3.1 Illuminance ..................................................................................................................4
3.2 Chromaticity coordinates CIE 1931 ..............................................................................5
3.3 Chromaticity coordinates CIE 1964 ..............................................................................5
3.4 -opic irradiance .........................................................................................................6
3.5 -opic Equivalent Daylight Illuminance (EDI) ...............................................................8
3.6 -opic Efficacy of Luminous Radiation (ELR) ...............................................................8
3.7 Other checks ...............................................................................................................9
4 Limitations of the CIE validation .........................................................................................9
5 Conclusions .......................................................................................................................9
References .............................................................................................................................9

CIE software check of luox.app
iv CIE 2021, All rights reserved
Summary
The University of Oxford has developed an open-access software platform known as luox, which incorporates elements of CIE publications for the calculation of certain quantities integrated from spectral data. Under the terms of a licence agreement between the University of Oxford and the CIE, the CIE has agreed to endorse the software following a black-box validation of the software. This is the report of that validation exercise , based on the work of an ad hoc task group of the CIE Board of Administration. The task group selected 43 spectra from various sources, 19 being spectra with 5 nm intervals and 24 being spectra with 1 nm
intervals, and calculated luminance (illuminance), -opic radiances (-opic irradiances), -
opic equivalent daylight luminances (-opic equivalent daylight illuminances), -opic efficacies of luminous radiation, and chromaticity coordinates using both luox and a variety of other available reference calculation tools, both public and private. Tolerance intervals were established for each quantity, and the deviation between the test values from luox and the reference values were calculated for each spectrum. The results for all of these evaluations showed consistency between the test values and the reference values. Based on these results, the CIE approves the following statement concerning the luox software, as per the
aforementioned licence agreement:
“This software incorporates methods, formulae, spectral function calculations and spectra from the International Commission on Illumination (CIE). The CIE endorses this software having made a black-box evaluation of the software as of Feb. 11, 2021, finding that the software performs satisfactorily. This software is not a replacement for the CIE publications and works from which it is derived. The user is advised to consult the original publications and works for proper understanding of and calculation of the result of this software.”
CIE software check of luox.app
CIE 2021, All rights reserved 1
1 Introduction
The University of Oxford has developed an open-access software platform known as luox (Spitschan 2021), which incorporates elements of CIE publications for the calculation of certain quantities integrated from spectral data. Under the terms of a licence agreement between the University of Oxford and the CIE, the CIE has agreed to endorse the software following a black-box validation of the software. This is the report of that validation exercise.
The purpose of luox is to support the research community by providing a simple, free tool for calculating quantities based on spectral measurements of a ligh t source. The primary audience is expected to be researchers interested in the effects of light on physiology and behaviour. To that end, the quantities that are reported (depending on whether the input
values are spectral radiance or spectral irradiance values) are luminance (illuminance), -opic
radiances (-opic irradiances), -opic equivalent daylight luminances (-opic equivalent
daylight illuminances), -opic efficacies of luminous radiation (see CIE 2018a for the
definitions of these -opic quantities), and chromaticity coordinates (CIE 2018b).
2 Test details
2.1 Software under test
The test calculations were run on 2021-02-11, 12:45 CET to 13:06 CET. Version information:
Latest tag: cie-validation
Latest commit SHA: 948a3daa397ae64f7ac840b6d0a040e4200745e7
The source code is available at https://github.com/luox-app/luox/ under MIT licence.
Figure 1 shows a subset of the settings used for the tests reported here, showing one batch of five of the test spectra.
Figure 1 — The test settings for a subset of the luox calculations reported here

CIE software check of luox.app
2 CIE 2021, All rights reserved
2.2 Reference spectra
The task group selected a variety of reference spectra to test, some with 5 nm intervals and some with 1 nm intervals. Some of the spectra were drawn from existing CIE documents; others were created for these tests, to provide extreme cases. Table 1 lists the spectra and their sources.
Table 1 — The full list of 43 spectra used for the test
Name 5 nm 1 nm Source
FL1 x CIE 015:2018
FL2 x CIE 015:2018
FL3 x CIE 015:2018
CIE_A x CIE 015:2018
CIE_D65 x CIE 015:2018
LED-B1 x CIE 015:2018
LED-B2 x CIE 015:2018
LED-B3 x x CIE 015:2018
LED-B4 x CIE 015:2018
LED-B5 x CIE 015:2018
LED-BH1 x CIE 015:2018
LED-RGB1 x x CIE 015:2018
LED_B5_15000 x A modified version of LED-B5 from CIE 015:2018 for a CCT of 15 000 K
4_laser x A 4-peak laser white light
LED-V1 x CIE 015:2018
LED-V2 x CIE 015:2018
HP1 x CIE 015:2018
CIE_E x CIE 015:2018
Random x*1 x Fully random spectrum – Random spectra are non-continuous spectra developed with a random number generator used to identify if the system was biased towards more typical spectrum types.
GreenRandom x*1 x Random, biased towards green
RedRandom x*1 x Random, biased towards red
BlueRandom x*1 x Random, biased towards blue
Square verA x An arbitrary spectrum with square peaks, version A
Square verB x An arbitrary spectrum with square peaks, version B
Test CCT Limit+ (OUT) x A test spectrum with chromaticity just outside the upper
limit of uv = 0,05 above the Planckian locus
Test CCT Limit+ (IN) x A test spectrum with chromaticity just inside the upper limit
of uv = 0,05 above the Planckian locus
Test CCT Limit- (IN) x A test spectrum with chromaticity just outside the lower limit
of uv = 0,05 below the Planckian locus
Test CCT Limit- (OUT) x A test spectrum with chromaticity just inside the lower limit
of uv = 0,05 below the Planckian locus
LED blue x A blue LED, peak at 460 nm
LED green x A green LED, peak at 521 nm
LED orange x An orange LED, peak at 528 nm
LED red cut x A red LED, peak at 632 nm
Laser 650 nm x A single peak at 650 nm
*1 There were two versions of the 5 nm random spectra, created from the 1 nm versions. One was truncated by
taking the values at each 5 nm. The other was weighted by taking the average of the values 2 nm above and below each 5 nm value.
CIE software check of luox.app
CIE 2021, All rights reserved 3
2.3 Reference software
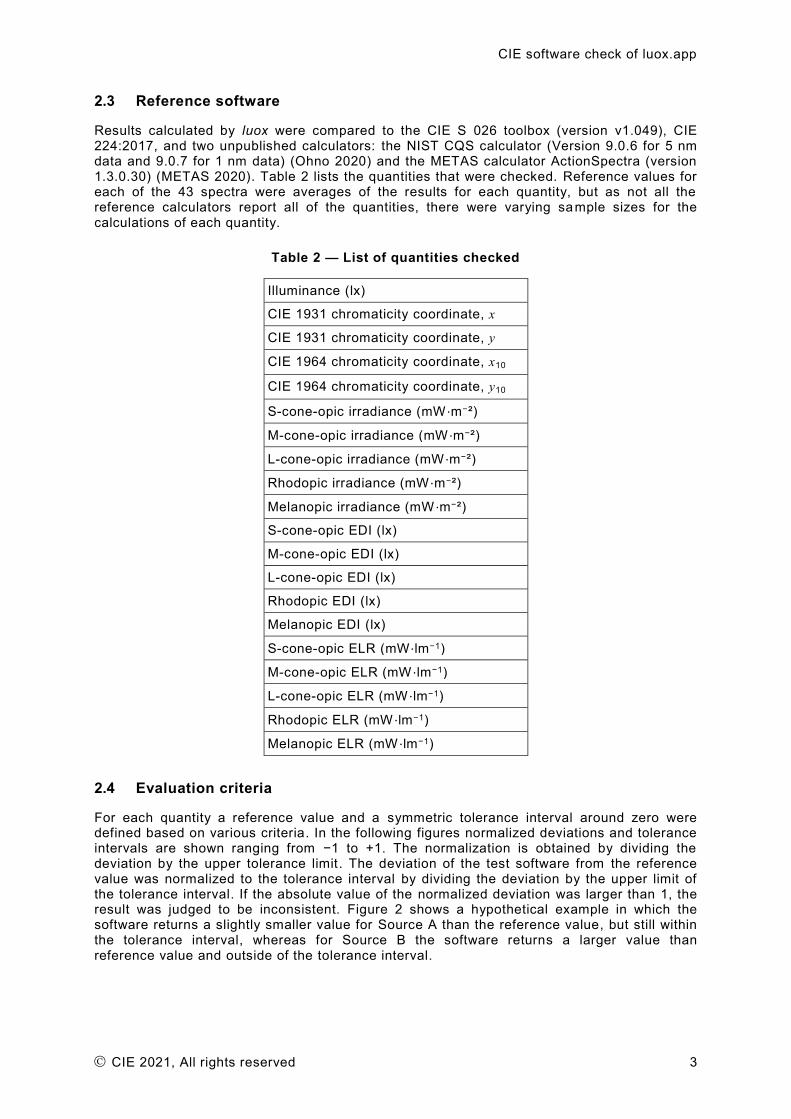
Results calculated by luox were compared to the CIE S 026 toolbox (version v1.049), CIE 224:2017, and two unpublished calculators: the NIST CQS calculator (Version 9.0.6 for 5 nm data and 9.0.7 for 1 nm data) (Ohno 2020) and the METAS calculator ActionSpectra (version 1.3.0.30) (METAS 2020). Table 2 lists the quantities that were checked. Reference values for each of the 43 spectra were averages of the results for each quantity, but as not all the reference calculators report all of the quantities, there were varying sample sizes for the calculations of each quantity.
Table 2 — List of quantities checked
Illuminance (lx)
CIE 1931 chromaticity coordinate, x
CIE 1931 chromaticity coordinate, y
CIE 1964 chromaticity coordinate, x10
CIE 1964 chromaticity coordinate, y10
S-cone-opic irradiance (mW ⋅m−²)
M-cone-opic irradiance (mW ⋅m−²)
L-cone-opic irradiance (mW ⋅m−²)
Rhodopic irradiance (mW ⋅m−²)
Melanopic irradiance (mW ⋅m−²)
S-cone-opic EDI (lx)
M-cone-opic EDI (lx)
L-cone-opic EDI (lx)
Rhodopic EDI (lx)
Melanopic EDI (lx)
S-cone-opic ELR (mW⋅lm−1)
M-cone-opic ELR (mW ⋅lm−1)
L-cone-opic ELR (mW ⋅lm−1)
Rhodopic ELR (mW ⋅lm−1)
Melanopic ELR (mW ⋅lm−1)
2.4 Evaluation criteria
For each quantity a reference value and a symmetric tolerance interval around zero were defined based on various criteria. In the following figures normalized deviations and tolerance intervals are shown ranging from −1 to +1. The normalization is obtained by dividing the deviation by the upper tolerance limit . The deviation of the test software from the reference value was normalized to the tolerance interval by dividing the deviation by the upper limit of the tolerance interval. If the absolute value of the normalized deviation was larger than 1, the result was judged to be inconsistent. Figure 2 shows a hypothetical example in which the software returns a slightly smaller value for Source A than the reference value, but still within the tolerance interval, whereas for Source B the software returns a larger value than reference value and outside of the tolerance interval.

CIE software check of luox.app
4 CIE 2021, All rights reserved
Figure 2 — A schematic example of how the results were evaluated, with lines marking the normalized tolerance interval and bars representing the normalized deviation (from the
reference value) for each spectrum
3 Results
3.1 Illuminance
Figure 3 shows the results for illuminance. In this and all figures showing the results, the 5 nm spectra are grouped on the left, and the 1 nm spectra are grouped on the right. The deviation in the illuminance results mainly originates in the different tools using slightly different values for the maximum luminous efficacy, Km, arising from different assumptions concerning the
refractive index of air and from rounding. The upper limit of the tolerance interval is 5 10−6 of the reference value.
Figure 3 — Evaluation results for the illuminance comparison of the 43 spectra presented in Table 1
The results are all consistent with the reference values.

CIE software check of luox.app
CIE 2021, All rights reserved 5
3.2 Chromaticity coordinates CIE 1931
Figure 4 and Figure 5 show the results for the calculations of the CIE 1931 x and y
chromaticity coordinates, respectively. The upper limit of the tolerance interval was 1 10−7 (absolute).
Figure 4 — Evaluation results for the CIE 1931 x chromaticity coordinate comparison of the 43 spectra presented in Table 1
Figure 5 — Evaluation results for the CIE 1931 y chromaticity coordinate comparison of the 43 spectra presented in Table 1
The results were consistent with the reference values for both chromaticity coordinates.
3.3 Chromaticity coordinates CIE 1964
Figure 6 and Figure 7 show the results for the calculations of the CIE 1964 x10 and y10
chromaticity coordinates, respectively. The upper limit of the tolerance interval was 1 10−7 (absolute).

CIE software check of luox.app
6 CIE 2021, All rights reserved
Figure 6 — Evaluation results for the CIE 1964 x10 chromaticity coordinate comparison of the
43 spectra presented in Table 1
Figure 7 — Evaluation results for the CIE 1964 y10 chromaticity coordinate comparison of the
43 spectra presented in Table 1
The results were consistent with the reference values for both chromaticity coordinates.
3.4 -opic irradiance
All five -opic irradiance values were compared; Figure 8 to Figure 12 show the comparison
results for all five -opic irradiances. The upper limit of the tolerance interval was either
1 10−8 (L-cone-opic irradiance) or 1 10−10 (all other -opic irradiances) of the reference value.
Figure 8 — Evaluation results for the S-cone-opic irradiance comparison of the 43 spectra presented in Table 1

CIE software check of luox.app
CIE 2021, All rights reserved 7
Figure 9 — Evaluation results for the M-cone-opic irradiance comparison of the 43 spectra presented in Table 1
Figure 10 — Evaluation results for the L-cone-opic irradiance comparison of the 43 spectra presented in Table 1
Figure 11 — Evaluation results for the rhodopic irradiance comparison of the 43 spectra presented in Table 1

CIE software check of luox.app
8 CIE 2021, All rights reserved
Figure 12 — Evaluation results for the melanopic irradiance comparison of the 43 spectra presented in Table 1
The results were consistent with the reference values in each case.
3.5 -opic Equivalent Daylight Illuminance (EDI)
All five -opic EDI values were compared, and the results for melanopic EDI are shown in
Figure 13. The upper limit of the tolerance interval was set to 2 10−5 of the reference value. The deviation and the large tolerance interval relate to differences in the precision of
constants for daylight D65. CIE S 026:2018 specifies 4 digits for the -opic efficacies of
luminous radiation for daylight (D65), D65
α,vK , for each -opic action spectrum, and this has
been implemented in luox; the CIE toolbox (CIE 2020) uses an unrounded value with 15 digits
for these constants.
Figure 13 — Evaluation results for the melanopic EDI comparison of the 43 spectra presented in Table 1
The results were consistent with the reference values in each case, for melanopic EDI and for
all of the other -opic EDIs analysed (not shown here).
3.6 -opic Efficacy of Luminous Radiation (ELR)
All five -opic ELR values were compared, and the results for melanopic ELR are shown in Figure 14. Based on the spread of the reference values, the upper limit of the tolerance
interval was set to 2 10−6 of the reference value.

CIE software check of luox.app
CIE 2021, All rights reserved 9
Figure 14 — Evaluation results for the melanopic ELR comparison of the 43 spectra presented in Table 1
The results were consistent with the reference values in each case, for melanopic ELR and
for all of the other -opic ELRs analysed (not shown here).
3.7 Other checks
An evaluation of tables of standard values used by luox was made and all of the tables are correct. There is a very minor deviation in the values of the CIE colour matching function in the CIE 1931 standard colorimetric system, �̅�, at a few wavelengths above 819 nm due to the
truncation of the last digit (at a level of 2 10−13).
4 Limitations of the CIE validation
This is a black box validation. The luox source code was not examined in detail. For some combinations of spectra and quantities, only one reference calculator was available. All of the checks were performed with uniform 1 nm and 5 nm interval data.
5 Conclusions
Based on these results, the CIE approves the following statement concerning the luox software, as per the aforementioned licence agreement:
“This software incorporates methods, formulae, spectral function calculati ons and spectra from the International Commission on Illumination (CIE). The CIE endorses this software having made a black-box evaluation of the software as of Feb. 11, 2021, finding that the software performs satisfactorily. This software is not a replacement for the CIE publications and works from which it is derived. The user is advised to consult the original publications and works for proper understanding of and calculation of the result of this software.”
References
CIE (2017). CIE 224:2017 CIE 2017 Colour Fidelity Index for accurate scientific use. Vienna, Austria: CIE.
CIE (2018a). CIE S 026/E:2018 CIE System for Metrology of Optical Radiation for ipRGC-Influenced Responses to Light. Vienna: CIE. https://doi.org/10.25039/S026.2018.
CIE (2018b). CIE 015:2018 Colorimetry, 4th Edition. Vienna, Austria: CIE. https://doi.org/10.25039/TR.015.2018.

CIE software check of luox.app
10 CIE 2021, All rights reserved
CIE (2020). CIE S 026 -opic toolbox (v1.049 - 2020/03/26). Vienna, Austria: CIE. https://doi.org/10.25039/S026.2018.TB
Ohno, Y. (2020). NIST CQS calculator (Version 9.0.6 for 5 nm and 9.0.7 for 1 nm) [Software]. Available from the National Institute for Standards and Technology.
METAS (2020). ActionSpectra (version 1.3.0.30) [Software]. Not publicly available.
Spitschan, M. (2021). luox: Platform for calculating quantities related to light and lighting [Software]. Available from https://luox.app/.


![Welcome [raw.githubusercontent.com]](https://img.dokumen.tips/doc/110x75/61bd492761276e740b1146ab/welcome-raw-.jpg)