Embed Size (px)
Citation preview

This document consists of 8 printed pages.
MCSA-UCB216-S34078/4© CIE 2003 [Turn over
CAMBRIDGE INTERNATIONAL EXAMINATIONS International General Certificate of Secondary Education
MATHEMATICS 0580/040581/04
Paper 4May/June 2003
2 hours 30 minutesAdditional Materials: Answer Booklet/Paper
Electronic calculatorGeometric instrumentsGraph paper (2 sheets)Mathematical tables (optional)Tracing paper (optional)
READ THESE INSTRUCTIONS FIRST
Write your answers and working on the separate Answer Booklet/Paper provided.Write your Centre number, candidate number and name on all the work you hand in.Write in dark blue or black pen on both sides of the paper.You may use a soft pencil for any diagrams or graphs.Do not use staples, paper clips, highlighters, glue or correction fluid.
Answer all questions.At the end of the examination, fasten all your work securely together.The number of marks is given in brackets [ ] at the end of each question or part question.
All working must be clearly shown. It should be done on the same sheet as the rest of the answer.Marks will be given for working which shows that you know how to solve the problem even if you get theanswer wrong.The total of the marks for this paper is 130.Electronic calculators should be used.If the degree of accuracy is not specified in the question and if the answer is not exact, give the answer tothree significant figures. Give answers in degrees to one decimal place.For π, use either your calculator value or 3.142.

1 Tickets for the theatre cost either $10 or $16.
(a) Calculate the total cost of 197 tickets at $10 each and 95 tickets at $16 each. [1]
(b) On Monday, 157 tickets at $10 and n tickets at $16 were sold. The total cost was $4018.Calculate the value of n. [2]
(c) On Tuesday, 319 tickets were sold altogether. The total cost was $3784.Using x for the number of $10 tickets sold and y for the number of $16 tickets sold, write downtwo equations in x and y.
Solve your equations to find the number of $10 tickets and the number of $16 tickets sold. [5]
(d) On Wednesday, the cost of a $16 ticket was reduced by 15%. Calculate this new reduced cost.[2]
(e) The $10 ticket costs 25% more than it did last year. Calculate the cost last year. [2]
In quadrilateral ABCD, AB # 77 m, BC # 120 m, CD # 60 m and diagonal AC # 55 m.Angle CAD # 45°, angle BAC # x° and angle ADC # y°.
(a) Calculate the value of x. [4]
(b) Calculate the value of y. [4]
(c) The bearing of D from A is 090°.Find the bearing of
(i) A from C, [2]
(ii) B from A. [2]
0580/4, 0581/4 Jun/03
2
45°x°
A
NOT TOSCALE
y°
B
C
D
60 m
120m
77m
55m
2
3 There are 2 sets of road signals on the direct 12 kilometre route from Acity to Beetown.The signals say either “GO” or “STOP”.The probabilities that the signals are “GO” when a car arrives are shown in the tree diagram.
(a) Copy and complete the tree diagram for a car driver travelling along this route.
[3]
(b) Find the probability that a car driver
(i) finds both signals are “GO”, [2]
(ii) finds exactly one of the two signals is “GO”, [3]
(iii) does not find two “STOP” signals. [2]
(c) With no stops, Damon completes the 12 kilometre journey at an average speedof 40 kilometres per hour.
(i) Find the time taken in minutes for this journey. [1]
(ii) When Damon has to stop at a signal it adds 3 minutes to this journey time.
Calculate his average speed, in kilometres per hour, if he stops at both road signals. [2]
(d) Elsa takes a different route from Acity to Beetown.This route is 15 kilometres and there are no road signals.Elsa’s average speed for this journey is 40 kilometres per hour.Find
(i) the time taken in minutes for this journey, [1]
(ii) the probability that Damon takes more time than this on his 12 kilometre journey. [2]
0580/4, 0581/4 Jun/03 [Turn over
3
GO
STOP
0.4
GO
STOP
GO
STOP
0.65
.......
0.45
.......
.......
1st signal 2nd signal

4 Answer the whole of this question on a sheet of graph paper.
(a) Using a scale of 2 cm to represent 1 unit on the x-axis and 2 cm to represent 4 units on they-axis, draw axes for 04 ≤ x ≤ 4 and 08 ≤ y ≤ 8.Draw the curve y # f(x) using the table of values given above. [5]
(b) Use your graph to solve the equation f(x) # 0. [2]
(c) On the same grid, draw y # g(x) for 04 ≤ x ≤ 4, where g(x) # x ! 1. [2]
(d) Write down the value of
(i) g(1),
(ii) fg(1),
(iii) g�01(4),
(iv) the positive solution of f(x) # g(x). [4]
(e) Draw the tangent to y # f(x) at x # 3. Use it to calculate an estimate of the gradient of the curveat this point. [3]
5 (a) Calculate the area of an equilateral triangle with sides 10 cm. [2]
(b) Calculate the radius of a circle with circumference 10 cm. [2]
The diagrams represent the nets of 3 solids. Each straight line is 10 cm long. Each circle hascircumference 10 cm. The arc length in Diagram 3 is 10 cm.
(i) Name the solid whose net is Diagram 1. Calculate its surface area. [3]
(ii) Name the solid whose net is Diagram 2. Calculate its volume. [4]
(iii) Name the solid whose net is Diagram 3. Calculate its perpendicular height. [4]
0580/4, 0581/4 Jun/03
4
x 04 03 02 01 0 1 2 3 4
f(x) 08 4.5 8 5.5 0 05.5 08 04.5 8
Diagram 1
10 cm 10 cm
Diagram 2 Diagram 3
(c)

A rectangular-based open box has external dimensions of 2x cm, (x ! 4) cm and (x ! 1) cm.
(a) (i) Write down the volume of a cuboid with these dimensions. [1]
(ii) Expand and simplify your answer. [1]
(b) The box is made from wood 1 cm thick.
(i) Write down the internal dimensions of the box in terms of x. [3]
(ii) Find the volume of the inside of the box and show that the volume of the woodis 8x�2 ! 12x cubic centimetres. [3]
(c) The volume of the wood is 1980 cm�3.
(i) Show that 2x�2 ! 3x 0 495 # 0 and solve this equation. [5]
(ii) Write down the external dimensions of the box. [2]
0580/4, 0581/4 Jun/03 [Turn over
5
(x + 1) cm
(x + 4) cm
2x cm
NOT TOSCALE
6

A star is made up of a regular hexagon, centre X, surrounded by 6 equilateral triangles.{O|A # a and {O|B # b.
(a) Write the following vectors in terms of a and�or b, giving your answers in their simplest form.
(i) {O|S, [1]
(ii) {A|B, [1]
(iii) {C|D, [1]
(iv) {O|R, [2]
(v) {C|F. [2]
(b) When | a | # 5, write down the value of
(i) | b |, [1]
(ii) | a 0 b |. [1]
(c) Describe fully a single transformation which maps
(i) triangle OBA onto triangle OQS, [2]
(ii) triangle OBA onto triangle RDE, with O mapped onto R and B mapped onto D. [2]
(d) (i) How many lines of symmetry does the star have? [1]
(ii) When triangle OQS is rotated clockwise about X, it lies on triangle PRT, with O on P.Write down the angle of rotation. [1]
0580/4, 0581/4 Jun/03
6
O
P
Q
T
S
R
F
E
DC
B
A
X
a
b
7

8 Answer the whole of this question on a sheet of graph paper.
In a survey, 200 shoppers were asked how much they had just spent in a supermarket.The results are shown in the table.
(a) (i) Write down the modal class. [1]
(ii) Calculate an estimate of the mean amount, giving your answer correct to 2 decimalplaces. [4]
(b) (i) Make a cumulative frequency table for these 200 shoppers. [2]
(ii) Using a scale of 2 cm to represent $20 on the horizontal axis and 2 cm to represent20 shoppers on the vertical axis, draw a cumulative frequency diagram for this data. [4]
(c) Use your cumulative frequency diagram to find
(i) the median amount, [1]
(ii) the upper quartile, [1]
(iii) the interquartile range, [1]
(iv) how many shoppers spent at least $75. [2]
Question 9 is on the next page
0580/4, 0581/4 Jun/03 [Turn over
7
Amount($x) 0 ` x ≤ 20 20 ` x ≤ 40 40 ` x ≤ 60 60 ` x ≤ 80 80 ` x ≤ 100 100 ` x ≤ 140
Number of shoppers 10 32 48 54 36 20
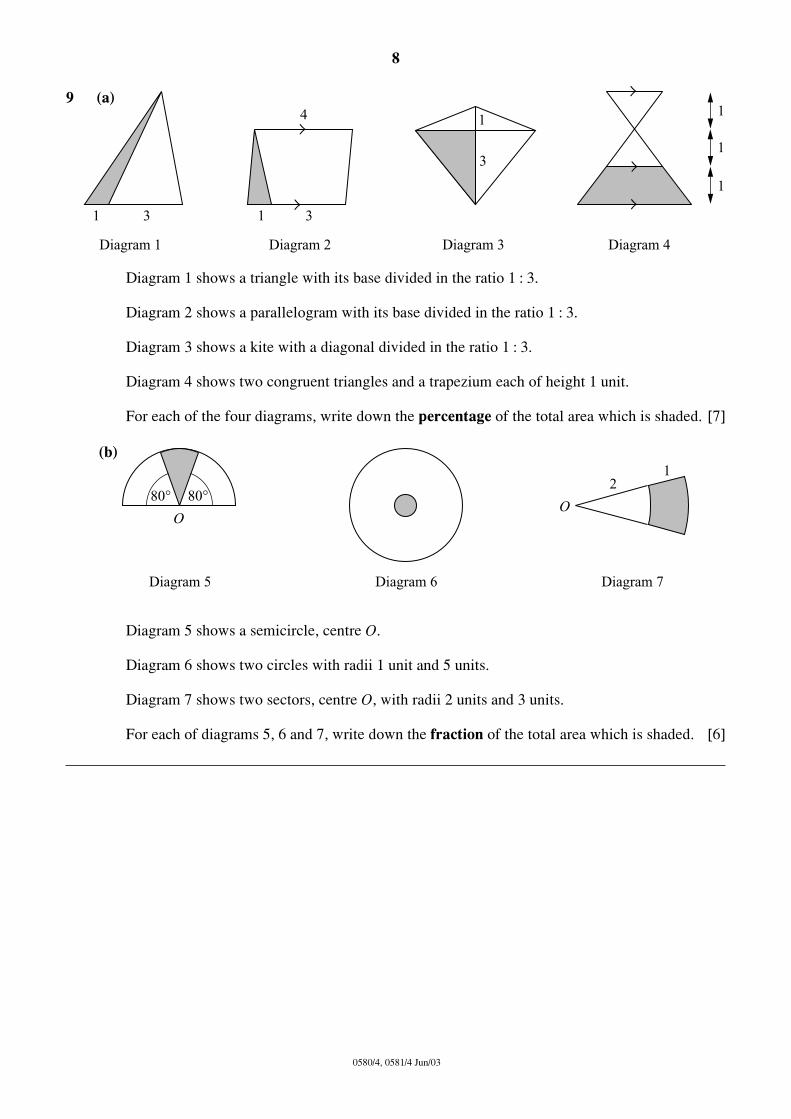
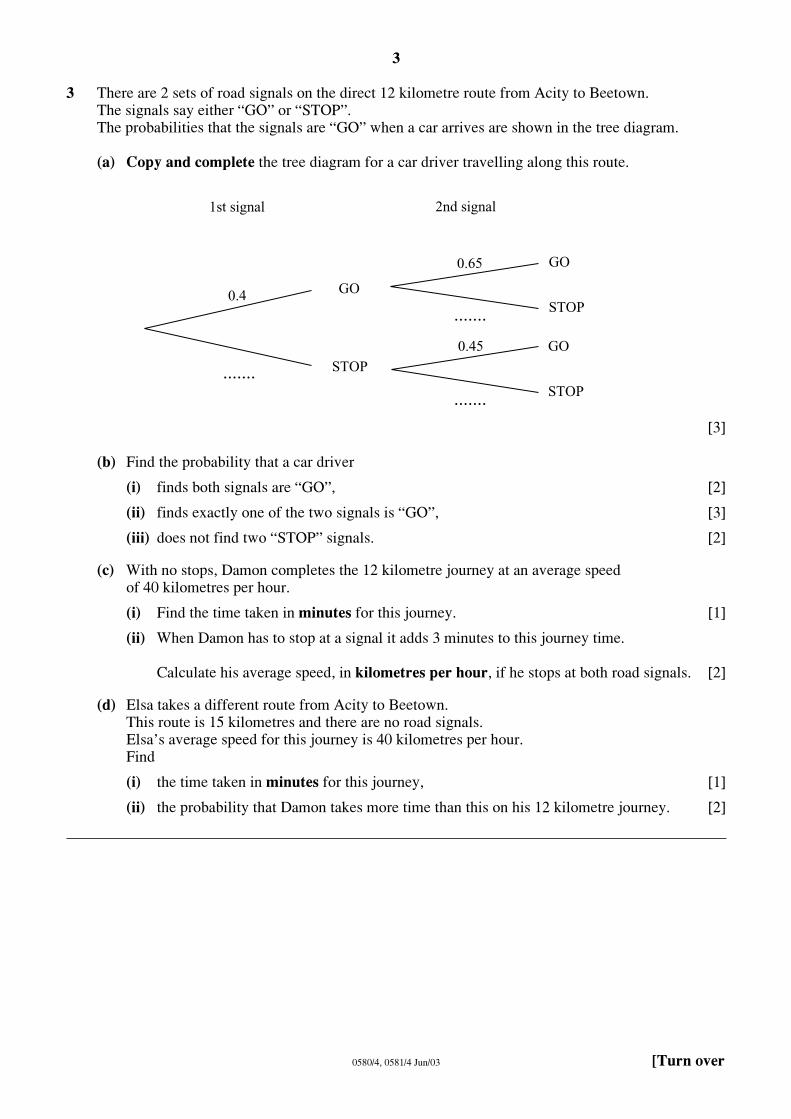
Diagram 1 shows a triangle with its base divided in the ratio 1 : 3.
Diagram 2 shows a parallelogram with its base divided in the ratio 1 : 3.
Diagram 3 shows a kite with a diagonal divided in the ratio 1 : 3.
Diagram 4 shows two congruent triangles and a trapezium each of height 1 unit.
For each of the four diagrams, write down the percentage of the total area which is shaded. [7]
Diagram 5 shows a semicircle, centre O.
Diagram 6 shows two circles with radii 1 unit and 5 units.
Diagram 7 shows two sectors, centre O, with radii 2 units and 3 units.
For each of diagrams 5, 6 and 7, write down the fraction of the total area which is shaded. [6]
0580/4, 0581/4 Jun/03
8
1
1
1
1 1
1
33
3
4
Diagram 1 Diagram 2 Diagram 3 Diagram 4
9 (a)
80°
Diagram 5 Diagram 6 Diagram 7
80°O
O
21
(b)

Model Answers
Question Solution
I(a) I97 x $I0 + 95 x $I6 = $3490
I(b) I570 x I0 + n x I6 = 4018 I6n = 40I8 − I570
n = 2448 ÷ I 6 n = I53
I(c) Total Tickets: x + y = 3I9 [I] Total Cost: I0x + I6y = 3784 [2]
I0x + I0y = 3I90 I0x + I6y = 3784
6y = 594 y = 99 x + 99 = 3I9
x = 220
I(d) With a I5% reduction the new cost is 85% of the original cost. − x I6
= $ I3.6
I(e) I25/I00 × last year’s cost = $I0 Last year’s cost = I 00
I25 I0 =$8

2(a) Using the Cosine Rule I20 = 77 + 55 -2 x 77 x 55cos x 2 2 2
cos x = (77 + 55 − I20 ) 2 2 2
(2 x 77 x 55) x = I30°
2(b) sin y = sin 45 55 60
sin y = 55 sin45 60 = 0.648 y = 40.4°
2(c) (i) Angle ACD = I80 -(45ο + 40.4o )= 94.6°
Bearing = 90 + 40.4 + 94.6 = 225°
(ii) From (i) the bearing of C from A is 045°. The remainder of the angle x is I30 - 45 = 85° The bearing of B from A = 360 - 85
= 275°
cos x = - 0.643

3(a)
3(b) (i) 0.4 x 0.65 = 0.26
(ii) 0.4 x 0.35 + 0.6 x 0.45 = 0.4I
(iii) I�− 0.6 x 0.55 = 0.67
3(c) (i) Time = Distance ÷ Speed = I2 ÷ 40 hours
= I2 ÷ 40 x 60 minutes =I8 minutes
(ii) New Time = I8 + 6 = 24 minutes.
Speed = Distance ÷ Time = I2 ÷ 24 = 0.5 x 60
= 30km per hour
3(d) (i) Time = I5 ÷ 40 x 60 = 22.5 minutes
(ii) Damon only takes longer than this when he stops at both signals. Probability = 0.6 x 0.55 = 0.33

4(a) (c)
4(b) Quote the three values of x where the curve crosses the x axis -3.6 ≤ x ≤ −3.3, x = 0, 3.3 ≤ x ≤ 3.6
4(d) (i) g(I) = I + I = 2 (ii) fg(I) = f(2) = -8
(iii) g (4) = 4 -I = 3
−1
(iv) f(x) = g(x) for 3.75 ≤ x ≤ 3.9
4(e) Tangent at x = 3 drawn on the curve Calculate vertical/horizontal using the scale
Answer in range 5 to I0
5(a) Area = 0.5 x I0 x I0 x sin 60 = 43.3
5(b) Circumference = 2πr where r is the radius. So 2πr = I0
r = I0 2π
= I.59
f(x)
x

5(c) (i) Tetrahedron Surface area = 4 x 43.3
= I73 sq.cm. (ii) Cylinder
Volume = πr h (h is the height) 2
= π × I.59 × I0 2
= 79.4 cu.cm. (iii) Cone Hypotenuse = I0 centimetres Radius = I.59 centimetres h
Height, h = √(I0 − I.59 ) 2 2
= 9.87cm.
6(a) (i) Volume = length x bread = 2x( x + 4)(
(ii) Volume = 2x( + x +x 2
= 2 + I0 + x 3 x 2
6(b) (i) 2x − 2, x + 4 − 2, angives 2x − 2, x + 2
(ii) Volume inside = x( 2x −
= 2 + 2 − x 3 x 2
Wood = Volume outside − vo= 8 + I2x x 2
6(c) (i) 8 + I2x = I9x 2
2x + 3x =2
Solving by the formua = 2, b = 3 and c =
x = -3+/-√( 3 − 4 x 2
2 x 2 x = I5 or -I6.5
(ii) Use the positive answer,
Dimensions are 30 by I9
I0cm
2x + 3x ²
I.59cm
th x height x + I) 4x + 4 ) 8x
d x + I − I and x
2)(x + 2) 4x lume inside
80 495
la -495 2 x −495)
x = I5 by I6
- 495 = 0
7(a) (i) OS = 3a (ii) AB = b�-a (iii) CD = a (iv) OR = OF + FB = 2a + 2b (v) CF = 2 x BA = 2a -2b
7(b) (i) b = 5
(ii) a - b = 5
7(c) (i) Enlargement, Scale Factor 3 and centre O
(ii) Reflection in the line CF
7(d) (i) 6 (ii) 60°
8(a) (i) 60 < x ≤ 80 (ii) [(I0 x I0) + (30 x 32) + ( 50 x 48) + (70 x 54)
+ (90 x 36) + (I20 x 20)] ÷ 200
= $64.40
8(b) (i) Amount ≤ 20 40 60 80 I00 I40 Shoppers I0 42 90 I44 I80 200

8(b) (ii)

8(c) (i) Median = 63 to 64 (ii) Upper Quartile = 82 to 84 (iii) I.Q. Range = Upper quartile -Lower quartile = 38 to 4I (iv) At least $75 spent = 67 to 72
9(a) Diagram I => 25% Diagram 2 => I2.5%
Diagram 3 => 37.5%
Diagram 4 => 60%
9(b) Diagram 5 => I/9
Diagram 6 => I/25
Diagram 7 => 5/9

Summary of Comments on IGCSE Mathematics Paper 4 June 2003 Page: 2
Q1(a) Straightforward start gives an indication of how to tackle the algebra to come. Care is needed to quote the total cost and not just two separate amounts.
Q1(b) Follow the method of part (a) and solve the linear equation. Subtract before dividing.
Q1(c) Total is x + y and is equal to 319. Follow the method of (a) and (b). Multiply equation [1] by 10. Leave equation [2] in its original form. Subtract the equations. Substitute y = 99 in equation [1]. Alternatively multiply equation [1] by 16 to find x first. Use a calculator to check that the solutions found fit equation [2].
Q1(d) Alternatively, find 15% of 16 and subtract from 16.
Q1(e) Reversed percentages. Think about the words of the question being written in the form of an equation. 25% more indicates 125% of the original. Avoid the common errors of finding 75% of 10 or finding 125% of 10.
Q2(a) Do not measure lengths or anglesIs the calculator in degree mode? Rules need to be known but M2 available for first line of cos x = …… form quoted with values. Brackets round both numerator and denominator when using the calculator will ensure that errors do not occur. The value of cos xdoes not need to be shown for the two A marks. Remember that a negative cosine indicates an obtuse angle.
Do not over approximate for cos x. It is best to leave the figures on the calculator.

Q2(b) Use the sine rule whenever it works. Only use the cosine rule when either 3 sides or 2 sides and the angle included between these 2 sides are given. Again do not over-approximate at any intermediate stages of the solution.
Q2(c) Bearings are measured from a north line, (usually up the page) in a clockwise direction and quoted with three figures. Alternatively the bearing of C from A is 045°. So the bearing of A from C is 180 + 45 = 225° which is the back bearing method. Alternatively, bearing of West is 270°. So the bearing is 270 + (180 – (130 + 45)) = 275°
Page: 3
Q3(a) Do not answer this on the question paper. As instructed, draw it and enter the probabilities as shown. Pairs of probabilities must each total 1.0.
Q3(b) 1st on 'go' AND 2nd on 'go' means MULTIPLY. 'Go' AND 'Stop' OR 'Stop' AND 'Go' means multiply the branches and then ADD the two answers. Careful not to do at least one. Alternatively add the three relevant situations. 0.26 + 0.14 + 0.27
Q3(c) Care needed to multiply by 60 for the answer in minutes. 3 minutes at each lights, be careful not to do just 3 minutes added. This is kilometres per minute so it is necessary to multiply by 60.
Q3(d) Similar to part (c)(i). For the method some understanding of the situation is needed. A statement like that given would achieve M1.
Page: 4
Q4(a) (c)
Use the scale given, it is the best one to work with and gets 1 mark. Plot the points with care and clearly, as this is worth 3 marks. Make sure the curve goes through all the points and no sections have been ruled. Try to make the curve as smooth as possible, with no ‘fuzzy’ parts. This is worth 1 mark. A ruler must be used for the straight lines in parts (c) and (e). For (c), find and plot 3 values of g(x) using any values of x. Draw the line g(x) for the full width of the graph.
Q4(b) The values must be correct for the drawn graph and in these ranges.
Q4(d) Substitute 1 for x. Find f(2) from the table or graph. fg(1) ≠ f(1) × g(1) Inverse of add 1 is subtract 1 or can be read from the graph as the x value when f(x) = 4 Only the x value is required, f(x) must not be given.
Q4(e) Tangent must touch the curve (no daylight and not a chord). Agreeing with the graph.
Q5(a) All sides are 10 centimetres and all angles are 60°. This area formula should be learnt. Finding the perpendicular height separately can lead to errors, usually of early approximation.
Q5(b) Accuracy must be given to a minimum of 3 significant figures. The formula needs to be known.
Q5(c)(i) Triangular pyramid allowed. 4 of the triangles of part (a).
(ii) Circular prism accepted. Use the radius of (b) in the formula.
(iii) Circular pyramid accepted. Do not confuse with the surface area formula, πrl. Lack of accuracy in the working usually produces errors in the final answers. These formulas for areas and volumes need to be known.

Page: 5
Q6(a) This is enough for the first mark.
Multiply out the brackets first, and then multiply by 2.
Q6(b) From the length and breadth subtract 2cm but only subtract 1 from the height. Find the volume inside by multiplying out. Then subtract the two volumes to give the volume of wood. Working must be shown and the result stated.
Q6(c) This part needs to use the volume in (b)(ii) to equate to 1980. Then divide by 4 and quote the result. Must have ‘= 0’. Can also factorise (x – 15)(2x + 33) = 0 gives x = 15 or –16.5 Completing the square is another method. Negative solution is not possible. This is not essential to state but makes understanding clear.
Page: 6
Q7(a)(i) Just three times the vector OA. (ii) This is AO + OB (iii) Equal to OA (iv) Move from O to R along known vectors.
(v) Observe this is parallel to BA and twice its length. BA = –AB
Q7(b)(i) Magnitude of b is equal to the magnitude of a. (ii) This is the magnitude of AB which is the same as the
magnitude of a.
Q7(c)(i) All the parts required for both marks. (ii) The line must be quoted for the second mark.
Q7(d)(i) Joining points of stars and D to A etc. (ii) Tracing paper would help to realise that in turning through 360° it
would be exactly over the shape 6 times.
Page: 7
Q8(a)(i) The group with the highest frequency, not the frequency of 54 itself. (ii) Midpoints 10,30,50,70,90,120.
Midpoints × frequencies and added. Division by total shoppers. The answer was to be two decimal places so the zero was essential here for the accuracy mark. Do not use class width rather than frequency in the multiplying.
Q8(b)(i)
Q8(b)(ii)
Add each frequency to the previous total. Check that the last figure is equal to the total number of shoppers. The cumulative frequency diagram is shown. The points may be joined either with a smooth curve or with a series of straight lines, as in the diagram. Points must be plotted at the ends of the intervals, not at the midpoints. The graph must start at (0,0). Make sure the scale is as given, worth 1 mark. There are 2 marks for correctly plotting the points. There is 1 mark for a correct joining of the points including starting at (0,0).
Q8(c)(i) Value of x for 100 on vertical scale. (ii) Value of x for 150 on vertical scale. (iii) Subtract value of x for 50 on vertical scale from previous answer. (iv) Read number of shoppers for amount $75 and subtract from 200.
Answers need to be within the ranges shown but also correct for the candidate’s graph.

Page: 8
Q9(a) Diagram 1 One quarter of the base, same height. Diagram 2 One quarter of the base, same height but halve the percentage as
a triangle is compared with a parallelogram. Diagram 3 Large sections are 3 times the area of the small sections. The
shaded is three-eighths of the whole. Diagram 4 Shaded part is equivalent to three of the unshaded triangles. That
is three-fifths of the figure. There are other ways of working these, but not based on similar figures.
Q9(b) Diagram 5 20/180 and cancelled. Not over 360, a common error. π × 1 2
π × 5 2
Diagram 7 Area of small sector:area of large sector = 4:9
As the whole is 9 parts and the unshaded is 4 parts the shaded is 5 parts. Again there are other approaches possible and where more than 1 mark is given there are marks allowed for correct methods which do not achieve the correct solution.
Diagram 6