Embed Size (px)
Citation preview

Chronic Kidney Disease Chronic Kidney Disease (CKD)(CKD)
Robert M. Centor, MD Robert M. Centor, MD Acting Associate Dean, Huntsville CampusActing Associate Dean, Huntsville Campus
Associate Dean for CMEAssociate Dean for CMEProfessor and Director, Division of GIMProfessor and Director, Division of GIM
UABUAB

Patient Presentation Patient Presentation
WD is a 51 YOBM with long history of diabetes WD is a 51 YOBM with long history of diabetes mellitus. He is admitted to the VA Hospital with mellitus. He is admitted to the VA Hospital with left leg cellulitis. Review of his lab work left leg cellulitis. Review of his lab work including the following important labs:including the following important labs:
Hemoglobin 10.3 Calcium 7.7Hematocrit 30.7 Albumin 2.8
2.12.119195.95.92828112112137137
236

Review of his laboratory data shows that Review of his laboratory data shows that they were similar to previous values they were similar to previous values 24 hour urine protein done one month 24 hour urine protein done one month prior to admission showed 2 grams of prior to admission showed 2 grams of protein in 24 hours. protein in 24 hours. Urine sodium 110 and urine potassium 22 Urine sodium 110 and urine potassium 22 with urine chloride of 156.with urine chloride of 156.PTH PTH –– 297 297
More clinical informationMore clinical information
Goals of workshopGoals of workshop
Review some key management strategies Review some key management strategies for patients with CKD.for patients with CKD.Use recent articles to highlight recent Use recent articles to highlight recent guidelines for chronic kidney disease. guidelines for chronic kidney disease. Raise awareness of aggressive Raise awareness of aggressive management of stage III CKDmanagement of stage III CKDDevelop strategies for improving care of Develop strategies for improving care of stage III CKD and teaching about CKDstage III CKD and teaching about CKD

Determine estimated GFR. Determine estimated GFR.
Using the GFR calculator that you can find on Using the GFR calculator that you can find on the National Kidney Foundation Kidney Disease the National Kidney Foundation Kidney Disease Outcomes Quality Initiative Page, we calculated Outcomes Quality Initiative Page, we calculated and estimated his GFR = 40 cc/min and estimated his GFR = 40 cc/min www.kidney.org/professionals/kdoqi/index.cfmwww.kidney.org/professionals/kdoqi/index.cfm

Chronic Kidney Disease StagesChronic Kidney Disease Stages
Using this GFR, we classified this patient Using this GFR, we classified this patient as Stage III Chronic Kidney Disease as Stage III Chronic Kidney Disease The stages of CKD The stages of CKD

Replacement (if uremia present)
<15(or dialysis)
Kidney failure5
Preparation for kidney replacement therapy
15–29Severely decreased GFR
4
Evaluating and treating complications
30–59Moderately decreased GFR
3
Estimating progression60–89Kidney damage w/ mildly decreased GFR
2
Dx and Rx of comorbid dz,Slowing progression,CVD risk reduction
≥90Kidney damage w/ normal or increased GFR
1
Screening,CKD risk reduction
≥90 (with CKD RF’s)
At increased riskAction*GFR mL/min/1.73m)DescriptionStage
Stages of Chronic Kidney Disease: A clinical action plan

Issues for our discussionIssues for our discussion
Delaying progression of CKDDelaying progression of CKDBone Disease Bone Disease Anemia Anemia Vascular Access Vascular Access AcidosisAcidosis

AngiotensinAngiotensin--Receptor Receptor Blockade versus ConvertingBlockade versus Converting--Enzyme Inhibition in Type 2 Enzyme Inhibition in Type 2 Diabetes and NephropathyDiabetes and Nephropathy
AH Barnett, SC Bain, P AH Barnett, SC Bain, P BouterBouter, B , B KarlbergKarlberg, S , S MadsbadMadsbad, J , J JervellJervell, J , J MustonenMustonen, for the , for the
Diabetics Exposed to Diabetics Exposed to TelmisartanTelmisartan and and EnalaprilEnalaprilStudy GroupStudy Group
NEJM 2004;351:1952NEJM 2004;351:1952--61 61

Importance of this StudyImportance of this Study
Previous studies have documented Previous studies have documented independently that ACE inhibitors and independently that ACE inhibitors and ARB’sARB’scan both decrease can both decrease
proteinuria proteinuria the rate of progression of CKD in type II diabetesthe rate of progression of CKD in type II diabetes
Prior to this study there was no head to head Prior to this study there was no head to head study comparing an ACE inhibitor and an ARB study comparing an ACE inhibitor and an ARB Editorials have asked for such a studyEditorials have asked for such a study

Study DesignStudy Design
Perspective randomized doublePerspective randomized double--blind, doubleblind, double--dummy dummy parallel group study at 39 Centers in Northern Europe. parallel group study at 39 Centers in Northern Europe. Subjects Subjects
Age Age -- 3535--8080Race Race –– white or Asianwhite or AsianSex Sex –– Female or maleFemale or male
Type II diabetes treated by diet or diet plus medicationsType II diabetes treated by diet or diet plus medicationsMild to moderate hypertension with resting blood Mild to moderate hypertension with resting blood pressure of less than 180/95 on treatmentpressure of less than 180/95 on treatmentUrine albumin excretion rate between 11 and 999 Urine albumin excretion rate between 11 and 999 µµgg/min /min Glycosylated hemoglobin less than 12%Glycosylated hemoglobin less than 12%Serum creatinine < 1.6 mg/dlSerum creatinine < 1.6 mg/dl

Baseline Characteristics of the SubjectsBaseline Characteristics of the Subjects
8.08.08.08.0Diabetes durationDiabetes duration
60.060.046.246.2Urine albuminUrine albumin
0.990.991.021.02Serum creatinine Serum creatinine –– mg/dlmg/dl
94.394.391.491.4GFR GFR –– ml/min/1.73 m2ml/min/1.73 m2
30.630.630.830.8BMIBMI
95 (73.1)95 (73.1)87(72.5)87(72.5)Male sex Male sex –– no of subjects (%)no of subjects (%)
60.060.061.261.2Age Age –– yryr
EnalaprilEnalapril GroupGroup(N=130)(N=130)
TelmisartanTelmisartan GroupGroup(N=120)(N=120)
VariableVariable

Secondary Renal End Points after Secondary Renal End Points after Five Years of TreatmentFive Years of Treatment
1.04 (0.71 to 1.51)1.04 (0.71 to 1.51)0.990.991.031.03Urinary albumin Urinary albumin excretion (ratio)excretion (ratio)
0 (0 (--0.66 to 0.65)0.66 to 0.65)0.100.100.100.10Serum creatinine Serum creatinine (mg/dl)(mg/dl)
EnalaprilEnalaprilGroupGroup
TelmisartanTelmisartanGroupGroup
Difference Difference between Groups between Groups
(95% CI)(95% CI)Change from BaselineChange from BaselineEnd PointEnd Point

Discussion Discussion
Both Both ARB’sARB’s and ACE inhibitors have and ACE inhibitors have previously been shown to delay previously been shown to delay progression of renal dysfunction and progression of renal dysfunction and chronic kidney disease. chronic kidney disease. In this study no significant difference was In this study no significant difference was found between found between ARB’sARB’s and ACE inhibitors and ACE inhibitors in preventing progression of kidney in preventing progression of kidney disease in patient with type II diabetes and disease in patient with type II diabetes and early indications of chronic kidney disease early indications of chronic kidney disease

Interventions to slow the progression Interventions to slow the progression disease should be considered in all disease should be considered in all patients with chronic disease. patients with chronic disease. Interventions that have proven to be Interventions that have proven to be effective include: effective include:
1.1. Strict glucose control in diabetes Strict glucose control in diabetes 2.2. Strict blood pressure control Strict blood pressure control 3.3. ACE inhibitors and/or ACE inhibitors and/or ARBsARBs
Guideline 13Guideline 13

Wolfgang C. Winkelmayer, Raisa Levin, and Jerry AvornWolfgang C. Winkelmayer, Raisa Levin, and Jerry AvornDivision of Pharmacoepidemiology and Pharmacoeconomics, Division of Pharmacoepidemiology and Pharmacoeconomics,
Department of Medicine, Brigham and Women’s Hospital, Department of Medicine, Brigham and Women’s Hospital, Harvard Medical School, Boston, Massachusetts Harvard Medical School, Boston, Massachusetts
Kidney International 2003;63:1836Kidney International 2003;63:1836--18421842
The nephrologist’s role in the The nephrologist’s role in the management of calcium management of calcium
phosphorous metabolism in phosphorous metabolism in patients with chronic kidney patients with chronic kidney
diseasedisease

Methods Methods
In this cohort study, 314 patients with In this cohort study, 314 patients with chronic kidney disease were evaluated for chronic kidney disease were evaluated for indicators of calcium phosphorus indicators of calcium phosphorus metabolism management prior to renal metabolism management prior to renal replacement therapy replacement therapy
PTH measurement PTH measurement Vitamin D metabolites Vitamin D metabolites Receipt of Receipt of calcitriolcalcitriol or calcium containing or calcium containing phosphate bindersphosphate binders
Methods Methods
Pharmaceutical records were searched for Pharmaceutical records were searched for the year prior to the onset of RRT.the year prior to the onset of RRT.Patients who had appropriate testing were Patients who had appropriate testing were compared with those who did not have compared with those who did not have testing. testing. Variables included demographic variables Variables included demographic variables and visits with nephrologists. and visits with nephrologists.

Measured parametersMeasured parameters
PTH Testing PTH Testing Tested patients were 68% more likely to see a Tested patients were 68% more likely to see a nephrologist than controls. nephrologist than controls.
Calcitriol Calcitriol Recipients were 6 times as likely to see a Recipients were 6 times as likely to see a nephrologists than nonnephrologists than non--recipients. recipients.
Calcium Containing Binder Prescriptions Calcium Containing Binder Prescriptions Recipients were 6.5 times more likely to see a Recipients were 6.5 times more likely to see a nephrologist.nephrologist.

Effect of management of Effect of management of calciumcalcium--phosphate metabolism phosphate metabolism
on 1on 1--year mortality year mortality
Multivariate Analyses
<0.0010.51-0.840.65Presence of any calcium-phosphate care measure prior to first RRT
0.051.00-1.481.22Late vs. early referralP value
95%Confidence
intervalOdds ratioModel

SummarySummary
Generalist physicians are less likely than Generalist physicians are less likely than nephrologists to manage calcium nephrologists to manage calcium phosphorous metabolism in CKDphosphorous metabolism in CKDWe have long known that managing We have long known that managing calcium and phosphorous is important for calcium and phosphorous is important for bone diseasebone diseaseThese data suggest that it may decrease These data suggest that it may decrease cardiovascular disease. cardiovascular disease.

Bone Disease and disorders of calcium Bone Disease and disorders of calcium phosphorous metabolism develop during the phosphorous metabolism develop during the course of chronic disease and are course of chronic disease and are associated with adverse outcomes. associated with adverse outcomes.
Patients with GFR less than 60 should be Patients with GFR less than 60 should be evaluated for bone disease and disorders of evaluated for bone disease and disorders of calcium and phosphorous metabolism calcium and phosphorous metabolism Patients with either bone disease or disorders of Patients with either bone disease or disorders of calcium phosphorous metabolism should be calcium phosphorous metabolism should be evaluated and treated.evaluated and treated.
Guideline #10 Guideline #10

Association of Hematocrit Association of Hematocrit value with cardiovascular value with cardiovascular morbidity and mortality in morbidity and mortality in
incident hemodialysis patientsincident hemodialysis patients
SuyingSuying Li and Allan J. Collins Li and Allan J. Collins Nephrology Analytical Services, Minneapolis Medical Nephrology Analytical Services, Minneapolis Medical
Research Foundation and University of Minnesota, Research Foundation and University of Minnesota, Minneapolis, MinnesotaMinneapolis, Minnesota
Kidney International 2004;65:626Kidney International 2004;65:626--633633

Analysis of incident hemodialysis patients. Analysis of incident hemodialysis patients. Patients divided into groups on the basis Patients divided into groups on the basis of initial of initial hcthct at hemodialysis initiation. at hemodialysis initiation. Outcome measures include hospitalization Outcome measures include hospitalization (up to 2.5 years) and mortality (up to 3 (up to 2.5 years) and mortality (up to 3 years) years)
MethodsMethods

Adjusted relative risk of first Adjusted relative risk of first hospitalization due to any cardiac hospitalization due to any cardiac
cause, according to hematocrit valuecause, according to hematocrit value

Summary Summary
This analysis supports previous analyses which This analysis supports previous analyses which shows that preshows that pre--dialysis hematocrit is related to dialysis hematocrit is related to cardiovascular morbidity and mortality. cardiovascular morbidity and mortality. Currently nephrologists have switched primarily Currently nephrologists have switched primarily to using hemoglobin rather than hematocrit as a to using hemoglobin rather than hematocrit as a better and more reliable predictor of outcomes. better and more reliable predictor of outcomes. The correct hemoglobin/hematocrit targets for The correct hemoglobin/hematocrit targets for treating anemia in chronic kidney disease treating anemia in chronic kidney disease remain controversial.remain controversial.

Treating Anemia early in Treating Anemia early in renal failure patients slows renal failure patients slows
the decline of renal function: the decline of renal function: A randomized controlled trialA randomized controlled trial
CharicliaChariclia GouvaGouva, , PetrosPetros NikolopoulosNikolopoulos, John , John Ioannidis, and Ioannidis, and KostasKostas SiamopoulosSiamopoulos
Kidney International 2004; 66:753Kidney International 2004; 66:753--760760

MethodsMethods
Randomized control trial comparing Randomized control trial comparing subcutaneous erythropoietin vs. placebo subcutaneous erythropoietin vs. placebo for treating anemia in CKDfor treating anemia in CKD

Eligibility Criteria Eligibility Criteria
Chronic kidney disease not caused by Chronic kidney disease not caused by diabetes mellitus. diabetes mellitus. Serum creatinine 2Serum creatinine 2--6 mg/6 mg/dLdLHemoglobin 9Hemoglobin 9--11.6 11.6 g/dLg/dLAbsence of a variety of contraindications Absence of a variety of contraindications to this study to this study

Endpoints Endpoints
Progression of chronic kidney disease Progression of chronic kidney disease ––defined as a doubling of creatinine, a defined as a doubling of creatinine, a creatinine > 8, or initiation of renal creatinine > 8, or initiation of renal replacement therapy replacement therapy -- or death from any or death from any causecauseSecondary endpoints: hemoglobin, serum Secondary endpoints: hemoglobin, serum creatinine, and creatinine clearance at 12 creatinine, and creatinine clearance at 12 monthsmonths

Baseline CharacteristicsBaseline Characteristics
0.1422.3 (6.0)25.7 (9.1)Creatinine clearance, mean (SD), mL/min
0.273.39 (0.82)3.27 (0.99)Serum creatinine, mean (SD), mg/dL
0.7210.1 (0.6)10.1 (0.5)Hemoglobin, mean (SD), g/dL
0.4464.2 (12.2)66.7 (10.4)Age, mean (SD), years
0.9818/2520/25Female/male
P value Deferred arm N = 43
Early arm N = 45

HematologicHematologic and renal and renal parameters at 12 monthsparameters at 12 months
<0.001<0.00116.1 (6.3)16.1 (6.3)21.9 (9.4)21.9 (9.4)Creatinine clearance, mean (SD), mL/min
<0.001<0.0015.07 (2.39)5.07 (2.39)3.81 (1.43)3.81 (1.43)Serum creatinine, mean (SD), mg/dL
<0.001<0.00131.4 (2.6)31.4 (2.6)38.4 (1.5)38.4 (1.5)Hematocrit,
mean (SD), %
<0.001<0.00110.3 (1.0)10.3 (1.0)12.9 (0.4)12.9 (0.4)Hemoglobin,mean (SD), g/dL
P valueP valueDeferred armDeferred armEarly armEarly arm


ImplicationsImplications
This RCT suggests that erythropoietin may This RCT suggests that erythropoietin may decrease the progression of CKD in anemic decrease the progression of CKD in anemic patients patients Thus we must consider adding erythropoietin Thus we must consider adding erythropoietin treatment to blood pressure control and treating treatment to blood pressure control and treating proteinuria as methods to delay progression of proteinuria as methods to delay progression of kidney disease kidney disease This study is not a definitive studyThis study is not a definitive study but rather a but rather a small study of CKD patientssmall study of CKD patients

Guideline 8Guideline 8
Anemia usually develops during the course of Anemia usually develops during the course of CKD and may be associated with adverse CKD and may be associated with adverse outcomesoutcomes
Patients with GFR less than 60 should be evaluated Patients with GFR less than 60 should be evaluated for anemia by measuring hemoglobin.for anemia by measuring hemoglobin.Anemia in CKD should be treatedAnemia in CKD should be treatedThe guideline for treating anemia states that the The guideline for treating anemia states that the current target for hemoglobin is 11current target for hemoglobin is 11--1212This target refers to erthryopoietin therapy and does This target refers to erthryopoietin therapy and does not imply an indication for blood transfusion. not imply an indication for blood transfusion.

Delayed nephrologist referral Delayed nephrologist referral and inadequate vascular and inadequate vascular access in patients with access in patients with
advanced chronic kidney failureadvanced chronic kidney failure
Jerry Jerry AvornAvorn, Wolfgang C. , Wolfgang C. WinkelmayerWinkelmayer, Rhonda L. Bohn, , Rhonda L. Bohn, RaisaRaisa Levin, Robert J. Glynn, Elliot Levy, William Owen, Jr. Levin, Robert J. Glynn, Elliot Levy, William Owen, Jr.
Journal of Clinical Epidemiology 55(2002) 711Journal of Clinical Epidemiology 55(2002) 711--716716

Study DesignStudy Design
This epidemiological study used Medicare and Medicaid This epidemiological study used Medicare and Medicaid databases to exam patients who had been seen for at databases to exam patients who had been seen for at least 12 months prior to initiating dialysis. least 12 months prior to initiating dialysis. Patients had to have at least 1 month of dialysis Patients had to have at least 1 month of dialysis following the index procedure and regular continuing following the index procedure and regular continuing claims for dialysis. claims for dialysis.

Covariate Analysis Covariate Analysis
Covariates include:Covariates include:Demographics: age, gender, race, SESDemographics: age, gender, race, SESFrequency of visits with a nephrologistFrequency of visits with a nephrologistCoCo--morbid conditions morbid conditions

Referral Patterns Referral Patterns
Later referral Later referral –– patient having a first nephrologist patient having a first nephrologist encounter less than 90 days prior to initiation of encounter less than 90 days prior to initiation of maintenance dialysis maintenance dialysis Frequency of nephrologist care Frequency of nephrologist care –– dichotomized as to dichotomized as to greater than or less than 3 visits in the previous yeargreater than or less than 3 visits in the previous year

Results Results
Early referral to a nephrologist was strongly predictive of Early referral to a nephrologist was strongly predictive of starting dialysis with permanent vascular access starting dialysis with permanent vascular access Similarly frequent nephrology visits also predicted this Similarly frequent nephrology visits also predicted this Unexpectedly, AfricanUnexpectedly, African--Americans were more likely to Americans were more likely to have permanent vascular access placed prior to dialysishave permanent vascular access placed prior to dialysisAll of these associations remained after controlling for All of these associations remained after controlling for coco--morbidity and renal diagnosesmorbidity and renal diagnoses

Context Context
Since we know that patients who have adequate Since we know that patients who have adequate vascular access do much better initially with dialysis vascular access do much better initially with dialysis --requiring shorter hospitalizations and less health care requiring shorter hospitalizations and less health care expenditures expenditures -- this study strongly reinforces the need for this study strongly reinforces the need for early nephrology referral in patients who are progressing early nephrology referral in patients who are progressing toward ESRDtoward ESRD

GuidelineGuideline
Timing of access placement Timing of access placement Patients with CKD should be referred to construct primary AV fistula when their clearance increases below 25cc/min, their serum creatinine is greater 4mg/dl, or within 1 year of the anticipated need of dialysis

Prevalence of Acidosis and inflammation and their association with low serum albumin in chronic
kidney disease
Joseph A. Eustace, Brad Astor, Paul M. Muntner, T. Alp Ikizler, and Josef Coresh
Kidney International 2004; 65: 1031-1040

Study Design
This is an analysis of NHANES III (National Health and This is an analysis of NHANES III (National Health and Nutrition Examination Survey)Nutrition Examination Survey)This study evaluated the relationship between markers This study evaluated the relationship between markers of inflammation, serum bicarbonate and serum albumin of inflammation, serum bicarbonate and serum albumin levelslevels

Multivariate analysis
Multivariate analysis showed strong relationship between Multivariate analysis showed strong relationship between serum bicarbonate levels and serum albumin levels as serum bicarbonate levels and serum albumin levels as well as between CRP levels and albumin levelswell as between CRP levels and albumin levels

Context
Hypoalbuminemia in CKD can reflect nutritional status.Hypoalbuminemia in CKD can reflect nutritional status.As kidney disease progresses, nutritional status can As kidney disease progresses, nutritional status can worsenworsenExperimental data suggests that acidosis may lead to Experimental data suggests that acidosis may lead to malnutritionmalnutritionWe do not have a study that looks at the potential We do not have a study that looks at the potential benefits of treating acidosis in chronic kidney disease benefits of treating acidosis in chronic kidney disease patientspatients

Guideline on metabolic acidosis
In chronic kidney disease patients staged In chronic kidney disease patients staged III, IV and V, the serum levels of III, IV and V, the serum levels of bicarbonate should be maintained at 22 bicarbonate should be maintained at 22 mEqmEq/L/L

Patient Presentation Patient Presentation
WD is a 51 YOBM with long history of diabetes WD is a 51 YOBM with long history of diabetes mellitus. He is admitted to the VA Hospital with mellitus. He is admitted to the VA Hospital with left leg cellulitis. Review of his lab work left leg cellulitis. Review of his lab work including the following important labs:including the following important labs:
Hemoglobin 10.3 Calcium 7.7Hematocrit 30.7 Albumin 2.8
2.12.119195.95.92828112112137137
236

Review of his laboratory data shows that Review of his laboratory data shows that they were similar to previous values they were similar to previous values 24 hour urine protein done one month 24 hour urine protein done one month prior to admission showed 2 grams of prior to admission showed 2 grams of protein in 24 hoursprotein in 24 hours. . Urine sodium 110 and urine potassium 22 Urine sodium 110 and urine potassium 22 with urine chloride of 156.with urine chloride of 156.PTH PTH –– 297 297
More clinical informationMore clinical information

Issues CoveredIssues Covered
Delaying progression of chronic kidney Delaying progression of chronic kidney disease disease Bone Disease Bone Disease Anemia Anemia Vascular Access Vascular Access Acidosis Acidosis

OmissionsOmissions
Cardiovascular risk factorsCardiovascular risk factorsHypertension controlHypertension controlDiabetes managementDiabetes management

Summary Summary
Most physicians do not treat all the Most physicians do not treat all the potential complications of CKDpotential complications of CKDThe early diagnosis of Stage III CKD The early diagnosis of Stage III CKD presents us with an opportunity to modify presents us with an opportunity to modify subsequent morbidity subsequent morbidity Primary care physicians should develop a Primary care physicians should develop a “checklist” for managing these patients, “checklist” for managing these patients, including timely nephrology referral including timely nephrology referral

My Stage III CKD checklistMy Stage III CKD checklist
Determine GFRDetermine GFRUse either Use either CockcroftCockcroft--GaultGault or MDRDor MDRDIf data available If data available –– plot progressionplot progression
Proteinuria Proteinuria Check for proteinuriaCheck for proteinuriaIf present use ACE inhibitors and If present use ACE inhibitors and ARBsARBs to to decreasedecrease

Checklist 2Checklist 2
AnemiaAnemiaFollow hemoglobinFollow hemoglobinIf less than 12 refer to nephrology for possible If less than 12 refer to nephrology for possible EPOEPO
Mineral metabolismMineral metabolismCheck calcium, phosphate and PTH levelsCheck calcium, phosphate and PTH levelsIf abnormal, either start calcium replacement If abnormal, either start calcium replacement (either calcium carbonate or calcium acetate), (either calcium carbonate or calcium acetate), or refer to nephrology for managementor refer to nephrology for management

Checklist 3Checklist 3
AcidosisAcidosisIf bicarbonate < 22, then start either calcium If bicarbonate < 22, then start either calcium carbonate (when needed for mineral carbonate (when needed for mineral metabolism) or metabolism) or Shohl’sShohl’s or or bicitrabicitra solution with solution with goal bicarbonate of 22goal bicarbonate of 22
AccessAccessRefer to nephrology when ESRD expected in Refer to nephrology when ESRD expected in 1 year or less (either from progression plot or 1 year or less (either from progression plot or low GFR)low GFR)

Checklist 4Checklist 4
HypertensionHypertensionTreat aggressively Treat aggressively –– goal BP 120/80goal BP 120/80
LipidsLipidsTreat aggressively Treat aggressively –– goal LDL 70goal LDL 70
DiabetesDiabetesWork to achieve excellent HgbA1CWork to achieve excellent HgbA1C

CHRONIC KIDNEY DISEASE: CHRONIC KIDNEY DISEASE: RELATIONSHIP OF RELATIONSHIP OF NEPHROLOGIST NEPHROLOGIST
INVOLVEMENT AND DISEASE INVOLVEMENT AND DISEASE COURSE COURSE Lori A. Orlando, MDLori A. Orlando, MD
David B. Matchar, MD FACPDavid B. Matchar, MD FACP
Duke University Center for Clinical Health Policy Research Duke University Center for Clinical Health Policy Research & Durham VA, Durham NC& Durham VA, Durham NC

Chronic Kidney Disease (CKD)Chronic Kidney Disease (CKD)PopulationPopulation
CKD: 20 million patients (10% of US CKD: 20 million patients (10% of US population)population)ESRD: 430,000 patients in 2002ESRD: 430,000 patients in 2002Incidence of both still increasing Incidence of both still increasing
EconomicsEconomics$17 billion per year in Medicare expenditures$17 billion per year in Medicare expenditures⇒⇒ Projected to be $40 billion per year by Projected to be $40 billion per year by
20102010USRDS 2004 annual report at www.usrds.org, Coresh J. 41(1):1-12, Trivedi HS. AJKD 39(4):721-9

Management of CKDManagement of CKD
Improving management of CKD can:Improving management of CKD can:Increase survival in CKDIncrease survival in CKDProlong development of ESRDProlong development of ESRDImprove morbidity and mortality of ESRDImprove morbidity and mortality of ESRD
Early referral to nephrologist may improve outcomesEarly referral to nephrologist may improve outcomes
Retrospective studies of dialysis populationsRetrospective studies of dialysis populationsDichotomized referral time (1Dichotomized referral time (1--6 months pre6 months pre--dialysis)dialysis)
Nephrologists have limited capacity for preNephrologists have limited capacity for pre--ESRD careESRD care

ObjectiveObjective
To examine the relationship between the To examine the relationship between the stage of CKD at which a nephrologist stage of CKD at which a nephrologist becomes involved and disease becomes involved and disease progression or deathprogression or death
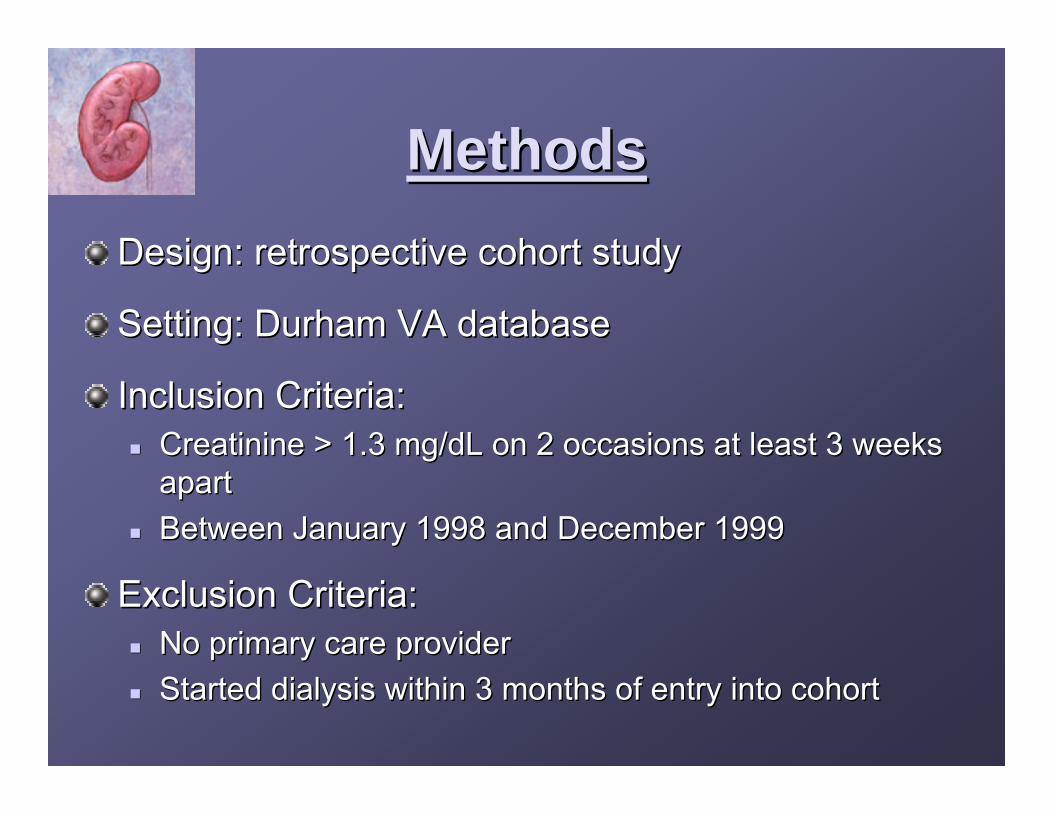
MethodsMethodsDesign: retrospective cohort study Design: retrospective cohort study
Setting: Durham VA databaseSetting: Durham VA database
Inclusion Criteria: Inclusion Criteria: Creatinine > 1.3 mg/dL on 2 occasions at least 3 weeks Creatinine > 1.3 mg/dL on 2 occasions at least 3 weeks apart apart Between January 1998 and December 1999Between January 1998 and December 1999
Exclusion Criteria:Exclusion Criteria:No primary care providerNo primary care providerStarted dialysis within 3 months of entry into cohortStarted dialysis within 3 months of entry into cohort

DefinitionsDefinitionsCalculated GFRCalculated GFR
Serum creatinines through December 2003Serum creatinines through December 2003Modified MDRD formula*Modified MDRD formula*
CKD stageCKD stage::Stage 1: GFR > = 90 ml/min with proteinuriaStage 1: GFR > = 90 ml/min with proteinuriaStage 2: GFR < 90 ml/min and > = 60 ml/min with Stage 2: GFR < 90 ml/min and > = 60 ml/min with proteinuriaproteinuriaStage 3: GFR < 60 ml/min and > = 30 ml/minStage 3: GFR < 60 ml/min and > = 30 ml/minStage 4: GFR < 30 ml/min and > = 15 ml/minStage 4: GFR < 30 ml/min and > = 15 ml/minStage 5: GFR < 15 ml/min or on dialysisStage 5: GFR < 15 ml/min or on dialysis††
* Modified MDRD equation uses age, sex, race, and serum creatinine† Dialysis identified by chart review of all patients with Stage > 3

GFRGFRLocal DHCP laboratory databaseLocal DHCP laboratory database
Demographics, comorbidities, deathDemographics, comorbidities, deathAustin national inpatient databaseAustin national inpatient databaseAustin national benefits databaseAustin national benefits database
ManagementManagementMedications: Local DHCP pharmacy databaseMedications: Local DHCP pharmacy databaseNephrologist care: Austin national outpatient Nephrologist care: Austin national outpatient databasedatabase
Data SourcesData Sources

Data SourcesData Sources
CKD complicationsCKD complicationsLocal DHCP laboratory databaseLocal DHCP laboratory database
Hypocalcemia (calcium < 8.5 mg/dL)Hypocalcemia (calcium < 8.5 mg/dL)
Hyperphosphatemia (phosphate > 4.5 mg/dL)Hyperphosphatemia (phosphate > 4.5 mg/dL)
Anemia (hemoglobin < 12 mg/dL)Anemia (hemoglobin < 12 mg/dL)
Hypoalbuminemia (albumin < 4.0 mg/dL)Hypoalbuminemia (albumin < 4.0 mg/dL)

AnalysisAnalysisCreated two groups: PCPCreated two groups: PCP--only and nephrologyonly and nephrology
Cox proportional Hazards AnalysisCox proportional Hazards AnalysisTime spent in each stageTime spent in each stage
Time spent in early CKD (stages 1Time spent in early CKD (stages 1--3)3)
Time calculated from first date reached a stage Time calculated from first date reached a stage to first date reached higher stage or diedto first date reached higher stage or died
Adjusted for comorbidity, demographics, Adjusted for comorbidity, demographics, medications, complications and propensity to see medications, complications and propensity to see a nephrologista nephrologist

ResultsResults

Population CharacteristicsPopulation Characteristics
Total Nephrology PCP-only p-value
Number 1553 456 1097
Days of follow-up (mean) 1296 1310 1285 0.3
Age (range) 70 (26-98) 68.7 70.3 0.01
Black race (%) 32% 33% 32% 0.77
Hospitalizations, mean (range) 2.6 (0-28) 2.8 2.5 0.03
Clinic visits, mean (range) 141 (7-1412) 170 129 0.0001
Lipid lowering agents (%) 39% 43% 38% 0.58
ACEIs (%) 52% 51% 52% 0.07

Population Characteristics contPopulation Characteristics cont Total Nephrology PCP-only p-value
Diabetes (%) 52% 58% 49% 0.002
Hypertension (%) 92% 98% 90% 0.0001
Mean blood pressure <140/90(%) 37% 41% 36% 0.06
Proteinuria (%) 89% 75% 58% 0.0001
Tobacco use (%) 21% 21% 21% 1
Coronary Artery Disease (%) 49% 56% 57% 0.49
Hyperlipidemia (%) 24% 25% 24% 0.6
Hypocalcemia (%) 6% 6% 6% 0.82
Anemia (%) 9% 10% 9% 0.63
Hyperphosphatemia (%) 6% 9% 5% 0.006
Hypoalbuminemia (%) 50% 59% 49% 0.0002

DeatDeathh
ProgrProgr
BothBoth
17%17%23%23%
62%62%45%45%
73%73%68%68%
NephNephPCPPCP

DeatDeathh
ProgrProgr
BothBoth
35%35%31%31%
25%25%31%31%
60%60%62%62%
NephNephPCPPCP

DeatDeathh
ProgrProgr
BothBoth
36%36%63%63%
27%27%7%7%
63%63%69%69%
NephNephPCPPCP

DeatDeathh
ProgrProgr
BothBoth
43%43%71%71%
29%29%14%14%
72%72%86%86%
NephNephPCPPCP

DeatDeathh
ProgrProgr
BothBoth
25%25%33%33%
25%25%17%17%
50%50%50%50%
NephNephPCPPCP

DeatDeathh
ProgrProgr
BothBoth
33%33%47%47%
15%15%2%2%
49%49%49%49%
NephNephPCPPCP

SummarySummary
Those followed by a nephrologist at CKD Those followed by a nephrologist at CKD stages stages ≥≥3 had less disease progression and 3 had less disease progression and fewer deaths fewer deaths
⇒⇒ Supports guideline recommendations for Supports guideline recommendations for early referralearly referral
Mortality is profoundMortality is profoundAt CKD stages At CKD stages ≥≥ 2 more people died than progressed2 more people died than progressed

LimitationsLimitations
Retrospective study designRetrospective study designReliance on ICDReliance on ICD--9 codes for comorbidities9 codes for comorbiditiesLoss of patients as they leave the systemLoss of patients as they leave the system
Creatinine rather than GFR used to identify Creatinine rather than GFR used to identify cohortcohort
Unable to account for unmeasured bias in Unable to account for unmeasured bias in referral to nephrologistsreferral to nephrologists

Survival AnalysisSurvival Analysis
Stage 1 to 2 Stage 2 to 3 Stage 3 to 4 Stage 4 to 5
Stage 5 to
ESRD
Unadjusted median days to endpoint 1149 1206 1158 794 709
PCP-only vs Nephrology p-value 0.41 0.32 <0.0001 0.03 NA
Number PCP-only group 995 624 209 28 6
No. with CKD progression 445 156 14 4 1
No. died 231 217 131 20 2
No. with composite endpoint (%) 676 (68%) 376 (60%) 145 (69%) 24 (86%) 3 (50%)
Number Nephrology group 222 263 207 58 20
No. with CKD progression 138 120 56 17 5
No. died 24 53 74 25 5
No. with composite endpoint (%) 162 (73%) 173 (65%) 130 (63%) 42 (72%) 10 (50%)

Survival Analysis Hazard Survival Analysis Hazard RatiosRatios
Stage 1 to 2 Stage 2 to 3 Stage 3 to 4 Stage 4 to 5
Pre-ACKD to
ACKD
Age 1 1.01 1 1.02 1
Race 0.71* 0.89 1.11 1.24 0.82*
ACEI 1.1 0.62* 0.68* 0.96 0.53
ACEI started during stage 0.73* 1.13 1.03 2.14 NA
Anti-lipid medications 0.64* 0.57* 0.54* 0.71 0.46*
Diabetes 1.32* 1.18 1.13 NA 1.31*
Hypertension 0.8 0.9 0.9 NA 0.85
Tobacco use 1 0.79 0.92 NA 0.89
Vascular Disease 1.35* 1.52* 0.86 NA 1.54*
High HgA1c 1.14 1.28* 1.53* NA 1.33*
Positive Urine Protein 1 1 1.12 NA 1.46*

BACKGROUND: BACKGROUND: Chronic kidney disease (CKD) affects 11% of the U.S. population,Chronic kidney disease (CKD) affects 11% of the U.S. population, about 20 million people. about 20 million people. Improving the management of CKD increases survival in those withImproving the management of CKD increases survival in those with CKD, prolongs development of endCKD, prolongs development of end--stage stage renal disease (ESRD), and improves morbidity and mortality once renal disease (ESRD), and improves morbidity and mortality once ESRD develops. Slowing progression and ESRD develops. Slowing progression and delaying ESRD are now more important than ever as the incidence delaying ESRD are now more important than ever as the incidence of CKD is increasing, in large part due to of CKD is increasing, in large part due to an increasing prevalence of CKD risk factors such as age, hypertan increasing prevalence of CKD risk factors such as age, hypertension, and diabetes. These concerns have ension, and diabetes. These concerns have lead investigators to retrospectively evaluate the timing of neplead investigators to retrospectively evaluate the timing of nephrology referral on the morbidity and mortality of hrology referral on the morbidity and mortality of dialysis populations. Based upon the results of these preliminardialysis populations. Based upon the results of these preliminary studies, experts have recommended early y studies, experts have recommended early referral to nephrology specialists. However, widespread implemenreferral to nephrology specialists. However, widespread implementation has been limited by the capacity of tation has been limited by the capacity of currently practicing nephrologists. To better evaluate the exactcurrently practicing nephrologists. To better evaluate the exact role and timing of nephrology intervention we role and timing of nephrology intervention we examined the relationship between the severity of CKD, the preseexamined the relationship between the severity of CKD, the presence of subspecialty care, and progression in nce of subspecialty care, and progression in a prea pre--ESRD population.ESRD population.METHODS: METHODS: We retrospectively identified a cohort of veterans with primary We retrospectively identified a cohort of veterans with primary care providers at the Durham, NC care providers at the Durham, NC VA hospital who had CKD, defined as two abnormal outpatient seruVA hospital who had CKD, defined as two abnormal outpatient serum m creatininescreatinines (> 1.3 mg/(> 1.3 mg/dLdL) at least 3 ) at least 3 weeks apart between January 1, 1998 and December 31, 1999. We gaweeks apart between January 1, 1998 and December 31, 1999. We gathered data from cohort inception until thered data from cohort inception until December 31, 2004 on disease course, CKDDecember 31, 2004 on disease course, CKD--related complications, medications, related complications, medications, comorbiditiescomorbidities, and mortality. , and mortality. Disease course, the time spent in each CKD stage, was evaluated Disease course, the time spent in each CKD stage, was evaluated using a Cox proportional hazards model using a Cox proportional hazards model adjusted for demographics, adjusted for demographics, comorbiditescomorbidites, medications, and a propensity score for two groups: those foll, medications, and a propensity score for two groups: those followed owed by a primary care provider only and those followed by a by a primary care provider only and those followed by a nephrologistnephrologist. We used the propensity score to adjust . We used the propensity score to adjust for bias in patients referred to nephrologists.for bias in patients referred to nephrologists.RESULTS: RESULTS: We found 1,553 veterans with CKD, a prevalence of 13%. The mean We found 1,553 veterans with CKD, a prevalence of 13%. The mean age was 70 years, all were age was 70 years, all were male, 33% were Africanmale, 33% were African--American, >90% had hypertension and >50% had diabetes and coronaAmerican, >90% had hypertension and >50% had diabetes and coronary artery ry artery disease. 50% used disease. 50% used angiotensinangiotensin converting enzyme inhibitors (ACEI) and less than 3% used erythconverting enzyme inhibitors (ACEI) and less than 3% used erythropoietin. ropoietin. The median number of days spent in each CKD stage was as followsThe median number of days spent in each CKD stage was as follows: stage 1 : stage 1 --1,149, stage 2 1,149, stage 2 --1,206, stage 3 1,206, stage 3 --1,158, stage 4 1,158, stage 4 --794, and stage 5 794, and stage 5 --709. There was no difference in survival between the two groups 709. There was no difference in survival between the two groups during during stage 1 or 2; but during stages 3 through 5 individuals in the nstage 1 or 2; but during stages 3 through 5 individuals in the nephrology group spent an average of 152 days ephrology group spent an average of 152 days more in each stage. more in each stage. ACEIsACEIs and and statinsstatins slowed progression while HgbA1c values>7.0% and vascular diseasslowed progression while HgbA1c values>7.0% and vascular disease e accelerated it.accelerated it.CONCLUSIONS: CONCLUSIONS: These data suggest that an appropriate time for referral to a These data suggest that an appropriate time for referral to a nephrologistnephrologist for patients with for patients with CKD may be around stage 3. Prospective studies are needed to furCKD may be around stage 3. Prospective studies are needed to further clarify the role and timing of ther clarify the role and timing of nephrologists in the early stages of CKD.nephrologists in the early stages of CKD.