Embed Size (px)
Citation preview

HEALTHY PEOPLE 2020 MIDCOURSE REVIEW
CHAPTER 6
Chronic Kidney Disease (CKD)
Lead Agencies Centers for Disease Control and Prevention National Institutes of Health
Contents Goal 6–2 Status of Objectives 6–2 Figure 6–1. Midcourse Status of the Chronic Kidney Disease Objectives 6–2 Selected Findings 6–2 More Information 6–5 Footnotes 6–5 Suggested Citation 6–6 Table 6–1. Chronic Kidney Disease Objectives 6–7 Table 6–2. Midcourse Progress for Measurable Chronic Kidney Disease Objectives 6–10 Table 6–3. Midcourse Health Disparities for Population-based Chronic Kidney Disease Objectives 6–13
Map 6–1. New Cases of End-stage Renal Disease, by State: 2012 6–17 Map 6–2. New Hemodialysis Patients (18+ years) Who Used Arteriovenous Fistulas as Primary Vascular Access Mode, by State: 2012 6–18
Map 6–3. Total Deaths Among Persons on Dialysis, by State: 2012 6–19

6–2 HEALTHY PEOPLE 2020 MIDCOURSE REVIEW
Goal: Reduce new cases of chronic kidney disease (CKD) and its complications, disability, death, and economic costs.
This chapter includes objectives that monitor the incidence, prevalence, and mortality from chronic kidney disease and end-stage renal disease; cardiovascular care for persons with chronic kidney disease; and recommended medical evaluation and treatment for patients with chronic kidney disease. The Reader’s Guide provides a step-by-step explanation of the content of this chapter, including criteria for highlighting objectives in the Selected Findings.1
Status of Objectives Figure 6–1. Midcourse Status of the Chronic Kidney Disease Objectives
Measurable Objectives: 24
Informational 8.3% (n = 2)
Target met or exceeded
37.5% (n = 9)
Improving 29.2% (n = 7)
Getting worse 8.3%(n = 2)
Little or no detectable
change 16.7%(n = 4)
Total Objectives: 24
Measurable 100.0% (n = 24)
All 24 objectives in the Chronic Kidney Disease Topic Area were measurable2 (Figure 6–1, Table 6–1). The midcourse status of these objectives (Table 6–2) was as follows:
� 9 objectives had met or exceeded their 2020 targets,3
� 7 objectives were improving,4
� 4 objectives had demonstrated little or no detectable change,5
� 2 objectives were getting worse,6 and � 2 objectives were informational.7
Selected Findings
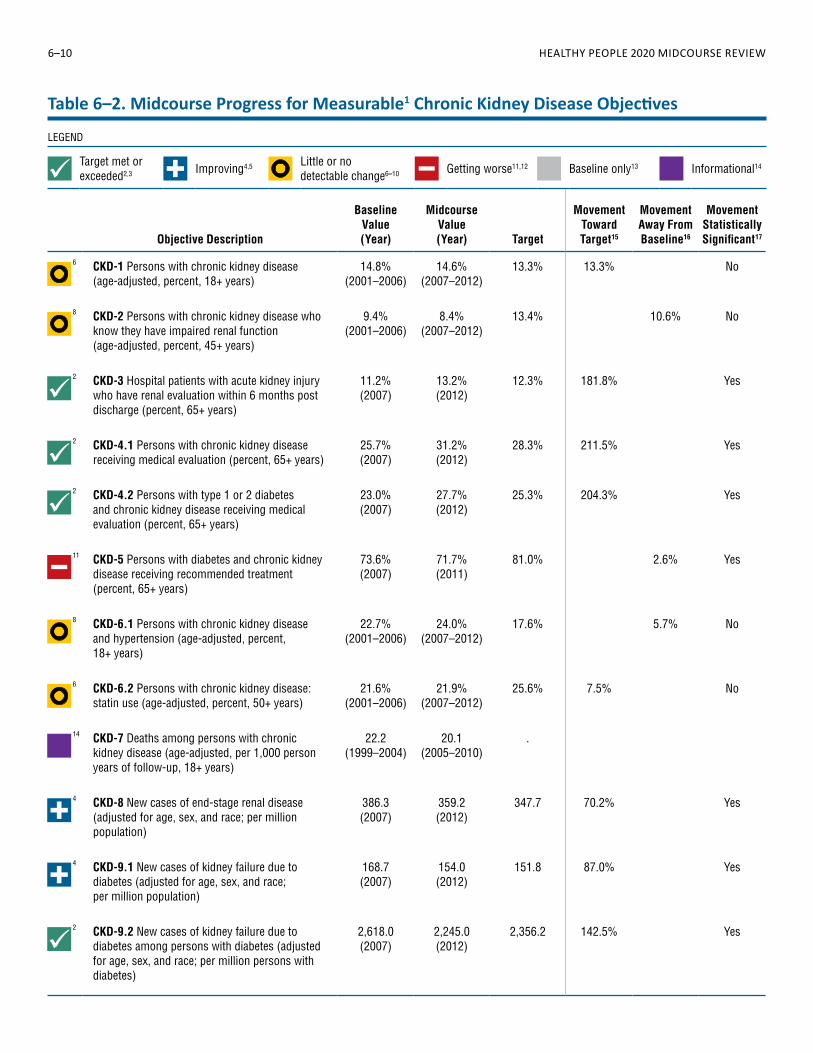
Prevalence and Awareness of Chronic Kidney Disease (CKD) � From 2001–2006 to 2007–2012 there was little or no detectable change in the age-adjusted proportion of persons aged 18 and over with CKD (CKD-1: 14.8% and 14.6%, respectively) and in the age-adjusted
proportion of persons aged 45 and over with CKD who knew that they had impaired renal function (CKD-2: 9.4% and 8.4%, respectively) (Table 6–2). » In 2007–2012, there were statistically significant disparities by sex, race and ethnicity, education, family income, and disability status in the age-adjusted proportion of adults with CKD (CKD-1, Table 6–3).
» In 2007–2012, there were statistically significant disparities by sex and disability status in the age-adjusted proportion of persons aged 45 and over with CKD who knew they had impaired renal function (CKD-2, Table 6–3). Disparities by race and ethnicity, education, and family income were not statistically significant.

Chapter 6 • Chronic Kidney Disease 6–3
Recommended Medical Evaluation and Treatment of Persons With CKD � The proportion of hospital patients aged 65 and over with acute kidney injury who had a follow-up renal evaluation within 6 months post discharge (CKD-3) increased from 11.2% in 2007 to 13.2% in 2012, exceeding the 2020 target (Table 6–2). » In 2012, there was a statistically significant disparity by sex in the proportion of hospital patients aged 65 and over with acute kidney injury who had a renal evaluation within 6 months post discharge (CKD-3, Table 6–3). The disparity by race and ethnicity was not statistically significant.
� Between 2007 and 2012, the proportion of persons aged 65 and over with CKD who received a recommended medical evaluation including serum creatinine, lipids, and microalbuminuria (CKD-4.1) increased from 25.7% to 31.2%, exceeding the 2020 target (Table 6–2). » In 2012, there were statistically significant disparities by sex and race and ethnicity in the proportion of persons aged 65 and over with CKD who received a medical evaluation with serum creatinine, lipids, and microalbuminuria (CKD-4.1, Table 6–3).
� Between 2007 and 2012, the proportion of persons aged 65 and over with type 1 or type 2 diabetes and CKD who received a medical evaluation with serum creatinine, microalbuminuria, A1c, lipids, and eye examination (CKD-4.2) increased from 23.0% to 27.7%, exceeding the 2020 target (Table 6–2). » In 2012, there was a statistically significant disparity by race and ethnicity in the proportion of persons aged 65 and over with type 1 or 2 diabetes and CKD who received medical evaluation with serum creatinine, microalbuminuria, A1c, lipids, and eye examination (CKD-4.2, Table 6–3). The disparity by sex was not statistically significant.
� The proportion of persons aged 65 and over with diabetes and CKD who received recommended treatment with angiotensin-converting enzyme (ACE) inhibitors or angiotensin II receptor blockers (ARBs) (CKD-5) decreased from 73.6% in 2007 to 71.7% in 2011, moving away from the baseline and 2020 target (Table 6–2). » In 2011, there were statistically significant disparities by sex and race and ethnicity in the proportion of persons aged 65 and over with
diabetes and CKD who received recommended treatment with ACE inhibitors and/or ARBs (CKD-5, Table 6–3).
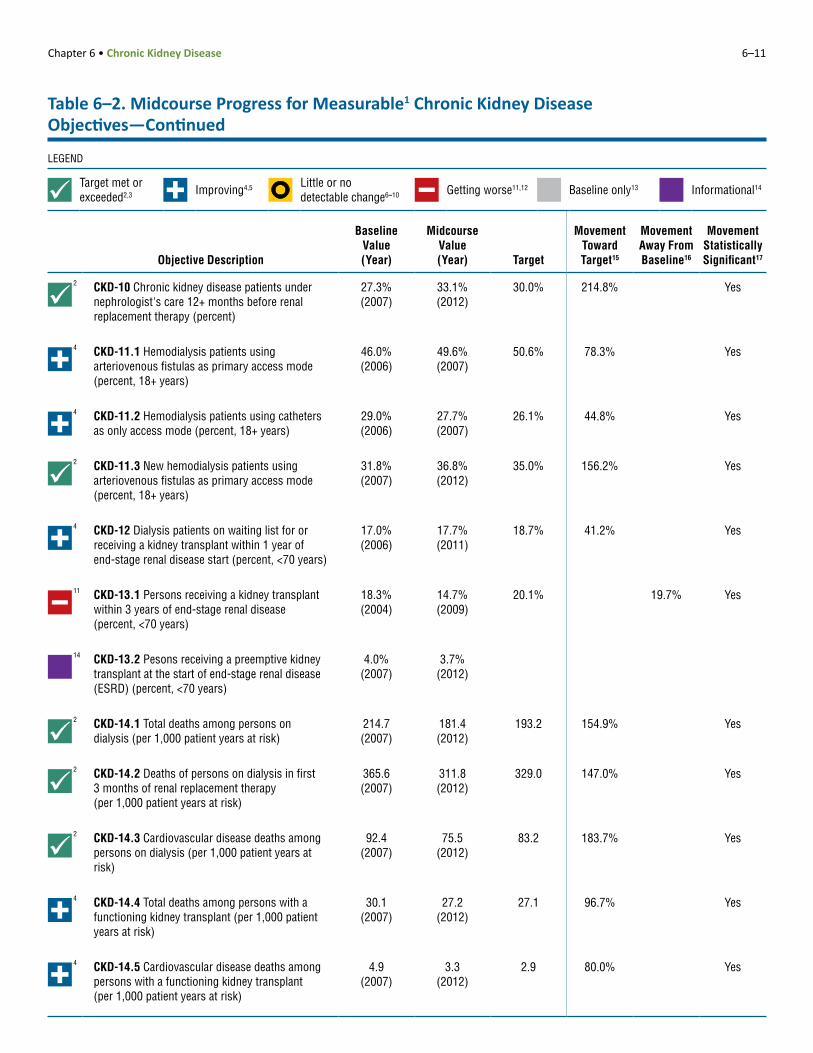
� The proportion of CKD patients who were under a nephrologist’s care 12 or more months prior to beginning renal replacement therapy (CKD-10) increased from 27.3% in 2007 to 33.1% in 2012, exceeding the 2020 target (Table 6–2). » In 2012, there was a statistically significant disparity by race and ethnicity in the proportion of CKD patients who were under a nephrologist’s care 12 or more months prior to beginning renal replacement therapy (CKD-10, Table 6–3). The disparity by sex was not statistically significant.
Cardiovascular Care of Persons With CKD � From 2001–2006 to 2007–2012, there was little or no detectable change in the age-adjusted proportion of persons aged 18 and over with CKD who had hypertension (CKD-6.1: 22.7% and 24.0%, respectively) or in the age-adjusted proportion of persons aged 50 and over with CKD who took statins to lower their blood cholesterol level (CKD-6.2: 21.6% and 21.9%, respectively) (Table 6–2). » In 2007–2012, there was a statistically significant disparity by family income in the age-adjusted proportion of persons with CKD who had hypertension (CKD-6.1, Table 6–3). Disparities by sex, race and ethnicity, education, and disability status were not statistically significant.
» In 2007–2012, disparities by sex, race and ethnicity, education, family income, and disability status in the age-adjusted proportion of persons aged 50 and over with CKD who took statins to lower their blood cholesterol level (CKD-6.2) were not statistically significant (Table 6–3).
Mortality Among Persons With CKD � The age-adjusted rate of deaths among persons aged 18 and over with CKD (CKD-7) was 22.2 per 1,000 person years of follow-up in 1999–2004 and 20.1 in 2005–2010. A target was not set for this objective (Table 6–2). » In 2005–2010, there were statistically significant disparities by education and family income in the age-adjusted death rate among adults with CKD (CKD-7, Table 6–3). Disparities by sex and race and ethnicity were not statistically significant.

6–4 HEALTHY PEOPLE 2020 MIDCOURSE REVIEW
Incidence of End-stage Renal Disease (ESRD) � Between 2007 and 2012, the rate of new cases of
ESRD (CKD-8) decreased from 386.3 to 359.2 per million population (adjusted for age, sex, and race and ethnicity) and the rate of new cases of kidney failure due to diabetes (CKD-9.1) decreased from 168.7 to 154.0 per million population (adjusted for age, sex, and race and ethnicity), moving toward their respective 2020 targets (Table 6–2). » In 2012, the rate of new cases of ESRD (CKD-8) varied by state. Seven states (Alaska, Colorado, Hawaii, Montana, New Mexico, Washington, and Wyoming) had met or exceeded the national 2020 target (Map 6–1).
» In 2012, there were statistically significant disparities by sex (adjusted for age and race and ethnicity) and race and ethnicity (adjusted for age and sex) in the rates of new cases of ESRD (CKD-8) and new cases of kidney failure due to diabetes (CKD-9.1) (Table 6–3).
� Between 2007 and 2012, the rate of new cases of kidney failure due to diabetes among persons with diabetes (CKD-9.2) decreased from 2,618.0 to 2,245.0 per million persons with diabetes (adjusted for age, sex, and race and ethnicity), exceeding the 2020 target (Table 6–2). » In 2012, there were statistically significant disparities by sex (adjusted for age and race and ethnicity) and race and ethnicity (adjusted for age and sex) in the rate of new cases of kidney failure due to diabetes among persons with diabetes (CKD-9.2, Table 6–3).
Vascular Access � From 2007 to 2011, the proportion of all patients on hemodialysis aged 18 and over who used arteriovenous fistulas as the primary vascular access mode (CKD-11.1) increased from 46.0% to 49.6%, moving toward the 2020 target (Table 6–2). » In 2012, there were statistically significant disparities by sex and race and ethnicity in the proportion of hemodialysis patients aged 18 and over who used arteriovenous fistulas as the primary vascular access mode (CKD-11.1, Table 6–3).
� From 2006 to 2007, the proportion of all patients on hemodialysis aged 18 and over who used catheters as the only vascular access mode (CKD-11.2) decreased from 29.0% to 27.7%, moving toward the 2020 target (Table 6–2).
» In 2012, there were statistically significant disparities by sex and race and ethnicity in the proportion of hemodialysis patients aged 18 and over who used catheters as the only vascular access mode (CKD-11.2, Table 6–3).
� The proportion of patients newly starting dialysis who used arteriovenous fistulas or had a maturing fistulas as the primary mode of vascular access at the start of renal replacement therapy (CKD-11.3) increased from 31.8% in 2007 to 36.8% in 2012, exceeding the 2020 target (Table 6–2). » The proportion of new hemodialysis patients aged 18 and over who used arteriovenous fistulas as the primary vascular access mode (CKD-11.3) varied by state. In 2012, 39 states had met or exceeded the national 2020 target (Map 6–2).
» In 2012, there was a statistically significant disparity by sex in the proportion of new hemodialysis patients aged 18 and over who used arteriovenous fistulas as the primary vascular access mode (CKD-11.3, Table 6–3). The disparity by race and ethnicity was not statistically significant.
Kidney Transplants � The proportion of dialysis patients under age 70 who were on the wait list for or had received a kidney transplant within 1 year of ESRD start (CKD-12) increased from 17.0% in 2006 to 17.7% in 2011, moving toward the 2020 target (Table 6–2). » In 2011, there were statistically significant disparities by sex and race and ethnicity in the proportion of dialysis patients under age 70 who were on the wait list for or had received a kidney transplant within 1 year of ESRD start (CKD-12, Table 6–3).
� The proportion of patients under age 70 who had received a kidney transplant within 3 years of ESRD start (CKD-13.1) declined from 18.3% in 2004 to 14.7% in 2009, moving away from the baseline and 2020 target (Table 6–2). » In 2009, there were statistically significant disparities by sex and race and ethnicity in the proportion of persons under age 70 who had received a kidney transplant within 3 years of ESRD start (CKD-13.1, Table 6–3).
� The proportion of patients under age 70 who had received a preemptive kidney transplant at the start of ESRD (CKD-13.2) was 4.0% in 2007 and 3.7% in 2012. A target was not set for this objective (Table 6–2).

Chapter 6 • Chronic Kidney Disease 6–5
» In 2012, there were statistically significant disparities by sex and race and ethnicity in the proportion of persons under age 70 who had received a preemptive kidney transplant at the start of ESRD (CKD-13.2, Table 6–3).
Mortality Among Persons on Dialysis or With a Kidney Transplant � Between 2007 and 2012, the death rate among
persons on dialysis (CKD-14.1) decreased from 214.7 to 181.4 deaths per 1,000 patient years at risk; the death rate of persons on dialysis in the first 3 months of renal replacement therapy (CKD-14.2) decreased from 365.6 to 311.8 per 1,000 patient years at risk; and the cardiovascular disease death rate among persons on dialysis (CKD-14.3) decreased from 92.4 to 75.5 per 1,000 patient years at risk, exceeding their respective 2020 targets (Table 6–2). » Total death rates among persons on dialysis (CKD-14.1) varied by state. In 2012, 30 states and the District of Columbia had met or exceeded the national target (Map 6–3).
» In 2012, there was a statistically significant disparity by race and ethnicity in the rate of total deaths among persons on dialysis (CKD-14.1) and in the rate of deaths of persons on dialysis in the first 3 months of renal replacement therapy (CKD-14.2) (Table 6–3). The disparity by sex was not statistically significant for either objective.
» In 2012, there were statistically significant disparities by sex and race and ethnicity in the rate of cardiovascular deaths among persons on dialysis (CKD-14.3, Table 6–3).
� Between 2007 and 2012, the death rate among persons with a functioning kidney transplant (CKD-14.4) decreased from 30.1 to 27.2 deaths per 1,000 patient years at risk, and the cardiovascular disease death rate among persons with a functioning kidney transplant (CKD-14.5) decreased from 4.9 to 3.3 per 1,000 patient years at risk, moving toward their respective 2020 targets (Table 6–2). » In 2012, there were statistically significant disparities by sex and race and ethnicity in the rate of total deaths among persons with a functioning kidney transplant (CKD-14.4, Table 6–3).
» In 2012, there was a statistically significant disparity by race and ethnicity in the rate of cardiovascular disease deaths among persons with a functioning kidney transplant (CKD-14.5, Table 6–3). The disparity by sex was not statistically significant.
More Information
Readers interested in more detailed information about the objectives in this topic area are invited to visit the HealthyPeople.gov website, where extensive substantive and technical information is available:
� For the background and importance of the topic area, see: http://www.healthypeople.gov/2020/ topics-objectives/topic/chronic-kidney-disease
� For data details for each objective, including definitions, numerators, denominators, calculations, and data limitations, see: http://www. healthypeople.gov/2020/topics-objectives/topic/ chronic-kidney-disease/objectives Select an objective, then click on the “Data Details” icon.
� For objective data by population group (e.g., sex, race and ethnicity, or family income), including rates, percentages, or counts for multiple years, see: http://www.healthypeople.gov/2020/topics-objectives/topic/chronic-kidney-disease/objectivesSelect an objective, then click on the “Data2020” icon.
Data for the measurable objectives in this chapter were from the following data sources:
� Clinical Performance Measures Project: https://www.cms.gov/Medicare/End-Stage-Renal-Disease/CPMProject/index.html?redirect=/cpmproject
� National Death Index: http://www.cdc.gov/nchs/ndi/index.htm
� National Health and Nutrition Examination Survey: http://www.cdc.gov/nchs/nhanes/
� National Health Interview Survey: http://www.cdc.gov/nchs/nhis/
� United States Renal Data System: https://www.usrds.org/
Footnotes
1The Technical Notes provide more information on Healthy People 2020 statistical methods and issues. 2Measurable objectives had a national baseline value.

6–6 HEALTHY PEOPLE 2020 MIDCOURSE REVIEW
3Target met or exceeded—One of the following, as specified in the Midcourse Progress Table: » At baseline the target was not met or exceeded and the midcourse value was equal to or exceeded the target. (The percentage of targeted change achieved was equal to or greater than 100%.)
» The baseline and midcourse values were equal to or exceeded the target. (The percentage of targeted change achieved was not assessed.)
4Improving—One of the following, as specified in the Midcourse Progress Table: » Movement was toward the target, standard errors were available, and the percentage of targeted change achieved was statistically significant.
» Movement was toward the target, standard errors were not available, and the objective had achieved 10% or more of the targeted change.
5Little or no detectable change—One of the following, as specified in the Midcourse Progress Table: » Movement was toward the target, standard errors were available, and the percentage of targeted change achieved was not statistically significant.
» Movement was toward the target, standard errors were not available, and the objective had achieved less than 10% of the targeted change.
» Movement was away from the baseline and target, standard errors were available, and the percentage change relative to the baseline was not statistically significant.
» Movement was away from the baseline and target, standard errors were not available, and the objective had moved less than 10% relative to the baseline.
» There was no change between the baseline and the midcourse data point.
6Getting worse—One of the following, as specified in the Midcourse Progress Table: » Movement was away from the baseline and target, standard errors were available, and the percentage change relative to the baseline was statistically significant.
» Movement was away from the baseline and target, standard errors were not available, and the objective had moved 10% or more relative to the baseline.
7Informational—A target was not set for this objective, so progress toward target attainment could not be assessed.
Suggested Citation
National Center for Health Statistics. Chapter 6: Chronic Kidney Disease. Healthy People 2020 Midcourse Review. Hyattsville, MD. 2016.

Chapter 6 • Chronic Kidney Disease 6–7
Table 6–1. Chronic Kidney Disease Objectives LEGEND
Data for this objective are available in this Disparities data for this objective are A state or county level map for chapter’s Midcourse Progress Table. available, and this chapter includes a this objective is available at the
Midcourse Health Disparities Table. end of the chapter.
Midcourse data availability is not applicable for developmental and archived objectives. Developmental objectives did not Not Applicable have a national baseline value. Archived objectives are no longer being monitored due to lack of data source, changes in
science, or replacement with other objectives.
Objective Number Objective Statement Data Sources
Midcourse Data Availability
CKD-1 Reduce the proportion of the U.S. population with chronic kidney disease
National Health and Nutrition Examination Survey (NHANES), CDC/NCHS
CKD-2 Increase the proportion of persons with chronic kidney disease (CKD) who know they have impaired renal function
National Health and Nutrition Examination Survey (NHANES), CDC/NCHS
CKD-3 Increase the proportion of hospital patients who incurred acute kidney injury who have followup renal evaluation in 6 months post discharge
United States Renal Data System (USRDS), NIH/NIDDK
CKD-4.1 Increase the proportion of persons with chronic kidney disease who receive medical evaluation with serum creatinine, lipids, and microalbuminuria
United States Renal Data System (USRDS), NIH/NIDDK
CKD-4.2 Increase the proportion of persons with type 1 or type 2 diabetes and chronic kidney disease who receive medical evaluation with serum creatinine, microalbuminuria, A1c, lipids, and eye examinations
United States Renal Data System (USRDS), NIH/NIDDK
CKD-5 Increase the proportion of persons with diabetes and chronic kidney disease who receive recommended medical treatment with angiotensin-converting enzyme (ACE) inhibitors or angiotensin II receptor blockers (ARBs)
United States Renal Data System (USRDS), NIH/NIDDK
CKD-6.1 Reduce the proportion of persons with chronic kidney disease who have elevated blood
National Health and Nutrition Examination Survey (NHANES), CDC/NCHS
pressure
CKD-6.2 Increase the proportion of persons aged 50 years and older with chronic kidney disease who currently take statins to lower their blood cholesterol
National Health and Nutrition Examination Survey (NHANES), CDC/NCHS
CKD-7 Reduce the number of deaths among persons with chronic kidney disease
National Death Index (NDI), CDC/NCHS; National Health and Nutrition Examination Survey (NHANES), CDC/NCHS
CKD-8 Reduce the number of new cases of end-stage renal disease (ESRD)
United States Renal Data System (USRDS), NIH/NIDDK

6–8 HEALTHY PEOPLE 2020 MIDCOURSE REVIEW
Table 6–1. Chronic Kidney Disease Objectives—Continued LEGEND
Data for this objective are available in this Disparities data for this objective are A state or county level map for chapter’s Midcourse Progress Table. available, and this chapter includes a this objective is available at the
Midcourse Health Disparities Table. end of the chapter.
Midcourse data availability is not applicable for developmental and archived objectives. Developmental objectives did not Not Applicable have a national baseline value. Archived objectives are no longer being monitored due to lack of data source, changes in
science, or replacement with other objectives.
Objective Number Objective Statement Data Sources
Midcourse Data Availability
CKD-9.1 Reduce kidney failure due to diabetes United States Renal Data System (USRDS), NIH/NIDDK
CKD-9.2 Reduce kidney failure due to diabetes among persons with diabetes
United States Renal Data System (USRDS), NIH/NIDDK; National Health Interview Survey (NHIS), CDC/NCHS
CKD-10 Increase the proportion of chronic kidney disease patients receiving care from a nephrologist at least 12 months before the start of renal replacement therapy
United States Renal Data System (USRDS), NIH/NIDDK
CKD-11.1 Increase the proportion of adult hemodialysis patients who use arteriovenous fistulas as the primary mode of vascular access
Clinical Performance Measures Project (CPM), CMS; United States Renal Data System (USRDS), NIH/NIDDK
CKD-11.2 Reduce the proportion of adult hemodialysis patients who use catheters as the only mode of vascular access
Clinical Performance Measures Project (CPM), CMS; United States Renal Data System (USRDS), NIH/NIDDK
CKD-11.3 Increase the proportion of adult hemodialysis patients who use arteriovenous fistulas or have a maturing fistula as the primary mode of vascular access at the start of renal replacement therapy
Clinical Performance Measures Project (CPM), CMS; United States Renal Data System (USRDS), NIH/NIDDK
CKD-12 Increase the proportion of dialysis patients waitlisted and/or receiving a deceased donor kidney transplant within 1 year of end-stage renal disease (ESRD) start (among patients under 70 years of age)
United States Renal Data System (USRDS), NIH/NIDDK
CKD-13.1 Increase the proportion of patients receiving a kidney transplant within 3 years of end-stage renal disease (ESRD)
United States Renal Data System (USRDS), NIH/NIDDK
CKD-13.2 Increase the proportion of patients who receive a preemptive transplant at the start of ESRD
United States Renal Data System (USRDS), NIH/NIDDK
CKD-14.1 Reduce the total number of deaths for persons on dialysis
United States Renal Data System (USRDS), NIH/NIDDK

Chapter 6 • Chronic Kidney Disease 6–9
Table 6–1. Chronic Kidney Disease Objectives—Continued LEGEND
Data for this objective are available in this Disparities data for this objective are A state or county level map for chapter’s Midcourse Progress Table. available, and this chapter includes a this objective is available at the
Midcourse Health Disparities Table. end of the chapter.
Midcourse data availability is not applicable for developmental and archived objectives. Developmental objectives did not Not Applicable have a national baseline value. Archived objectives are no longer being monitored due to lack of data source, changes in
science, or replacement with other objectives.
Objective Number Objective Statement Data Sources
Midcourse Data Availability
CKD-14.2 Reduce the number of deaths in dialysis patients within the first 3 months of initiation of renal replacement therapy
United States Renal Data System (USRDS), NIH/NIDDK
CKD-14.3 Reduce the number of cardiovascular deaths for persons on dialysis
United States Renal Data System (USRDS), NIH/NIDDK
CKD-14.4 Reduce the total number of deaths for persons with a functioning kidney transplant
United States Renal Data System (USRDS), NIH/NIDDK
CKD-14.5 Reduce the number of cardiovascular deaths in persons with a functioning kidney transplant
United States Renal Data System (USRDS), NIH/NIDDK
6–10 HEALTHY PEOPLE 2020 MIDCOURSE REVIEW
Table 6–2. Midcourse Progress for Measurable1 Chronic Kidney Disease Objectives
LEGEND
Target met or exceeded2,3 Improving4,5 Little or no
detectable change6–10 Getting worse11,12 Baseline only13 Informational14
Baseline Midcourse Movement Movement Movement Value Value Toward Away From Statistically
Objective Description (Year) (Year) Target Target15 Baseline16 Significant17
6 CKD-1 Persons with chronic kidney disease (age-adjusted, percent, 18+ years)
8 CKD-2 Persons with chronic kidney disease who know they have impaired renal function (age-adjusted, percent, 45+ years)
2 CKD-3 Hospital patients with acute kidney injury who have renal evaluation within 6 months post discharge (percent, 65+ years)
2 CKD-4.1 Persons with chronic kidney disease receiving medical evaluation (percent, 65+ years)
2 CKD-4.2 Persons with type 1 or 2 diabetes and chronic kidney disease receiving medical evaluation (percent, 65+ years)
11 CKD-5 Persons with diabetes and chronic kidney disease receiving recommended treatment (percent, 65+ years)
8 CKD-6.1 Persons with chronic kidney disease and hypertension (age-adjusted, percent, 18+ years)
6 CKD-6.2 Persons with chronic kidney disease: statin use (age-adjusted, percent, 50+ years)
14 CKD-7 Deaths among persons with chronic kidney disease (age-adjusted, per 1,000 person years of follow-up, 18+ years)
4 CKD-8 New cases of end-stage renal disease (adjusted for age, sex, and race; per million population)
4 CKD-9.1 New cases of kidney failure due to diabetes (adjusted for age, sex, and race; per million population)
2 CKD-9.2 New cases of kidney failure due to diabetes among persons with diabetes (adjusted for age, sex, and race; per million persons with diabetes)
14.8% (2001–2006)
9.4% (2001–2006)
11.2% (2007)
25.7% (2007)
23.0% (2007)
73.6% (2007)
22.7% (2001–2006)
21.6% (2001–2006)
22.2 (1999–2004)
386.3 (2007)
168.7 (2007)
2,618.0 (2007)
14.6% (2007–2012)
8.4% (2007–2012)
13.2% (2012)
31.2% (2012)
27.7% (2012)
71.7% (2011)
24.0% (2007–2012)
21.9% (2007–2012)
20.1 (2005–2010)
359.2 (2012)
154.0 (2012)
2,245.0 (2012)
13.3%
13.4%
12.3%
28.3%
25.3%
81.0%
17.6%
25.6%
.
347.7
151.8
2,356.2
13.3%
10.6%
No
No
181.8% Yes
211.5%
204.3%
Yes
Yes
2.6% Yes
5.7% No
7.5% No
70.2% Yes
87.0% Yes
142.5% Yes
Chapter 6 • Chronic Kidney Disease 6–11
Table 6–2. Midcourse Progress for Measurable1 Chronic Kidney Disease Objectives—Continued
LEGEND
Target met or exceeded2,3 Improving4,5 Little or no
detectable change6–10 Getting worse11,12 Baseline only13 Informational14
Baseline Midcourse Movement Movement Movement Value Value Toward Away From Statistically
Objective Description (Year) (Year) Target Target15 Baseline16 Significant17
2 CKD-10 Chronic kidney disease patients under nephrologist's care 12+ months before renal replacement therapy (percent)
4 CKD-11.1 Hemodialysis patients using arteriovenous fistulas as primary access mode (percent, 18+ years)
4 CKD-11.2 Hemodialysis patients using catheters as only access mode (percent, 18+ years)
2 CKD-11.3 New hemodialysis patients using arteriovenous fistulas as primary access mode (percent, 18+ years)
4 CKD-12 Dialysis patients on waiting list for or receiving a kidney transplant within 1 year of end-stage renal disease start (percent, <70 years)
11 CKD-13.1 Persons receiving a kidney transplant within 3 years of end-stage renal disease (percent, <70 years)
14 CKD-13.2 Pesons receiving a preemptive kidney transplant at the start of end-stage renal disease (ESRD) (percent, <70 years)
2 CKD-14.1 Total deaths among persons on dialysis (per 1,000 patient years at risk)
2 CKD-14.2 Deaths of persons on dialysis in first 3 months of renal replacement therapy (per 1,000 patient years at risk)
2 CKD-14.3 Cardiovascular disease deaths among persons on dialysis (per 1,000 patient years at risk)
4 CKD-14.4 Total deaths among persons with a functioning kidney transplant (per 1,000 patient years at risk)
4 CKD-14.5 Cardiovascular disease deaths among persons with a functioning kidney transplant (per 1,000 patient years at risk)
27.3% (2007)
46.0% (2006)
29.0% (2006)
31.8% (2007)
17.0% (2006)
18.3% (2004)
4.0% (2007)
214.7 (2007)
365.6 (2007)
92.4 (2007)
30.1 (2007)
4.9 (2007)
33.1% (2012)
49.6% (2007)
27.7% (2007)
36.8% (2012)
17.7% (2011)
14.7% (2009)
3.7% (2012)
181.4 (2012)
311.8 (2012)
75.5 (2012)
27.2 (2012)
3.3 (2012)
30.0%
50.6%
26.1%
35.0%
18.7%
20.1%
193.2
329.0
83.2
27.1
2.9
214.8% Yes
78.3% Yes
44.8% Yes
156.2% Yes
41.2% Yes
19.7% Yes
154.9% Yes
147.0% Yes
183.7% Yes
96.7% Yes
80.0% Yes

6–12 HEALTHY PEOPLE 2020 MIDCOURSE REVIEW
Table 6–2. Midcourse Progress for Measurable1 Chronic Kidney Disease Objectives—Continued
NOTES
See HealthyPeople.gov for all Healthy People 2020 data. The Technical Notes provide more information on the measures of progress.
FOOTNOTES 1Measurable objectives had a national baseline value. Target met or exceeded:
2At baseline the target was not met or exceeded and the midcourse value was equal to or exceeded the target. (The percentage of targeted change achieved was equal to or greater than 100%.) 3The baseline and midcourse values were equal to or exceeded the target. (The percentage of targeted change achieved was not assessed.)
Improving: 4Movement was toward the target, standard errors were available, and the percentage of targeted change achieved was statistically significant. 5Movement was toward the target, standard errors were not available, and the objective had achieved 10% or more of the targeted change.
Little or no detectable change: 6Movement was toward the target, standard errors were available, and the percentage of targeted change achieved was not statistically significant. 7Movement was toward the target, standard errors were not available, and the objective had achieved less than 10% of the targeted change. 8Movement was away from the baseline and target, standard errors were available, and the percentage change relative to the baseline was not statistically significant. 9Movement was away from the baseline and target, standard errors were not available, and the objective had moved less than 10% relative to the baseline. 10There was no change between the baseline and the midcourse data point.
Getting worse: 11Movement was away from the baseline and target, standard errors were available, and the percentage change relative to the baseline was statistically significant. 12Movement was away from the baseline and target, standard errors were not available, and the objective had moved 10% or more relative to the baseline.
13Baseline only: The objective only had one data point, so progress toward target attainment could not be assessed. 14Informational: A target was not set for this objective, so progress toward target attainment could not be assessed. 15For objectives that moved toward their targets, movement toward the target was measured as the percentage of targeted change achieved (unless the target was already met or exceeded at baseline):
Percentage of targeted Midcourse value – Baseline value = × 100
change achieved HP2020 target – Baseline value 16For objectives that moved away from their baselines and targets, movement away from the baseline was measured as the magnitude of the percentage change from baseline:
| Midcourse value – Baseline value | Magnitude of percentage = × 100 change from baseline Baseline value
17Statistical significance was tested when the objective had a target and at least two data points, standard errors of the data were available, and a normal distribution could be assumed. Statistical significance of the percentage of targeted change achieved or the magnitude of the percentage change from baseline was assessed at the 0.05 level using a normal one-sided test.
CKD-1 National Health and Nutrition Examination Survey (NHANES), CDC/NCHS
CKD-2 National Health and Nutrition Examination Survey (NHANES), CDC/NCHS
CKD-3 United States Renal Data System (USRDS), NIH/NIDDK CKD-4.1 United States Renal Data System (USRDS), NIH/NIDDK CKD-4.2 United States Renal Data System (USRDS), NIH/NIDDK CKD-5 United States Renal Data System (USRDS), NIH/NIDDK CKD-6.1 National Health and Nutrition Examination Survey (NHANES),
CDC/NCHS CKD-6.2 National Health and Nutrition Examination Survey (NHANES),
CDC/NCHS CKD-7 National Death Index (NDI), CDC/NCHS; National Health and
Nutrition Examination Survey (NHANES), CDC/NCHS CKD-8 United States Renal Data System (USRDS), NIH/NIDDK CKD-9.1 United States Renal Data System (USRDS), NIH/NIDDK CKD-9.2 United States Renal Data System (USRDS), NIH/NIDDK;
National Health Interview Survey (NHIS), CDC/NCHS CKD-10 United States Renal Data System (USRDS), NIH/NIDDK CKD-11.1 Clinical Performance Measures Project (CPM), CMS;
United States Renal Data System (USRDS), NIH/NIDDK CKD-11.2 Clinical Performance Measures Project (CPM), CMS;
United States Renal Data System (USRDS), NIH/NIDDK CKD-11.3 Clinical Performance Measures Project (CPM), CMS;
United States Renal Data System (USRDS), NIH/NIDDK CKD-12 United States Renal Data System (USRDS), NIH/NIDDK CKD-13.1 United States Renal Data System (USRDS), NIH/NIDDK CKD-13.2 United States Renal Data System (USRDS), NIH/NIDDK CKD-14.1 United States Renal Data System (USRDS), NIH/NIDDK CKD-14.2 United States Renal Data System (USRDS), NIH/NIDDK CKD-14.3 United States Renal Data System (USRDS), NIH/NIDDK CKD-14.4 United States Renal Data System (USRDS), NIH/NIDDK CKD-14.5 United States Renal Data System (USRDS), NIH/NIDDK
DATA SOURCES

Table 6–3. Midcourse Health Disparities1 for Population-based Chronic Kidney Disease Objectives
Most favorable (least adverse) and least favorable (most adverse) group rates and summary disparity ratios2,3 for selected characteristics at the midcourse data point
LEGEND
At the midcourse data point Group with the most favorable Group with the least favorable Data are available, but this group did Data are not available for this group because (least adverse) rate (most adverse) rate not have the highest or lowest rate. the data were statistically unreliable, not
collected, or not analyzed.
Characteristics and Groups
Population-based Objectives Mal
e
Sex
Fem
ale
Sum
mar
y Di
spar
ity R
atio
2
Amer
ican
Indi
an o
r Ala
ska
Nativ
e
Asia
n
Race and Ethnicity
Nativ
e Ha
wai
ian
or o
ther
Pac
ific
Isla
nder
Two
or m
ore
race
s
Hisp
anic
or L
atin
o
Blac
k, n
ot H
ispa
nic
Whi
te, n
ot H
ispa
nic
Sum
mar
y Di
spar
ity R
atio
3
Education4
Less
than
hig
h sc
hool
High
sch
ool g
radu
ate
At le
ast s
ome
colle
ge
Asso
ciat
e’s d
egre
e
4-ye
ar c
olle
ge
Adva
nced
deg
ree
Sum
mar
y Di
spar
ity R
atio
3
Family Income5
Poor
Near
-poo
r
Mid
dle
Near
-hig
h
High
Sum
mar
y Di
spar
ity R
atio
3
Disability
Pers
ons
with
dis
abili
ties
Pers
ons
with
out d
isab
ilitie
s
Sum
mar
y Di
spar
ity R
atio
3
Location
Met
ropo
litan
Nonm
etro
polit
an
Sum
mar
y Di
spar
ity R
atio
2
CKD-1 Persons with chronic kidney disease (age-adjusted, percent, 18+ years) (2007–2012) 1.225* 1.195* a b 1.234* c d 1.151*
e f
e g
1.498*
CKD-2 Persons with chronic kidney disease who know they have impaired renal function (age-adjusted, percent, 45+ years) (2007–2012)
1.337* 1.305 a b 1.388 c d 1.388e f
e g
1.605*
CKD-3 Hospital patients with acute kidney injury who have renal evaluation within 6 months post discharge 1.171* h h i i 1.324
(percent, 65+ years) (2012)
CKD-4.1 Persons with chronic kidney disease receiving medical evaluation (percent, 65+ years) 1.120* h h i i 1.506*
(2012)
CKD-4.2 Persons with type 1 or 2 diabetes and chronic kidney disease receiving medical evaluation 1.013 h h i i 1.503*
(percent, 65+ years) (2012)
CKD-5 Persons with diabetes and chronic kidney disease receiving recommended treatment 1.047* h h i i 1.083*
(percent, 65+ years) (2011)
CKD-6.1 Persons with chronic kidney disease and hypertension (age-adjusted, percent, 18+ years) (2007–2012)
1.180 1.337 a b 1.187 c d 1.909*e f
e g
1.155
CKD-6.2 Persons with chronic kidney disease: statin use (age-adjusted, percent, 50+ years) (2007–2012) 1.207 1.414 a b 1.279 c d 1.281
e f
e g
1.116
Chapter 6 • Chronic Kidney Disease 6–13

Table 6–3. Midcourse Health Disparities1 for Population-based Chronic Kidney Disease Objectives—Continued
Most favorable (least adverse) and least favorable (most adverse) group rates and summary disparity ratios2,3 for selected characteristics at the midcourse data point
LEGEND
At the midcourse data point Group with the most favorable Group with the least favorable Data are available, but this group did Data are not available for this group because (least adverse) rate (most adverse) rate not have the highest or lowest rate. the data were statistically unreliable, not
collected, or not analyzed.
Characteristics and Groups
Population-based Objectives Mal
e
Sex
Fem
ale
Sum
mar
y Di
spar
ity R
atio
2
Amer
ican
Indi
an o
r Ala
ska
Nativ
e
Asia
n
Race and Ethnicity
Nativ
e Ha
wai
ian
or o
ther
Pac
ific
Isla
nder
Two
or m
ore
race
s
Hisp
anic
or L
atin
o
Blac
k, n
ot H
ispa
nic
Whi
te, n
ot H
ispa
nic
Sum
mar
y Di
spar
ity R
atio
3
Education4
Less
than
hig
h sc
hool
High
sch
ool g
radu
ate
At le
ast s
ome
colle
ge
Asso
ciat
e’s d
egre
e
4-ye
ar c
olle
ge
Adva
nced
deg
ree
Sum
mar
y Di
spar
ity R
atio
3
Family Income5
Poor
Near
-poo
r
Mid
dle
Near
-hig
h
High
Sum
mar
y Di
spar
ity R
atio
3
Disability
Pers
ons
with
dis
abili
ties
Pers
ons
with
out d
isab
ilitie
s
Sum
mar
y Di
spar
ity R
atio
3
Location
Met
ropo
litan
Nonm
etro
polit
an
Sum
mar
y Di
spar
ity R
atio
2
CKD-7 Deaths among persons with chronic kidney disease (age-adjusted, per 1000 person years of 1.226 1.157 a b 2.746* c d 1.900*
follow-up, 18+ years) (2005–2010)
CKD-8 New cases of end-stage renal disease (adjusted for age, sex, and race; per million population) (2012) 1.594* j 3.734*
CKD-9.1 New cases of kidney failure due to diabetes (adjusted for age, sex, and race; per million 1.476* j 5.160*
population) (2012)
CKD-9.2 New cases of kidney failure due to diabetes among persons with diabetes (adjusted for age, sex, 1.274* j 1.579*
and race; per million persons with diabetes) (2012)
CKD-10 Chronic kidney disease patients under nephrologist's care 12+ months before renal 1.002 1.305*
replacement therapy (percent) (2012)
CKD-11.1 Hemodialysis patients using arteriovenous fistulas as primary access mode (percent, 18+ years) 1.439* h h 1.119*
(2007)
CKD-11.2 Hemodialysis patients using catheters as only access mode (percent, 18+ years) (2007) 1.301* h h 1.388*
CKD-11.3 New hemodialysis patients using arteriovenous fistulas as primary access mode 1.172* 1.098
(percent, 18+ years) (2012)
6–14 HEALTH
Y PEOPLE 2020 M
IDCOURSE REVIEW
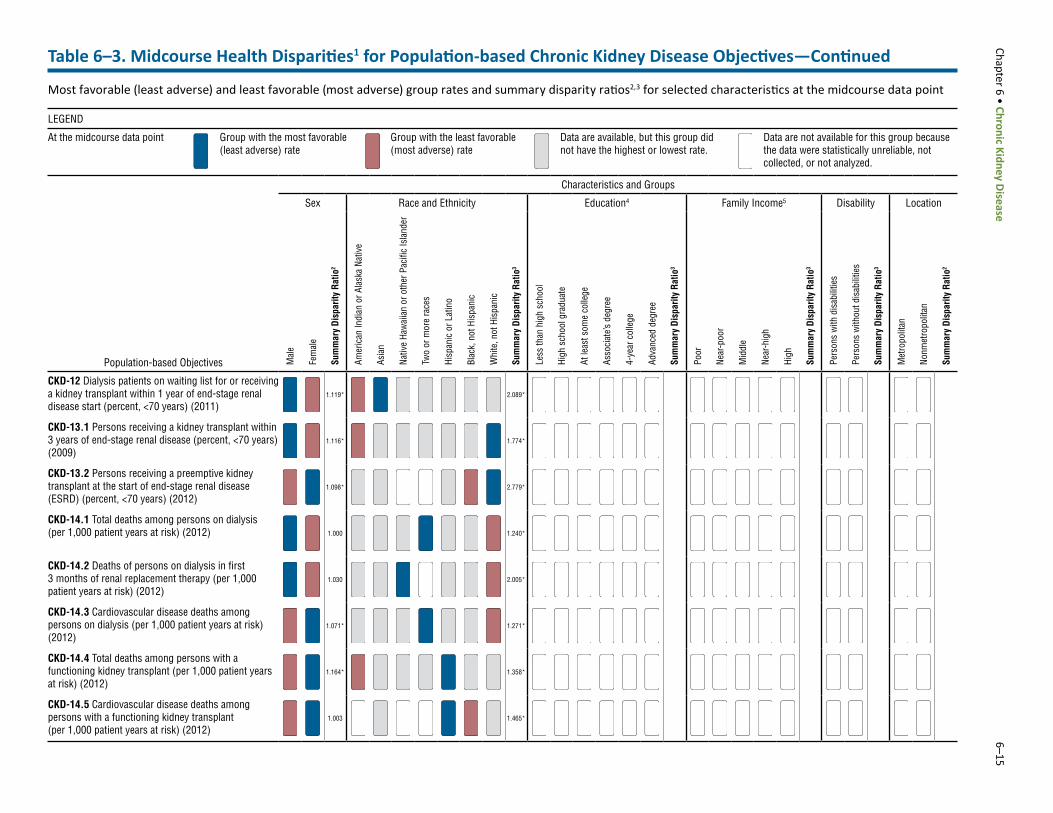
Table 6–3. Midcourse Health Disparities1 for Population-based Chronic Kidney Disease Objectives—Continued
Most favorable (least adverse) and least favorable (most adverse) group rates and summary disparity ratios2,3 for selected characteristics at the midcourse data point
LEGEND
At the midcourse data point Group with the most favorable Group with the least favorable Data are available, but this group did Data are not available for this group because (least adverse) rate (most adverse) rate not have the highest or lowest rate. the data were statistically unreliable, not
collected, or not analyzed.
Characteristics and Groups
Population-based Objectives Mal
e
Sex
Fem
ale
Sum
mar
y Di
spar
ity R
atio
2
Race and Ethnicity
Amer
ican
Indi
an o
r Ala
ska
Nativ
e
Asia
n
Nativ
e Ha
wai
ian
or o
ther
Pac
ific
Isla
nder
Two
or m
ore
race
s
Hisp
anic
or L
atin
o
Blac
k, n
ot H
ispa
nic
Whi
te, n
ot H
ispa
nic
Sum
mar
y Di
spar
ity R
atio
3
Education4
Less
than
hig
h sc
hool
High
sch
ool g
radu
ate
At le
ast s
ome
colle
ge
Asso
ciat
e’s d
egre
e
4-ye
ar c
olle
ge
Adva
nced
deg
ree
Sum
mar
y Di
spar
ity R
atio
3
Family Income5
Poor
Near
-poo
r
Mid
dle
Near
-hig
h
High
Sum
mar
y Di
spar
ity R
atio
3
Disability
Pers
ons
with
dis
abili
ties
Pers
ons
with
out d
isab
ilitie
s
Sum
mar
y Di
spar
ity R
atio
3
Location
Met
ropo
litan
Nonm
etro
polit
an
Sum
mar
y Di
spar
ity R
atio
2
CKD-12 Dialysis patients on waiting list for or receiving a kidney transplant within 1 year of end-stage renal 1.119* 2.089*
disease start (percent, <70 years) (2011)
CKD-13.1 Persons receiving a kidney transplant within 3 years of end-stage renal disease (percent, <70 years) 1.116* 1.774*
(2009)
CKD-13.2 Persons receiving a preemptive kidney transplant at the start of end-stage renal disease 1.098* 2.779*
(ESRD) (percent, <70 years) (2012)
CKD-14.1 Total deaths among persons on dialysis (per 1,000 patient years at risk) (2012) 1.000 1.240*
CKD-14.2 Deaths of persons on dialysis in first 3 months of renal replacement therapy (per 1,000 1.030 2.005*
patient years at risk) (2012)
CKD-14.3 Cardiovascular disease deaths among persons on dialysis (per 1,000 patient years at risk) 1.071* 1.271*
(2012)
CKD-14.4 Total deaths among persons with a functioning kidney transplant (per 1,000 patient years 1.164* 1.358*
at risk) (2012)
CKD-14.5 Cardiovascular disease deaths among persons with a functioning kidney transplant 1.003 1.465*
(per 1,000 patient years at risk) (2012)
Chapter 6 • Chronic Kidney Disease 6–15

Table 6–3. Midcourse Health Disparities1 for Population-based Chronic Kidney Disease Objectives—Continued
NOTES
See HealthyPeople.gov for all Healthy People 2020 data. The Technical Notes provide more information on the measures of disparities.
FOOTNOTES 1Health disparities were assessed among population groups within specified demographic characteristics (sex, race and ethnicity, educational attainment, etc.). This assessment did not include objectives that were not population-based, such as those based on states, worksites, or those monitoring the number of events. 2When there were only two groups (e.g., male and female), the summary disparity ratio was the ratio of the higher to the lower rate. 3When there were three or more groups (e.g., white non-Hispanic, black non-Hispanic, Hispanic) and the most favorable rate (Rb) was the highest rate, the summary disparity ratio was calculated as Rb /Ra, where Ra = the average of the rates for all other groups. When there were three or more groups and the most favorable rate was the lowest rate, the summary disparity ratio was calculated as Ra /Rb. 4Unless otherwise footnoted, data do not include persons under age 25 years. 5Unless otherwise footnoted, the poor, near-poor, middle, near-high, and high income groups are for persons whose family incomes were less than 100%, 100%–199%, 200%–399%, 400%–599%, and at or above 600% of the poverty threshold, respectively. *The summary disparity ratio was significantly greater than 1.000. Statistical significance was assessed at the 0.05 level using a normal one-sided test on the natural logarithm scale. aData are for persons who completed some college or received an associate’s degree. bData are for persons who graduated from college or above. cData are for persons whose family income was 400% to 499% of the poverty threshold. dData are for persons whose family income was 500% or more of the poverty threshold. eData do not include persons under age 20 years. fData are for persons with activity limitations. gData are for persons without activity limitations. hData are for Asian or Pacific Islander persons. iData include persons of Hispanic origin. jThe rate for this population group was suppressed due to small sample size.
DATA SOURCES
CKD-1 National Health and Nutrition Examination Survey (NHANES), CDC/NCHS CKD-2 National Health and Nutrition Examination Survey (NHANES), CDC/NCHS CKD-3 United States Renal Data System (USRDS), NIH/NIDDK CKD-4.1 United States Renal Data System (USRDS), NIH/NIDDK CKD-4.2 United States Renal Data System (USRDS), NIH/NIDDK CKD-5 United States Renal Data System (USRDS), NIH/NIDDK CKD-6.1 National Health and Nutrition Examination Survey (NHANES), CDC/NCHS CKD-6.2 National Health and Nutrition Examination Survey (NHANES), CDC/NCHS CKD-7 National Death Index (NDI), CDC/NCHS; National Health and Nutrition Examination Survey
(NHANES), CDC/NCHS CKD-8 United States Renal Data System (USRDS), NIH/NIDDK CKD-9.1 United States Renal Data System (USRDS), NIH/NIDDK CKD-9.2 United States Renal Data System (USRDS), NIH/NIDDK;
National Health Interview Survey (NHIS), CDC/NCHS CKD-10 United States Renal Data System (USRDS), NIH/NIDDK CKD-11.1 Clinical Performance Measures Project (CPM), CMS;
United States Renal Data System (USRDS), NIH/NIDDK CKD-11.2 Clinical Performance Measures Project (CPM), CMS;
United States Renal Data System (USRDS), NIH/NIDDK CKD-11.3 Clinical Performance Measures Project (CPM), CMS;
United States Renal Data System (USRDS), NIH/NIDDK CKD-12 United States Renal Data System (USRDS), NIH/NIDDK CKD-13.1 United States Renal Data System (USRDS), NIH/NIDDK CKD-13.2 United States Renal Data System (USRDS), NIH/NIDDK CKD-14.1 United States Renal Data System (USRDS), NIH/NIDDK CKD-14.2 United States Renal Data System (USRDS), NIH/NIDDK CKD-14.3 United States Renal Data System (USRDS), NIH/NIDDK CKD-14.4 United States Renal Data System (USRDS), NIH/NIDDK CKD-14.5 United States Renal Data System (USRDS), NIH/NIDDK
6–16 HEALTH
Y PEOPLE 2020 M
IDCOURSE REVIEW

Map 6–1. New Cases of End-stage Renal Disease, by State: 2012
Healthy People 2020 Objective CKD-8 ● National Target = 347.7 per 1,000,000 population ● National Rate = 359.2 per 1,000,000 population
States shown in green met the national target.
TX
CA
MT
AZ
ID
NV
NM
CO
OR
UT IL
WY
KS
IA NE
SD
MN
ND
FL
OK
WI
MO
WA
GA AL
MI
AR
IN
LA
NY
NC
PA
MS
TN
VA KY
OH
SC
ME
WV
VT NH
CT
Rate per 1,000,000 198.9–347.7 347.8–489.2 489.3–616.1 616.2–788.6 788.7–1397.1 AK
HI
MA
NJ MD
RI
DE DC
NOTES: Data are for new cases of end-stage renal disease reported per million population and are age-adjusted to the 2000 standard population. Data are displayed by a modified Jenks classification for U.S. states which creates categories that minimize within-group variation and maximize between-group variation. The Technical Notes provide more information on the data and methods.
DATA SOURCE: United States Renal Data System (USRDS), NIH/NIDDK
Chapter 6 • Chronic Kidney Disease 6–17

Map 6–2. New Hemodialysis Patients (18+ years) Who Used Arteriovenous Fistulas as Primary Vascular Access Mode, by State: 2012
Healthy People 2020 Objective CKD-11.3 ● National Target = 35.0% ● National Rate = 36.8%
TX
CA
MT
AZ
ID
NV
NM
CO
OR
UT IL
WY
KS
IA NE
SD
MN
ND
FL
OK
WI
MO
WA
GA AL
MI
AR
IN
LA
NY
NC
PA
MS
TN
VA KY
OH
SC
ME
WV
VT NH
CT
Percent 27.3–32.9 33.0–34.9 35.0–41.5 41.6–46.4 46.5–53.9 AK
HI
MA
NJ MD
States shown in green met the national target.
RI
DE DC
NOTES: Data are for new adult hemodialysis patients who used arteriovenous fistulas or a maturing fistula as the primary mode of vascular access at the start of renal replacement therapy. Data are displayed by a modified Jenks classification for U.S. states which creates categories that minimize within-group variation and maximize between-group variation. The Technical Notes provide more information on the data and methods.
DATA SOURCES: Clinical Performance Measures Project (CPM), CMS; United States Renal Data System (USRDS), NIH/NIDDK
6–18 HEALTH
Y PEOPLE 2020 M
IDCOURSE REVIEW

Map 6–3. Total Deaths Among Persons on Dialysis, by State: 2012
Healthy People 2020 Objective CKD-14.1 ● National Target = 193.2 per 1,000 patient years at risk ● National Rate = 181.4 per 1,000 patient years at risk
States shown in green met the national target.
TX
CA
MT
AZ
ID
NV
NM
CO
OR
UT IL
WY
KS
IA NE
SD
MN
ND
FL
OK
WI
MO
WA
GA AL
MI
AR
IN
LA
NY
NC
PA
MS
TN
VA KY
OH
SC
ME
WV
VT NH
CT
Rate per 1,000 patient years at risk 137.7–162.5 162.6–193.2 193.3–204.1 204.2–225.1 225.2–260.8 AK
HI
MA
NJ MD
RI
DE DC
NOTES: Data are for deaths of persons on dialysis per 1,000 patient years at risk. Data are displayed by a modified Jenks classification for U.S. states which creates categories that minimize within-group variation and maximize between-group variation. The Technical Notes provide more information on the data and methods.
DATA SOURCE: United States Renal Data System (USRDS), NIH/NIDDK
Chapter 6 • Chronic Kidney Disease 6–19