Embed Size (px)
Citation preview

2011;71:1858-1870. Published online March 1, 2011.Cancer Res Alvin J.X. Lee, David Endesfelder, Andrew J. Rowan, et al. ResistanceChromosomal Instability Confers Intrinsic Multidrug
Updated Version 10.1158/0008-5472.CAN-10-3604doi:
Access the most recent version of this article at:
MaterialSupplementary
http://cancerres.aacrjournals.org/content/suppl/2011/02/28/71.5.1858.DC1.htmlAccess the most recent supplemental material at:
Cited Articles http://cancerres.aacrjournals.org/content/71/5/1858.full.html#ref-list-1
This article cites 50 articles, 25 of which you can access for free at:
E-mail alerts related to this article or journal.Sign up to receive free email-alerts
SubscriptionsReprints and
[email protected] Department atTo order reprints of this article or to subscribe to the journal, contact the AACR
To request permission to re-use all or part of this article, contact the AACR Publications
American Association for Cancer Research Copyright © 2011 on March 25, 2011cancerres.aacrjournals.orgDownloaded from
DOI:10.1158/0008-5472.CAN-10-3604
Therapeutics, Targets, and Chemical Biology
Chromosomal Instability Confers Intrinsic MultidrugResistance
Alvin J.X. Lee1, David Endesfelder1,4, Andrew J. Rowan1, Axel Walther5,6, Nicolai J. Birkbak7,P. Andrew Futreal8, Julian Downward2, Zoltan Szallasi7,9, Ian P.M. Tomlinson5, Michael Howell3,Maik Kschischo4, and Charles Swanton1,6
AbstractAneuploidy is associated with poor prognosis in solid tumors. Spontaneous chromosome missegregation
events in aneuploid cells promote chromosomal instability (CIN) that may contribute to the acquisition ofmultidrug resistance in vitro and heighten risk for tumor relapse in animal models. Identification of distincttherapeutic agents that target tumor karyotypic complexity has important clinical implications. To identifydistinct therapeutic approaches to specifically limit the growth of CIN tumors, we focused on a panel ofcolorectal cancer (CRC) cell lines, previously classified as either chromosomally unstable (CINþ) or diploid/near-diploid (CIN�), and treated them individually with a library of kinase inhibitors targeting components of signaltransduction, cell cycle, and transmembrane receptor signaling pathways. CINþ cell lines displayed significantintrinsic multidrug resistance compared with CIN� cancer cell lines, and this seemed to be independent ofsomatic mutation status and proliferation rate. Confirming the association of CIN rather than ploidy status withmultidrug resistance, tetraploid isogenic cells that had arisen from diploid cell lines displayed lower drugsensitivity than their diploid parental cells only with increasing chromosomal heterogeneity and isogenic cellline models of CINþ displayed multidrug resistance relative to their CIN� parental cancer cell line derivatives. Ina meta-analysis of CRC outcome following cytotoxic treatment, CINþ predicted worse progression-free ordisease-free survival relative to patients with CIN� disease. Our results suggest that stratifying tumor responsesaccording to CIN status should be considered within the context of clinical trials to minimize the confoundingeffects of tumor CIN status on drug sensitivity. Cancer Res; 71(5); 1858–70. �2011 AACR.
Introduction
Colorectal cancer (CRC) is associated with at least 2distinct patterns of genomic instability (1). The more com-mon form of genomic instability in CRC is chromosomal
instability (CIN), resulting in ongoing numerical and struc-tural chromosomal aberrations in cancer cells, leading tointratumoral heterogeneity (2, 3). The less common patternis microsatellite instability (MIN) caused by a deficiency inthe mismatch repair apparatus. Because of the accumulationof replication errors, MIN results in length variation ofmicrosatellite sequences in DNA. Most MINþ CRC cell linesare near-diploid (4, 5) and chromosomally stable (CIN�). Incontrast, CINþ CRC cell lines are aneuploid and display ahigher frequency of chromosomal missegregation errorsduring each mitosis relative to diploid cells (2). In humanCRC, CINþ is widely inferred through the measurement oftumor DNA ploidy (6); normal diploid cells are defined witha DNA index of 1.0 (7) and thus an increase in DNA indexinfers polyploidy or aneuploidy. Approximately 25% ofhuman CRC are both CIN� and MIN� (6).
Consistent molecular mechanisms responsible for the CINþ
phenotype and hence means to target this pattern of genomeinstability in colorectal and other solid tumors remain poorlydefined. Putative mechanisms that may contribute to CINinclude weakening of the spindle assembly checkpoint (SAC;refs. 8, 9), defective sister chromatid cohesion (10), merotelicsister chromatid attachments (11), defective cytokinesis (12),centrosome amplification (13), and chromosome breakage–fusion–bridge cycles (14).
Authors' Affiliations: 1Translational Cancer Therapeutics Laboratory,2Signal Transduction Laboratory, and 3High Throughput ScreeningLaboratory, Cancer Research UK London Research Institute, London,United Kingdom; 4University of Applied Sciences, Mathematics andTechniques, Remagen, Germany; 5Molecular and Population Genetics,The Wellcome Trust Centre for Human Genetics, Oxford, United Kingdom;6Royal Marsden Hospital, Department of Medicine, Sutton, United King-dom; 7Center for Biological Sequence Analysis, Technical University ofDenmark, Lyngby, Denmark; 8Cancer Genome Project, Wellcome TrustSanger Institute, Cambridge, United Kingdom; and 9Children's HospitalInformatics Program at the Harvard-MIT Division of Health Sciences andTechnology, Harvard Medical School, Boston, Massachusetts
Note: Supplementary data for this article are available at Cancer ResearchOnline (http://cancerres.aacrjournals.org/).
A.J.X. Lee and D. Endesfelder contributed equally to the work.
Corresponding Author: Charles Swanton, Translational Cancer Therapeu-ticsLaboratory,CancerResearchUKLondonResearch Institute,44Lincoln'sInn Fields, London WC2A 3LY, United Kingdom. Phone: 44-20-7269-3463;Fax 44-20-7269-3094; E-mail: [email protected]
doi: 10.1158/0008-5472.CAN-10-3604
�2011 American Association for Cancer Research.
CancerResearch
Cancer Res; 71(5) March 1, 20111858
American Association for Cancer Research Copyright © 2011 on March 25, 2011cancerres.aacrjournals.orgDownloaded from
DOI:10.1158/0008-5472.CAN-10-3604
Increasing evidence suggests that CIN is associated withpoor prognosis in solid tumors (6, 15, 16). It has been sug-gested that adverse outcome associated with CIN may berelated to increased tumor cell heterogeneity, driving theability of tumors to adapt to environmental stresses (17–19). Consistent with a hypothesis whereby CIN may enhancetumor adaptation, transient initiation of CIN, following thebrief induction of MAD2 expression in activated KRAS-initiated mouse lung tumor models, is associated with a highfrequency of tumor recurrence following withdrawal of theKRAS oncogenic stimulus (20). Preclinical studies have shownthat CIN is associated with the rapid acquisition of multidrugresistance in cell line systems (21) and intrinsic taxane resis-tance in vitro and in vivo (22). Recently, we and others haveproposed the existence of a CIN survival phenotype thatallows CINþ tumor cells to tolerate the impact of excessivechromosome gains and losses (22–24) that may in turn impactupon altered drug sensitivity.Determining how CIN might impact upon prognosis and
how this pattern of genomic instability might be specificallytargeted remains an important research area (23, 25). Evi-dence in lower eukaryotes has shown that aneuploid Sacchar-omyces cerevisiae are dependent on increased glucoseutilization and are more sensitive to both heat shock protein90 and proteosome inhibitors (26). Polyploid S. cerevisiae aredependent upon increased expression of genes involved insister chromatid cohesion and mitotic spindle function (27).Roschke and Kirsch have shown the existence of anticancercompounds that may specifically target karyotypically com-plex cancer cells (25). These observations indicate thatkaryotypic instability may be specifically targeted in eukar-yotic organisms and suggest that CIN might be an exploitableand targetable phenotype in cancer.To identify distinct therapeutic approaches to limit the
growth of CINþ tumors relative to diploid cells, we focused ona panel of CRC cell lines that had previously been classified asCINþ or CIN� and used kinase inhibitor and cytotoxic librariesto identify agents that might be preferentially lethal towardCINþ cells. Both isogenic and nonisogenic CINþ cell linesdisplayed intrinsic multidrug resistance in vitro relative toCIN� cell lines. Importantly, consistent with the proposal thatCINþ is associated with intrinsic multidrug resistance, in ameta-analysis of patient outcome in CRC, CINþ was asso-ciated with significantly worse clinical outcome relative todiploid cancers in both early- and late-stage disease followingcytotoxic therapy.
Materials and Methods
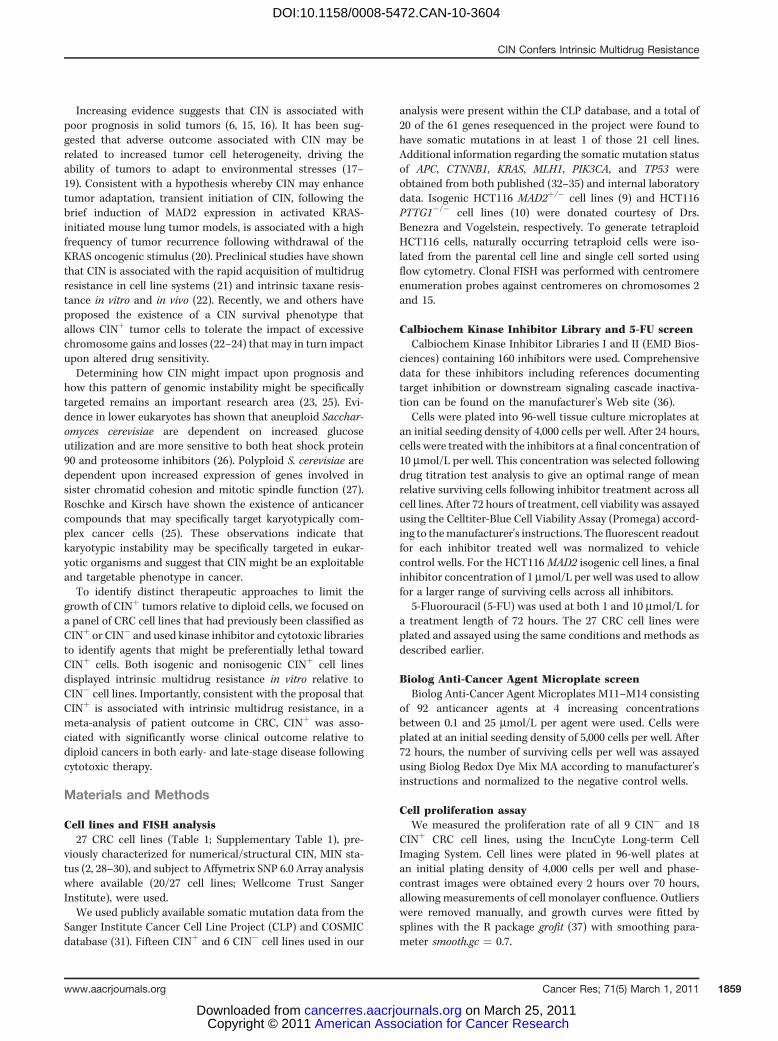
Cell lines and FISH analysis27 CRC cell lines (Table 1; Supplementary Table 1), pre-
viously characterized for numerical/structural CIN, MIN sta-tus (2, 28–30), and subject to Affymetrix SNP 6.0 Array analysiswhere available (20/27 cell lines; Wellcome Trust SangerInstitute), were used.We used publicly available somatic mutation data from the
Sanger Institute Cancer Cell Line Project (CLP) and COSMICdatabase (31). Fifteen CINþ and 6 CIN� cell lines used in our
analysis were present within the CLP database, and a total of20 of the 61 genes resequenced in the project were found tohave somatic mutations in at least 1 of those 21 cell lines.Additional information regarding the somatic mutation statusof APC, CTNNB1, KRAS, MLH1, PIK3CA, and TP53 wereobtained from both published (32–35) and internal laboratorydata. Isogenic HCT116 MAD2þ/� cell lines (9) and HCT116PTTG1�/� cell lines (10) were donated courtesy of Drs.Benezra and Vogelstein, respectively. To generate tetraploidHCT116 cells, naturally occurring tetraploid cells were iso-lated from the parental cell line and single cell sorted usingflow cytometry. Clonal FISH was performed with centromereenumeration probes against centromeres on chromosomes 2and 15.
Calbiochem Kinase Inhibitor Library and 5-FU screenCalbiochem Kinase Inhibitor Libraries I and II (EMD Bios-
ciences) containing 160 inhibitors were used. Comprehensivedata for these inhibitors including references documentingtarget inhibition or downstream signaling cascade inactiva-tion can be found on the manufacturer's Web site (36).
Cells were plated into 96-well tissue culture microplates atan initial seeding density of 4,000 cells per well. After 24 hours,cells were treatedwith the inhibitors at a final concentration of10 mmol/L per well. This concentration was selected followingdrug titration test analysis to give an optimal range of meanrelative surviving cells following inhibitor treatment across allcell lines. After 72 hours of treatment, cell viability was assayedusing the Celltiter-Blue Cell Viability Assay (Promega) accord-ing to themanufacturer's instructions. The fluorescent readoutfor each inhibitor treated well was normalized to vehiclecontrol wells. For the HCT116MAD2 isogenic cell lines, a finalinhibitor concentration of 1 mmol/L per well was used to allowfor a larger range of surviving cells across all inhibitors.
5-Fluorouracil (5-FU) was used at both 1 and 10 mmol/L fora treatment length of 72 hours. The 27 CRC cell lines wereplated and assayed using the same conditions and methods asdescribed earlier.
Biolog Anti-Cancer Agent Microplate screenBiolog Anti-Cancer Agent Microplates M11–M14 consisting
of 92 anticancer agents at 4 increasing concentrationsbetween 0.1 and 25 mmol/L per agent were used. Cells wereplated at an initial seeding density of 5,000 cells per well. After72 hours, the number of surviving cells per well was assayedusing Biolog Redox Dye Mix MA according to manufacturer'sinstructions and normalized to the negative control wells.
Cell proliferation assayWe measured the proliferation rate of all 9 CIN� and 18
CINþ CRC cell lines, using the IncuCyte Long-term CellImaging System. Cell lines were plated in 96-well plates atan initial plating density of 4,000 cells per well and phase-contrast images were obtained every 2 hours over 70 hours,allowing measurements of cell monolayer confluence. Outlierswere removed manually, and growth curves were fitted bysplines with the R package grofit (37) with smoothing para-meter smooth.gc ¼ 0.7.
CIN Confers Intrinsic Multidrug Resistance
www.aacrjournals.org Cancer Res; 71(5) March 1, 2011 1859
American Association for Cancer Research Copyright © 2011 on March 25, 2011cancerres.aacrjournals.orgDownloaded from
DOI:10.1158/0008-5472.CAN-10-3604
Tab
le1.
Celllines
used
inthis
stud
y
NOTE
:Black
indicates
prese
nceof
mutation;
white
indicates
abse
nceof
mutation;
andgray
indicates
mutationstatus
notkn
own.
Lee et al.
Cancer Res; 71(5) March 1, 2011 Cancer Research1860
American Association for Cancer Research Copyright © 2011 on March 25, 2011cancerres.aacrjournals.orgDownloaded from
DOI:10.1158/0008-5472.CAN-10-3604

Meta-analysis of clinical studiesSurvival data were summarized using a log hazard ratio for
comparison between CINþ and CIN� groups. Data fromindividual studies were extracted using the methods describedby Parmar and colleagues (38) and pooled to generate thesummary statistic and CIs using a fixed-effects model withinverse variance weighting. All meta-analyses were performedusing Stata 10.1 (Stata Corp).
Statistical methodsAll tests were performed as 2-sided unless otherwise men-
tioned. To remove outliers, drugs resulting in relative numberof cells greater than 1.4 were eliminated from analysis. AKolmogorov–Smirnov test was performed to test for overalldifferences in the distribution of relative cell numbers follow-ing inhibitor treatment between CINþ and CIN� cell lines.Inhibitors that showed a fraction of surviving cells greaterthan 0.8 in more than 75% of the cell lines were excluded fromthe analysis. For comparisons of 2 cell lines, drugs resulting inrelative number of cells greater than 0.8 in both cell lines wereremoved from analysis. A Wilcoxon signed-rank test was usedto test for differences between CINþ and CIN� cells (for eachconcentration of drug in Biolog microplates). For the Biologmicroplates, each concentration of drug was used in duplicate;therefore, the replicates which showed the least difference incell number between the 2 cell lines was used for furtheranalysis.The maximal slope of the growth curve (m) for each cell
line was used to test whether the difference in drug sensi-tivity between CINþ and CIN� colorectal cancer cell lineswas not solely due to different proliferation rates. CINþ andCIN� cell lines with m < 1 were tested with a one-sidedWilcoxon–Mann–Whitney test. Next, we corrected for theinfluence of the proliferation rates of each cell line. Weestimated a linear regression model for all cell lines withm < 1, where m was used as an independent variable and themean fraction of surviving cells over all inhibitors as adependent variable. The residuals of this analysis weretested for significant differences between CINþ and CIN�
with a one-sided Wilcoxon–Mann–Whitney test (39). Ananalysis of covariance model with interactions was applied,where the mean fraction of surviving cells over all inhibitorswas used as a dependent variable, m as a linear, independentvariable, and CIN status as a factor variable. The interactionterm was utilized to test for significant differences in slopesbetween CINþ and CIN� cell lines.To test for significant differences in sensitivity to thymi-
dylate synthase inhibitors comparing HCT116 diploid par-ental and PTTG1�/� or MAD2þ/� cells, we corrected for theinfluence of different concentrations by estimating a linearregression model for near linear correlations between con-centration and sensitivity or a one-way ANOVA otherwise. Ineach case, the concentration was used as the independentvariable and the resulting residuals were tested for differ-ences between CINþ and CIN� cells with a Wilcoxon–Mann–Whitney test.All statistical analyses were performed in R and can be
found in the Supplementary Sweave document.
Results
Classification of CINþ cell lines and relationship withploidy status and structural chromosomal complexity
We selected 9 CIN� and 18 CINþ CRC cell lines (Table 1).CIN status for these cell lines had been previously described interms of numerical and structural chromosomal aberrations(2, 28–30).
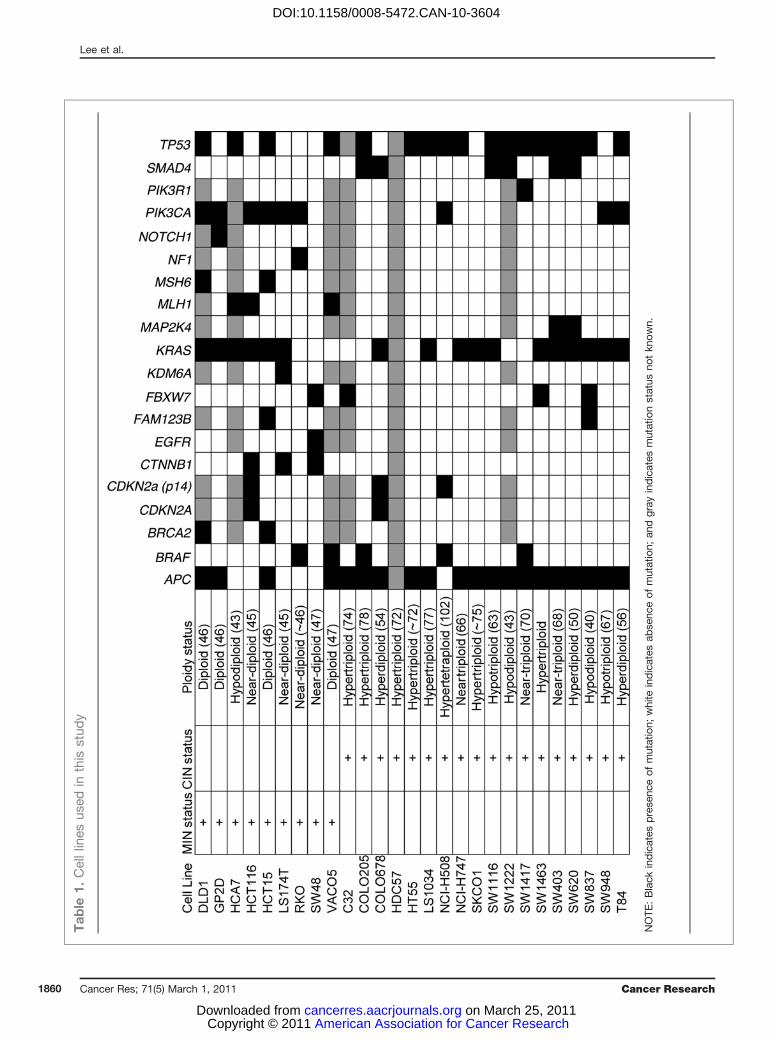
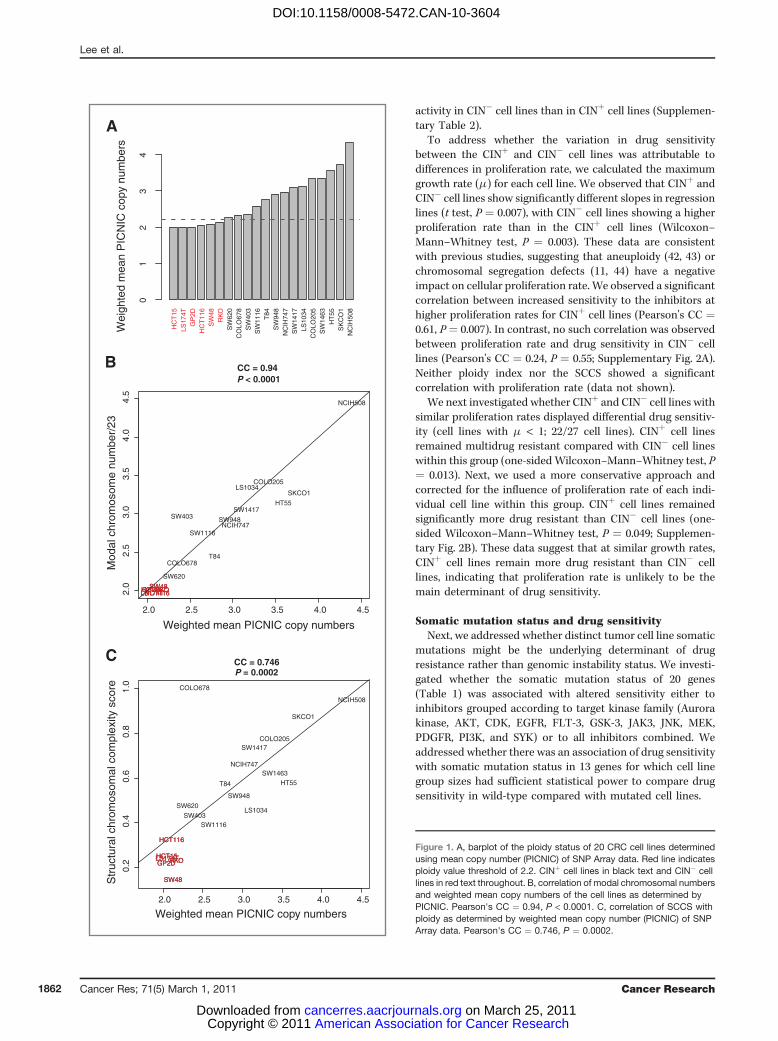
To confirm the utility of published approaches for defin-ing the CIN status of the cell lines, where SNP Array datawere available, we estimated the ploidy status of the celllines by using weighted mean integer copy numbers derivedfrom the PICNIC (Predicting Integral Copy Numbers InCancer) algorithm (ref. 40; Fig. 1A). Ploidy estimates classi-fied cells as CINþ if they surpassed a threshold of ploidygreater than 2.2 (corresponding to an estimated DNA indexof 1.1). In addition, modal chromosomal number as deter-mined previously using high-quality metaphase spreads (28,29) correlated well with ploidy estimates derived fromweighted mean PICNIC copy number analysis using theSNP Array data [Pearson's correlation coefficient (CC) ¼0.94, Pearson's correlation test P < 0.0001; Fig. 1B]. Thesedata support the utility of SNP Array data for estimatingcell line ploidy status and are consistent with ploidy esti-mates by traditional measures, confirming the CIN status ofcell lines used in this analysis.
Next, we addressed the relationship between CIN status andstructural chromosomal complexity, using a summary struc-tural chromosomal complexity score (SCCS) derived from theSNP Array data sets. This SCCS was determined by summar-izing (i) the number of break points, (ii) LOH events aspredicted using PICNIC (40), and (iii) the Genome IntegrityIndex (GII; ref. 41) into a single value for each cell line (Fig. 1C).There was a highly significant correlation between ploidystatus and the SCCS (Pearson's CC ¼ 0.746, P ¼ 0.0002).Taken together, these analyses confirm that cells classified asCINþ have significantly greater ploidy and structural chromo-somal complexity than CIN� cells.
CINþ status is associated with intrinsic multidrugresistance
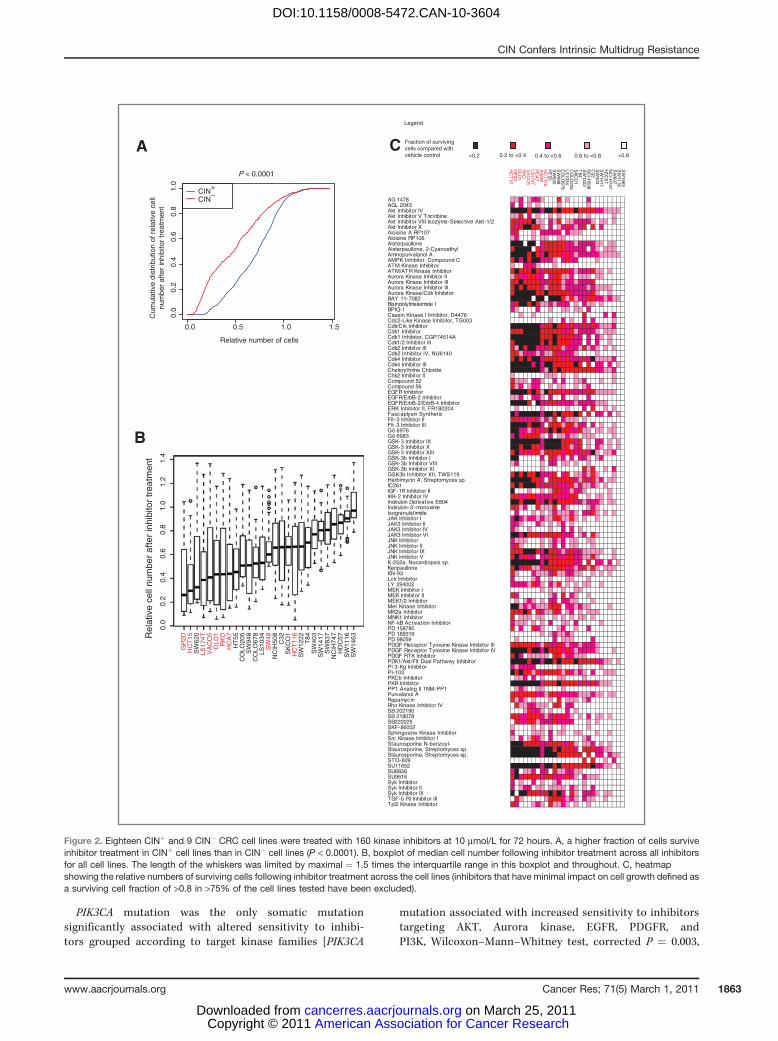
Next, we aimed to determine whether a specific kinaseinhibitor could be identified to selectively target CINþ celllines. We used a small molecule library (Calbiochem KinaseInhibitor Library I and II) that included 160 inhibitors to treatthe 18 CINþ and 9 CIN� cell lines. Preliminary drug titrationexperiments revealed that the majority of the CINþ cell lineswere resistant to concentrations up to 1 mmol/L (Supplemen-tary Fig. 1) and therefore 10 mmol/L was selected as theoptimal drug concentration for cell growth inhibition acrossthe majority of cell lines in order to attempt to identify drugsthat were specifically active in CINþ cells. No specific inhibitoror inhibitor family was found to be preferentially active inCINþ cell lines compared with CIN� cell lines. In contrast,CINþ cancer cell lines were significantly more resistant to theinhibitors (Kolmogorov–Smirnov test, P < 0.0001; Fig. 2A–C).Following correction for multiple testing hypotheses, 45 inhi-bitors were identified which showed significantly greater
CIN Confers Intrinsic Multidrug Resistance
www.aacrjournals.org Cancer Res; 71(5) March 1, 2011 1861
American Association for Cancer Research Copyright © 2011 on March 25, 2011cancerres.aacrjournals.orgDownloaded from
DOI:10.1158/0008-5472.CAN-10-3604
activity in CIN� cell lines than in CINþ cell lines (Supplemen-tary Table 2).
To address whether the variation in drug sensitivitybetween the CINþ and CIN� cell lines was attributable todifferences in proliferation rate, we calculated the maximumgrowth rate (m) for each cell line. We observed that CINþ andCIN� cell lines show significantly different slopes in regressionlines (t test, P ¼ 0.007), with CIN� cell lines showing a higherproliferation rate than in the CINþ cell lines (Wilcoxon–Mann–Whitney test, P ¼ 0.003). These data are consistentwith previous studies, suggesting that aneuploidy (42, 43) orchromosomal segregation defects (11, 44) have a negativeimpact on cellular proliferation rate. We observed a significantcorrelation between increased sensitivity to the inhibitors athigher proliferation rates for CINþ cell lines (Pearson's CC ¼0.61, P¼ 0.007). In contrast, no such correlation was observedbetween proliferation rate and drug sensitivity in CIN� celllines (Pearson's CC ¼ 0.24, P ¼ 0.55; Supplementary Fig. 2A).Neither ploidy index nor the SCCS showed a significantcorrelation with proliferation rate (data not shown).
We next investigated whether CINþ and CIN� cell lines withsimilar proliferation rates displayed differential drug sensitiv-ity (cell lines with m < 1; 22/27 cell lines). CINþ cell linesremained multidrug resistant compared with CIN� cell lineswithin this group (one-sided Wilcoxon–Mann–Whitney test, P¼ 0.013). Next, we used a more conservative approach andcorrected for the influence of proliferation rate of each indi-vidual cell line within this group. CINþ cell lines remainedsignificantly more drug resistant than CIN� cell lines (one-sided Wilcoxon–Mann–Whitney test, P ¼ 0.049; Supplemen-tary Fig. 2B). These data suggest that at similar growth rates,CINþ cell lines remain more drug resistant than CIN� celllines, indicating that proliferation rate is unlikely to be themain determinant of drug sensitivity.
Somatic mutation status and drug sensitivityNext, we addressed whether distinct tumor cell line somatic
mutations might be the underlying determinant of drugresistance rather than genomic instability status. We investi-gated whether the somatic mutation status of 20 genes(Table 1) was associated with altered sensitivity either toinhibitors grouped according to target kinase family (Aurorakinase, AKT, CDK, EGFR, FLT-3, GSK-3, JAK3, JNK, MEK,PDGFR, PI3K, and SYK) or to all inhibitors combined. Weaddressed whether there was an association of drug sensitivitywith somatic mutation status in 13 genes for which cell linegroup sizes had sufficient statistical power to compare drugsensitivity in wild-type compared with mutated cell lines.
HC
T15
LS17
4TG
P2D
HC
T11
6S
W48
RK
OS
W62
0C
OLO
678
SW
403
SW
1116
T84
SW
948
NC
IH74
7S
W14
17LS
1034
CO
LO20
5S
W14
63H
T55
SK
CO
1N
CIH
508
Wei
ghte
d m
ean
PIC
NIC
cop
y nu
mbe
rs
01
23
4A
2.0 2.5 3.0 3.5 4.0 4.5
2.0
2.5
3.0
3.5
4.0
4.5
CC = 0.94 P < 0.0001
Weighted mean PICNIC copy numbers
Mod
al c
hrom
osom
e nu
mbe
r/23
COLO205
COLO678
GP2DHCT116HCT15
HT55
LS1034
LS174T
NCIH508
NCIH747
RKO
SKCO1
SW1116
SW1417SW403
SW48
SW620
SW948
T84
GP2DHCT116HCT15LS174TRKOSW48
B
2.0 2.5 3.0 3.5 4.0 4.5
0.2
0.4
0.6
0.8
1.0
CC = 0.746
Weighted mean PICNIC copy numbers
Str
uctu
ral c
hrom
osom
al c
ompl
exity
sco
re
COLO205
COLO678
GP2D
HCT116
HCT15
HT55
LS1034
LS174T
NCIH508
NCIH747
RKO
SKCO1
SW1116
SW1417
SW1463
SW403
SW48
SW620
SW948
T84
GP2D
HCT116
HCT15LS174TRKO
SW48
P = 0.0002
C
Figure 1. A, barplot of the ploidy status of 20 CRC cell lines determinedusing mean copy number (PICNIC) of SNP Array data. Red line indicatesploidy value threshold of 2.2. CINþ cell lines in black text and CIN� celllines in red text throughout. B, correlation of modal chromosomal numbersand weighted mean copy numbers of the cell lines as determined byPICNIC. Pearson's CC ¼ 0.94, P < 0.0001. C, correlation of SCCS withploidy as determined by weighted mean copy number (PICNIC) of SNPArray data. Pearson's CC ¼ 0.746, P ¼ 0.0002.
Lee et al.
Cancer Res; 71(5) March 1, 2011 Cancer Research1862
American Association for Cancer Research Copyright © 2011 on March 25, 2011cancerres.aacrjournals.orgDownloaded from
DOI:10.1158/0008-5472.CAN-10-3604
PIK3CA mutation was the only somatic mutationsignificantly associated with altered sensitivity to inhibi-tors grouped according to target kinase families [PIK3CA
mutation associated with increased sensitivity to inhibitorstargeting AKT, Aurora kinase, EGFR, PDGFR, andPI3K, Wilcoxon–Mann–Whitney test, corrected P ¼ 0.003,
A C
Legend
Fraction of survivingcells compared withvehicle control <0.2 0.2 to <0.4 0.4 to <0.6 0.6 to <0.8 >0.8
HC
T15
GP
2DD
LD1
RK
OV
AC
O5
LS174T
HC
A7
SW
48H
CT
116H
T55
SW
620S
W948
CO
LO678
LS1034
CO
LO205
SK
CO
1T
84S
W1222
NC
I-H508
C32
SW
403S
W1417
HD
C57
NC
I-H747
SW
837S
W1116
SW
1463
AG 1478AGL 2043Akt Inhibitor IVAkt Inhibitor V TriciribineAkt Inhibitor VIII Isozyme-Selective Akti-1/2Akt Inhibitor XAloisine A RP107Aloisine RP106AlsterpaulloneAlsterpaullone, 2-CyanoethylAminopurvalanol AAMPK Inhibitor, Compound CATM Kinase InhibitorATM/ATR Kinase InhibitorAurora Kinase Inhibitor IIAurora Kinase Inhibitor IIIAurora Kinase Inhibitor IIIAurora Kinase/Cdk InhibitorBAY 11-7082Bisindolylmaleimide IBPIQ-ICasein Kinase I Inhibitor, D4476Cdc2-Like Kinase Inhibitor, TG003Cdk/Crk InhibitorCdk1 InhibitorCdk1 Inhibitor, CGP74514ACdk1/2 Inhibitor IIICdk2 Inhibitor IIICdk2 Inhibitor IV, NU6140Cdk4 InhibitorCdk4 Inhibitor IIIChelerythrine ChlorideChk2 Inhibitor IICompound 52Compound 56EGFR InhibitorEGFR/ErbB-2 InhibitorEGFR/ErbB-2/ErbB-4 Inhibitor ERK Inhibitor II, FR180204Fascaplysin SyntheticFlt-3 Inhibitor IIFlt-3 Inhibitor IIIGö 6976Gö 6983GSK-3 Inhibitor IXGSK-3 Inhibitor XGSK-3 Inhibitor XIIIGSK-3b Inhibitor IGSK-3b Inhibitor VIIIGSK-3b Inhibitor XIGSK3b Inhibitor XII, TWS119 Herbimycin A, Streptomyces sp.IC261IGF-1R Inhibitor IIIKK-2 Inhibitor IVIndirubin Derivative E804Indirubin-3’-monoximeIsogranulatimideJAK Inhibitor IJAK3 Inhibitor IIJAK3 Inhibitor IVJAK3 Inhibitor VIJNK InhibitorJNK Inhibitor IIJNK Inhibitor IXJNK Inhibitor VK-252a, Nocardiopsis sp.KenpaulloneKN-93Lck InhibitorLY 294002MEK Inhibitor IMEK Inhibitor IIMEK1/2 InhibitorMet Kinase InhibitorMK2a InhibitorMNK1 InhibitorNF-kB Activation InhibitorPD 158780PD 169316PD 98059PDGF Receptor Tyrosine Kinase Inhibitor IIIPDGF Receptor Tyrosine Kinase Inhibitor IVPDGF RTK InhibitorPDK1/Akt/Flt Dual Pathway InhibitorPI 3-Kg Inhibitor PI-103PKCb InhibitorPKR InhibitorPP1 Analog II 1NM-PP1Purvalanol ARapamycinRho Kinase Inhibitor IVSB 202190SB 218078SB220025SKF-86002Sphingosine Kinase InhibitorSrc Kinase Inhibitor IStaurosporine N-benzoyl-Staurosporine, Streptomyces sp.Staurosporine, Streptomyces sp.STO-609SU11652SU6656SU9516Syk InhibitorSyk Inhibitor IISyk Inhibitor IIITGF-b RI Inhibitor IIITpl2 Kinase Inhibitor
P < 0.0001
Relative number of cells
Cum
ulat
ive
dist
ribut
ion
of r
elat
ive
cell
num
ber
afte
r in
hibi
tor
trea
tmen
t
B
0.0 0.5 1.0 1.5
0.0
0.2
0.4
0.6
0.8
1.0
CIN+
CIN–
0.0
0.2
0.4
0.6
0.8
1.0
1.2
1.4
Rel
ativ
e ce
ll nu
mbe
r af
ter
inhi
bito
r tr
eatm
ent
GP
2DH
CT
15S
W62
0LS
174T
VA
CO
5D
LD1
RK
OH
CA
7H
T55
CO
LO20
5S
W94
8C
OLO
678
LS10
34S
W48
NC
IH50
8C
32S
KC
O1
HC
T11
6S
W12
22T
84S
W40
3S
W14
17S
W83
7N
CIH
747
HD
C57
SW
1116
SW
1463
1 1 1 1 1 0 1 1 1 1 1 0 1 1 1 1 1 1 0 1 1 1 1 1 1 1 11 1 0 1 1 2 1 1 1 1 1 1 1 1 1 1 1 1 1 1 1 1 1 1 1 1 10 0 0 0 0 0 0 1 0 0 0 0 0 0 0 0 0 0 0 0 1 0 1 1 1 1 11 1 0 1 0 1 1 1 1 1 2 1 1 1 1 1 1 1 1 1 1 1 1 1 1 1 10 0 0 0 0 0 1 1 1 0 1 0 1 1 1 1 1 1 1 1 1 1 1 1 1 1 10 1 0 0 0 0 0 1 1 1 1 1 0 0 0 1 1 0 1 0 1 1 1 1 1 1 20 0 1 1 1 1 1 1 0 1 1 1 1 1 1 1 1 1 1 1 1 1 1 1 1 1 11 0 1 1 1 1 1 1 1 1 1 1 1 1 1 1 1 1 1 1 1 1 1 1 1 1 10 0 0 1 0 0 2 1 0 0 0 0 0 0 0 1 1 1 1 0 1 1 1 1 1 1 10 0 0 0 0 1 0 1 0 0 0 0 0 0 0 0 1 0 1 0 1 1 1 1 1 1 10 0 0 0 0 0 0 1 0 0 0 0 0 0 0 1 1 0 0 0 1 1 1 1 1 1 10 0 1 0 0 0 0 1 1 0 1 1 1 0 1 1 1 1 1 1 1 1 1 1 1 1 21 1 1 0 0 0 1 1 1 1 1 1 1 1 2 1 1 1 1 1 1 1 1 1 1 1 10 0 0 0 0 0 0 1 0 0 0 0 0 0 0 1 1 0 1 0 1 1 1 1 1 1 11 0 0 0 0 0 0 1 1 1 0 0 1 1 0 1 1 1 1 1 1 1 1 1 1 1 10 0 0 0 0 0 0 1 1 0 0 0 1 0 0 1 1 0 0 0 1 1 1 1 1 1 10 0 0 0 0 0 0 1 1 0 0 0 1 0 0 1 1 1 1 0 1 1 1 1 1 1 10 0 0 0 0 0 0 0 0 0 0 0 0 0 0 1 1 1 1 0 1 1 1 1 1 1 10 0 0 0 0 1 0 0 1 0 0 0 0 1 0 1 0 0 0 0 1 0 1 1 1 1 10 0 0 0 0 0 0 1 1 1 1 1 1 0 1 1 1 1 1 1 1 1 1 1 1 1 11 1 1 1 1 2 1 2 1 1 1 1 1 1 1 1 1 1 0 1 1 1 1 1 1 1 11 1 1 1 1 1 1 1 1 1 1 2 1 1 1 1 1 0 2 1 1 1 1 2 1 1 11 1 1 1 2 1 1 1 1 1 1 1 1 1 1 1 1 1 1 0 1 1 1 1 1 1 10 0 0 0 0 0 0 1 0 0 0 0 0 0 0 0 0 0 1 0 1 1 1 1 1 1 10 0 0 0 0 0 0 0 0 0 0 0 1 0 0 1 0 0 1 0 1 1 1 1 1 1 10 0 0 0 0 0 0 0 0 0 0 0 0 0 0 0 0 1 0 1 1 1 1 1 1 1 10 0 0 0 0 0 0 0 0 0 0 0 0 0 0 0 0 1 1 1 1 1 1 1 1 1 10 1 0 0 0 0 0 1 0 0 0 0 1 0 0 0 1 0 1 0 1 1 1 1 1 1 10 0 1 0 0 0 1 1 1 1 0 1 1 1 0 1 1 1 1 1 1 1 1 1 1 1 20 0 0 0 0 0 0 1 0 0 0 0 0 0 1 0 1 0 1 0 1 1 1 1 1 1 10 0 0 0 0 0 0 1 0 0 0 0 0 0 0 0 0 1 0 1 1 1 1 1 1 1 10 0 0 0 0 0 0 1 1 0 0 0 0 0 0 0 0 0 0 0 1 0 1 1 1 1 11 1 1 1 1 1 1 1 1 1 1 1 1 1 1 1 1 1 1 1 1 1 1 1 1 1 10 1 1 1 1 0 1 1 1 1 1 1 1 1 1 1 1 0 1 1 1 1 1 1 1 1 10 1 0 1 1 1 0 1 1 1 1 1 1 1 1 1 1 1 0 1 1 1 1 1 1 1 10 0 0 0 0 0 0 1 0 0 0 0 1 0 0 1 0 1 0 0 1 1 1 1 1 1 11 1 1 1 1 0 0 1 1 0 2 1 1 1 1 1 1 1 1 1 1 1 1 1 1 1 10 0 0 0 0 2 0 1 0 0 0 0 0 0 0 1 1 1 0 0 1 1 1 1 1 1 11 1 1 1 1 1 1 1 1 1 1 1 1 1 1 1 1 0 1 0 1 1 1 1 1 1 10 1 0 0 0 0 0 1 0 0 0 0 0 0 0 0 0 1 0 1 1 0 1 1 1 1 10 0 1 1 1 0 0 1 0 1 0 1 1 1 1 1 1 1 1 1 1 1 1 1 1 1 10 0 0 0 0 0 0 1 1 0 0 0 1 0 0 1 0 0 2 0 1 1 1 1 1 1 10 0 0 1 1 0 0 1 0 0 0 0 0 0 0 1 0 1 1 1 1 1 1 1 1 1 11 0 0 0 0 0 0 1 1 1 1 1 1 1 1 1 1 1 1 1 1 1 1 1 1 1 10 0 0 0 0 0 0 1 0 0 0 0 0 0 0 0 0 1 1 1 1 1 1 1 1 1 10 0 0 0 0 0 0 1 0 0 0 0 0 0 1 1 0 1 1 2 1 1 1 1 1 1 10 0 1 0 0 0 0 1 0 0 0 0 0 0 0 1 1 0 0 0 1 1 1 1 1 1 10 0 1 1 1 1 1 1 1 0 0 1 1 1 0 1 1 1 1 1 1 1 1 1 1 1 11 1 1 1 1 1 1 1 1 1 1 1 1 1 1 1 1 1 1 1 1 1 1 1 1 1 11 1 1 1 1 1 1 1 1 1 1 2 1 1 1 1 1 0 1 0 1 1 1 1 1 1 10 0 0 0 0 0 0 1 0 0 0 1 1 0 1 1 1 1 1 0 1 1 1 1 1 1 10 0 0 0 0 0 0 1 1 0 0 0 0 0 0 1 1 0 1 0 1 1 1 1 1 1 10 0 0 0 0 0 0 1 0 0 0 1 1 1 0 1 1 1 1 0 1 1 1 1 1 1 10 1 1 1 1 1 1 1 1 1 0 0 1 0 1 0 1 1 1 1 1 1 1 1 1 1 10 0 0 1 0 0 0 1 1 0 0 1 1 0 0 0 1 1 1 1 1 1 1 1 1 1 10 0 0 0 0 0 0 1 0 0 0 0 0 0 0 1 0 1 0 0 1 1 1 1 1 1 10 0 1 1 1 1 0 1 1 1 0 1 0 1 1 1 1 1 1 1 1 1 1 1 1 1 11 1 1 1 1 1 1 1 1 1 0 1 1 1 1 1 1 0 1 0 1 1 1 1 1 1 10 0 1 1 0 0 1 1 1 1 0 0 1 1 0 1 1 1 1 1 1 1 1 1 1 1 10 1 1 1 1 1 0 1 1 1 1 1 1 1 1 1 1 1 1 1 1 1 1 1 1 1 10 1 1 1 1 2 2 1 1 1 1 1 0 1 1 1 1 1 1 2 1 1 1 1 1 1 10 0 0 0 0 0 0 1 0 0 0 0 1 0 0 1 1 0 1 0 1 1 1 1 1 1 11 1 1 1 1 1 1 1 1 1 1 1 1 1 1 1 1 1 1 1 1 1 1 1 1 1 10 0 1 1 1 1 1 1 1 1 1 1 1 1 1 1 1 1 1 1 1 1 1 1 1 1 10 0 0 0 0 0 0 1 0 0 0 1 1 0 0 1 1 1 1 1 1 1 1 1 1 1 10 0 1 0 1 1 1 1 1 0 0 1 0 0 0 0 1 1 1 0 1 1 1 1 1 1 10 0 0 0 0 0 0 1 0 0 0 0 0 0 0 0 0 1 0 1 1 1 1 1 1 1 10 0 0 0 0 1 1 1 0 0 0 0 0 0 0 1 1 0 1 0 1 1 1 1 1 1 10 1 1 1 1 0 1 1 1 1 0 1 1 1 1 1 1 1 1 1 1 1 1 1 1 1 11 1 1 1 1 1 1 1 1 1 1 1 1 1 1 1 1 1 1 1 1 1 1 1 1 1 11 1 0 0 1 0 1 1 1 1 1 0 1 1 1 1 1 1 1 1 1 1 1 1 1 1 11 1 1 1 2 1 2 1 1 1 1 1 1 1 1 1 1 1 2 2 1 1 1 1 1 1 10 0 1 1 1 1 1 1 1 1 1 1 0 1 0 1 1 1 1 1 1 1 1 1 1 1 11 1 1 1 0 1 1 1 1 1 0 1 1 1 1 1 1 1 1 1 1 1 1 1 1 1 10 0 1 0 1 0 1 1 1 0 0 0 1 0 0 1 0 1 1 1 1 1 1 1 1 1 10 0 0 0 0 1 0 1 1 1 0 1 1 1 0 1 1 1 1 1 1 1 1 1 1 1 10 1 1 1 1 1 1 1 1 1 1 1 1 1 1 1 1 1 1 1 1 1 1 1 1 1 21 1 1 1 1 1 1 1 1 1 1 1 1 1 1 1 1 1 2 1 1 1 1 1 1 1 20 1 1 1 1 0 0 1 1 1 1 1 1 1 1 1 1 1 1 1 1 1 1 1 1 1 11 1 1 1 1 1 1 1 1 1 1 1 1 1 1 1 1 1 1 1 1 1 1 1 1 1 11 1 1 1 1 1 1 1 1 1 1 1 1 1 1 1 1 1 1 0 1 1 1 1 1 1 10 0 0 0 0 0 1 1 0 0 0 0 1 1 1 1 1 0 1 1 1 1 1 1 1 1 10 0 0 0 0 0 0 1 0 0 0 0 0 0 0 1 1 0 0 0 1 1 1 1 1 1 10 0 1 1 1 1 1 1 1 1 0 0 1 1 1 1 1 1 1 1 1 1 1 1 1 1 20 0 0 0 0 0 0 1 0 0 0 0 0 0 0 0 0 0 0 0 1 1 1 1 1 1 11 1 1 1 0 1 1 1 1 1 2 1 1 1 1 1 1 1 1 1 1 1 1 1 1 1 20 0 0 0 0 1 0 1 0 0 0 0 1 0 1 1 1 1 1 0 1 1 1 1 1 1 11 1 1 0 1 1 1 1 1 1 2 1 1 1 1 1 1 1 1 1 1 1 1 1 1 1 20 0 0 0 0 0 0 1 0 0 0 0 0 0 0 0 1 0 0 0 1 1 1 1 1 1 11 1 1 1 1 2 1 1 1 1 1 1 1 1 2 1 1 1 2 1 1 1 1 1 1 1 10 0 0 0 0 0 0 1 1 0 0 0 0 1 0 1 1 1 1 1 1 1 1 1 1 1 10 1 0 1 1 1 1 1 1 1 1 0 1 1 1 1 1 1 1 1 1 1 1 1 1 1 11 0 1 1 0 0 1 1 1 1 0 0 1 1 0 1 1 1 1 1 1 1 1 1 1 1 11 1 1 1 0 1 1 1 1 1 2 1 1 1 1 1 1 1 1 1 1 1 1 1 1 1 10 0 1 1 0 0 0 1 1 0 0 1 0 1 1 1 1 1 1 1 1 1 1 1 1 1 11 0 1 0 0 0 1 1 1 0 0 1 1 0 0 1 1 2 1 1 1 1 1 1 1 1 11 1 1 1 1 1 1 1 1 1 1 1 1 1 1 1 1 1 1 1 1 1 1 1 1 1 10 1 1 1 1 1 1 1 1 1 1 1 1 1 1 1 1 1 1 1 1 1 1 1 1 1 11 1 0 1 1 0 0 1 1 1 2 1 1 1 1 1 1 1 1 1 1 1 1 1 1 1 10 0 0 0 0 0 0 1 0 0 0 0 1 0 0 1 1 1 1 0 2 1 1 1 1 1 20 0 0 0 0 0 0 1 0 0 0 0 0 0 0 1 1 0 0 0 1 1 1 1 1 1 10 0 0 0 0 0 0 1 0 0 0 0 0 0 0 0 0 1 0 1 1 1 1 1 1 1 11 1 1 1 1 1 1 1 1 1 1 1 1 1 1 1 1 0 1 0 1 1 1 1 1 1 10 0 0 0 0 0 0 1 0 0 0 0 0 0 0 0 0 0 0 0 1 0 1 1 1 1 10 0 1 1 1 1 1 1 1 1 0 1 1 1 0 1 1 1 1 1 1 1 1 1 1 1 20 0 0 0 0 0 0 1 0 0 0 0 1 0 0 1 1 0 1 1 1 1 1 1 1 1 11 1 1 1 1 1 1 1 1 1 1 1 1 1 1 1 1 1 1 1 1 1 1 1 1 1 11 1 1 0 0 2 1 1 1 1 1 1 1 1 1 1 1 1 1 1 1 1 1 1 1 1 10 1 0 0 0 0 0 1 0 0 0 0 1 1 0 1 1 1 1 0 1 1 1 1 1 1 11 0 1 1 1 2 1 1 1 0 0 0 1 1 0 1 1 1 1 1 1 1 1 1 1 1 10 1 1 1 1 1 1 1 1 0 1 1 1 1 1 1 1 1 1 1 1 1 1 1 1 1 1
Figure 2. Eighteen CINþ and 9 CIN� CRC cell lines were treated with 160 kinase inhibitors at 10 mmol/L for 72 hours. A, a higher fraction of cells surviveinhibitor treatment in CINþ cell lines than in CIN� cell lines (P < 0.0001). B, boxplot of median cell number following inhibitor treatment across all inhibitorsfor all cell lines. The length of the whiskers was limited by maximal ¼ 1.5 times the interquartile range in this boxplot and throughout. C, heatmapshowing the relative numbers of surviving cells following inhibitor treatment across the cell lines (inhibitors that have minimal impact on cell growth defined asa surviving cell fraction of >0.8 in >75% of the cell lines tested have been excluded).
CIN Confers Intrinsic Multidrug Resistance
www.aacrjournals.org Cancer Res; 71(5) March 1, 2011 1863
American Association for Cancer Research Copyright © 2011 on March 25, 2011cancerres.aacrjournals.orgDownloaded from
DOI:10.1158/0008-5472.CAN-10-3604
P ¼ 0.038, P ¼ 0.016, P ¼ 0.038, and P ¼ 0.004, respectively;Supplementary Fig. 3B]. We found no evidence for a specificassociation with either PIK3CA exon 9 or 20 mutation statusand drug sensitivity (data not shown). Notably, PIK3CAmutations were more likely to occur in CIN� than in CINþ
cell lines (P ¼ 0.0066, Fisher's exact test).No single somatic mutation was associated with altered
sensitivity to all inhibitors. Next, data for somatic mutationstatus and CIN status were pooled. When corrected for multi-ple testing by the Benjamini–Hochberg method under theassumption that the tests are either positively correlatedor independent (45), CINþ status was the only parametersignificantly associated with multidrug resistance (correctedP ¼ 0.01; Supplementary Fig. 3B). Taken together, these datasuggest that the association of PIK3CA mutation with CIN�
status may confound the interpretation of the associationof PIK3CA mutation status with sensitivity to specific inhibi-tors and may simply reflect the intrinsic drug sensitivity ofCIN� cells.
Isogenic CINþ CRC cell lines display intrinsic multidrugresistance
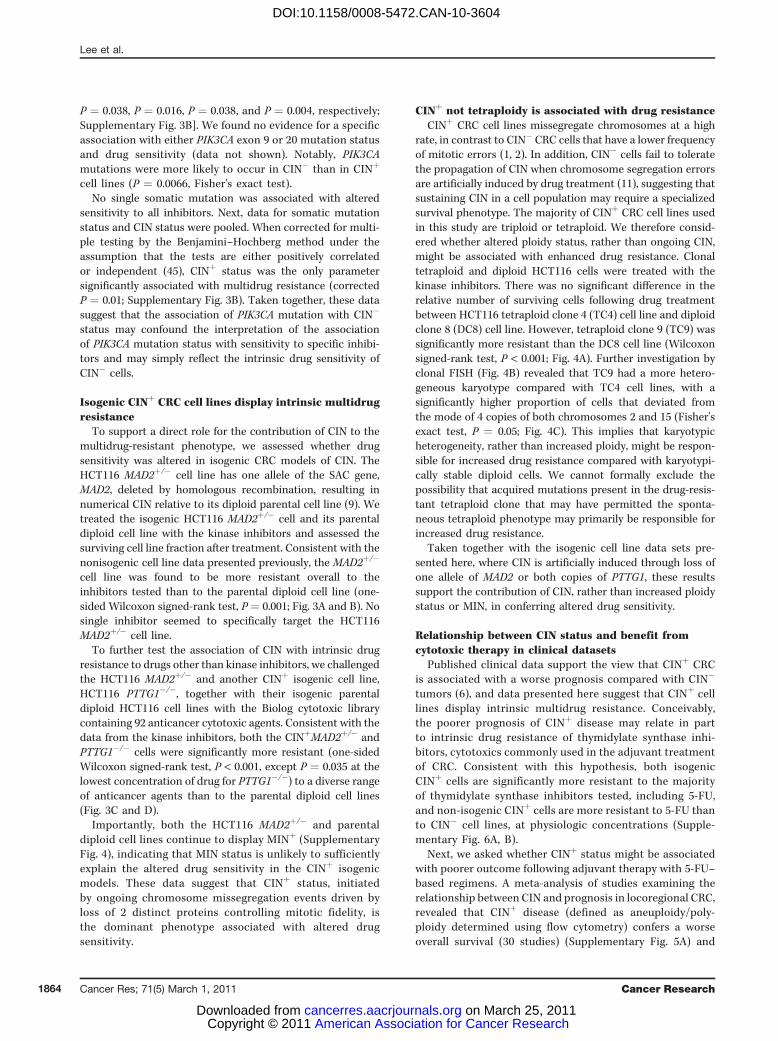
To support a direct role for the contribution of CIN to themultidrug-resistant phenotype, we assessed whether drugsensitivity was altered in isogenic CRC models of CIN. TheHCT116 MAD2þ/� cell line has one allele of the SAC gene,MAD2, deleted by homologous recombination, resulting innumerical CIN relative to its diploid parental cell line (9). Wetreated the isogenic HCT116 MAD2þ/� cell and its parentaldiploid cell line with the kinase inhibitors and assessed thesurviving cell line fraction after treatment. Consistent with thenonisogenic cell line data presented previously, the MAD2þ/�
cell line was found to be more resistant overall to theinhibitors tested than to the parental diploid cell line (one-sided Wilcoxon signed-rank test, P ¼ 0.001; Fig. 3A and B). Nosingle inhibitor seemed to specifically target the HCT116MAD2þ/� cell line.
To further test the association of CIN with intrinsic drugresistance to drugs other than kinase inhibitors, we challengedthe HCT116 MAD2þ/� and another CINþ isogenic cell line,HCT116 PTTG1�/�, together with their isogenic parentaldiploid HCT116 cell lines with the Biolog cytotoxic librarycontaining 92 anticancer cytotoxic agents. Consistent with thedata from the kinase inhibitors, both the CINþMAD2þ/� andPTTG1�/� cells were significantly more resistant (one-sidedWilcoxon signed-rank test, P < 0.001, except P ¼ 0.035 at thelowest concentration of drug for PTTG1�/�) to a diverse rangeof anticancer agents than to the parental diploid cell lines(Fig. 3C and D).
Importantly, both the HCT116 MAD2þ/� and parentaldiploid cell lines continue to display MINþ (SupplementaryFig. 4), indicating that MIN status is unlikely to sufficientlyexplain the altered drug sensitivity in the CINþ isogenicmodels. These data suggest that CINþ status, initiatedby ongoing chromosome missegregation events driven byloss of 2 distinct proteins controlling mitotic fidelity, isthe dominant phenotype associated with altered drugsensitivity.
CINþ not tetraploidy is associated with drug resistanceCINþ CRC cell lines missegregate chromosomes at a high
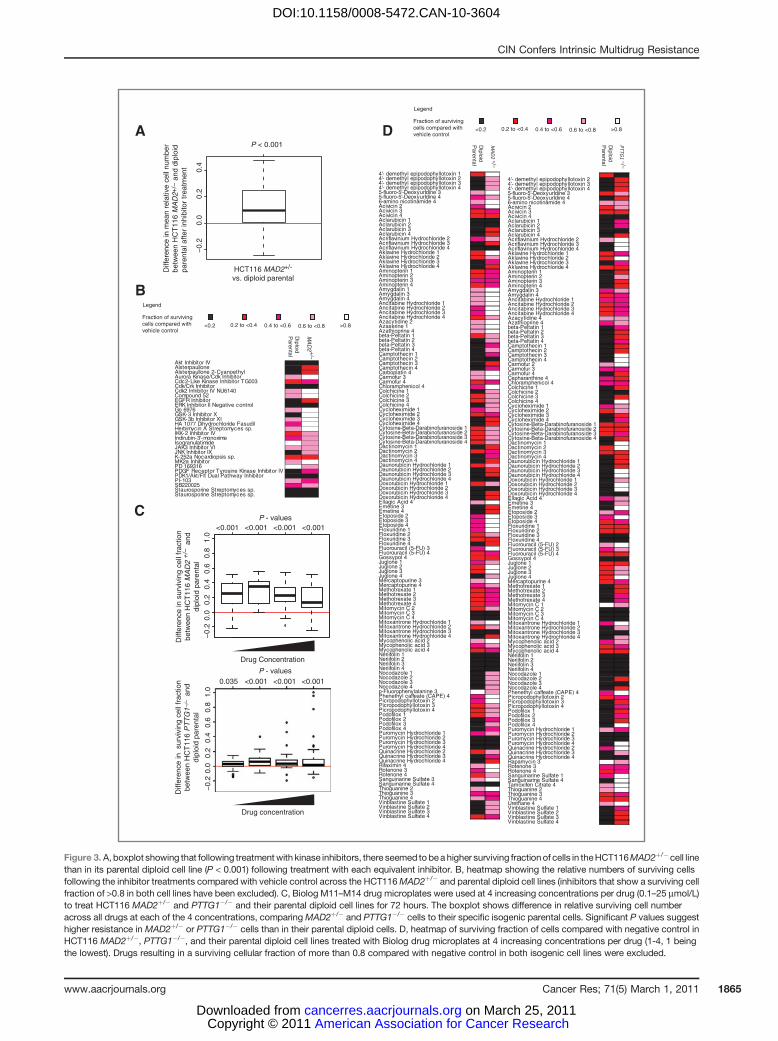
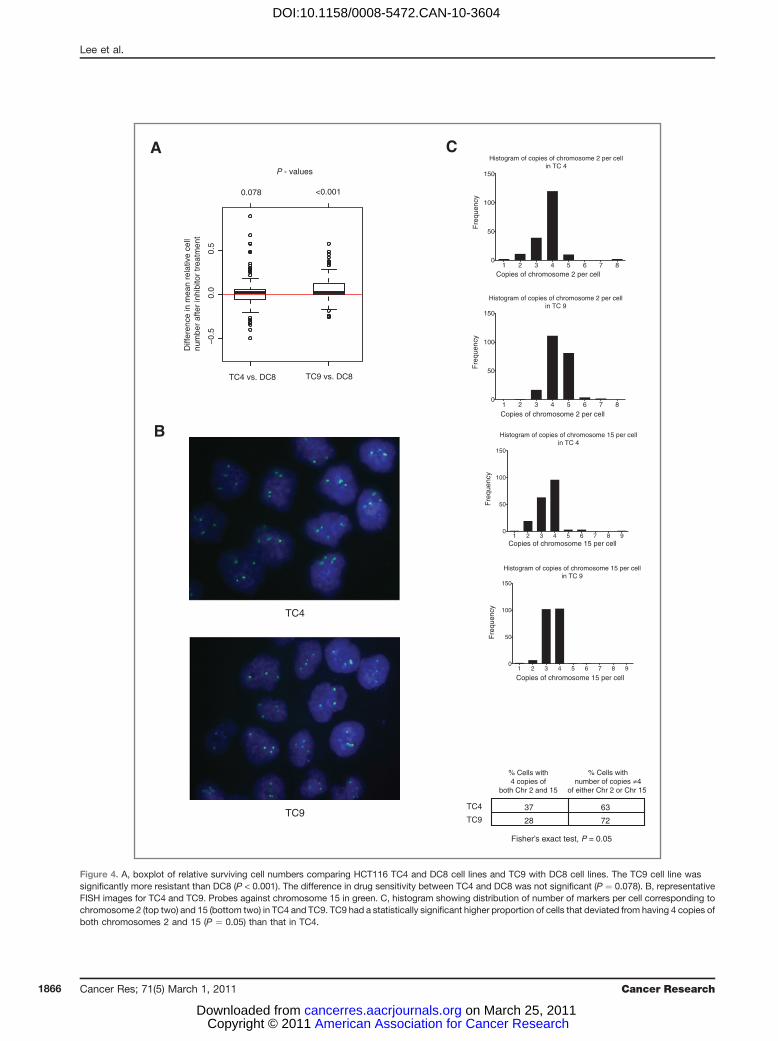
rate, in contrast to CIN� CRC cells that have a lower frequencyof mitotic errors (1, 2). In addition, CIN� cells fail to toleratethe propagation of CIN when chromosome segregation errorsare artificially induced by drug treatment (11), suggesting thatsustaining CIN in a cell population may require a specializedsurvival phenotype. The majority of CINþ CRC cell lines usedin this study are triploid or tetraploid. We therefore consid-ered whether altered ploidy status, rather than ongoing CIN,might be associated with enhanced drug resistance. Clonaltetraploid and diploid HCT116 cells were treated with thekinase inhibitors. There was no significant difference in therelative number of surviving cells following drug treatmentbetween HCT116 tetraploid clone 4 (TC4) cell line and diploidclone 8 (DC8) cell line. However, tetraploid clone 9 (TC9) wassignificantly more resistant than the DC8 cell line (Wilcoxonsigned-rank test, P < 0.001; Fig. 4A). Further investigation byclonal FISH (Fig. 4B) revealed that TC9 had a more hetero-geneous karyotype compared with TC4 cell lines, with asignificantly higher proportion of cells that deviated fromthe mode of 4 copies of both chromosomes 2 and 15 (Fisher'sexact test, P ¼ 0.05; Fig. 4C). This implies that karyotypicheterogeneity, rather than increased ploidy, might be respon-sible for increased drug resistance compared with karyotypi-cally stable diploid cells. We cannot formally exclude thepossibility that acquired mutations present in the drug-resis-tant tetraploid clone that may have permitted the sponta-neous tetraploid phenotype may primarily be responsible forincreased drug resistance.
Taken together with the isogenic cell line data sets pre-sented here, where CIN is artificially induced through loss ofone allele of MAD2 or both copies of PTTG1, these resultssupport the contribution of CIN, rather than increased ploidystatus or MIN, in conferring altered drug sensitivity.
Relationship between CIN status and benefit fromcytotoxic therapy in clinical datasets
Published clinical data support the view that CINþ CRCis associated with a worse prognosis compared with CIN�
tumors (6), and data presented here suggest that CINþ celllines display intrinsic multidrug resistance. Conceivably,the poorer prognosis of CINþ disease may relate in partto intrinsic drug resistance of thymidylate synthase inhi-bitors, cytotoxics commonly used in the adjuvant treatmentof CRC. Consistent with this hypothesis, both isogenicCINþ cells are significantly more resistant to the majorityof thymidylate synthase inhibitors tested, including 5-FU,and non-isogenic CINþ cells are more resistant to 5-FU thanto CIN� cell lines, at physiologic concentrations (Supple-mentary Fig. 6A, B).
Next, we asked whether CINþ status might be associatedwith poorer outcome following adjuvant therapy with 5-FU–based regimens. A meta-analysis of studies examining therelationship between CIN and prognosis in locoregional CRC,revealed that CINþ disease (defined as aneuploidy/poly-ploidy determined using flow cytometry) confers a worseoverall survival (30 studies) (Supplementary Fig. 5A) and
Lee et al.
Cancer Res; 71(5) March 1, 2011 Cancer Research1864
American Association for Cancer Research Copyright © 2011 on March 25, 2011cancerres.aacrjournals.orgDownloaded from
DOI:10.1158/0008-5472.CAN-10-3604
MA
D2 +/–
4'- demethyl epipodophyllotoxin 1 0.32 0.854'- demethyl epipodophyllotoxin 24'- demethyl epipodophyllotoxin 34'- demethyl epipodophyllotoxin 45-fluoro-5'-DeoxyurIdine 35-fluoro-5'-DeoxyurIdine 4 0.76-amino nicotinamide 4Acivicin 2 0.42 0.83Acivicin 3 0.24 0.54Acivicin 4 0.22 0.4Aclarubicin 1Aclarubicin 2Aclarubicin 3Aclarubicin 4Acriflavinium Hydrochloride 2Acriflavinium Hydrochloride 3Acriflavinium Hydrochloride 4Aklavine Hydrochloride 1 0.28 0.87Aklavine Hydrochloride 2 0.28 0.73Aklavine Hydrochloride 3 0.6Aklavine Hydrochloride 4 0.4Aminopterin 1 0.36 0.41Aminopterin 2 0.36 0.54Aminopterin 3 0.44 0.42Aminopterin 4 0.34 0.42Amygdalin 1 0.72 1.01Amygdalin 3 0.64 0.97Amygdalin 4 0.62 0.94Ancitabine Hydrochloride 1 0.79 0.94Ancitabine Hydrochloride 2 0.45 0.94Ancitabine Hydrochloride 3 0.43 0.88Ancitabine Hydrochloride 4 0.33 0.76Azacytidine 2 0.76 1Azaserine 1 0.74 0.98Azathioprine 4 0.72 0.81beta-Peltatin 1 0.31 0.76beta-Peltatin 2 0.65beta-Peltatin 3 0.6beta-Peltatin 4 0.62Camptothecin 1Camptothecin 2Camptothecin 3Camptothecin 4Carboplatin 4 0.79 0.98Carmofur 3 0.63 0.85Carmofur 4 0.33 0.44Chloramphenicol 4 0.51 0.96Colchicine 1 0.17 0.63Colchicine 2 0.3 0.65Colchicine 3 0.22 0.64Colchicine 4 0.16 0.67Cycloheximide 1 0.46 0.75Cycloheximide 2 0.26 0.54Cycloheximide 3 0.15 0.34Cycloheximide 4 0.13 0.26Cytosine-Beta-Darabinofuranoside 1 0.31 0.7Cytosine-Beta-Darabinofuranoside 2 0.29 0.66Cytosine-Beta-Darabinofuranoside 3 0.3 0.69Cytosine-Beta-Darabinofuranoside 4 0.34 0.62Dactinomycin 1 0.1 0.38Dactinomycin 2 0.33 0.53Dactinomycin 3 0.18 0.46Dactinomycin 4 0.15 0.3Daunorubicin Hydrochloride 1 0.24 0.67Daunorubicin Hydrochloride 2 0.17 0.39Daunorubicin Hydrochloride 3 0.12 0.35Daunorubicin Hydrochloride 4 0.06 0.16Doxorubicin Hydrochloride 1 0.28 0.65Doxorubicin Hydrochloride 2 0.06 0.14Doxorubicin Hydrochloride 3 0.17 0.4Doxorubicin Hydrochloride 4 0.14 0.31Ellagic Acid 4 0.63 0.88Emetine 3 0.07 0.25Emetine 4 0.08 0.21Etoposide 2 0.58 0.92Etoposide 3 0.47 0.91Etoposide 4 0.49 0.81Floxuridine 1 0.54 0.86Floxuridine 2 0.38 0.7Floxuridine 3 0.23 0.39Floxuridine 4 0.13 0.28Fluorouracil (5-FU) 3 0.6 0.86Fluorouracil (5-FU) 4 0.32 0.44Gossypol 4 0.29 0.4Juglone 1 0.5 0.8Juglone 2 0.32 0.94Juglone 3 0.34 0.97Juglone 4 0.2 0.71Mercaptopurine 3 0.73 1.02Mercaptopurine 4 0.51 0.72Methotrexate 1 0.31 0.44Methotrexate 2 0.33 0.42Methotrexate 3 0.3 0.43Methotrexate 4 0.33 0.45Mitomycin C 2 0.22 0.61Mitomycin C 3 0.06 0.15Mitomycin C 4 0.05 0.04Mitoxantrone Hydrochloride 1 0.61 0.93Mitoxantrone Hydrochloride 2 0.27 0.78Mitoxantrone Hydrochloride 3 0.07 0.13Mitoxantrone Hydrochloride 4 0.12 0.21Mycophenolic acid 2 0.64 0.87Mycophenolic acid 3 0.45 0.79Mycophenolic acid 4 0.32 0.6Neriifolin 1 0.1 0.14Neriifolin 2 0.09Neriifolin 3 0.07Neriifolin 4 0.07Nocodazole 1 0.15 0.7Nocodazole 2 0.2 0.67Nocodazole 3 0.16 0.69Nocodazole 4 0.18 0.68p-Fluorophenylalanine 3 0.91 0.79Phenethyl caffeate (CAPE) 4 0.54 0.82Picropodophyllotoxin 2 0.45 0.81Picropodophyllotoxin 3 0.3 0.79Picropodophyllotoxin 4 0.3 0.69Podofilox 1 0.21 0.61Podofilox 2 0.2 0.59Podofilox 3 0.18 0.63Podofilox 4 0.18 0.6Puromycin Hydrochloride 1 0.59 0.76Puromycin Hydrochloride 2 0.1 0.05Puromycin Hydrochloride 3 0.08 0.05Puromycin Hydrochloride 4 0.09 0.08Quinacrine Hydrochloride 2 0.21 0.75Quinacrine Hydrochloride 3 0.14 0.48Quinacrine Hydrochloride 4 0.08 0.22Rifaximin 4 0.72 0.99Rotenone 3 0.49 0.85Rotenone 4 0.33 0.72Sanguinarine Sulfate 3 0.77 1.02Sanguinarine Sulfate 4 0.04 0.07Thioguanine 2 0.77 0.93Thioguanine 3 0.58 0.58Thioguanine 4 0.65 0.58Vinblastine Sulfate 1 0.17 0.62Vinblastine Sulfate 2 0.18 0.64Vinblastine Sulfate 3 0.19 0.65Vinblastine Sulfate 4 0.23 0.6
PTTG1 –/–
4'- demethyl epipodophyllotoxin 24'- demethyl epipodophyllotoxin 34'- demethyl epipodophyllotoxin 45-fluoro-5'-DeoxyurIdine 3 0.35 0.645-fluoro-5'-DeoxyurIdine 4 0.19 0.366-amino nicotinamide 4 0.62 0.7Acivicin 2 0.39 0.73Acivicin 3 0.23 0.21Acivicin 4 0.11 0.13Aclarubicin 1 0.03 0.43Aclarubicin 2 0.04 0.52Aclarubicin 3 0.17 0.17Aclarubicin 4 0.16 0.21Acriflavinium Hydrochloride 2 0.62 0.99Acriflavinium Hydrochloride 3 0.13 1.05Acriflavinium Hydrochloride 4 0.05 1.14Aklavine Hydrochloride 1 0.3 0.44Aklavine Hydrochloride 2 0.26 1.13Aklavine Hydrochloride 3 0.2 0.56Aklavine Hydrochloride 4 0.22 0.28Aminopterin 1 0.1 0.24Aminopterin 2 0.1 0.64Aminopterin 3 0.09 0.26Aminopterin 4 0.1 0.32Amygdalin 3 0.49 0.64Amygdalin 4 0.38 0.6Ancitabine Hydrochloride 1 0.52 0.55Ancitabine Hydrochloride 2 0.38 0.5Ancitabine Hydrochloride 3 0.32 0.53Ancitabine Hydrochloride 4 0.27 0.41Azacytidine 4 0.77 0.65Azathioprine 4 0.53 0.71beta-Peltatin 1 0.18 0.45beta-Peltatin 2 0.13 0.29beta-Peltatin 3 0.13 0.21beta-Peltatin 4 0.14 0.51Camptothecin 1 0.1 0.28Camptothecin 2 0.07 0.21Camptothecin 3 0.08 0.92Camptothecin 4 0.15 0.94Carmofur 2 0.76 0.87Carmofur 3 0.43 0.49Carmofur 4 0.2 0.31Cepharanthine 4 0.46 0.31Chloramphenicol 4 0.51 0.55Colchicine 1 0.11 0.26Colchicine 2 0.12 0.17Colchicine 3 0.13 0.28Colchicine 4 0.14 1.22Cycloheximide 1 0.45 0.64Cycloheximide 2 0.28 0.61Cycloheximide 3 0.16 0.32Cycloheximide 4 0.1 0.48Cytosine-Beta-Darabinofuranoside 1 0.3 0.34Cytosine-Beta-Darabinofuranoside 2 0.23 0.34Cytosine-Beta-Darabinofuranoside 3 0.21 0.58Cytosine-Beta-Darabinofuranoside 4 0.2 0.25Dactinomycin 1 0.13 1.21Dactinomycin 2 0.26 0.83Dactinomycin 3 0.27 0.29Dactinomycin 4 0.2 0.21Daunorubicin Hydrochloride 1 0.16 0.3Daunorubicin Hydrochloride 2 0.18 0.24Daunorubicin Hydrochloride 3 0.18 1.25Daunorubicin Hydrochloride 4 0.05 1.16Doxorubicin Hydrochloride 1 0.12 0.66Doxorubicin Hydrochloride 2 0.15 1.26Doxorubicin Hydrochloride 3 0.17 1Doxorubicin Hydrochloride 4 0.14 0.15Ellagic Acid 4 0.6 0.69Emetine 3 0.09 0.76Emetine 4 0.1 1.13Etoposide 2 0.75 0.51Etoposide 3 0.41 1.23Etoposide 4 0.34 0.51Floxuridine 1 0.39 0.39Floxuridine 2 0.22 0.25Floxuridine 3 0.1 0.14Floxuridine 4 0.08 0.12Fluorouracil (5-FU) 2 0.76 0.97Fluorouracil (5-FU) 3 0.49 0.76Fluorouracil (5-FU) 4 0.27 0.31Gossypol 4 0.14 0.15Juglone 1 0.24 0.36Juglone 2 0.35 0.73Juglone 3 0.32 0.63Juglone 4 0.25 1.21Mercaptopurine 4 0.33 0.52Methotrexate 1 0.11 0.27Methotrexate 2 0.12 0.26Methotrexate 3 0.11 0.43Methotrexate 4 0.11 0.46Mitomycin C 1 0.9 0.71Mitomycin C 2 0.17 0.18Mitomycin C 3 0.05 0.06Mitomycin C 4 0.03 0.03Mitoxantrone Hydrochloride 1 0.42 1.23Mitoxantrone Hydrochloride 2 0.17 0.69Mitoxantrone Hydrochloride 3 0.05 0.08Mitoxantrone Hydrochloride 4 0.17 0.8Mycophenolic acid 2 0.56 0.64Mycophenolic acid 3 0.31 0.43Mycophenolic acid 4 0.26 0.29Neriifolin 1 0.09 0.12Neriifolin 2 0.09 0.11Neriifolin 3 0.07 0.19Neriifolin 4 0.06 0.06Nocodazole 1 0.11 0.19Nocodazole 2 0.1 0.32Nocodazole 3 0.1 0.17Nocodazole 4 0.11 0.23Phenethyl caffeate (CAPE) 4 0.6 0.94Picropodophyllotoxin 2 0.24 0.56Picropodophyllotoxin 3 0.14 0.39Picropodophyllotoxin 4 0.14 0.44Podofilox 1 0.13 0.23Podofilox 2 0.13 0.41Podofilox 3 0.13 0.29Podofilox 4 0.14 0.97Puromycin Hydrochloride 1 0.7 0.59Puromycin Hydrochloride 2 0.02 0.11Puromycin Hydrochloride 3 0.03 0.04Puromycin Hydrochloride 4 0.04 0.93Quinacrine Hydrochloride 2 0.54 0.97Quinacrine Hydrochloride 3 0.14 0.71Quinacrine Hydrochloride 4 0.05 0.17Rapamycin 3 0.86 0.8Rotenone 3 0.54 0.55Rotenone 4 0.3 0.51Sanguinarine Sulfate 1 0.41 1.02Sanguinarine Sulfate 4 0.07 1.13Tamoxifen Citrate 4 0.79 1.06Thioguanine 2 0.63 0.94Thioguanine 3 0.32 0.48Thioguanine 4 0.24 0.37Urethane 4Vinblastine Sulfate 1Vinblastine Sulfate 2Vinblastine Sulfate 3Vinblastine Sulfate 4
Diff
eren
ce in
sur
vivi
ng c
ell f
ract
ion
betw
een
HC
T11
6 P
TT
G1–
/– a
nddi
ploi
d pa
rent
al
P - values
A
B
C
D
Diploid
Parental
MA
D2
+/–
Akt Inhibitor IVAlsterpaulloneAlsterpaullone 2-CyanoethylAurora Kinase/Cdk InhibitorCdc2-Like Kinase Inhibitor TG003Cdk/Crk InhibitorCdk2 Inhibitor IV NU6140Compound 52EGFR InhibitorERK Inhibitor II Negative controlGo 6976 GSK-3 Inhibitor XGSK-3b Inhibitor XIHA 1077 Dihydrochloride FasudilHerbimycin A Streptomyces sp.IKK-2 Inhibitor IVIndirubin-3'-monoximeIsogranulatimideJAK3 Inhibitor VIJNK Inhibitor IXK-252a Nocardiopsis sp. MK2a InhibitorPD 169316PDGF Receptor Tyrosine Kinase Inhibitor IVPDK1/Akt/Flt Dual Pathway InhibitorPI-103SB220025Staurosporine Streptomyces sp.Staurosporine Streptomyces sp.
P - values
Diff
eren
ce in
sur
vivi
ng c
ell f
ract
ion
betw
een
HC
T11
6 M
AD
2 +
/– a
nddi
ploi
d pa
rent
al−
0.2
0.0
0.2
0.4
Diff
eren
ce in
mea
n re
lativ
e ce
ll nu
mbe
rbe
twee
n H
CT
116
MA
D2+
/− a
nd d
iplo
idpa
rent
al a
fter
inhi
bito
r tr
eatm
ent
P < 0.001
−0.
20.
00.
20.
40.
60.
81.
0
<0.001 <0.001 <0.001 <0.001
−0.
20.
00.
20.
40.
60.
81.
0
0.035 <0.001 <0.001 <0.001
Legend
Fraction of survivingcells compared withvehicle control
0.2 to <0.4 0.4 to <0.6 0.6 to <0.8 >0.8<0.2
Drug Concentration
Diploid
Parental
Diploid
Parental
Legend
Fraction of survivingcells compared withvehicle control
0.2 to <0.4 0.4 to <0.6 0.6 to <0.8 >0.8<0.2
HCT116 MAD2+/-
vs. diploid parental
Drug concentration
Figure 3. A, boxplot showing that following treatmentwith kinase inhibitors, there seemed to bea higher surviving fractionof cells in theHCT116MAD2þ/� cell linethan in its parental diploid cell line (P < 0.001) following treatment with each equivalent inhibitor. B, heatmap showing the relative numbers of surviving cellsfollowing the inhibitor treatments compared with vehicle control across the HCT116MAD2þ/� and parental diploid cell lines (inhibitors that show a surviving cellfraction of >0.8 in both cell lines have been excluded). C, Biolog M11–M14 drug microplates were used at 4 increasing concentrations per drug (0.1–25 mmol/L)to treat HCT116 MAD2þ/� and PTTG1�/� and their parental diploid cell lines for 72 hours. The boxplot shows difference in relative surviving cell numberacross all drugs at each of the 4 concentrations, comparingMAD2þ/� and PTTG1�/� cells to their specific isogenic parental cells. Significant P values suggesthigher resistance in MAD2þ/� or PTTG1�/� cells than in their parental diploid cells. D, heatmap of surviving fraction of cells compared with negative control inHCT116 MAD2þ/�, PTTG1�/�, and their parental diploid cell lines treated with Biolog drug microplates at 4 increasing concentrations per drug (1-4, 1 beingthe lowest). Drugs resulting in a surviving cellular fraction of more than 0.8 compared with negative control in both isogenic cell lines were excluded.
CIN Confers Intrinsic Multidrug Resistance
www.aacrjournals.org Cancer Res; 71(5) March 1, 2011 1865
American Association for Cancer Research Copyright © 2011 on March 25, 2011cancerres.aacrjournals.orgDownloaded from
DOI:10.1158/0008-5472.CAN-10-3604
A C
TC4 vs. DC8 TC9 vs. DC8
P - values
0.078 <0.001
−0.
50.
00.
5
Histogram of copies of chromosome 2 per cellin TC 4
1 2 3 4 5 6 7 80
50
100
150
Copies of chromosome 2 per cell
Fre
quen
cy
1 2 3 4 5 6 7 80
50
100
150
B
TC 4
TC9
Diff
eren
ce in
mea
n re
lativ
e ce
llnu
mbe
r af
ter
inhi
bito
r tr
eatm
ent
Histogram of copies of chromosome 2 per cellin TC 9
Copies of chromosome 2 per cell
Fre
quen
cy
1 2 3 4 5 6 7 8 90
50
100
150
Histogram of copies of chromosome 15 per cellin TC 4
Copies of chromosome 15 per cell
Fre
quen
cy
1 2 3 4 5 6 7 8 90
50
100
150
Histogram of copies of chromosome 15 per cellin TC 9
Copies of chromosome 15 per cell
Fre
quen
cy
% Cells with4 copies of
both Chr 2 and 15
% Cells withnumber of copies ≠4
of either Chr 2 or Chr 15
TC4 37 63
TC9 28 72
Fisher’s exact test, P = 0.05
TC4
Figure 4. A, boxplot of relative surviving cell numbers comparing HCT116 TC4 and DC8 cell lines and TC9 with DC8 cell lines. The TC9 cell line wassignificantly more resistant than DC8 (P < 0.001). The difference in drug sensitivity between TC4 and DC8 was not significant (P ¼ 0.078). B, representativeFISH images for TC4 and TC9. Probes against chromosome 15 in green. C, histogram showing distribution of number of markers per cell corresponding tochromosome 2 (top two) and 15 (bottom two) in TC4 and TC9. TC9 had a statistically significant higher proportion of cells that deviated from having 4 copies ofboth chromosomes 2 and 15 (P ¼ 0.05) than that in TC4.
Lee et al.
Cancer Res; 71(5) March 1, 2011 Cancer Research1866
American Association for Cancer Research Copyright © 2011 on March 25, 2011cancerres.aacrjournals.orgDownloaded from
DOI:10.1158/0008-5472.CAN-10-3604
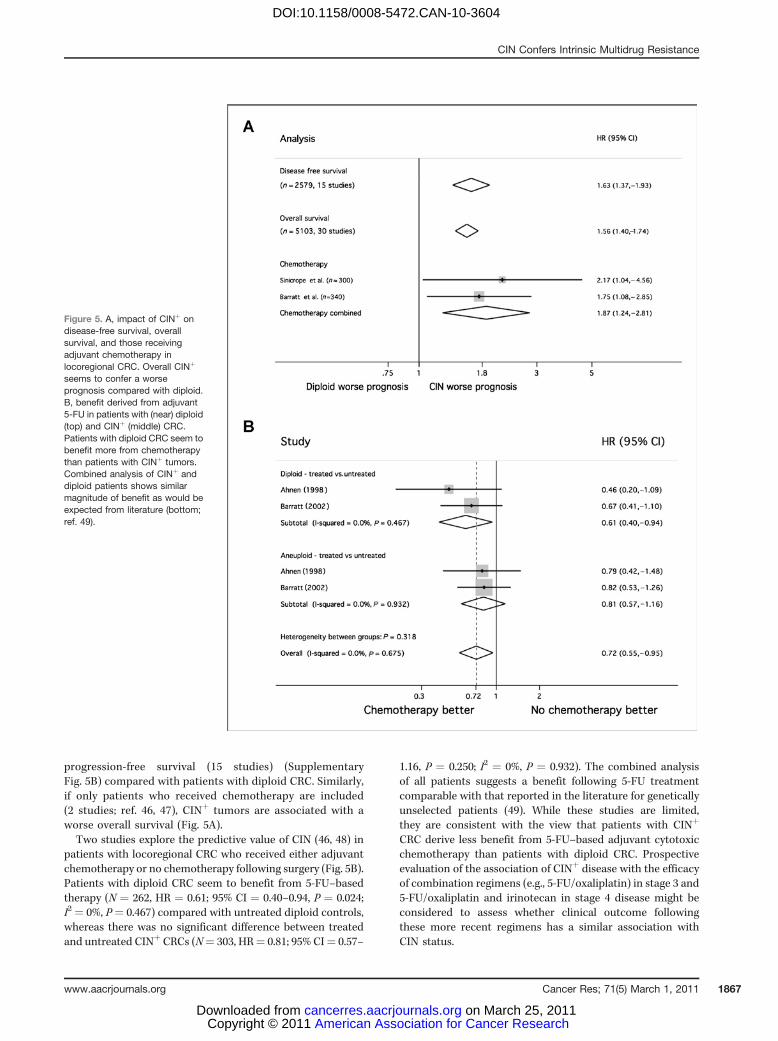
progression-free survival (15 studies) (SupplementaryFig. 5B) compared with patients with diploid CRC. Similarly,if only patients who received chemotherapy are included(2 studies; ref. 46, 47), CINþ tumors are associated with aworse overall survival (Fig. 5A).Two studies explore the predictive value of CIN (46, 48) in
patients with locoregional CRC who received either adjuvantchemotherapy or no chemotherapy following surgery (Fig. 5B).Patients with diploid CRC seem to benefit from 5-FU–basedtherapy (N ¼ 262, HR ¼ 0.61; 95% CI ¼ 0.40–0.94, P ¼ 0.024;I2 ¼ 0%, P¼ 0.467) compared with untreated diploid controls,whereas there was no significant difference between treatedand untreated CINþ CRCs (N¼ 303, HR¼ 0.81; 95% CI¼ 0.57–
1.16, P ¼ 0.250; I2 ¼ 0%, P ¼ 0.932). The combined analysisof all patients suggests a benefit following 5-FU treatmentcomparable with that reported in the literature for geneticallyunselected patients (49). While these studies are limited,they are consistent with the view that patients with CINþ
CRC derive less benefit from 5-FU–based adjuvant cytotoxicchemotherapy than patients with diploid CRC. Prospectiveevaluation of the association of CINþ disease with the efficacyof combination regimens (e.g., 5-FU/oxaliplatin) in stage 3 and5-FU/oxaliplatin and irinotecan in stage 4 disease might beconsidered to assess whether clinical outcome followingthese more recent regimens has a similar association withCIN status.
Figure 5. A, impact of CINþ ondisease-free survival, overallsurvival, and those receivingadjuvant chemotherapy inlocoregional CRC. Overall CINþ
seems to confer a worseprognosis compared with diploid.B, benefit derived from adjuvant5-FU in patients with (near) diploid(top) and CINþ (middle) CRC.Patients with diploid CRC seem tobenefit more from chemotherapythan patients with CINþ tumors.Combined analysis of CINþ anddiploid patients shows similarmagnitude of benefit as would beexpected from literature (bottom;ref. 49).
CIN Confers Intrinsic Multidrug Resistance
www.aacrjournals.org Cancer Res; 71(5) March 1, 2011 1867
American Association for Cancer Research Copyright © 2011 on March 25, 2011cancerres.aacrjournals.orgDownloaded from
DOI:10.1158/0008-5472.CAN-10-3604
Discussion
In this analysis, we have provided evidence that CINþ
CRC cell lines display intrinsic multidrug resistance com-pared with CIN� cell lines. No specific kinase inhibitorwas identified that displayed greater activity in CINþ celllines. We cannot exclude the potential for off-target effectsat the concentrations of kinase inhibitors used in thisanalysis; however, the same conditions were applied tothe CIN� cells and therefore off-target phenomena areunlikely to change the conclusions of this work. Further-more, in the isogenic systems, we observed significant drugresistance in the CINþ cell lines relative to their isogenicparental CIN� pairs at all concentrations of cytotoxicstested (ranging from 0.1 to 25 mmol/L). Intriguingly, theisogenic CINþ and tetraploid cell line systems suggest thatthe primary association is between multidrug resistance andCINþ rather than tetraploidy. It has been previously shownthat aneuploid cell lines can acquire multidrug resistanceat an accelerated rate (50) that may be driven by cancercell heterogeneity resulting from multiple chromosomalreassortments in aneuploid cells. The short time courseof our experiments in comparison with this study suggeststhat multidrug resistance is likely to be an intrinsic pro-perty of CINþ cells rather than a process that is acquiredin our cell systems over multiple generations. What mightcontribute to this intrinsic multidrug resistance pheno-type in CINþ cells? We speculate that either basal popula-tion heterogeneity in CINþ cell lines is sufficiently diverseto confer a cell viability advantage following drug exposureor there is a specific CINþ survival phenotype that initiates atolerance of ongoing chromosomal rearrangements that isalso associated with multidrug resistance.
There is increasing evidence in support of a CINþ survivalphenotype and putative molecular coordinators of thisproperty. Cell death after mitotic arrest may result fromtranscriptional inhibition due to condensed chromatin,precipitating the degradation of short-lived mRNA encod-ing prosurvival proteins (51). CINþ cells may overexpressthese prosurvival genes compared with diploid cells (22)that may drive the resistance of CINþ cells to a mitoticarrest triggered by taxanes. Jeganathan and colleagueshave shown that tolerance of chromosome missegregationevents can be conferred by a hypomorphic BUB1 allelein mouse embryonic fibroblasts (24). Recently, Thompsonand Compton have shown that chromosome missegregra-tion in diploid human cells triggers an increase in nuclearp53 and that p53 null cells are able to tolerate chromosomemissegregation events, enabling the propagation of aneu-ploid genomes (52). A higher proportion of the CINþ celllines used in our study have mutant p53 in comparison withthe CIN� cell lines. However, when we pooled data for
somatic mutation status and CIN status, CINþ status wasthe only parameter significantly associated with resistanceto these inhibitors.
Therefore, evidence exists for the coordination of apop-totic/cell death pathways following chromosome mis-segregation events. Conceivably, common molecularpathways regulating cell death following a chromosomemissegregation event may become disrupted in CINþ cells,simultaneously triggering tolerance of chromosome reas-sortments and, as an indirect consequence, resistance todrug exposure.
The observations that CINþ cancer cell lines seem to beless sensitive to a range of anticancer agents than to diploidcells and that poorer patient outcome follows cytotoxictreatment of CINþ tumors compared with diploid counter-parts strongly suggest the need to consider tumor strati-fication according to CIN status in the design of clinicaltrials testing novel anticancer agents in CRC. This isparticularly relevant to the advanced CRC setting wherethe incidence of CINþ is greater than in early-stage disease.Stratifying drug response according to CIN status may limitthe risk of early drug attrition and heighten the chance ofidentifying responder populations in patients with diploidtumors. Importantly, these data indicate that specificallytargeting cancer cells with CINþ status, using currentlyavailable kinase inhibitors, seems challenging. An improvedunderstanding of the mechanisms associated with thegeneration and survival of CINþ CRC will be importantto drive the development of new therapeutic approaches inorder to improve patient outcome in this high-risk diseasesubtype.
Disclosure of Potential Conflicts of Interest
No potential conflicts of interest were disclosed.
Acknowledgments
We thank Robert Benezra for the donation of the isogenic HCT116MAD2þ/�
cell lines and Bert Vogelstein for the donation of the isogenic HCT116 PTTG1�/�
cell lines.
Grant Support
C. Swanton is a senior Medical Research Council clinical research fellow andis funded by both Cancer Research UK (CRUK) and the Medical ResearchCouncil. A.J.X. Lee is funded by CRUK. I.P.M. Tomlinson is supported by theOxford Biomedical Research Centre and CRUK.
The costs of publication of this article were defrayed in part by thepayment of page charges. This article must therefore be hereby markedadvertisement in accordance with 18 U.S.C. Section 1734 solely to indicate thisfact.
Received October 6, 2010; revised December 23, 2010; accepted January 8,2011; published OnlineFirst March 1, 2011.
References1. Lengauer C, Kinzler KW, Vogelstein B. Genetic instabilities in human
cancers. Nature 1998;396:643–9.2. Lengauer C, Kinzler KW, Vogelstein B. Genetic instability in colorectal
cancers. Nature 1997;386:623–7.
Lee et al.
Cancer Res; 71(5) March 1, 2011 Cancer Research1868
American Association for Cancer Research Copyright © 2011 on March 25, 2011cancerres.aacrjournals.orgDownloaded from
DOI:10.1158/0008-5472.CAN-10-3604
3. Roschke AV, Tonon G, Gehlhaus KS, McTyre N, Bussey KJ, LababidiS, et al. Karyotypic complexity of the NCI-60 drug-screening panel.Cancer Res 2003;63:8634–47.
4. Lothe RA, Peltom€aki P, Meling GI, Aaltonen LA, Nystr€om-Lahti M,Pylkk€anen L, et al. Genomic instability in colorectal cancer: relation-ship to clinicopathological variables and family history. Cancer Res1993;53:5849–52.
5. Thibodeau SN, French AJ, Cunningham JM, Tester D, Burgart LJ,Roche PC, et al. Microsatellite instability in colorectal cancer: differentmutator phenotypes and the principal involvement of hMLH1. CancerRes 1998;58:1713–8.
6. Walther A, Houlston R, Tomlinson I. Association between chromo-somal instability and prognosis in colorectal cancer: a meta-analysis.Gut 2008;57:941–50.
7. Hiddemann W, Schumann J, Andreef M, Barlogie B, Herman CJ, LeifRC, et al. Convention on nomenclature for DNA cytometry. CancerGenet Cytogenet 1984;13:181–3.
8. Cahill DP, Lengauer C, Yu J, Riggins GJ, Willson JK, Markowitz SD,et al. Mutations of mitotic checkpoint genes in human cancers. Nature1998;392:300–3.
9. Michel LS, Liberal V, Chatterjee A, Kirchwegger R, Pasche B, GeraldW, et al. MAD2 haplo-insufficiency causes premature anaphaseand chromosome instability in mammalian cells. Nature 2001;409:355–9.
10. Jallepalli PV, Waizenegger IC, Bunz F, Langer S, Speicher MR, PetersJM, et al. Securin is required for chromosomal stability in human cells.Cell 2001;105:445–57.
11. Thompson SL, Compton DA. Examining the link between chromo-somal instability and aneuploidy in human cells. J Cell Biol2008;180:665–72.
12. Fukasawa K, Vande Woude G. Synergy between the Mos/mitogen-activated protein kinase pathway and loss of p53 function intransformation and chromosome instability. Mol Cell Biol 1997;17:506–18.
13. Pihan GA, Purohit A, Wallace J, Malhotra R, Liotta L, Doxsey SJ.Centrosome defects can account for cellular and genetic changesthat characterize prostate cancer progression. Cancer Res 2001;61:2212–9.
14. Gisselsson D, Pettersson L, Hoglund M, Heidenblad M, Gorunova L,Wiegant J, et al. Chromosomal breakage-fusion-bridge events causegenetic intratumor heterogeneity. Proc Natl Acad Sci U S A2000;97:5357–62.
15. Carter SL, Eklund AC, Kohane IS, Harris LN, Szallasi Z. A signature ofchromosomal instability inferred from gene expression profiles pre-dicts clinical outcome in multiple human cancers. Nat Genet2006;38:1043–8.
16. Sheffer M, Bacolod MD, Zuk O, Giardina SF, Pincas H, Barany F, et al.Association of survival and disease progression with chromosomalinstability: A genomic exploration of colorectal cancer. Proc Natl AcadSci U S A 2009;106:7131–6.
17. Cahill DP, Kinzler KW, Vogelstein B, Lengauer C. Genetic inst-ability and Darwinian selection in tumours. Trends Cell Biol1999;9:M57–60.
18. Nicholson JM, Duesberg P. On the karyotypic origin and evolution ofcancer cells. Cancer Genet Cytogenet 2009;194:96–110.
19. Chandhok NS, Pellman D. A little CIN may cost a lot: revisitinganeuploidy and cancer. Curr Opin Genet Dev 2009;19:74–81.
20. Sotillo R, Schvartzman J-M, Socci ND, Benezra R. Mad2-inducedchromosome instability leads to lung tumour relapse after oncogenewithdrawal. Nature 2010;464:436–40.
21. Duesberg P, Stindl R, Hehlmann R. Explaining the high mutation ratesof cancer cells to drug and multidrug resistance by chromosomereassortments that are catalyzed by aneuploidy. Proc Natl Acad Sci US A 2000;97:14295–300.
22. Swanton C, Nicke B, Schuett M, Eklund AC, Ng C, Li Q, et al.Chromosomal instability determines taxane response. Proc Natl AcadSci U S A 2009;106:8671–6.
23. McClelland SE, Burrell RA, Swanton C. Chromosomal instability: acomposite phenotype that influences sensitivity to chemotherapy.Cell Cycle 2009;8:3262–6.
24. Jeganathan K, Malureanu L, Baker DJ, Abraham SC, van Deursen JM.Bub1mediates cell death in response to chromosomemissegregationand acts to suppress spontaneous tumorigenesis. J Cell Biol2007;179:255–67.
25. Roschke AV, Kirsch IR. Targeting cancer cells by exploiting karyotypiccomplexity and chromosomal instability. Cell Cycle 2005;4:679–82.
26. Torres EM, Sokolsky T, Tucker CM, Chan LY, Boselli M, Dunham MJ,et al. Effects of aneuploidy on cellular physiology and cell division inhaploid yeast. Science 2007;317:916–24.
27. Storchov�a Z, Breneman A, Cande J, Dunn J, Burbank K, O'Toole E,et al. Genome-wide genetic analysis of polyploidy in yeast. Nature2006;443:541–7.
28. Woodford-Richens KL, Rowan AJ, Gorman P, Halford S, Bicknell DC,Wasan HS, et al. SMAD4 mutations in colorectal cancer probablyoccur before chromosomal instability, but after divergence of themicrosatellite instability pathway. Proc Natl Acad Sci U S A2001;98:9719–23.
29. Gaasenbeek M, Howarth K, Rowan AJ, Gorman PA, Jones A, ChaplinT, et al. Combined Array-comparative genomic hybridization andsingle-nucleotide polymorphism-loss of heterozygosity analysisreveals complex changes andmultiple forms of chromosomal instabil-ity in colorectal cancers. Cancer Res 2006;66:3471–9.
30. Abdel-Rahman WM, Katsura K, Rens W, Gorman PA, Sheer D,Bicknell D, et al. Spectral karyotyping suggests additional subsetsof colorectal cancers characterized by pattern of chromosome rear-rangement. Proc Natl Acad Sci U S A 2001;98:2538–43.
31. Cancer Genome Project. [Internet]Cambridge, UK: Wellcome TrustSanger Institute; 2010[updated 2010 Dec 20; cited 2010 Dec 23].Available from:http://www.sanger.ac.uk/genetics/CGP.
32. Liu Y, BodmerWF. Analysis of P53 mutations and their expression in 56colorectal cancer cell lines. Proc Natl Acad Sci U S A 2006;103:976–81.
33. Rowan AJ, Lamlum H, Ilyas M, Wheeler J, Straub J, Papadopoulou A,et al. APC mutations in sporadic colorectal tumors: a mutational"hotspot" and interdependence of the "two hits". Proc Natl AcadSci U S A 2000;97:3352–7.
34. Ilyas M, Tomlinson IPM, Rowan A, Pignatelli M, Bodmer WF. Beta-catenin mutations in cell lines established from human colorectalcancers. Proc Natl Acad Sci U S A 1997;94:10330–4.
35. Samuels Y, Diaz LA Jr, Schmidt-Kittler O, Cummins JM, Delong L,Cheong I, et al. Mutant PIK3CA promotes cell growth and invasion ofhuman cancer cells. Cancer Cell 2005;7:561–73.
36. Inhibitor Libraries and Pathway Panels. [Internet]Darmstadt, Germany:Merck KGaA; 2010[cited 2010 Dec 23]. Available from:http://www.emdchemicals.com/life-science-research/inhibitor-libraries-and-pathway-panels/c_bKSb.s1O9nQAAAEitTV5hDHD#docs.
37. KahmM, Hasenbrink G, Lichtenberg-Frat�e H, Ludwig J, Kschischo M.grofit: fitting biological growth curves with R. J Stat Software2010;33:1–21.
38. Parmar MK, Torri V, Stewart L. Extracting summary statistics toperform meta-analyses of the published literature for survival end-points. Stat Med 1998;17:2815–34.
39. Anderson MJ. Permutation tests for univariate or multivariate analysisof variance and regression. Can J Fish Aquat Sci 2001;58:626–39.
40. Greenman CD, Bignell G, Butler A, Edkins S, Hinton J, Beare D, et al.PICNIC: an algorithm to predict absolute allelic copy number variationwith microarray cancer data. Biostatistics 2010;11:164–75.
41. Chin S, Teschendorff A, Marioni J, Wang Y, Barbosa-Morais NL,Thorne NP, et al. High-resolution aCGH and expression profilingidentifies a novel genomic subtype of ER negative breast cancer.Genome Biol 2007;8:R215.
42. Williams BR, Prabhu VR, Hunter KE, Glazier CM, Whittaker CA,Housman DE, et al. Aneuploidy Affects proliferation and spontaneousimmortalization in mammalian cells. Science 2008;322:703–9.
43. Segal DJ, McCoy EE. Studies on Down's syndrome in tissue culture. I.Growth rates protein contents of fibroblast cultures. J Cell Physiol1974;83:85–90.
44. Baker DJ, Jeganathan KB, Cameron JD, Thompson M, Juneja S,Kopecka A, et al. BubR1 insufficiency causes early onset of aging-associated phenotypes and infertility in mice. Nat Genet 2004;36:744–9.
CIN Confers Intrinsic Multidrug Resistance
www.aacrjournals.org Cancer Res; 71(5) March 1, 2011 1869
American Association for Cancer Research Copyright © 2011 on March 25, 2011cancerres.aacrjournals.orgDownloaded from
DOI:10.1158/0008-5472.CAN-10-3604
45. Benjamini Y, Hochberg Y. Controlling the false discovery rate: apractical and powerful approach to multiple testing. J R Stat SocSer B 1995;57:289–300.
46. Barratt PL, Seymour MT, Stenning SP, Georgiades I, Walker C,Birbeck K, et al. DNA markers predicting benefit from adjuvantfluorouracil in patients with colon cancer: a molecular study. Lancet2002;360:1381–91.
47. Sinicrope FA, Rego RL, Halling KC, Foster N, Sargent DJ, La Plant B,et al. Prognostic impact of microsatellite instability and DNA ploidy inhuman colon carcinomapatients. Gastroenterology 2006;131:729–37.
48. Ahnen DJ, Feigl P, Quan G, Fenoglio-Preiser C, Lovato LC, Bunn PAJr, et al. Ki-ras mutation and p53 overexpression predict the clinicalbehavior of colorectal cancer: a Southwest Oncology Group study.Cancer Res 1998;58:1149–58.
49. Gill S, Loprinzi CL, Sargent DJ, Thom�e SD, Alberts SR, Haller DG, et al.Pooled analysis of fluorouracil-based adjuvant therapy for stage II andIII colon cancer: who benefits and by how much?J Clin Oncol2004;22:1797–806.
50. Duesberg P, Stindl R, Hehlmann R. Origin of multidrug resistance incells with and without multidrug resistance genes: Chromosomereassortments catalyzed by aneuploidy. Proc Natl Acad Sci U S A2001;98:11283–8.
51. Blagosklonny MV. Mitotic arrest and cell fate: why and how mitoticinhibition of transcription drives mutually exclusive events. Cell Cycle2007;6:70–4.
52. Thompson SL, Compton DA. Proliferation of aneuploid humancells is limited by a p53-dependent mechanism. J Cell Biol 2010;188:369–81.
Lee et al.
Cancer Res; 71(5) March 1, 2011 Cancer Research1870
American Association for Cancer Research Copyright © 2011 on March 25, 2011cancerres.aacrjournals.orgDownloaded from
DOI:10.1158/0008-5472.CAN-10-3604