Embed Size (px)
Citation preview

Behavioral/Systems/Cognitive
Chromatic Properties of Horizontal and Ganglion CellResponses Follow a Dual Gradient in Cone Opsin Expression
Lu Yin,1 Robert G Smith,1 Peter Sterling,1 and David H. Brainard2
Departments of 1Neuroscience and 2Psychology, University of Pennsylvania, Philadelphia, Pennsylvania 19104
In guinea pig retina, immunostaining reveals a dual gradient of opsins: cones expressing opsin sensitive to medium wavelengths (M)predominate in the upper retina, whereas cones expressing opsin sensitive to shorter wavelengths (S) predominate in the lower retina.Whether these gradients correspond to functional gradients in postreceptoral neurons is essentially unknown. Using monochromaticflashes, we measured the relative weights with which M, S, and rod signals contribute to horizontal cell responses. For a background thatproduced 4.76 log10 photoisomerizations per rod per second (Rh*/rod/s), mean weights in superior retina were 52% (M), 2% (S), and 46%(rod). Mean weights in inferior retina were 9% (M), 50% (S), and 41% (rod). In superior retina, cone opsin weights agreed quantitativelywith relative pigment density estimates from immunostaining. In inferior retina, cone opsin weights agreed qualitatively with relativepigment density estimates, but quantitative comparison was impossible because individual cones coexpress both opsins to varying andunquantifiable degrees. We further characterized the functional gradients in horizontal and brisk-transient ganglion cells using flicker-ing stimuli produced by various mixtures of blue and green primary lights. Cone weights for both cell types resembled those obtained forhorizontal cells using monochromatic flashes. Because the brisk-transient ganglion cell is thought to mediate behavioral detection ofluminance contrast, our results are consistent with the hypothesis that the dual gradient of cone opsins assists achromatic contrastdetection against different spectral backgrounds. In our preparation, rod responses did not completely saturate, even at background lightlevels typical of outdoor sunlight (5.14 log10 Rh*/rod/s).
Key words: cone opsin dual gradient; horizontal cell; brisk-transient ganglion cell; cone weights; light adaptation; spectral sensitivity
IntroductionMost mammals are dichromatic, encoding spectral informationwith one cone opsin sensitive to medium wavelengths (M) andanother sensitive to shorter wavelengths (S) (Jacobs, 1993; Peichl,2005). Generally, S cones comprise !10% of the total and dis-tribute evenly over the retina (Ahnelt and Kolb, 2000). However,in certain rodents, such as guinea pig, rabbit, and mouse, immu-nostaining shows a dual gradient: cones expressing M opsin peakin superior retina and decline inferiorly; whereas cones express-ing S opsin peak in inferior retina and decline superiorly (Rohlichet al., 1994; Applebury et al., 2000; Haverkamp et al., 2005; Ni-konov et al., 2005). This dual gradient in animals that scurryalong the ground might be an evolutionary adaptation to detectobjects against different spectral backgrounds, such as groundvegetation (seen by superior retina) and sky (seen by inferiorretina) (Szel et al., 2000; Osorio and Vorobyev, 2005).
If this idea is correct, the gradients revealed by immunostain-ing should also be present in the responses of postreceptoral neu-rons. The existing data are suggestive but qualitative (Calderone
and Jacobs, 1995; Ekesten and Gouras, 2005). Here we study thechromatic properties of horizontal and brisk-transient ganglioncells in superior and inferior retina of guinea pig. The horizontalcell is directly postsynaptic to cones and in dichromats generallycollects from most cones within its dendritic field (Peichl andGonzalez-Soriano, 1994; Hack and Peichl, 1999). However, insome species, the type A horizontal cell is selective for S cones(Sandmann et al., 1996).
The brisk-transient ganglion cell is postsynaptic to bipolarcells, some of which are known to be cone selective (Calkins andSterling, 1999; Haverkamp et al., 2005). Thus, horizontal andganglion cells might simply propagate signals from all of the over-lying cones and reflect the predictions from immunostaining(Diller et al., 2004; Jusuf et al., 2006) or they might collect selec-tively from one cone type, for example, to smooth out the gradi-ents. Another possible mechanism for smoothing the gradientwould be if synaptic gains on signals from M and S cones variedwith retinal location. The brisk-transient ganglion cell was cho-sen from among the many known ganglion cell types because it isthought to mediate detection and processing of achromatic con-trast (Merigan and Maunsell, 1993; Dhingra et al., 2003; Silveiraet al., 2004).
Because !90% of guinea pig photoreceptors are rods (Peichland Gonzalez-Soriano, 1994) and under steady bright light theyrecover from saturation (Demontis et al., 1993), rods might con-tribute to vision at intensities normally considered photopic. Ac-cordingly, we measured the rod contribution to horizontal cell
Received March 12, 2006; revised Oct. 18, 2006; accepted Oct. 19, 2006.This work was supported by National Eye Institute Grants EY10016, EY08124, and P30 EY001583 and National
Institute of Mental Health Grant MH48168. We thank Agoston Szel for providing cone opsin antibodies, Noga Vardifor providing advice on immunostaining, John Andrews-Labenski, Michael Suplick, Fred Letterio, Jian Li, and MarieFina for technical assistance, and Sharron Fina for manuscript preparation.
Correspondence should be addressed to Dr. David H. Brainard, Department of Psychology, University of Pennsyl-vania, Suite 302C, 3401Walnut Street, Philadelphia, PA 19104. E-mail: [email protected].
DOI:10.1523/JNEUROSCI.1071-06.2006Copyright © 2006 Society for Neuroscience 0270-6474/06/2612351-11$15.00/0
The Journal of Neuroscience, November 22, 2006 • 26(47):12351–12361 • 12351

responses across a wide range of intensities and incorporatedthese measurements into our estimates of cone weights in hori-zontal and ganglion cells. The cone weights matched the immu-nostaining pattern, showing that the dual gradient is preserved inthe centrally projecting neurons that mediate achromatic con-trast detection. This fits the broad hypothesis that the dual opsingradient is an adaptation to optimize contrast detection.
Materials and MethodsTissue preparation. We used albino guinea pigs weighing !300 –500 g.Vingrys and Bui (2001) showed that albino guinea pigs give large butotherwise normal ERG responses and that the ERG components developwith age in the same way as with the pigmented animal. Although albinoanimals such as mouse and rat have a lower rod density compared withpigmented ones (Jeffery et al., 1997; Ilia and Jeffery, 2000), the transverseabsorbance of rat rod outer segments has been shown to be the same(Grant et al., 2001).
An animal was overdosed with anesthetic (ketamine, 100 mg/kg; xyla-zine, 20 mg/kg; and pentobarbital, 50 mg/kg), and both eyes were re-moved. The eyecup was flattened on a membrane filter with ganglioncells up. This preparation was placed into a chamber on a microscopestage (BX50WI; Olympus Optical, Melville, NY) and superfused withoxygenated (95% O2 and 5% CO2) Ames’ medium (Sigma, St. Louis,MO) containing sodium bicarbonate (1.9 g/L) and glucose (0.8 g/L) at!5–7 ml/min. The chamber temperature was maintained between 34and 37°C. The retina was dark adapted for 0.5 h before measurementswere made.
To help find particular retinal regions during the experiment, threecircular holes were cut in the membrane filter. When the tissue wasflattened onto the filter, the middle hole (1 mm diameter) was positionedover the optic disk and the filter was oriented so that the other two holeswere located above or below the optic disk along the superior–inferioraxis of the tissue. Recordings were made from within the locations de-fined by these two holes (2 mm diameter, 3 mm superior or inferior to theoptic disk) (see Fig. 1 B).
Electrical recording. Horizontal cells were recorded intracellularly withsharp electrodes (tip impedance, 70 –200 M"). Responses were ampli-fied (NeuroData IR-283; Cygnus Technology, Delaware Water Gap, PA),digitized at a 5 kHz sampling rate with 12-bit precision (DigiData 1200;Molecular Devices, Sunnyvale, CA), and stored for later analysis (Axo-Scope; Molecular Devices). Voltage traces were smoothed by averagingthe sampled data within 1 ms bins.
Horizontal cells were targeted by advancing electrodes in the presenceof full-field flicker and observing whether the recorded potential wasmodulated. A cell was selected for recording if it responded strongly tofull-field luminance flicker, sinusoidally modulated at !40% contrast.The mean resting membrane potential in light (at the main background)of cells selected for recording was #36 mV, with large variation acrosscells ($17 mV, SD). For many cells, the resting potential drifted gradu-ally toward more positive values during recording.
Brisk-transient ganglion cells were recorded extracellularly with loosepatch electrodes (tip impedance, 2– 4 M"). Responses were recordedusing the same equipment as for the horizontal cells. Spikes were identi-fied using a threshold detection method. Spike rates were calculated for!15 ms bins. Some cells were repatched after the seal between pipetteand cell membrane weakened. With this preparation, stable recordingfrom a single cell was possible for up to 2 h.
Brisk-transient ganglion cells were identified for recording by observ-ing the tissue through the infrared differential interference contrast op-tics of the microscope and locating cells with large somas (18 –23 !mdiameter). A ganglion cell was selected for recording if it gave clear andstable responses to a 10% contrast flickering spot and if the recordedspike was biphasic with amplitude of at least 2 mV. Cell identity wasconfirmed by the large size of the receptive field center (400 – 600 !mdiameter) and the “brisk-transient” response (Cleland et al., 1975; Dembet al., 2001; Dhingra et al., 2003). In pilot experiments, cells were some-times penetrated with a sharp electrode after recording and stained withLucifer yellow (3%, in 0.1 M LiCl solution) for visualization. This method
provided morphological validation of the cell identification proceduresused. It was not used during the main experiments to avoid excessiveexposure of the tissue to light.
Measuring photoreceptor inputs to horizontal and ganglion cells. Coneand rod inputs were characterized by recording responses to spots ofdifferent spectral composition. “Flash experiments” measured the actionspectra to flashed monochromatic spots on a spatially uniform back-ground. This was slow but rather completely characterized the spectralproperties of a cell.“Flicker experiments” measured responses to spots ona spatially uniform background produced by modulating mixtures oftwo primary lights. This was more efficient, but analyzing the data toestimate cone weights required assumptions about the photopigmentaction spectra and the strength of rod input.
We used two optical systems: (1) In the “LCD system,” light from aliquid crystal display (LCD) projector (PowerLite 730c; Epson America,Long Beach, CA) was used. The relative spectra and input– output rela-tionships (gamma functions) of the independent color primaries (red,green, and blue) of this projector were measured at the tissue plane usinga CVI SM-240 (CVI Spectral Products, Albuquerque, NM) spectrometer.The total irradiance (integrated over wavelength) arriving at the tissuewas also characterized (IL1400A; International Light, Peabody, MA). Inthe plane of the tissue, the full image subtended !2.4 % 3.2 mm, witheach pixel corresponding to !3.1 % 3.1 !m. The refresh rate of thedisplay was 70 Hz. (2) In the “lamp system,” light from a xenon lamp(HLX 64642; Osram, Munich, Germany), collimated and fed through anarrowband, tunable filter (VariSpec; Cambridge Research and Instru-mentation, Woburn, MA) and an adjustable aperture to produce a uni-form spot of monochromatic light (!10 nm bandwidth) on the tissuewas used. The temporal profile of the spot was controlled by a mechanicalshutter (VS25S2T1 shutter and 122-BP controller; Uniblitz, Rochester,NY). Lamp voltage, wavelength, and shutter timing were all computercontrolled. To deliver lights of desired intensities during the experiment,the relationship between lamp voltage and irradiance across wavelengthsat the tissue was coarsely characterized beforehand. The exact irradiancesof the stimuli presented were measured after each experiment. The out-puts of the two optical systems were combined through a beam splitterand delivered to the tissue through the camera port on the microscopeand the objective.
The flash experiments used monochromatic spots from the lamp sys-tem on a background produced by the LCD system. The main back-ground produced nearly equal isomerization rates in M and S cones [4.17and 4.12 log10 photoisomerizations per cone per second (Rh*/photore-ceptor/s)] and a somewhat higher rate in rods (4.76 log10 Rh*/photore-ceptor/s). In some measurements, neutral density filters were insertedinto (or removed from) the light path to vary the overall light level. Thespectral transmittance of these filters was individually measured, and themeasurements were included in the stimulus characterization. A !2000-!m-diameter spot was generally flashed for 300 ms, and the flash wasrepeated at least 10 times per trial at 1 s intervals. The exception was forsome of the measurements using the dimmest backgrounds, at which theduration was 400 ms with 1.25 s intervals.
Horizontal cell responses were characterized by the peak response(maximum hyperpolarization), in which response amplitude was mea-sured from the peak to resting level (see Figs. 2 A, D, 4 A). Horizontal cellaction spectra were measured with monochromatic flashes (425– 620nm). For most cells (43 of 48), we corrected for nonstationarities in theresponse. To do so, a 520 nm reference flash was interspersed approxi-mately every five flashes, and the responses to it were used to compute amultiplicative drift-correction factor (see Appendix B). A few cells (n &5) were recorded without interposed 520 nm flashes, but these recordingswere stable over time. Where shown in the plots, SEs of responses at eachwavelength were computed from the responses across multiple trials.Appendix B describes how we analyzed the flash data to account for ahorizontal cell response nonlinearity in our estimation of action spectra.
The flicker experiments used the LCD system alone to modulate a spot(horizontal cells, !2000 !m diameter; ganglion cells, !400 – 600 !mdiameter) around the background at 2 Hz with a temporal sinusoid. Thebackground was the same as the main background used for the flashexperiments, and the cell was adapted continuously throughout the re-
12352 • J. Neurosci., November 22, 2006 • 26(47):12351–12361 Yin et al. • Gradient in Horizontal and Ganglion Cell Responses

cording. The flickering stimulus was repeated for at least 16 cycles. Theresponse was taken as the signed fundamental response amplitude (F1),with the sign indicating whether the response was best described as in-phase or out-of-phase with the stimulus modulation (after accountingfor a small response delay.) Responses during the first and last stimuluscycles were excluded from the analysis.
For the flashed monochromatic spots produced using the lamp sys-tem, stimulus strength at each wavelength was characterized in terms ofirradiance (quanta per square micrometer per second). For the flickeringspots produced using the LCD system, when the stimulus was a mixtureof two primaries, the most natural units are those of cone and rod con-trast (CM, CS, and CRod) at the time of maximum excursion from thebackground (Brainard, 1996). Stimuli from the flash experiments werealso converted to contrast units for some of the analyses.
To convert physical light spectra to contrast units, spectral sensitivitiesfor guinea pig cone photopigments were generated using the nomogramdeveloped by Govardovskii et al. (2000), with "max values obtained usingERG (Jacobs and Deegan, 1994); rod spectral sensitivities were estimateddirectly from our spectral measurements (see Fig. 4C). From these spec-tral sensitivities, we computed isomerization rates and contrasts for eachopsin type (M, S, and rod), using estimates of receptor properties de-scribed in Appendix A. Matlab (MathWorks, Natick, MA) code for per-forming conversions between physical spectra and pigment isomeriza-tion rates is available as part of the Psychophysics Toolbox (http://psychtoolbox.org) (Brainard, 1997; Pelli, 1997).
Immunostaining. We stained the retina with antibodies to M and Sopsin to confirm previous measurements (Rohlich et al., 1994) of opsingradients in guinea pig. An eyecup was kept in dark for 0.5 h in oxygen-ated Ames’ medium, then fixed in 4% paraformaldehyde in 0.1 M phos-phate buffer (PB) for 1 h, and washed briefly in PB. The retina was peeledfrom the pigment epithelium and incubated in blocking buffer (10%normal goat serum and 5% Triton X-100 in PB with 5% sucrose) for 1 hto reduce nonspecific binding. To stain M and S opsins, the tissue wasreacted with primary antibodies (in blocking buffer). For M opsin, weused mouse anti-COS1 (kindly provided by Prof. A. Szel, Department ofHuman Morphology and Developmental Biology, Semmelweis Univer-sity, Budapest, Hungary) (Rohlich et al., 1994) at a dilution of 1:40, and,for S opsin, we used rabbit anti-S opsin (Chemicon, Temecula, CA) at adilution of 1:600 for 35 h at 4°C. After several washes in PB with 5%sucrose (SPB), the tissue was reacted with secondary antibodies (4 h,room temperature) to visualize the opsin staining. M opsin was taggedwith FITC (Invitrogen, Carlsbad, CA), and S opsin was tagged with cya-nine 5 (Invitrogen). Finally, after several washes in SPB, the tissue wasmounted on a glass slide with the photoreceptor side up and then coveredwith mounting medium (Vectashield; Vector Laboratories, Burlingame,CA) and a coverslip.
The tissue was examined using a confocal microscope (Leica TCSNT;Leica, Nussloch, Germany) with 40% objective (1.25 numerical aper-ture) and 100% objective (1.4 numerical aperture). A preliminary scanwas performed to optimize the photomultiplier tube settings. Imagestacks of the photoreceptor layer from both superior and inferior retinawere then obtained, with a total z-depth covering the cone outer seg-ments. Within each image stack, cone outer segments were outlined inVolocity (Improvision; Lexington, MA) and counted manually.
Outdoor spectra of skylight and ground cover. Using a spectraradiometer(PR-650; Photo Research, Chatsworth, CA), we measured the spectra ofskylight and light reflected from ground cover (e.g., grass, leaves, fruits,tree barks, and earth) in direct sunlight or under shade of trees in a localbotanic garden (Philadelphia, PA; early afternoon in July, clear sky withclouds). To convert the spectra into retinal irradiance, we used a poste-rior nodal distance of 5.05 mm for guinea pig eye (Do-Nascimento et al.,1991) and adjusted the pupil size used in the calculation according to thelight intensity. Photopigment isomerization rates for each opsin type (M,S, and rod) were calculated from retinal irradiance as described above.
ResultsImmunostainingWe confirmed the observations of Rohlich et al. (1994). Superiorretina contained !20,000 cones/mm 2. Individual cones stained
for either M opsin (94%) or S opsin (6%) but not both (Fig. 1A,left). Inferior retina contained !24,000 cones/mm 2. All conesstained for S opsin, and some also stained for M opsin (Fig. 1A,right). The prevalence of coexpression and the intensity ofM-opsin staining declined toward the inferior margin of the ret-ina. At distances '3.0 mm inferior to the optic disk, M-opsinstaining was detected in fewer than 1% of the cones.
To estimate the M/S opsin ratio in inferior retina, one wouldneed to assume that the antibodies stain each opsin with equalefficiency. Because this assumption probably does not hold(Hack and Peichl, 1999; Applebury et al., 2000; Nikonov et al.,2005), we view the measurements in inferior retina as indicatingonly qualitatively that S opsin is expressed much more stronglythan M opsin.
Measuring horizontal cell M, S, and rod weights:flash experimentsWe estimated cone contributions to horizontal cell response(“cone weights”) from the responses of the cell to monochro-matic flashes. As described in Appendix B, the analysis took intoaccount a horizontal cell contrast–response nonlinearity (Fig.2B,E) (see Fig. 7). Figure 2 shows action spectra obtained for twocells, one from superior retina (C) and one from inferior retina(F). Fits to individual cells as weighted sums of M, S, and rodcontrast spectral sensitivities are also shown in Figure 2, C and F.The fitting procedure is described in Appendix B. The fits aregenerally good with some deviation at the shortest wavelengths,for which the data become somewhat irregular.
There is a striking difference between the photoreceptor con-
Figure 1. M opsin is expressed predominately in superior retina, and S opsin is expressedpredominately in inferior retina. A, Cone outer segments labeled by antibodies against M and Sopsins. M opsin labeling is shown in green, and S opsin labeling is shown in red. In superiorretina (left), each cone expressed only one type of cone opsin and there were fewer S cones(arrowhead; !6% of all cones). Small regions in yellow were attributable to the overlay of M-and S-cone outer segments but not the coexpression of both cone opsins in the same cone outersegment. In inferior retina (right), all cones expressed S opsin and a few cones (arrow) coex-pressed M opsin. Brightness and contrast of the images were enhanced in Photoshop (AdobeSystems, San Jose, CA). B, Schematic diagram of the retina. Images in A were taken fromlocations within the two circular areas (gray; 2 mm in diameter and 3 mm from their centers tooptic disk). These are the same regions from which horizontal and ganglion cell responses wererecorded.
Yin et al. • Gradient in Horizontal and Ganglion Cell Responses J. Neurosci., November 22, 2006 • 26(47):12351–12361 • 12353

trast weights obtained from the spectral fits in superior and infe-rior retina. Mean $ SE weights obtained in superior retina (n &14) were as follows: M, 0.52 $ 0.03; S, 0.02 $ 0.01; rod, 0.46 $0.03. Mean $ SE weights obtained in inferior retina (n & 8) wereas follows: M, 0.09 $ 0.01; S, 0.50 $ 0.03; rod, 0.41 $ 0.04. Rodweights did not differ significantly between superior and inferiorretina (t test, p & 0.31). The distribution of weights obtained inindividual horizontal cells at the main background intensitystudied (4.76 log10 Rh*/rod/s) is shown in Figure 3A as green dots(superior retina) and green circles (inferior retina). The weightsobtained for the two retinal regions are well separated, withM-opsin input dominant in the superior retina and S-opsin inputdominant in the inferior retina.
In addition to cone input, horizontal cells also received signif-icant input from rods at the main background intensity used.This is revealed by the fact that fits to the action spectra without arod contribution deviate from the data (Fig. 2C,F). We returnbelow to the question of how rod and cone weights vary withbackground intensity.
Our fits were obtained using M- and S-opsin spectral sensitiv-ities based on the nomogram of Govardovskii et al. (2000), with"max values of 430 and 529 nm (Jacobs and Deegan, 1994). Rodspectral sensitivity was derived directly from our measurementsat low-light levels (see below). Because there is an !30 nm rangein values for guinea pig S-cone photopigment "max reported in
the literature (Jacobs and Deegan, 1994; Parry and Bowmaker,2002; Parry et al., 2004), we verified our choice of cone pigment"max by fitting the data at which M- and S-opsin "max values werealso allowed to vary as free parameters. The optimal value ofM-opsin "max obtained was 527.5 nm for the cell shown in Figure2C and 527.3 nm for all cells from superior retina (n & 14) at themain background. The optimal value of S-opsin "max obtainedwas 433.4 nm for the cell shown in Figure 2F and 430.2 nm for allcells from inferior retina (n & 8) at the main background. Thesevalues are in good agreement with the published values of Jacobsand Deegan (1994). We used their published values in our pri-mary analyses. Assuming a value of 410 nm for S-opsin "max leadsto a poor fit to the action spectrum shown in Figure 2F, with 2.1times larger root mean squared error but similar weights: M, 0.07;S, 0.52; and rod, 0.41.
We estimated cone and rod weights across a broad range ofbackground light intensities. All of the backgrounds had similarrelative spectra (for the isomerization rates produced in eachreceptor type for each background, see supplemental Table 1,available at www.jneurosci.org as supplemental material). Asbackground intensity increased from 2.08 to 5.14 log10 Rh*/rod/s, rod contribution decreased but still remained significant atthe most intense background (Fig. 3). In parallel, cone inputgradually increased and was evident at a background of 2.67 log10
Rh*/rod/s (2.09 log10 Rh*/M cone/s and 1.99 log10 Rh*/S cone/s)
Figure 2. At high light levels, horizontal cells from superior and inferior retina had different action spectra. A, Response waveforms of horizontal cell from superior retina to monochromatic flashesat wavelengths of 440, 500, and 600 nm. Each waveform is shown normalized to its peak response amplitude, which was measured as the difference between the resting level and maximumhyperpolarization after flash onset. The peak response amplitudes and flash intensities were 1.7 mV and 3.36e(4 quanta/!m 2/s (440 nm), 4.1 mV and 3.10e(4 quanta/!m 2/s (500 nm), and 2.6mV and 1.23e(5 quanta/!m 2/s (600 nm). The background produced 4.17 (M), 4.12 (S), and 4.76 (rod) log10 Rh*/photoreceptor/s. Responses from the same cell at the same background are alsoreported in B and C. B, Flash contrast–response function. The scaled monochromatic flash responses (see Materials and Methods and Appendix B) are plotted against weighted input contrast Cinput,which is computed from the flash intensity using the photoreceptor weights of the cell estimated in C. The average gain of the cell was 4.5 mV/100% weighted input contrast. The red line shows thestatic nonlinearity that describes the horizontal cell contrast–response function at the background intensity used. Its shape was derived from flash data of all cells studied at the same background(see Appendix B and Fig. 7). C, Action spectrum of a horizontal cell from superior retina. The cell was presented with monochromatic flashes of varying wavelengths from 420 to 620 nm. The actionspectrum was computed and plotted according to the procedure described in Appendix B. Data (gray circles) are means $ 1 SE. The red line shown is a weighted sum of M, S, and rod contrastsensitivities. The relative weights are as follows: M, 0.51; S, 0.0; and rod, 0.49. These weights are shown in the inset. The second fit shown by the black line is the result of refitting the data with thesame static nonlinearity but without the rod contribution. This fit deviates from the data. D, Response waveforms of horizontal cell from inferior retina to monochromatic flashes at wavelengths of440, 500, and 600 nm. Same format as A. The peak response amplitudes and flash intensities were 2.3 mV and 2.58e(4 quanta/!m 2/s (440 nm), 3.9 mV and 7.58e(4 quanta/!m 2/s (500 nm),and 1.5 mV and 3.66e(5 quanta/!m 2/s (600 nm). The background produced 4.17 (M), 4.12 (S), and 4.76 (rod) log10 Rh*/photoreceptor/s. Responses from the same cell at the same backgroundare also reported in E and F. E, Flash contrast–response function. Same format and same nonlinearity as B. The average gain of the cell was 3.5 mV/100% contrast. F, Action spectrum of a horizontalcell from inferior retina. Same format as C. Here the relative weights of the best fit (red line) are as follows: M, 0.09; S, 0.47; and rod, 0.45. The second fit (black line), obtained using the same staticnonlinearity but without rod contribution, deviates from the data.
12354 • J. Neurosci., November 22, 2006 • 26(47):12351–12361 Yin et al. • Gradient in Horizontal and Ganglion Cell Responses

(Fig. 3A, yellow dot). The ratio of M- and S-opsin weights isrelatively stable across background intensities. The red dashedlines in Figure 3A are fit to the data across background intensitiesand correspond to M/S ratios of 0.96:0.04 (superior retina) and0.17:0.83 (inferior retina).
Measuring rod spectral sensitivityHorizontal cells can receive rod input through rod– cone gapjunctions (Sharpe and Stockman, 1999; Bloomfield and Da-cheux, 2001; Sterling, 2004). We measured action spectra of hor-izontal cells against a dim background with isomerization rates of1.50 (M), 1.39 (S), and 2.08 (rod) log10 Rh*/photoreceptor/s (Fig.4C). At this background, the waveforms of the flash responses(Fig. 4A) resembled those reported for primate retina at low (10troland) light levels (Smith et al., 2001). The action spectra wemeasured were well fit using rod spectral sensitivities derivedfrom two types of nomograms (Baylor et al., 1987; Govardovskii
Figure 3. When background intensity increased, relative cone contribution to horizontal cellresponses increased but relative rod contribution decreased. A, Photoreceptor weights of cellscollected at eight background levels. The backgrounds had similar relative spectra but varied inoverall intensity from 2.08 to 5.14 log10 Rh*/rod/s. Each dot or circle represents the relative M,S, and rod weights inferred from the best fit to the measured spectral sensitivity for a single celland intensity level. Because the relative weights sum to 1, they may be represented in a two-dimensional plot. The x- and y-axes provide the M and S weights, respectively. The rod weightmay be visualized by noting the position of a plotted point along a third axis that extends fromthe origin at a 45° angle. Points closer to the origin had higher rod weight. Points above the 45°axis had higher S weight than M weight and vice versa. Dots represent cells from superior retina,and circles represent cells from inferior retina. We fitted all of the data of each retinal area witha straight line (red lines). Slopes of the fits describe relative M and S contributions as a fractionof total cone input (superior retina, 0.96/0.04; inferior retina, 0.17/0.83). B, Mean photorecep-tor weights (error bars show $1 SE) are plotted against background intensity (M, green line; S,blue line; rod, black line). Top shows data from superior retina, and bottom shows data frominferior retina. Rod contribution decreased with background intensity but did not drop to 0 atthe highest intensity backgrounds used.
Figure 4. At low light levels, action spectra of horizontal cells matched rod spectral sensitiv-ity. A, Response waveforms of horizontal cell from inferior retina to monochromatic flashes atwavelengths of 440, 500, and 600 nm. Same format as Figure 2, A and D. The responses lackeda clear transient phase and reached maximum hyperpolarization slowly, in contrast with thetime course of responses observed at high light levels (Fig. 2 A, D). The peak response ampli-tudes and flash intensities were 1.0 mV and 50 quanta/!m 2/s (440 nm), 2.2 mV and 52quanta/!m 2/s (500 nm), and 1.3 mV and 938 quanta/!m 2/s (600 nm). The backgroundproduced 1.50 (M), 1.39 (S), and 2.08 (rod) log10 Rh*/photoreceptor/s. All panels used the samebackground. B, Flash contrast–response function. Same format as Figure 2, B and E. The mono-chromatic flash responses of all cells shown in C (superior retina, dark gray dots; inferior retina,light gray dots) were scaled and plotted against corresponding input contrasts (see AppendixB). Input contrasts were computed by fitting action spectra determined under the assumptionthat the contrast–response functions of the cells were linear for the range of stimuli presented.This linearity assumption is supported by the plot, which shows that the data cluster near astraight line. The average gain of all cells (n & 7) was 4.3 mV/100% contrast. C, Action spectraof all horizontal cells measured against the dimmest background. Action spectra were com-puted as described in Appendix B under the assumption that the contrast–response functions ofthe cells were linear for the range of stimuli presented. Rod spectral sensitivities derived fromtwo photopigment nomograms (Baylor et al., 1987; Govardovskii et al., 2000), with values of"max as 500.6 or 501.7 nm, respectively, describe the data well. Action spectra of individual cellsare shown as green dots (from superior retina) and blue dots (from inferior retina), with themean data shown as gray dots. Data from the two retinal regions did not differ substantially.The red curve shows a polynomial fit to the mean data, which we used as our estimate of rodspectral sensitivity for other calculations reported in this study.
Yin et al. • Gradient in Horizontal and Ganglion Cell Responses J. Neurosci., November 22, 2006 • 26(47):12351–12361 • 12355

et al., 2000), with "max close to 500 nm. This value matches thatreported previously for guinea pig rods (Jacobs and Deegan,1994; Parry and Bowmaker, 2002). In addition, the similarity ofthe spectral sensitivity obtained from superior and inferior retinaindicates minimal cone contributions for this background inten-sity. We fit the mean data with a polynomial and used this fit asour best estimate of rod spectral sensitivity for the other calcula-tions reported in this paper.
Measuring horizontal cell M, S weights: flicker experimentsTo estimate M- and S-cone contrast weights for the flicker exper-iments, we presented each cell with modulations of various com-binations of M and S contrasts produced as the mixture of theblue and green primaries of the LCD system (CM and CS) (Fig. 5A,top row). Negative M contrast represents modulations in whichthe M component of the modulation is 180° out-of-phasewith the S component. We estimated M and S contrast weightsfrom the data using a linear–nonlinear (LNL) model (AppendixC) (Fig. 5B) (Chichilnisky, 2001; Chatterjee and Callaway, 2002;Chichilnisky and Kalmar, 2002; Zaghloul et al., 2003).
Because our flicker stimuli consisted of the mixture of twoprimaries, we could not independently estimate rod input fromthe flicker data (Appendix C). Therefore, we took the estimates ofrod input obtained in the flash experiment at the same back-ground level (wRod & 0.44 $ 0.12, mean $ SD, combining mea-surements from superior and inferior retina) and included this inthe LNL model calculations. We then found the M- and S-conecontrast weights and parameters of the static nonlinearity thatbest accounted for the data from each cell. The green points plot-ted in Figure 6A (and B) show the horizontal cell cone weightsobtained in this manner. As with the flash experiments, the datareveal large differences between superior and inferior retina. Asshown in the figure, these differences are robust with respect tovariation in the assumption about the magnitude of rod input.
In six horizontal cells (four at main background and two atdimmer backgrounds), we were able to obtain cone weight esti-mates from both the flash and flicker protocols. To compare theestimates obtained from the two protocols, we reanalyzed theflicker data from these cells using the estimate of rod input ob-tained for the same cell from the flash data. The estimates ob-tained from the two methods were in good agreement. (For both M-and S- cone weights, expressed as fraction of total cone inputs, meanabsolute deviation was 0.08 and maximum deviation was 0.16.)
Measuring brisk-transient ganglion cell M, S weightsWe measured responses of brisk-transient ganglion cells to theflicker stimuli. Cone contrast weights for these cells were esti-mated using the same procedure as for the horizontal cell flickerdata. As with horizontal cells, cone contrast weights to brisk-transient ganglion cells differ greatly with retinal location (Fig.6C,D). The difference in cone weights between regions also sur-vived variation in the assumption about the magnitude of rodinput. Comparison across the two cell types, but at the sameretinal location and with the same assumption about rod input,reveals similar M and S weights (Fig. 6B,D).
DiscussionOpsin expression predicts cone input to horizontal and brisk-transient ganglion cellsCone inputs to horizontal cells correlate strongly with the dualgradients of M and S opsin demonstrated by immunostaining. Insuperior retina, the agreement was quantitative, as shown in Fig-ure 6B. In inferior retina, we could not quantify the M/S opsin
ratio by immunostaining; nevertheless, the two measures agreedqualitatively. Furthermore, the cone weights were the same forbrisk-transient ganglion cells (Fig. 6B,D); thus, as signals flowfrom outer to inner retina, the weighting is preserved. This con-clusion assumes that rod weights are the same for horizontal andganglion cells. This assumption seems justified because, at thehigh light levels used here, the rod signal enters the cone pathwayby coupling to the cone terminal electrically and provides a com-mon signal to all downstream neurons (Sharpe and Stockman,1999; Bloomfield and Dacheux, 2001; Sterling, 2004).
Previous studies in primate retina on L- and M-cone inputs to
Figure 5. LNL model describes the responses of cells to flicker and was used to estimate M-and S-cone weights. A, Responses to flicker. Left column shows a stimulus (top) that sinusoi-dally modulates excitation of M and S opsins against a uniform background and the responses ofa horizontal cell (smoothed membrane potential, middle) or a ganglion cell (peristimulus timehistogram, bottom panel) to this stimulus. Right column shows a set of sinusoidally modulatedstimuli (top, M and S contrasts plotted; cyan dot, the stimulus shown on the left; red line is thegamut limitation of our display) and how the F1 responses to these stimuli (gray dots) forhorizontal and ganglion cells (middle and bottom) were described by the LNL model (see B andAppendix C). The derived static nonlinearity for the horizontal cell was essentially linear over therange of contrasts used, whereas the ganglion cell showed clear saturation. B, Linear nonlinearmodel. The linear component of the model used a weighted sum of receptor contrasts as Cinput.The nonlinear component predicted the response (F1) of the cell from Cinput through a param-eterized static nonlinearity. Cone weights and parameters describing the static nonlinearitywere found through numerical search by minimizing the difference between model prediction(red line) and responses (gray dots) (right middle and right bottom plots in A). To correct for rodcontribution to cell response, the rod contrast weight was set at a fixed value before fitting thecone weights and parameters of the nonlinearity. In Appendix C, we show that the fit qualityand derived nonlinearity are independent of the rod contrast weight assumed. We used thedata from the flash experiments to set the value for the rod contrast weight.
12356 • J. Neurosci., November 22, 2006 • 26(47):12351–12361 Yin et al. • Gradient in Horizontal and Ganglion Cell Responses

horizontal cells and midget and parasol ganglion cells suggested aprinciple that relative expression of cone opsins is preserved pos-treceptorally (Dacey et al., 2000; Deeb et al., 2000; Diller et al.,2004). Our finding is consistent with this principle.
Our findings about the functional consequences of the dualopsin gradient agree with those from previous studies in mousethat used regional electroretinography (Calderone and Jacobs,1995) and that mapped the distribution of ganglion cells withdifferent cone weights (Ekesten et al., 2000; Ekesten and Gouras,2005). Our studies extend the previous results by quantifying theeffect for two specific classes of retinal neurons.
Brisk-transient ganglion cells correspond to M cells in the
primate retina, which are responsible for behavioral contrast de-tection (Merigan and Maunsell, 1990, 1993; Dhingra et al., 2003;Silveira et al., 2004). That these cells follow the dual opsin gradi-ent supports the hypothesis that the opsin gradients optimizecontrast detection across spectral variation along the vertical me-ridian. Although the ecological basis for this optimization pre-sumably lies in the spectral shift between ground and sky (Szel etal., 2000; Osorio and Vorobyev, 2005), a detailed account awaitsa fuller characterization of the guinea pig’s photic environmentand the signal-to-noise properties of its photoreceptors. Recentwork has begun to characterize noise sources in the photorecep-tors of various species and how these vary between rods and cones
Figure 6. Distributions of M and S weights differed between different retinal areas but were similar across cell types. A, Cone weights of horizontal cells estimated from flicker data. To estimatecone weights, we included rod input in the analysis, fixing the rod weights at the mean level measured in the flash experiments at the same background intensity and retinal region (green dots andcircles in Fig. 3A). The resulting estimates are shown as green dots and circles in the present figure. We also estimated cone weights under different assumptions about rod input. Additional rodweights assumed were no rod input (gray) and $1.5 SD away from the mean estimate (red and blue). In the fits, we constrained the cone weights to be positive, which, for some cells, altered therod weight to a smaller value when derived M or S weights equaled 0. The rod weights shown in the insets are the mean values used in calculations, which are smaller than the nominal values becauseof the alteration procedure described in the previous sentence. Across the range of rod weights assumed, clear separation of the data from superior and inferior retina holds. The background produced4.16 (M), 4.12 (S), and 4.76 (rod) log10 Rh*/photoreceptor/s. All panels used the same background. B, Comparison of mean cone weights from A with those from the horizontal cell flash data andcone opsin ratio estimates from immunostaining. Both panels plot M and S weights as fractions of total cone input. Error bars (indicating SE) are plotted only for M cones. Bars marked with squaressummarize data in A. For horizontal cells in superior retina, assuming higher rod weights leads to a higher fraction of M versus of S input and vice versa in inferior retina. The effect of varying assumedrod weight is small relative to the effect of retinal location. Bars labeled Flash H represent cone weights obtained for horizontal cells in the flash experiments. For superior retina, the bar labeledImmuno represents the fraction of M and S cones of all cones, which we also take as the opsin ratio. Inferior retina lacks this bar because immunostaining could not quantify the ratio of M- to S-opsinexpression. Qualitatively, S-opsin expression greatly exceeds M-opsin expression in inferior retina. C, Cone weights of ganglion cells estimated from flicker. The same format as A is shown. Resultsfrom horizontal and ganglion cells are similar. D, Summary of cone weights in C. The same format as B is shown. For ganglion cells, in superior retina, assuming higher rod weights leads to a higherfraction of M input versus that of S and vice versa in inferior retina. The effect of varying rod weight is small relative to the effect of retinal location. Together with B, the plot establishes that the coneweights from the flicker are similar for horizontal and ganglion cells and are consistent with cone weights from the flash data for horizontal cells and the opsin ratio obtained from immunostaining.
Yin et al. • Gradient in Horizontal and Ganglion Cell Responses J. Neurosci., November 22, 2006 • 26(47):12351–12361 • 12357

and between cones of different classes (Schneeweis and Schnapf,1999; Rieke and Baylor, 2000; Burns and Baylor, 2001; Sampathand Baylor, 2002; Ala-Laurila et al., 2004; Dunn and Rieke, 2006;Nikonov et al., 2006).
Contrast versus intensity weightsIn our analysis, we followed previous authors (Chatterjee andCallaway, 2002; Diller et al., 2004; Johnson et al., 2004; Horwitz etal., 2005) and derived photoreceptor weights using a contrastmeasure. These weights describe the relationship between thecontrast of the stimuli and the response of the postreceptoralcells. The rationale for this choice is that contrast weights areinvariant with respect to changes in the chromaticity and inten-sity of the background if photoreceptors adapt according to We-ber’s Law (i.e., gain for each class of receptor inversely propor-tional to background isomerization rate for that class). Weber’sLaw provides a reasonable first-order description of photorecep-tor adaptation over much but not all of their operating range(Demontis et al., 1993; Schneeweis and Schnapf, 1999). Indeed, ifWeber’s Law adaptation perfectly described the behavior of thecoupling between photoreceptors and postreceptoral neurons,the relative contributions of rods and cones would not changewith background intensity when expressed as contrast weights.This prediction is clearly falsified by our data (Fig. 3) for largechanges in background intensity.
Because there are deviations from Weber’s Law adaptation, itis worth considering whether our conclusions depend stronglyon the choice to use contrast weights. Intensity weights describethe relationship between the incremental intensity of the stimuliseen by each photoreceptor class and cell response. We describethis reanalysis and show the results in the supplemental material(particularly supplemental Figs. 1, 2, available at www.jneuro-sci.org as supplemental material). None of the basic conclusionsof the paper are sensitive to the choice of whether to evaluatereceptor contribution in terms of contrast or incremental inten-sity. In particular, the relative M- and S-cone weights are essen-tially similar in the intensity weight analysis. This invariance is inpart a consequence of the fact that we carefully chose the chro-maticity of our backgrounds so that they produced similarisomerization rates in the M and S cones.
The biggest change resulting from the reanalysis in terms ofintensity weights is a reduction in the estimated magnitude of rodcontribution. Note, however, that the spectral fits shown in Fig-ure 2, C and F, do not change when the weights are expressed interms of intensity instead of contrast, so that the deviations forthe no-rod fits are invariant with respect to this choice.
Rods contribute to responses at high light levelsMammalian rods, including those of guinea pig, show Weber’sLaw adaptation at background levels up to !4 log10 Rh*/rod/s(Tamura et al., 1989; Nakatani et al., 1991; Demontis et al., 1993).These measurements were made using suction microelectrode
recording from isolated rod outer segments and relatively shortadaptation times. If such adaptation continues to even higherlight levels in whole-mount retina under the steady adaptationconditions that we used, it could explain why we observe rodcontributions at yet higher light levels (5.14 log10 Rh*/rod/s).
Our spectral measurements show that light reflected fromground in shade produced 4.2– 6.4 log10 Rh*/rod/s in guinea pig,whereas light reflected from ground in direct sunlight produced5.0 – 6.8 log10 Rh*/rod/s. These comparisons suggest that rodscontribute substantially to daylight vision.
Appendix A: photoreceptor parametersTable 1 provides the parameters we used to determine the pho-toreceptor sensitivities and peak isomerization probabilities. Forcones, the value of "max was used in conjunction with the nomo-gram developed by Govardovskii et al. (2000) to generate therelative cone sensitivity. This was then adjusted for pigment self-screening and scaled according to the peak isomerization proba-bility derived using the other constants given in Table 1. For rods,the spectral sensitivity was determined from a polynomial fit tohorizontal cell action spectra measured on the dimmest back-ground. This was then scaled to fit the rod sensitivity derivedfrom the nomogram computed with "max & 500 nm, and thepeak isomerization sensitivity was taken from this scaled version.
Appendix B: estimating action spectra from flashdata for horizontal cellsThis appendix describes how we estimate horizontal cell actionspectra. There are two key steps to the processing. The first stepnormalizes the measured response at each wavelength to that of areference flash presented at 520 nm. This step compensates for adrift in gain that can occur during measurements from a singlecell. The second step corrects for a static nonlinearity in the con-trast–response function of horizontal cells.
Drift correctionAs described in Materials and Methods, we measured the re-sponses of horizontal cells to reference flashes presented at 520nm. The intensity of the reference flashes was held constant foreach cell but was chosen individually for each cell so as to producean easily measurable response. We used linear interpolation onthe responses to the reference flashes to provide an estimate ofhow the cell would have responded to the reference flash at anytime during the experiment. We divided the measured responseto each test flash by the estimate of the reference flash response atthe corresponding time. This produced a drift-corrected re-sponse Rc(") & R(")/R(520) for each test flash, where R(") is theraw measured response to a test flash of wavelength ", and R(520)denotes the interpolated estimate of the response of the referenceflash response at the time of the test flash. We used this procedure
Table 1. Parameters used to calculate photoreceptor isomerization rates
Photoreceptor type M cone S cone Rod Units Source
"max 529 430 500 nm (Jacobs and Deegan, 1994)Outer segment length 8.0 8.0 16.2 Unpublished data from our laboratoryOuter segment diameter 2.0 2.0 2.0 !m Unpublished data from our laboratoryInner segment diameter 2.8 2.8 2.4 !m Unpublished data from our laboratoryAxial specific density 0.0045 0.004 0.011 !m#1 (Parry and Bowmaker, 2002)Axial optical density 0.036 0.032 0.170 Calculated from other parametersPeak isomerization probability 0.053 0.047 0.229 Calculated from other parameters
12358 • J. Neurosci., November 22, 2006 • 26(47):12351–12361 Yin et al. • Gradient in Horizontal and Ganglion Cell Responses
for 43 of 48 cells. For the other five cells, interspersed referenceflash measurements were not made, and, for these cells, we tookRc(") & R(").
Correction for static nonlinearityIf horizontal cells responded linearly with flash stimulus contrastat all wavelengths, we could convert drift-corrected responses toaction spectra directly by dividing the drift-corrected response ateach wavelength by the flash intensity I(") at that wavelength.This procedure, however, would produce distorted action spectraestimates if some of the flashes drove the cells outside of theirlinear operating range. To avoid such distortion, we corrected forresponse nonlinearity using an LNL model (Chichilnisky, 2001;Chatterjee and Callaway, 2002; Chichilnisky and Kalmar, 2002;Zaghloul et al., 2003).
The LNL model describes the response of the cell as the resultof passing an input contrast Cinput(") through a nonlinear re-sponse function. The input contrast is taken as the weighted sumof the contrasts CM("), CS("), and CRod(") seen by the M cones,S cones, and rods in response to the test flash at wavelength ":
C input)"* # uMc CM)"* $ uS
cCS)"* $ uRodc CRod)"*. (B1)
Here, uMc , uS
c , and uRodc are the M-cone, S-cone, and rod contrast
weights. The values of CM("), CS("), and CRod(") are calculatedfrom the spectral sensitivity of the photoreceptors SM
i ("), SSi ("),
and SRodi ("), the test flash intensity I("), and the isomerization
rates seen by each receptor class to the background. We denotethese background isomerization rates as RhM,bg
* , RhS,bg* , and
RhRod,bg* . The contrasts are then computed as CM(") &
I(")SMi (")/RhM,bg
* , CS(") & I(")SSi (")/RhS,bg
* , and CRod(") &I(")SRod
i (")/RhRod,bg* .
The nonlinear response function is taken to have the form
Rc)"* # RmaxCinput)"*n/)Cinput)"*n $ C0n*. (B2)
The parameters C0, n, and Rmax denote the semi-saturation con-stant, exponent, and maximum response amplitude. For eachbackground level, we took the parameters C0 and n as common toall horizontal cells, whereas the value of parameter Rmax variedfrom cell to cell.
We analyzed the data from each background level separately.To fit the LNL model to the horizontal cell data from each back-ground, we used an iterative procedure. First, we initialized theaction spectrum of each cell under the assumption that the cellresponded linearly. We then obtained initial estimates of uM
c , uSc ,
and uRodc for each cell by fitting the action spectrum as the
weighted sum of the contrast sensitivities of the three photore-ceptor types. This initial fit allowed us to proceed by iteratingbetween two steps.
The first step determined the parameters of the static nonlin-earity that best accounted for the data from all cells at the samebackground. The second step redetermined the weights uM
c , uSc ,
and uRodc for each cell, after correcting for the common nonlin-
earity determined in the first step. We found that this procedureconverged rapidly and accounted for the data well.
Step 1: fitting the nonlinearityGiven values for uM
c , uSc , and uRod
c for each cell, we can computethe value of Cinput(") for every test flash presented to every cell.We assumed that individual cells could have different Rmax. As anumerical convenience, rather than fitting Rmax to each cell, wescaled the drift-corrected responses from each cell so that the
initial slope of the contrast–response function [evaluated for datacorresponding to Cinput(") % 0.45] was the same. We then usednumerical search to determine C0, n, and a single Rmax
scaled that bestaccounted for the set of scaled responses for all cells.
Step 2: correcting for the nonlinearity in the estimation of uMc , uS
c ,and uRod
c
Given the results of step 1, we used numerical search to find theparameters uM
c , uSc , and uRod
c and Rmax that best fit the drift-corrected responses Rc(") responses for each cell, through Equa-tions B1 and B2. During this fit, we held C0 and n constant at thevalues obtained in step 1.
We then iterated the procedure, using contrast weights uMc , uS
c ,and uRod
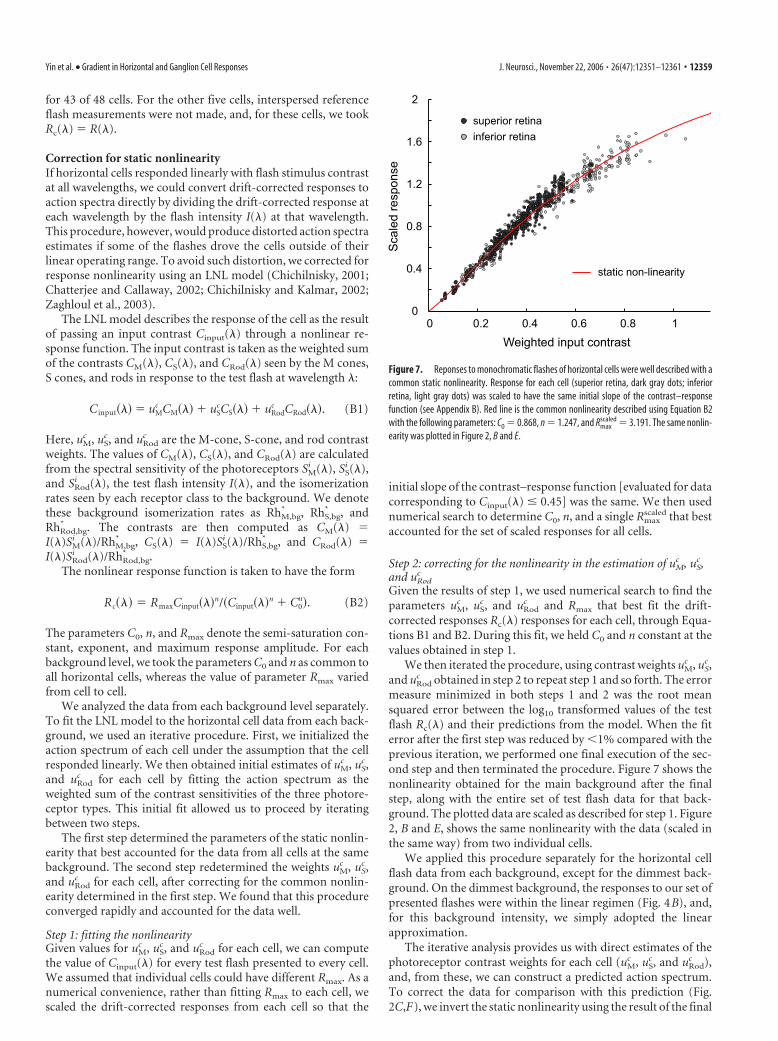
c obtained in step 2 to repeat step 1 and so forth. The errormeasure minimized in both steps 1 and 2 was the root meansquared error between the log10 transformed values of the testflash Rc(") and their predictions from the model. When the fiterror after the first step was reduced by +1% compared with theprevious iteration, we performed one final execution of the sec-ond step and then terminated the procedure. Figure 7 shows thenonlinearity obtained for the main background after the finalstep, along with the entire set of test flash data for that back-ground. The plotted data are scaled as described for step 1. Figure2, B and E, shows the same nonlinearity with the data (scaled inthe same way) from two individual cells.
We applied this procedure separately for the horizontal cellflash data from each background, except for the dimmest back-ground. On the dimmest background, the responses to our set ofpresented flashes were within the linear regimen (Fig. 4B), and,for this background intensity, we simply adopted the linearapproximation.
The iterative analysis provides us with direct estimates of thephotoreceptor contrast weights for each cell (uM
c , uSc , and uRod
c ),and, from these, we can construct a predicted action spectrum.To correct the data for comparison with this prediction (Fig.2C,F), we invert the static nonlinearity using the result of the final
Figure 7. Reponses to monochromatic flashes of horizontal cells were well described with acommon static nonlinearity. Response for each cell (superior retina, dark gray dots; inferiorretina, light gray dots) was scaled to have the same initial slope of the contrast–responsefunction (see Appendix B). Red line is the common nonlinearity described using Equation B2with the following parameters: C0 & 0.868, n & 1.247, and Rmax
scaled & 3.191. The same nonlin-earity was plotted in Figure 2, B and E.
Yin et al. • Gradient in Horizontal and Ganglion Cell Responses J. Neurosci., November 22, 2006 • 26(47):12351–12361 • 12359

iteration of step 2. This allows us to compute an action spectrumA(") from the drift-corrected responses Rc(") through
A)"* #C0
I)"*!n Rc)"*/)Rmax & Rc)"** . (B3)
Each datum plotted in Figure 2, C and F, was obtained usingEquation B3. Only the shape of the action spectra A(") are ofinterest here, so the plotted data and predictions shown for eachcell were shifted vertically by a common amount on the log10
sensitivity axis so that the theoretical value A(520) & 1. Similarly,we report relative contrast weights
wMc # uM
c /)uMc $ uS
c $ uRodc * (B4)
wSc # uS
c/)uMc $ uS
c $ uRodc *
wRodc # uRod
c /)uMc $ uS
c $ uRodc *
in this study, because a scale factor common to uMc , uS
c , and uRodc
trades off perfectly with the semi-saturation constant throughEquation B2. Indeed, the normalization in Equation B4 was ap-plied during the fitting process to allow the parameter search toconverge to a unique value of C0.
Appendix C: LNL model for horizontal and ganglioncell flicker dataTo estimate M- and S-cone contrast weights from the flicker data,we also used the LNL model to describe cell responses (see Ap-pendix B, Eqs. B1 and B2) (Fig. 5B). We fit the parameters of themodel to each cell separately and also allowed a parameter thatcould account for the spontaneous activity of the cells. Becausethe flicker stimuli were constructed as the superposition of twoprimaries, the flicker data do not allow unique identification ofwM
c , wSc , and wRod
c (see below). Thus, in analyzing the flicker data,we fixed wRod
c at the value determined from the flash data forhorizontal cells. (We also explored the effect of variation of theassumed wRod
c on the obtained wMc and wS
c .) In the fits, we con-strained wM
c and wSc to be positive by varying the value of wRod
c ifnecessary. Predictions from LNL model generally accounted forthe actual response data well (Fig. 5A). In the following, we showthat the shape of the nonlinearity derived from the LNL model isindependent of the strength of assumed rod input, when thestimuli are produced as a mixture of two primaries.
Static nonlinearity is independent of assumption aboutmagnitude of rod contributionWe show that, for any choice of wM, wS, and wRod and w,Rod, wecan find w,M and w,S, such that
C input # wMCM $ wSCS $ wRodCRod
# w,MCM $ w,SCS $ w,RodCRod, (C1)
with w,M and w,S independent of the color direction of the stimu-lus. This result means that the effect of varying the assumed rodweight may be compensated for perfectly by adjusting the M- andS-cone weights, so that the both the quality of the best fit to thedata and the parameters of the static nonlinearity are indepen-dent of the assumed rod weight.
We proceed by showing that, when the flicker stimulus is themixture of two primaries, we can express
CRod # qMCM $ qSCS (C2)
where qM and qS depend on the spectra of the primaries, thespectral sensitivities of the photoreceptors, and the backgroundbut not on the color direction of the flickering stimulus. UsingEquation C2, we rewrite
C input # wMCM $ wSCS $ wRodCRod
# wMCM $ wSCS $ wRod)qMCM $ qSCS*
# wMCM $ wSCS $ wRod)qMCM $ qSCS*
# )wM $ qMwRod*CM $ )wS $ qSwRod*CS
# )wM $ qMwRod & qMw,Rod*CM
$ )wS $ qSwRod & qSw,Rod*CS $ w,Rod
)qMCM $ qSCS*
# )wM $ qMwRod & qMw,Rod*CM
$ )wS $ qSwRod & qSw,Rod*CS $ w,RodCRod
# w,MCM $ w,SCS $ w,RodCRod . (C3)
This establishes Equation C1 from C2 with w,M & (wM ( qMwRod
# qMw,Rod) and w,S & (wS ( qMwRod # qSw,Rod).To show the Equations C2 holds, we note that, when flicker is
the mixture of two primaries (here green and blue), we can writeCM & vMG-PG ( vMB-PB and CS & vSG-PG ( vSB-PB, where-PG is the flicker amplitude of the green primary, -PB is theflicker amplitude of the blue primary, and the constants v areweights that specify how strongly modulating each primary af-fects the contrast seen by each type of cone. We can invert thistwo-by-two system of linear equations to obtain expressions forthe primary modulations in terms of the cone contrasts: -PG &vGMCM ( vGSCS and -PB & vBMCM ( vBSCS. Finally, the rodcontrast is also the weighted sum of the primary modulations, sowe have
CRod # vRodG-PG $ vRodB-PB
# vRodG)vGMCM $ vGSCS* $ vRodB)vBMCM $ vBSCS*
# )vRodGvGM $ vRodBvBM*CM $ )vRodGvGS $ vRodBvBS*CS .
(C4)
This is in the same form as Equation C2, with qM & (vRodGvGM (vRodBvBM) and qS & (vRodGvGS ( vRodBvBS).
ReferencesAhnelt PK, Kolb H (2000) The mammalian photoreceptor mosaic-adaptive
design. Prog Retin Eye Res 19:711–777.Ala-Laurila P, Donner K, Koskelainen A (2004) Thermal activation and
photoactivation of visual pigments. Biophys J 86:3653–3662.Applebury ML, Antoch MP, Baxter LC, Chun LL, Falk JD, Farhangfar F, Kage
K, Krzystolik MG, Lyass LA, Robbins JT (2000) The murine cone pho-toreceptor: a single cone type expresses both S and M opsins with retinalspatial patterning. Neuron 27:513–523.
Baylor DA, Nunn BJ, Schnapf JL (1987) Spectral sensitivity of cones of themonkey Macaca fascicularis. J Physiol (Lond) 390:145–160.
Bloomfield SA, Dacheux RF (2001) Rod vision: pathways and processing inthe mammalian retina. Prog Retin Eye Res 20:351–384.
Brainard DH (1996) Cone contrast and opponent modulation color spaces.In: Human color vision, Ed 2 (Kaiser PK, Boynton RM, eds). Washington,DC: Optical Society of America.
Brainard DH (1997) The psychophysics toolbox. Spat Vis 10:433– 436.Burns ME, Baylor DA (2001) Activation, deactivation, and adaptation in
vertebrate photoreceptor cells. Annu Rev Neurosci 24:779 – 805.
12360 • J. Neurosci., November 22, 2006 • 26(47):12351–12361 Yin et al. • Gradient in Horizontal and Ganglion Cell Responses

Calderone JB, Jacobs GH (1995) Regional variations in the relative sensitiv-ity to UV light in the mouse retina. Vis Neurosci 12:463– 468.
Calkins DJ, Sterling P (1999) Evidence that circuits for spatial and colorvision segregate at the first retinal synapse. Neuron 24:313–321.
Chatterjee S, Callaway EM (2002) S cone contributions to the magnocellu-lar visual pathway in macaque monkey. Neuron 35:1135–1146.
Chichilnisky EJ (2001) A simple white noise analysis of neuronal light re-sponses. Network 12:199 –213.
Chichilnisky EJ, Kalmar RS (2002) Functional asymmetries in ON and OFFganglion cells of primate retina. J Neurosci 22:2737–2747.
Cleland BG, Levick WR, Wassle H (1975) Physiological identification of amorphological class of cat retinal ganglion cells. J Physiol (Lond)248:151–171.
Dacey DM, Diller LC, Verweij J, Williams DR (2000) Physiology of L- andM-cone inputs to H1 horizontal cells in the primate retina. J Opt Soc AmA Opt Image Sci Vis 17:589 –596.
Deeb SS, Diller LC, Williams DR, Dacey DM (2000) Interindividual andtopographical variation of L:M cone ratios in monkey retinas. J Opt SocAm A Opt Image Sci Vis 17:538 –544.
Demb JB, Zaghloul K, Haarsma L, Sterling P (2001) Bipolar cells contributeto nonlinear spatial summation in the brisk-transient (Y) ganglion cell inmammalian retina. J Neurosci 21:7447–7454.
Demontis GC, Bisti S, Cervetto L (1993) Light sensitivity, adaptation andsaturation in mammalian rods. Prog Brain Res 95:15–24.
Dhingra NK, Kao YH, Sterling P, Smith RG (2003) Contrast threshold of abrisk-transient ganglion cell in vitro. J Neurophysiol 89:2360 –2369.
Diller L, Packer OS, Verweij J, McMahon MJ, Williams DR, Dacey DM(2004) L and M cone contributions to the midget and parasol ganglioncell receptive fields of macaque monkey retina. J Neurosci 24:1079 –1088.
Do-Nascimento JL, Do-Nascimento RS, Damasceno BA, Silveira LC (1991)The neurons of the retinal ganglion cell layer of the guinea pig: quantita-tive analysis of their distribution and size. Braz J Med Biol Res24:199 –214.
Dunn FA, Rieke F (2006) The impact of photoreceptor noise on retinal gaincontrols. Curr Opin Neurobiol 16:363–370.
Ekesten B, Gouras P (2005) Cone and rod inputs to murine retinal ganglioncells: evidence of cone opsin specific channels. Vis Neurosci 22:893–903.
Ekesten B, Gouras P, Yamamoto S (2000) Cone inputs to murine retinalganglion cells. Vision Res 40:2573–2577.
Govardovskii VI, Fyhrquist N, Reuter T, Kuzmin DG, Donner K (2000) Insearch of the visual pigment template. Vis Neurosci 17:509 –528.
Grant S, Patel NN, Philp AR, Grey CN, Lucas RD, Foster RG, Bowmaker JK,Jeffery G (2001) Rod photopigment deficits in albinos are specific tomammals and arise during retinal development. Vis Neurosci18:245–251.
Hack I, Peichl L (1999) Horizontal cells of the rabbit retina are non-selectively connected to the cones. Eur J Neurosci 11:2261–2274.
Haverkamp S, Wassle H, Duebel J, Kuner T, Augustine GJ, Feng G, Euler T(2005) The primordial, blue-cone color system of the mouse retina.J Neurosci 25:5438 –5445.
Horwitz GD, Chichilnisky EJ, Albright TD (2005) Blue-yellow signals areenhanced by spatiotemporal luminance contrast in macaque V1. J Neu-rophysiol 93:2263–2278.
Ilia M, Jeffery G (2000) Retinal cell addition and rod production depend onearly stages of ocular melanin synthesis. J Comp Neurol 420:437– 444.
Jacobs GH (1993) The distribution and nature of colour vision among themammals. Biol Rev Camb Philos Soc 68:413– 471.
Jacobs GH, Deegan II JF (1994) Spectral sensitivity, photopigments, andcolor vision in the guinea pig (Cavia porcellus). Behav Neurosci108:993–1004.
Jeffery G, Brem G, Montoliu L (1997) Correction of retinal abnormalitiesfound in albinism by introduction of a functional tyrosinase gene in trans-genic mice and rabbits. Brain Res Dev Brain Res 99:95–102.
Johnson EN, Hawken MJ, Shapley R (2004) Cone inputs in macaque pri-mary visual cortex. J Neurophysiol 91:2501–2514.
Jusuf PR, Martin PR, Grunert U (2006) Random wiring in the midget path-way of primate retina. J Neurosci 26:3908 –3917.
Merigan WH, Maunsell JH (1990) Macaque vision after magnocellular lat-eral geniculate lesions. Vis Neurosci 5:347–352.
Merigan WH, Maunsell JH (1993) How parallel are the primate visual path-ways? Annu Rev Neurosci 16:369 – 402.
Nakatani K, Tamura T, Yau KW (1991) Light adaptation in retinal rods ofthe rabbit and two other nonprimate mammals. J Gen Physiol97:413– 435.
Nikonov SS, Daniele LL, Zhu X, Craft CM, Swaroop A, Pugh Jr EN (2005)Photoreceptors of Nrl#/# mice coexpress functional S- and M-coneopsins having distinct inactivation mechanisms. J Gen Physiol125:287–304.
Nikonov SS, Kholodenko R, Lem J, Pugh Jr EN (2006) Physiological fea-tures of the S- and M-cone photoreceptors of wild-type mice from single-cell recordings. J Gen Physiol 127:359 –374.
Osorio D, Vorobyev M (2005) Photoreceptor spectral sensitivities in terres-trial animals: adaptations for luminance and colour vision. Proc Biol Sci272:1745–1752.
Parry JW, Bowmaker JK (2002) Visual pigment coexpression in Guinea pigcones: a microspectrophotometric study. Invest Ophthalmol Vis Sci43:1662–1665.
Parry JW, Poopalasundaram S, Bowmaker JK, Hunt DM (2004) A novelamino acid substitution is responsible for spectral tuning in a rodentviolet-sensitive visual pigment. Biochemistry 43:8014 – 8020.
Peichl L (2005) Diversity of mammalian photoreceptor properties: adapta-tions to habitat and lifestyle? Anat Rec A Discov Mol Cell Evol Biol287:1001–1012.
Peichl L, Gonzalez-Soriano J (1994) Morphological types of horizontal cellin rodent retinae: a comparison of rat, mouse, gerbil, and guinea pig. VisNeurosci 11:501–517.
Pelli DG (1997) The VideoToolbox software for visual psychophysics:transforming numbers into movies. Spat Vis 10:437– 442.
Rieke F, Baylor DA (2000) Origin and functional impact of dark noise inretinal cones. Neuron 26:181–186.
Rohlich P, van Veen T, Szel A (1994) Two different visual pigments in oneretinal cone cell. Neuron 13:1159 –1166.
Sampath AP, Baylor DA (2002) Molecular mechanism of spontaneous pig-ment activation in retinal cones. Biophys J 83:184 –193.
Sandmann D, Boycott BB, Peichl L (1996) Blue-cone horizontal cells in theretinae of horses and other equidae. J Neurosci 16:3381–3396.
Schneeweis DM, Schnapf JL (1999) The photovoltage of macaque conephotoreceptors: adaptation, noise, and kinetics. J Neurosci 19:1203–1216.
Sharpe LT, Stockman A (1999) Rod pathways: the importance of seeingnothing. Trends Neurosci 22:497–504.
Silveira LC, Saito CA, Lee BB, Kremers J, da Silva Filho M, Kilavik BE, YamadaES, Perry VH (2004) Morphology and physiology of primate M- andP-cells. Prog Brain Res 144:21– 46.
Smith VC, Pokorny J, Lee BB, Dacey DM (2001) Primate horizontal celldynamics: an analysis of sensitivity regulation in the outer retina. J Neu-rophysiol 85:545–558.
Sterling P (2004) How retinal circuits optimize the transfer of visual infor-mation. In: Visual neurosciences (Chalupa LM, Werner JS, eds), pp 234 –259. Cambridge, MA: MIT.
Szel A, Lukats A, Fekete T, Szepessy Z, Rohlich P (2000) Photoreceptordistribution in the retinas of subprimate mammals. J Opt Soc Am A OptImage Sci Vis 17:568 –579.
Tamura T, Nakatani K, Yau KW (1989) Light adaptation in cat retinal rods.Science 245:755–758.
Vingrys AJ, Bui BV (2001) Development of postreceptoral function in pig-mented and albino guinea pigs. Vis Neurosci 18:605– 613.
Zaghloul KA, Boahen K, Demb JB (2003) Different circuits for ON and OFFretinal ganglion cells cause different contrast sensitivities. J Neurosci 23:2645–2654.
Yin et al. • Gradient in Horizontal and Ganglion Cell Responses J. Neurosci., November 22, 2006 • 26(47):12351–12361 • 12361