Embed Size (px)
Citation preview

Christopher Anderson @ ISU
Excessive spring rain will be more
frequent (except this year). Will it be
more manageable?
Christopher J. Anderson, PhD
89th Annual Soil Management and Land Valuation Conference
May 18, 2016
https://twitter.com/cjamesISU
Today’s Topics
• Near-term Management: Summer Drought
• Long-term Management: Rainfall Trend
and Yield Effects
• Field Management: Limitations
• Solutions

El Niño provides predictability
during December through April
NOAA NESDIS:
http://www.ospo.noaa.gov/Products/ocean/sst/anomaly/index.html
El Niño
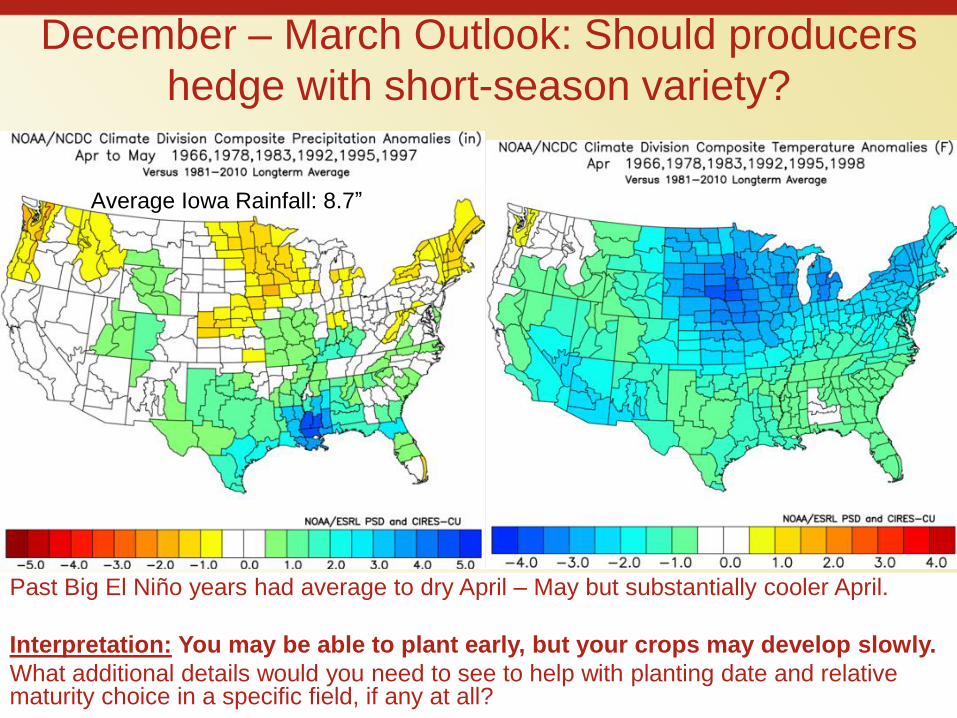
December – March Outlook: Should producers
hedge with short-season variety?
Past Big El Niño years had average to dry April – May but substantially cooler April.
Interpretation: You may be able to plant early, but your crops may develop slowly.
What additional details would you need to see to help with planting date and relative maturity choice in a specific field, if any at all?
Average Iowa Rainfall: 8.7”

April Reality: Dry except NW IA
Composite April Rainfall of transition
El Nino yearsApril 2016 Rainfall
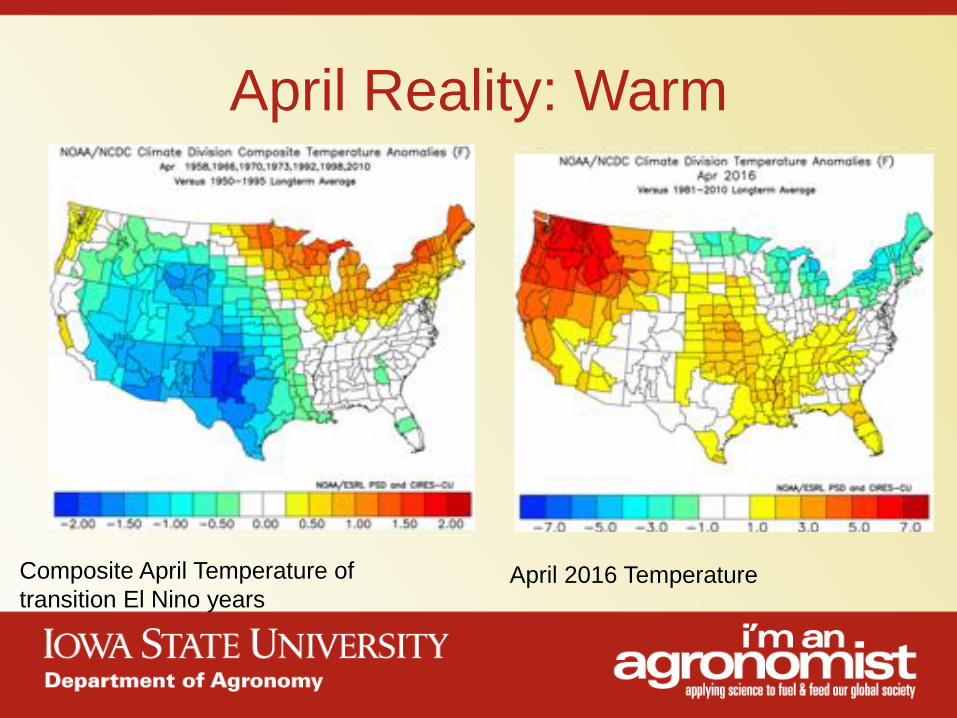
April Reality: Warm
Composite April Temperature of
transition El Nino yearsApril 2016 Temperature

Likelihood of Summer Drought is 39%
Blue bars indicate probability for La Niña in June-July-August (JJA) or July-
August-September (JAS). Drought is 60% likely during La Niña.
65% times 60% equals 39%.
IRI Columbia, http://iri.columbia.edu/our-expertise/climate/forecasts/enso/current/
65%
52%

Yield during past El Niño transitions
Year 1958 1966 1970 1973 1992 1998 2010 AVG
Soybean
Yield
110% 105% 104% 102% 116% 105% 103% 107%
Corn Yield 121% 113% 95% 108% 128% 115% 95% 110%
Spring 2016 is a brief reprieve
from the longer trend of
increasing Spring rainfall

Weird Spring-Summer Rainfall Combinations
are much more frequent
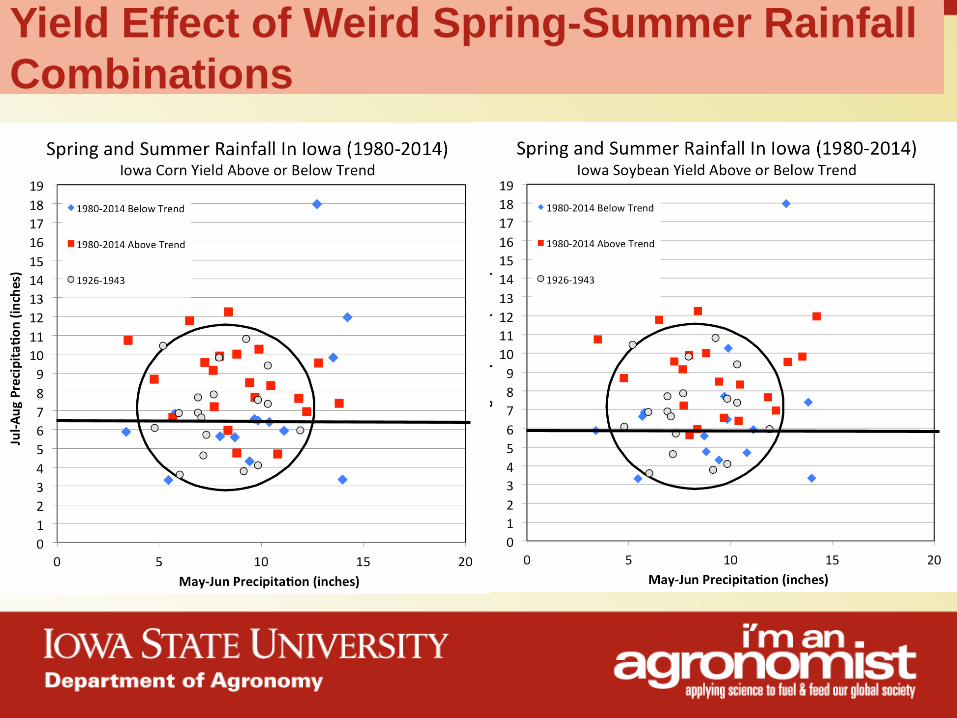
Yield Effect of Weird Spring-Summer Rainfall
Combinations

HOW WARM ATLANTIC OCEAN AND
MIDWEST RAINFALL ARE LINKED
ISU Masters of Agronomy Program, 2015
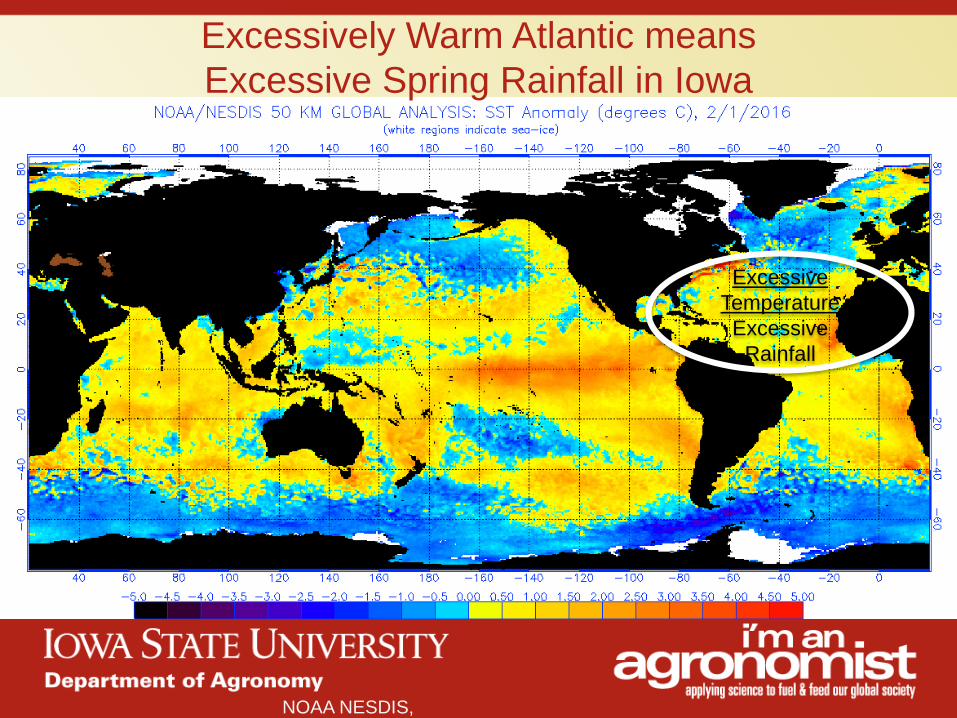
Excessively Warm Atlantic means
Excessive Spring Rainfall in Iowa
NOAA NESDIS,
http://www.ospo.noaa.gov/Products/ocean/sst/anomaly/index.html
Excessive
Temperature
Excessive
Rainfall

Trend Extrapolation based on Climate
Indicators Rather than Calendar Date
2020 - 2045

Yield Data Model Evaluation:
Corn Yield Prediction Within Training Period
Shows No Bias and Small Error

Yield Data Model Evaluation:
Soybean Yield Prediction Within Training Period
Shows Errors from Aphids and Early Planting
2003
Aphids
1994, 2005
Early Plant

NW Iowa + DSM Lobe Yield Effects
165
170
175
180
185
190
195
Current WeatherTrend1980-2012Excluded
WeatherTrend2016-2035Included
DryJune WetJuly DryJune&WetJuly
CornYieldbasedon2012TechnologyandYieldEffectsfromWeatherTrendandSoilEngineeringNorthwestIowa+DesMoinesLobe
47
48
49
50
51
52
53
54
55
56
Current WeatherTrend1980-2012Excluded
WeatherTrend2016-2035Included
DryJune WetJuly DryJune&WetJuly
BeanYieldbasedon2012TechnologyandYieldEffectsfromWeatherTrendandSoilEngineeringNorthwestIowa+DesMoinesLobe
Black minus Gray is
Yield Change from
May – Jun Rainfall
Change
Blue minus Black is
Yield Change from
weather trend to
2035
Yellow minus Black is
Yield Change from
soil engineering
-1% 0%
+4%+5%
+11%
-2%0%
+5%
+2%
+8%
140
145
150
155
160
165
170
175
Current WeatherTrend1980-2012Excluded
WeatherTrend2016-2035Included
DryJune WetJuly DryJune&WetJuly
CornYieldbasedon2012TechnologyandYieldEffectsfromWeatherTrendandSoilEngineeringSouthIowa
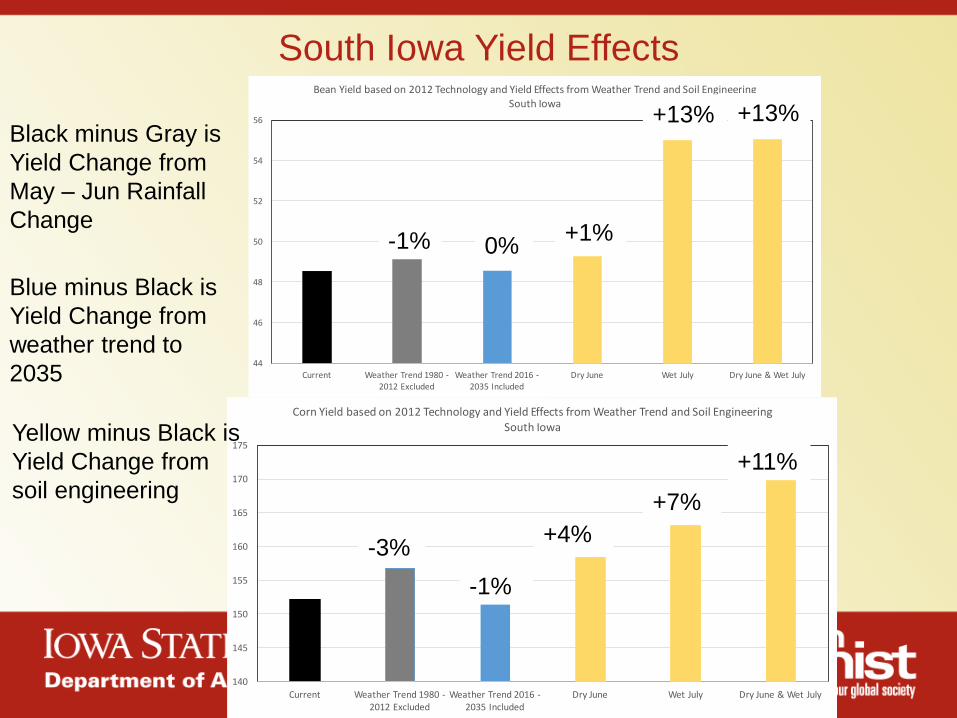
South Iowa Yield Effects
44
46
48
50
52
54
56
Current WeatherTrend1980-2012Excluded
WeatherTrend2016-2035Included
DryJune WetJuly DryJune&WetJuly
BeanYieldbasedon2012TechnologyandYieldEffectsfromWeatherTrendandSoilEngineeringSouthIowa
-1% 0%+1%
+13% +13%
-3%
-1%
+4%
+7%
+11%
Black minus Gray is
Yield Change from
May – Jun Rainfall
Change
Blue minus Black is
Yield Change from
weather trend to
2035
Yellow minus Black is
Yield Change from
soil engineering
165
170
175
180
185
190
195
Current WeatherTrend1980-2012Excluded
WeatherTrend2016-2035Included
DryJune WetJuly DryJune&WetJuly
CornYieldbasedon2012TechnologyandYieldEffectsfromWeatherTrendandSoilEngineeringEastIowa
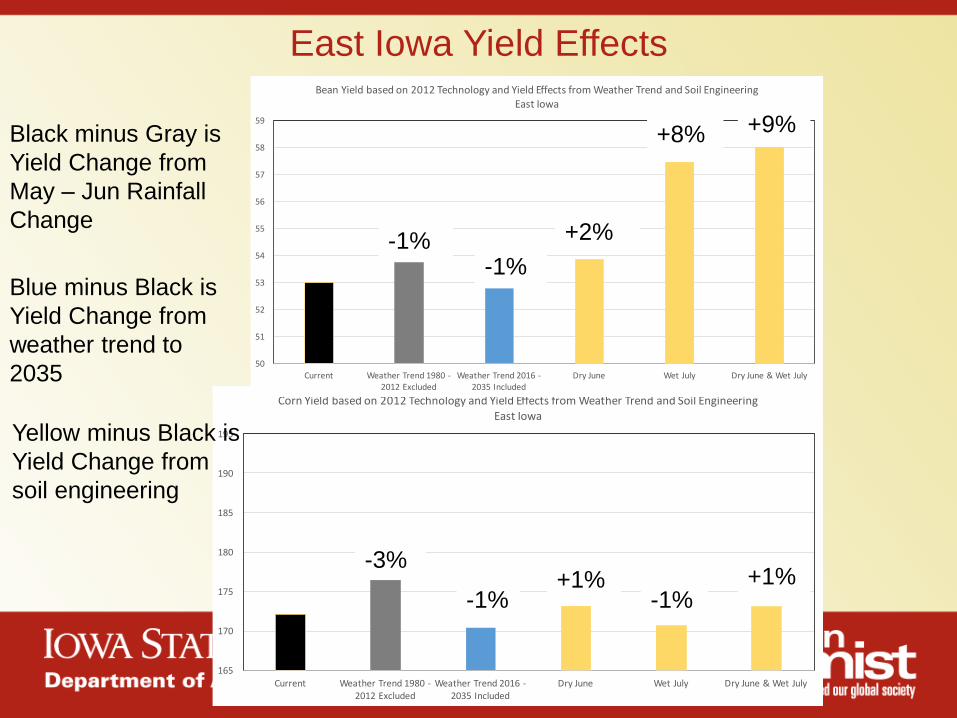
East Iowa Yield Effects
50
51
52
53
54
55
56
57
58
59
Current WeatherTrend1980-2012Excluded
WeatherTrend2016-2035Included
DryJune WetJuly DryJune&WetJuly
BeanYieldbasedon2012TechnologyandYieldEffectsfromWeatherTrendandSoilEngineeringEastIowa
-1%-1%
+2%
+8% +9%
-3%
-1%+1%
-1%+1%
Black minus Gray is
Yield Change from
May – Jun Rainfall
Change
Blue minus Black is
Yield Change from
weather trend to
2035
Yellow minus Black is
Yield Change from
soil engineering
Will the rainfall be more
manageable?
Farmers already have the tools
they need
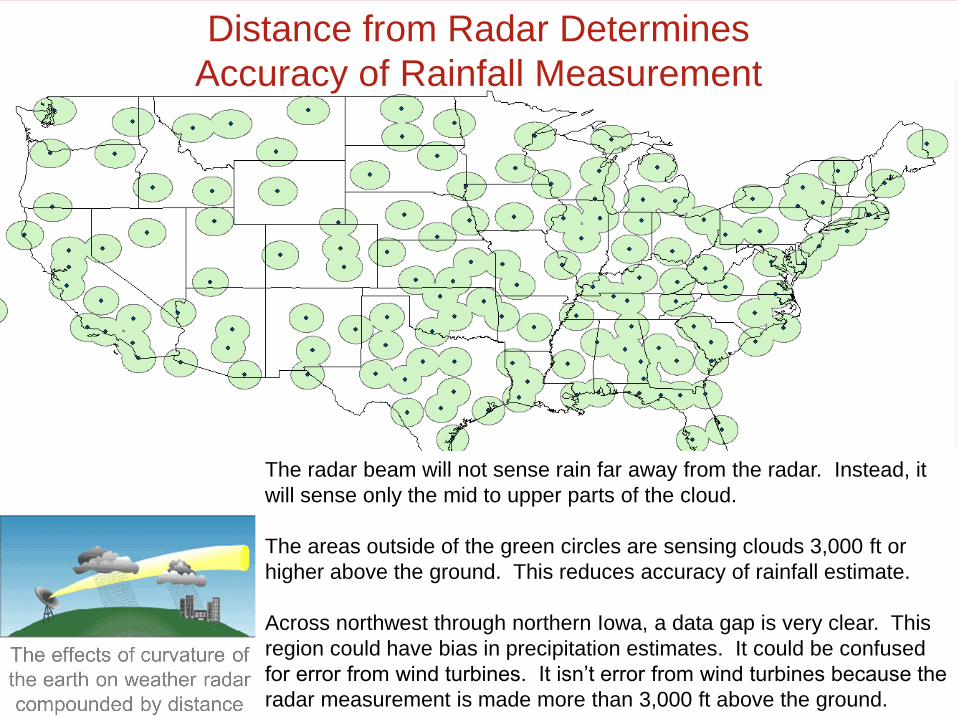
Distance from Radar Determines
Accuracy of Rainfall Measurement
The radar beam will not sense rain far away from the radar. Instead, it
will sense only the mid to upper parts of the cloud.
The areas outside of the green circles are sensing clouds 3,000 ft or
higher above the ground. This reduces accuracy of rainfall estimate.
Across northwest through northern Iowa, a data gap is very clear. This
region could have bias in precipitation estimates. It could be confused
for error from wind turbines. It isn’t error from wind turbines because the
radar measurement is made more than 3,000 ft above the ground.
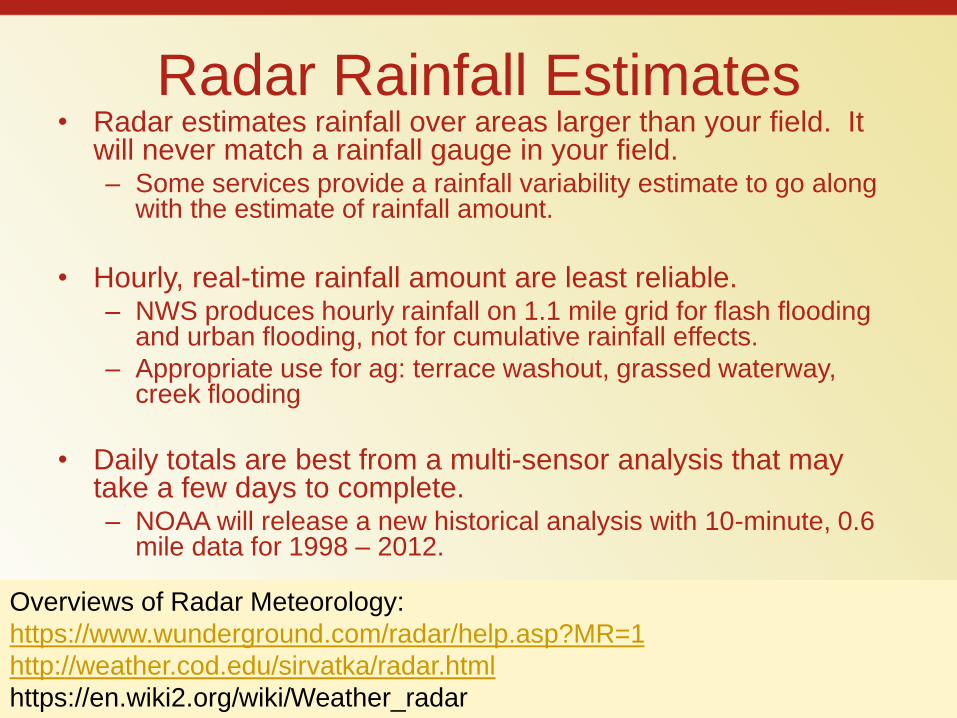
Radar Rainfall Estimates• Radar estimates rainfall over areas larger than your field. It
will never match a rainfall gauge in your field.– Some services provide a rainfall variability estimate to go along
with the estimate of rainfall amount.
• Hourly, real-time rainfall amount are least reliable.– NWS produces hourly rainfall on 1.1 mile grid for flash flooding
and urban flooding, not for cumulative rainfall effects.
– Appropriate use for ag: terrace washout, grassed waterway, creek flooding
• Daily totals are best from a multi-sensor analysis that may take a few days to complete.– NOAA will release a new historical analysis with 10-minute, 0.6
mile data for 1998 – 2012.
Overviews of Radar Meteorology:
https://www.wunderground.com/radar/help.asp?MR=1
http://weather.cod.edu/sirvatka/radar.html
https://en.wiki2.org/wiki/Weather_radar
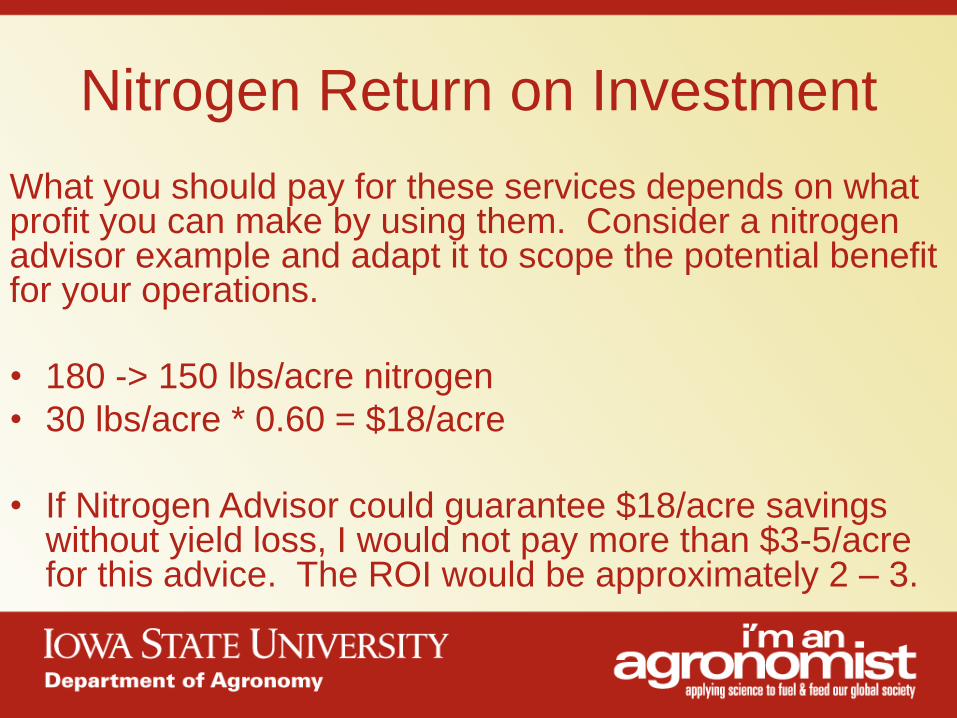
Nitrogen Return on Investment
What you should pay for these services depends on what profit you can make by using them. Consider a nitrogen advisor example and adapt it to scope the potential benefit for your operations.
• 180 -> 150 lbs/acre nitrogen
• 30 lbs/acre * 0.60 = $18/acre
• If Nitrogen Advisor could guarantee $18/acre savings without yield loss, I would not pay more than $3-5/acre for this advice. The ROI would be approximately 2 – 3.

Field Trafficability ROI
• Consider a field that is 35 miles away, which means a 70 mile round trip to scout for excessive wetness, pests, etc.
• 70 miles @ 15 mpg * $2.00 per gallon is $10.66.
• If Field Trafficability Advisor could guarantee $10.66 savings per 100 acre field, then you would need to avoid 10 trips per year to make your money back at $1/acre. I would not pay more than $1/acre for this advice. For prices below $1/acre, the ROI would be approximately 2 – 3.
Before Considering These Services
• Go through the decisions/actions that could use
weather and agronomic advisors.
• Determine potential savings/benefits for each
decision/action and get a rough ROI for
different levels of cost per acre for the advisor
services.
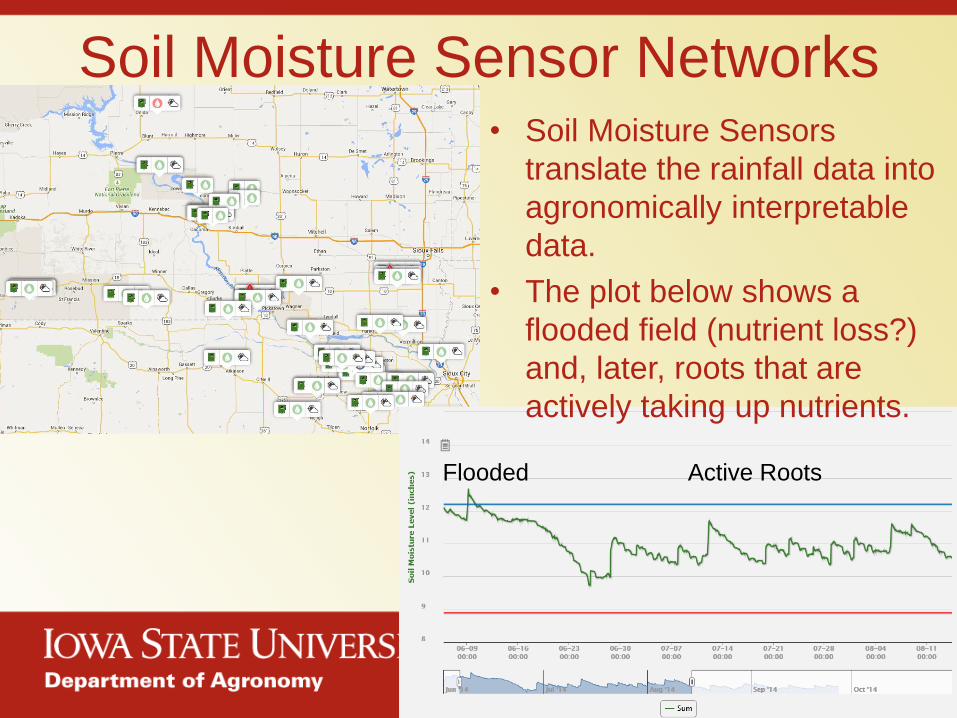
Soil Moisture Sensor Networks
Flooded Active Roots
• Soil Moisture Sensors
translate the rainfall data into
agronomically interpretable
data.
• The plot below shows a
flooded field (nutrient loss?)
and, later, roots that are
actively taking up nutrients.

Who do you ask for guidance when no one
has experienced this level of risk?Webster City Illustration of Nitrogen Risk Deficiency Probability Current probability of nitrogen deficiency is highest on record dating to 1893.
http://www.isafarmnet.com
Select “Nitrogen Deficiency Tool’
• Iowa Soybean On-Farm Network®
nitrogen strip trial data (2006 – 2014)
used to develop probability model for
corn stalk nitrogen deficiency test
given May – June rainfall. Higher
probability means higher likelihood of
test results being classified as deficient
nitrogen status.
• Probability model used to simulate
historical years 1893 – 2005, using
weather data from Webster City.
• 10-yr moving average for 5 nutrient
practices for Corn following Soybean
(C-S) at median application rate from
survey of growers participating in strip
trials.
Highest
probability
on record
Fall AA: Fall Anhydrous Ammonia; Fall SM: Fall Swine Manure
Spring AA: Spring Anhydrous Ammonia; Spring SD: Spring
Side Dress

+
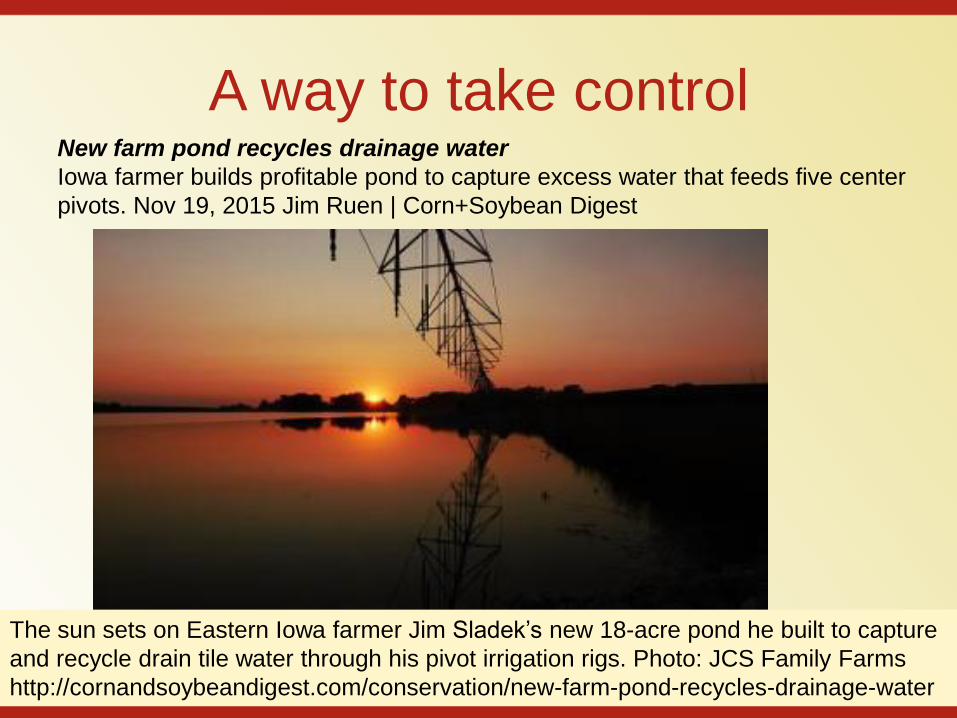
A way to take controlNew farm pond recycles drainage water
Iowa farmer builds profitable pond to capture excess water that feeds five center
pivots. Nov 19, 2015 Jim Ruen | Corn+Soybean Digest
The sun sets on Eastern Iowa farmer Jim Sladek’s new 18-acre pond he built to capture
and recycle drain tile water through his pivot irrigation rigs. Photo: JCS Family Farms
http://cornandsoybeandigest.com/conservation/new-farm-pond-recycles-drainage-water
Rainfall will continue to increase in
Spring. Will it be manageable?• Climate trend through 2045 means odds favor increase in
humidity and spring rainfall resulting in– 10-15% reduction in suitable field work days
– 4-5% corn yield reduction and 1-2% soybean yield reduction since mid 1990s
• Additional spring rainfall would be supportive of higher corn plant density.
• Additional protection of the soil and soil surface is needed today.
• Intensive water management could produce yield increase larger than climate trend yield decrease