Embed Size (px)
Citation preview
2016 MRL Harmonization Workshop California Specialty Crops Council
June 2, 2016
Chris A. Sack, Residue Expert Food and Drug Administration
The FDA Pesticide Residue Program
To foster a positive regulatory environment focusing on pest management and stewardship that supports the success of CSCC growers
CSCC Mission

The FDA Pesticide Residue Program
Mission - Promote and protect the health of the American consumer
Objective (Pesticide Program) - Enforce the MRLs established by EPA
FDA Mission and Objective
The FDA Pesticide Residue Program
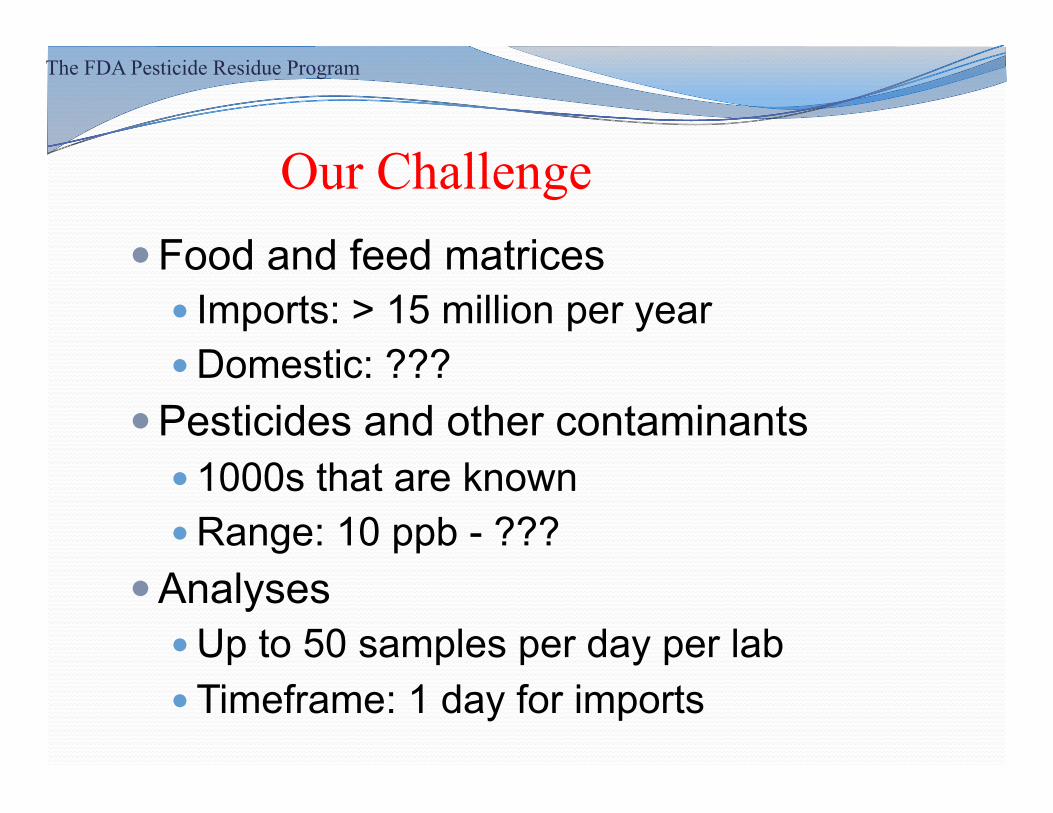
! Food and feed matrices ! Imports: > 15 million per year ! Domestic: ???
! Pesticides and other contaminants ! 1000s that are known ! Range: 10 ppb - ???
! Analyses ! Up to 50 samples per day per lab ! Timeframe: 1 day for imports
Our Challenge
The FDA Pesticide Residue Program
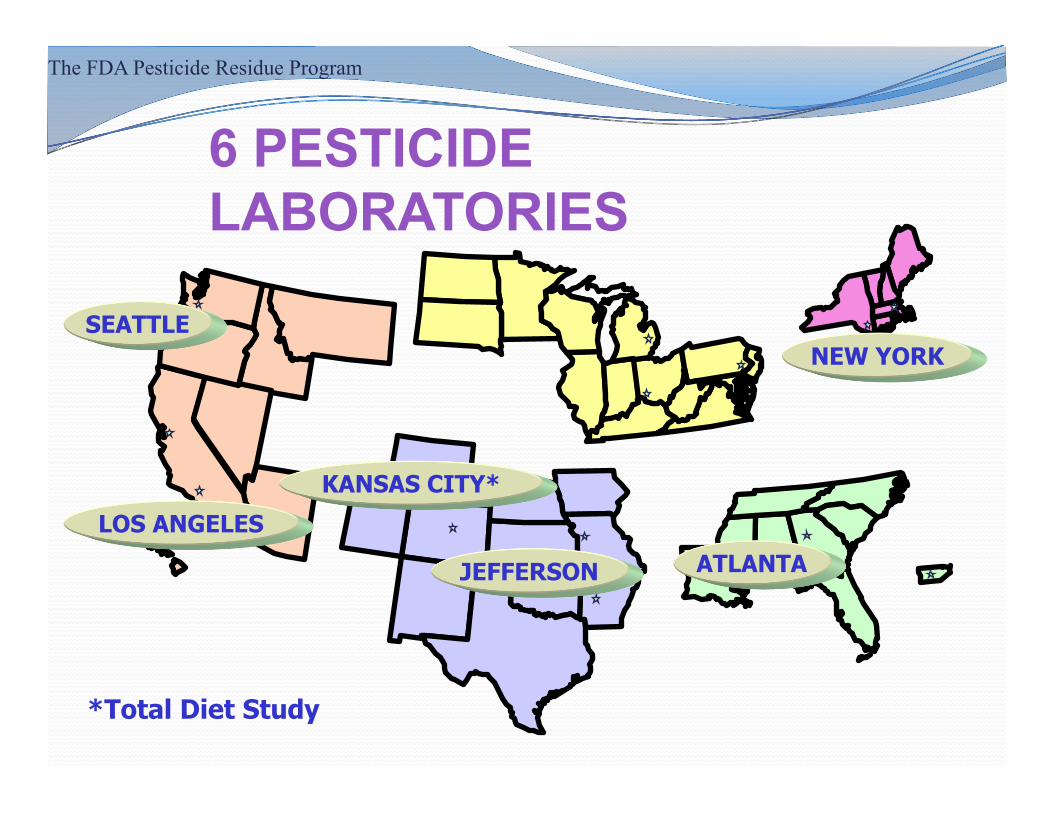
6 PESTICIDE LABORATORIES
SEATTLE
LOS ANGELES
JEFFERSON
NEW YORK
ATLANTA
KANSAS CITY*
*Total Diet Study

The FDA Pesticide Residue Program
! Regulatory Monitoring
! Special Assignments
! Total Diet Study
Three-fold Approach

The FDA Pesticide Residue Program
! Sample types: ! Raw agricultural products ! Processed foods (limited) ! Spices/botanicals ! Animal feeds ! ???
! Samples per year: 5000 – 8000 ! Matrices per year: ~ 1000
Regulatory Monitoring

The FDA Pesticide Residue Program
! Sample collection – primarily targeted ! Violation history ! State/USDA monitoring reports ! Pesticide usage reports ! Dietary significance ! Toxicity ! Origin ! Foreign office reports
! Random
Regulatory Monitoring

Pesticide Multiresidue Method (MRM)
QuEChERS Extraction
dSPE Cleanup
LC-QQQ (>220)
dSPE Cleanup
GC-QQQ (>210)
GCFS (>800)
The FDA Pesticide Residue Program
> 220 different pesticides found per year
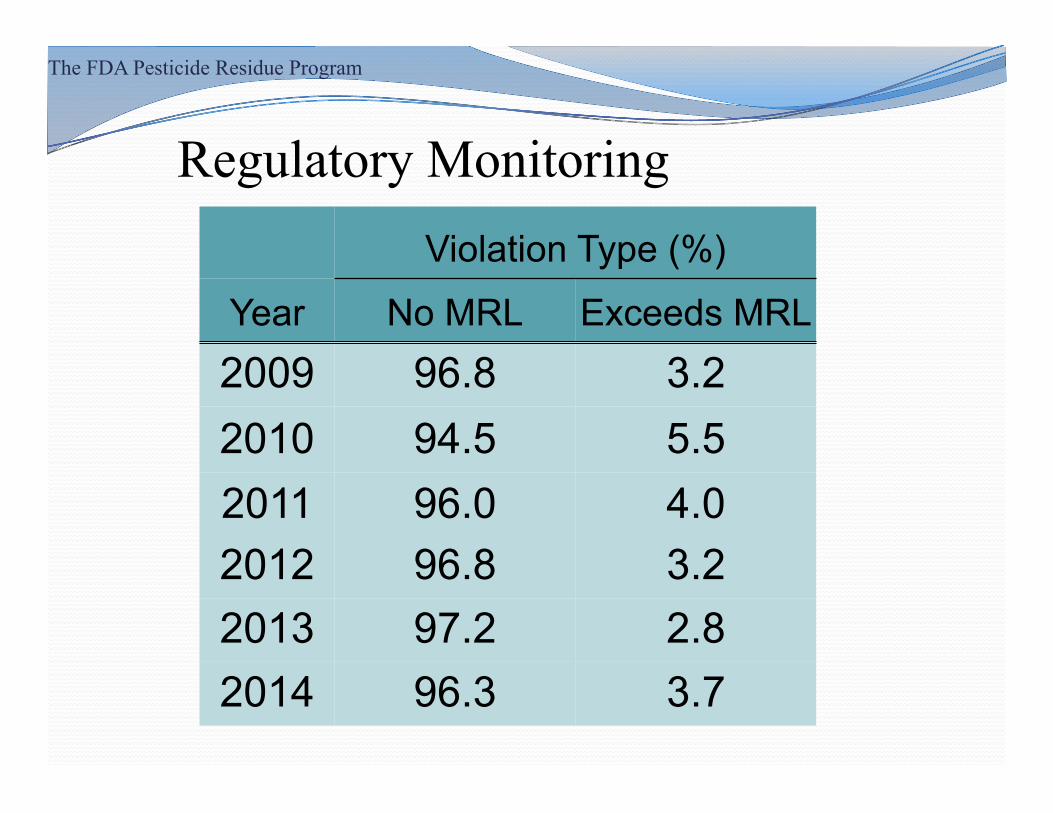
Regulatory Monitoring Violation Type (%)
Year No MRL Exceeds MRL 2009 96.8 3.2 2010 94.5 5.5 2011 96.0 4.0 2012 96.8 3.2 2013 97.2 2.8 2014 96.3 3.7
The FDA Pesticide Residue Program

Regulatory Monitoring
The FDA Pesticide Residue Program
Violation Rate (%) - Domestic Vs. Import
1.4 1.9 1.6 2.8 2.8
1.5
4.0 4.9
7.1
11.1 12.6
11.7
0
4
8
12
16
2009 2010 2011 2012 2013 2014
% V
iola
tive
Year
US Imports

Regulatory Monitoring
Carbendazim Buprofezin Prochloraz
Tricyclazole Pirimiphos methyl Imidacloprid
Chlorpyrifos Procymidone Tebuconazole
Permethrin Thiophanate-methyl Difenoconazole
Triazophos Cypermethrin Acetamiprid
Ethion Lambda-cyhalothrin Monocrotophos
Profenofos Pyrimethanil Isoprothiolane
Most commonly found violative residues (2010–13)
The FDA Pesticide Residue Program

The FDA Pesticide Residue Program
Special Assignments in 2016 ! Glyphosate and Glufosinate in Corn,
Soybean, Milk and Eggs ! Samples: corn & soy (300 each), milk & eggs
(120 each) ! Residues found thru April
! No residues found in 51 milk and 81 egg samples ! No violative levels of glyphosate and glufosinate
Commodity Spls Glyphosate Glufosinate
Corn 52 23 (0.002-0.117) 3 (0.002-0.006)
Soybean 44 34 (0.005-9.24) 3 (0.005-0.172)

The FDA Pesticide Residue Program
Special Assignments in 2016 ! Acid Herbicides in Selected Commodities
! Samples > 1300 grains and root crops ! Grains: barley, corn, oats, soybean, wheat, rice ! Root crops: potato, sweet potato, turnip, radish,
peanut, carrot ! Residues tested: 35 acid herbicides
2,4-D Mecoprop Aminopyralid Acifluorfen Diflufenzopyr
2,4,5-T Fenoprop Clopyralid Imazamethabenz Fluroxypyr
2,4,5-TB 2,3,6-TBA Picloram Imazamox Triclopyr
2,4-DB 2,4,5-TBA Dichlorprop Imazapic Bromoxynil
4-CPA Chloramben Diclofop Imazapyr Dalapon
MCPA Dicamba Haloxyfop Imazaquin Pentachlorophenol
MCPB Quinclorac Quizalofop Imazethapyr Aminocyclopyrachlor
The FDA Pesticide Residue Program
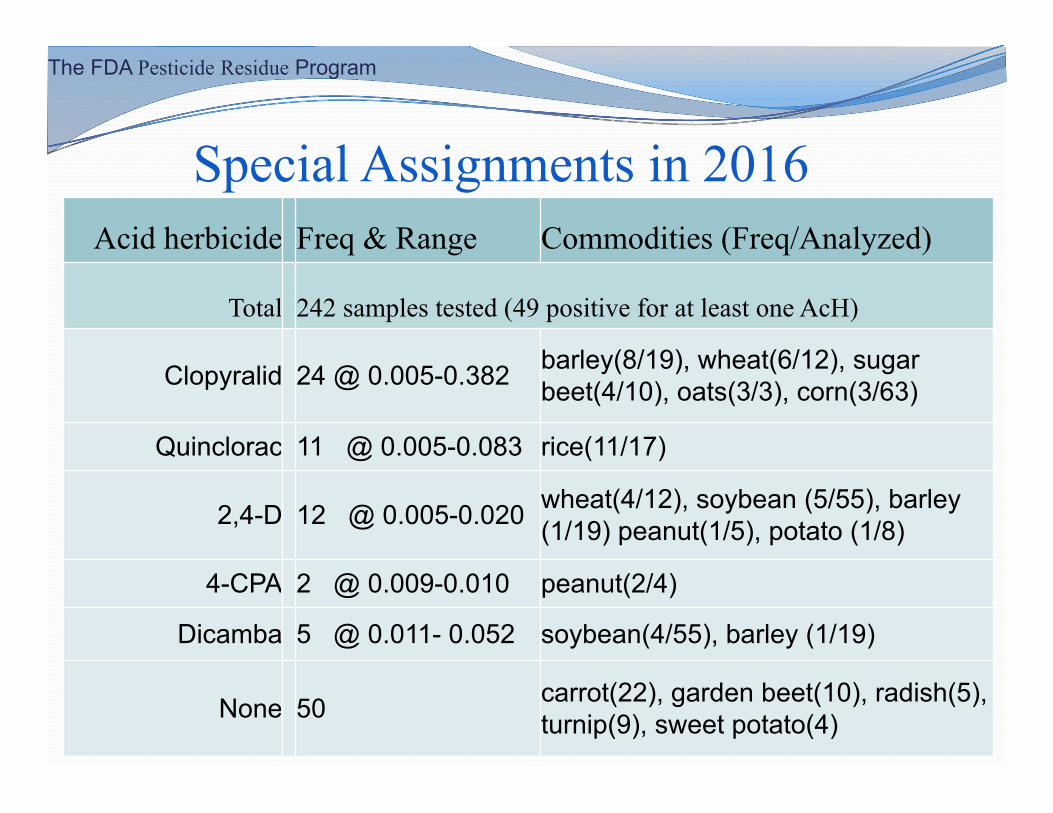
Special Assignments in 2016 Acid herbicide Freq & Range Commodities (Freq/Analyzed)
Total 242 samples tested (49 positive for at least one AcH)
Clopyralid 24 @ 0.005-0.382 barley(8/19), wheat(6/12), sugar beet(4/10), oats(3/3), corn(3/63)
Quinclorac 11 @ 0.005-0.083 rice(11/17)
2,4-D 12 @ 0.005-0.020 wheat(4/12), soybean (5/55), barley (1/19) peanut(1/5), potato (1/8)
4-CPA 2 @ 0.009-0.010 peanut(2/4)
Dicamba 5 @ 0.011- 0.052 soybean(4/55), barley (1/19)
None 50 carrot(22), garden beet(10), radish(5), turnip(9), sweet potato(4)

! Definition: Analysis of “table-ready” foods for ultra-trace (0.1 ppb) residues
! Objectives: ! Monitor contaminants and nutrients ! Assess contaminant/nutrient trends and risk ! Estimate exposures
Total Diet Study
The FDA Pesticide Residue Program
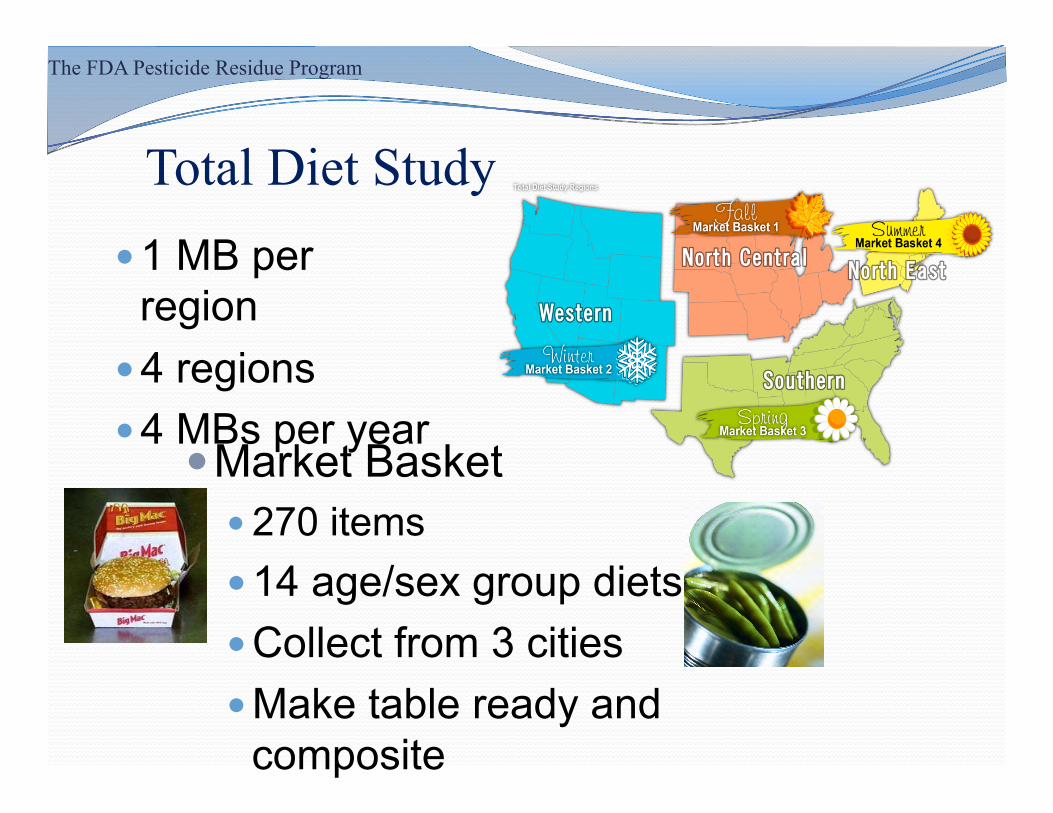
! 1 MB per region
! 4 regions ! 4 MBs per year
Total Diet Study
The FDA Pesticide Residue Program
! Market Basket ! 270 items ! 14 age/sex group diets ! Collect from 3 cities ! Make table ready and
composite
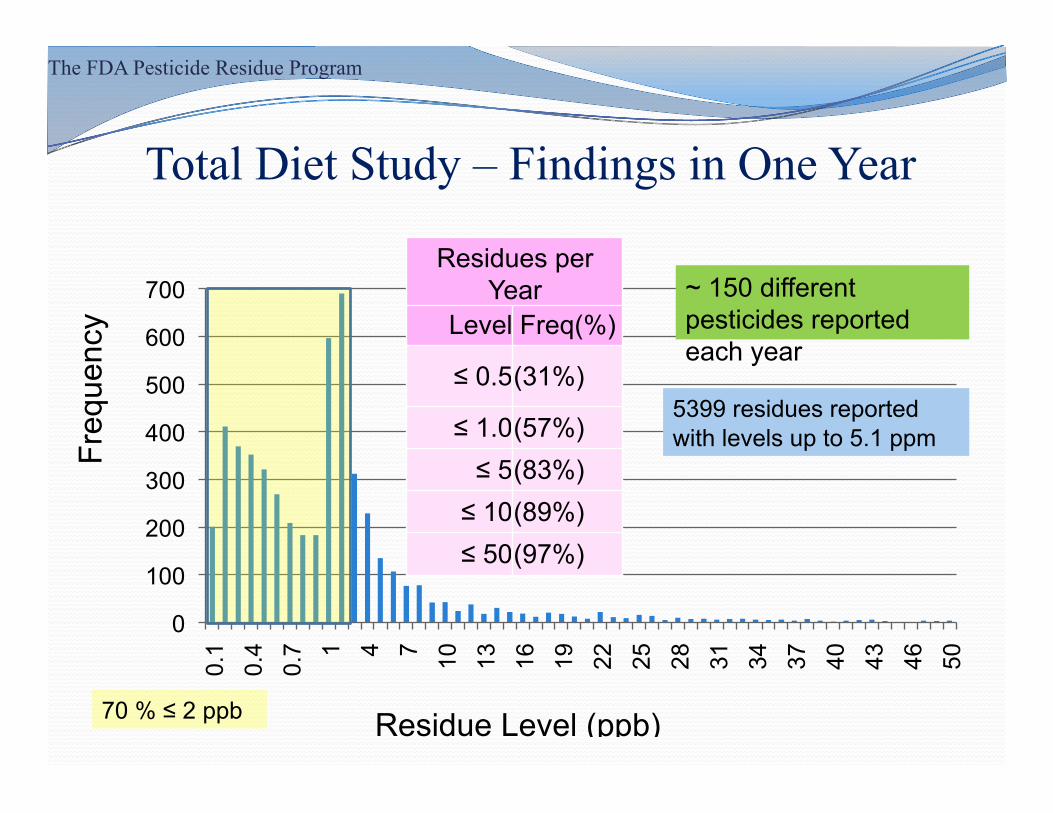
Total Diet Study – Findings in One Year
The FDA Pesticide Residue Program
0
100
200
300
400
500
600
700
0.1
0.4
0.7 1 4 7 10
13
16
19
22
25
28
31
34
37
40
43
46
50
Residue Level (ppb)
Freq
uenc
y
Residues per Year
Level Freq(%)
≤ 0.5 (31%)
≤ 1.0 (57%) ≤ 5 (83%) ≤ 10 (89%) ≤ 50 (97%)
~ 150 different pesticides reported each year
5399 residues reported with levels up to 5.1 ppm
70 % ≤ 2 ppb

THPI 48 Endosulfan II 7 Hexythiazox 2 Piperonyl butoxide 45 Thiamethoxam 7 Spiromesifen 1 Flonicamid 32 Malathion 7 Spinetoram 1 Cyprodinil 26 Acetamiprid 6 Fenbutatin oxide 0.9 Boscalid 26 Quinoxyfen 4 Thiophanate-methyl 0.8
Fludioxonil 19 Endosulfan sulfate 4 Methoxyfenozide 0.7
Novaluron 18 Carbendazim 4 Chlorantraniliprole 0.4 Fenhexamid 17 Endosulfan I 4 Cyflufenamid 0.4 Pyrimethanil 17 Myclobutanil 4 Metalaxyl 0.4 Fenpropathrin 16 Fenpyroximate 3 Clothianidin 0.3 Bifenthrin 16 Bifenazate 2 Azoxystrobin 0.2 Pyraclostrobin 13 Dichlorvos 2
35 residues in strawberries (ppb)
The FDA Pesticide Residue Program
Total Diet Study - Findings
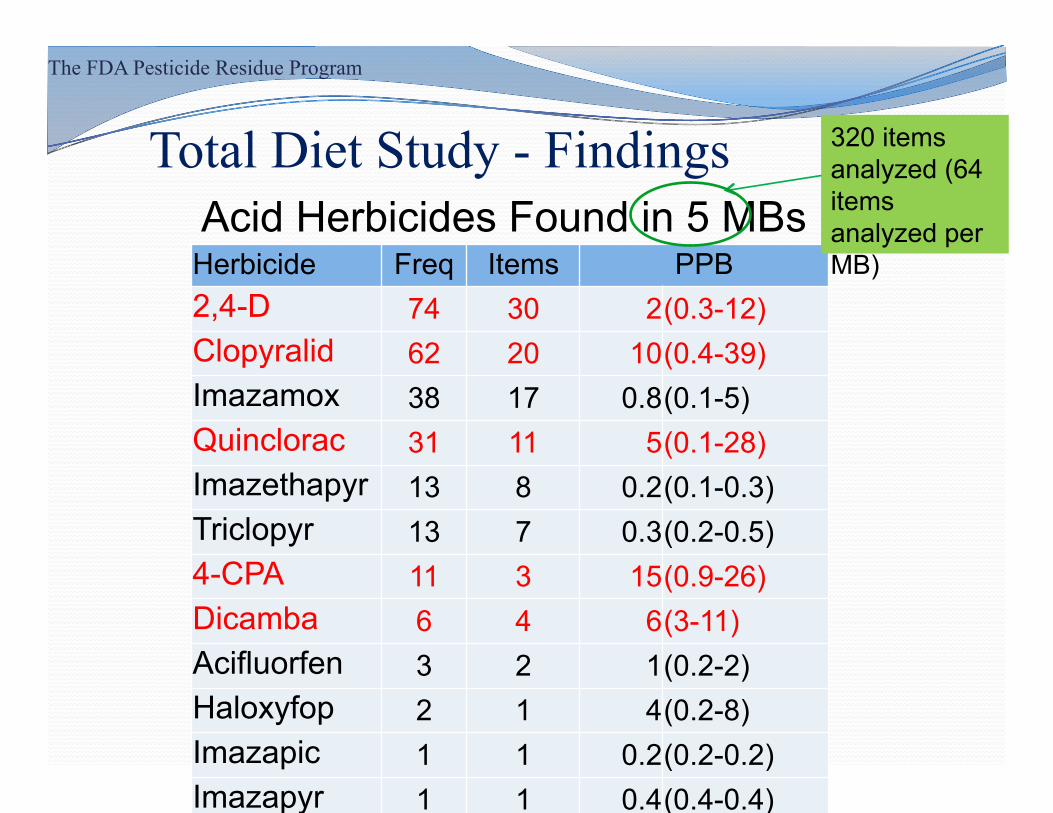
Acid Herbicides Found in 5 MBs Total Diet Study - Findings
The FDA Pesticide Residue Program
Herbicide Freq Items PPB 2,4-D 74 30 2 (0.3-12) Clopyralid 62 20 10 (0.4-39) Imazamox 38 17 0.8 (0.1-5) Quinclorac 31 11 5 (0.1-28) Imazethapyr 13 8 0.2 (0.1-0.3) Triclopyr 13 7 0.3 (0.2-0.5) 4-CPA 11 3 15 (0.9-26) Dicamba 6 4 6 (3-11) Acifluorfen 3 2 1 (0.2-2) Haloxyfop 2 1 4 (0.2-8) Imazapic 1 1 0.2 (0.2-0.2) Imazapyr 1 1 0.4 (0.4-0.4)
320 items analyzed (64 items analyzed per MB)

-0.04
0.01
0.06
0.11
0.16
ug/k
g(bo
dy w
t)/da
y
DDT
ADI: 10 ug/kg(body wt)/day
1000x < ADI
The FDA Pesticide Residue Program
Total Diet Study - Exposures

-0.01
0.04
0.09
0.14
ug/k
g(bo
dy w
t)/da
y Methyl Chlorpyrifos
ADI: 10 ug/kg(body wt)/day
500x < ADI
The FDA Pesticide Residue Program
Total Diet Study - Exposures
The FDA Pesticide Residue Program
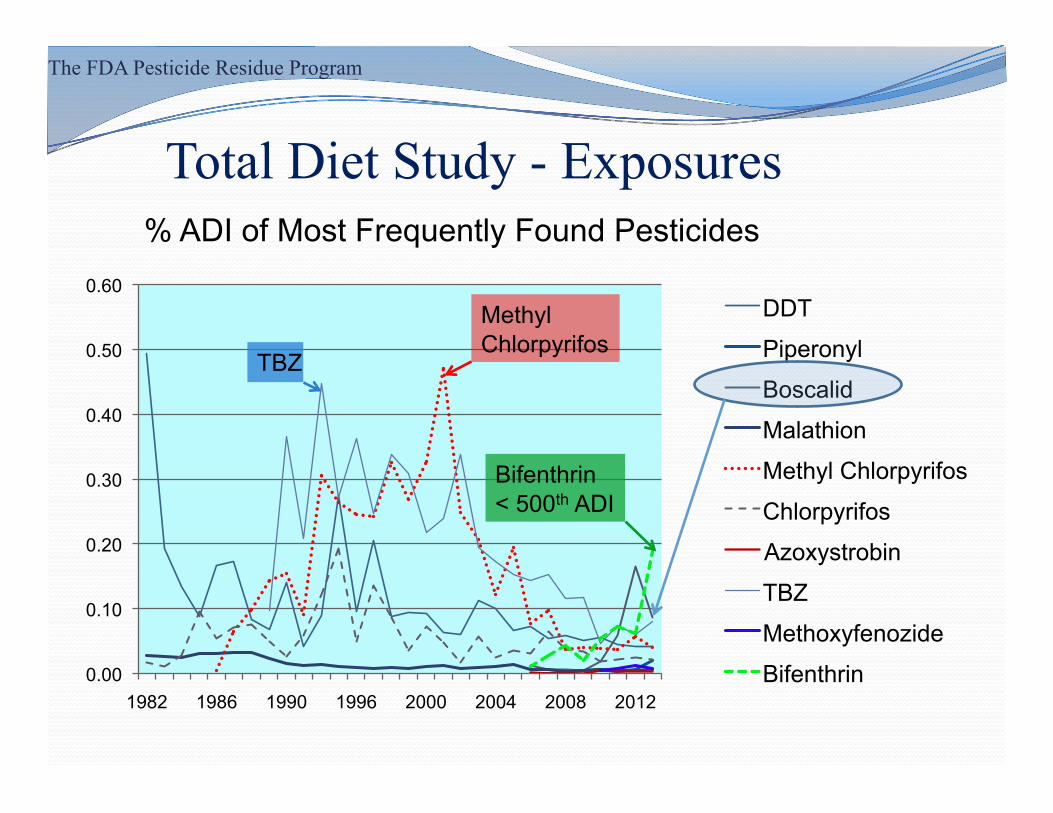
Total Diet Study - Exposures
0.00
0.10
0.20
0.30
0.40
0.50
0.60
1982 1986 1990 1996 2000 2004 2008 2012
% ADI of Most Frequently Found Pesticides
DDT
Piperonyl
Boscalid
Malathion
Methyl Chlorpyrifos
Chlorpyrifos
Azoxystrobin
TBZ
Methoxyfenozide
Bifenthrin
TBZ
Methyl Chlorpyrifos
Bifenthrin < 500th ADI
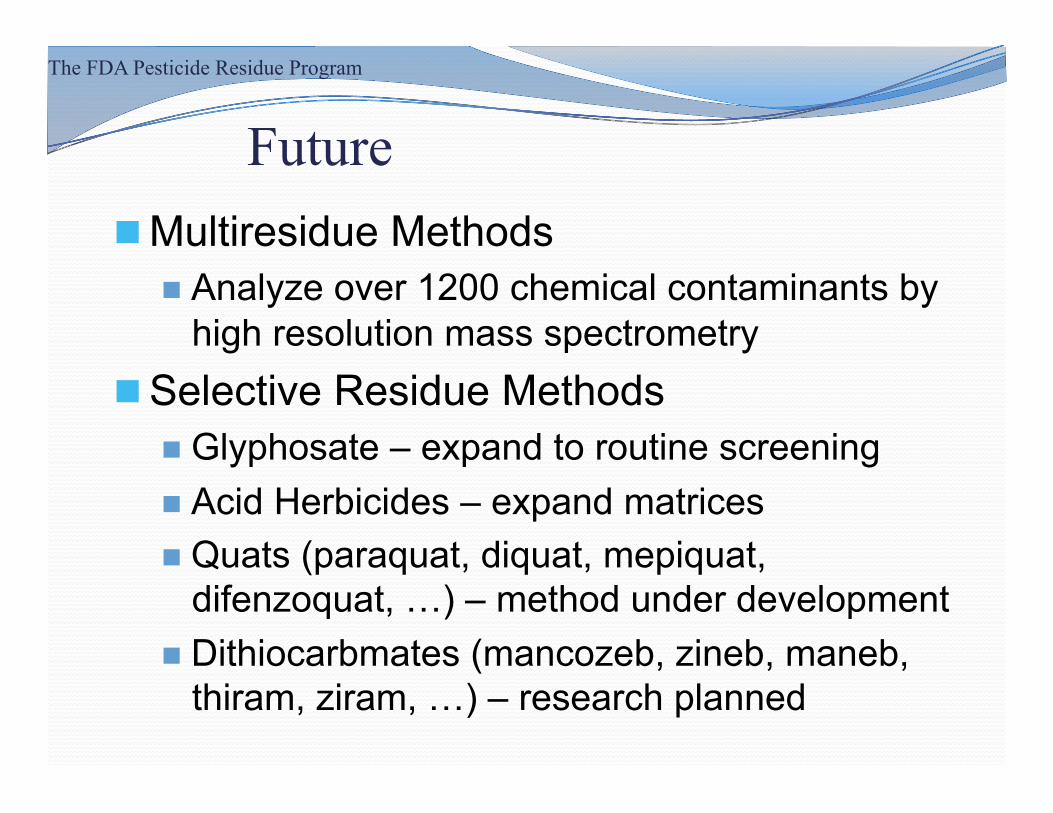
Future " Multiresidue Methods
" Analyze over 1200 chemical contaminants by high resolution mass spectrometry
" Selective Residue Methods " Glyphosate – expand to routine screening " Acid Herbicides – expand matrices " Quats (paraquat, diquat, mepiquat,
difenzoquat, …) – method under development " Dithiocarbmates (mancozeb, zineb, maneb,
thiram, ziram, …) – research planned
The FDA Pesticide Residue Program
Thank You!
Chris Sack Center for Food Safety and Applied Nutrition FDA
The FDA Pesticide Residue Program