Embed Size (px)
DESCRIPTION
Chowan River TMDL Development and Source Assessment Blackwater River Area October 25, 2004. Blackwater River Watershed. TMDL Steps – Blackwater River. Monitoring/Listing - Identification of Water Quality Problem. Source Assessment – Locating potential contributors of pollutant in watershed. - PowerPoint PPT Presentation
Citation preview
Chowan River TMDL Development and Source
Assessment
Blackwater River Area
October 25, 2004
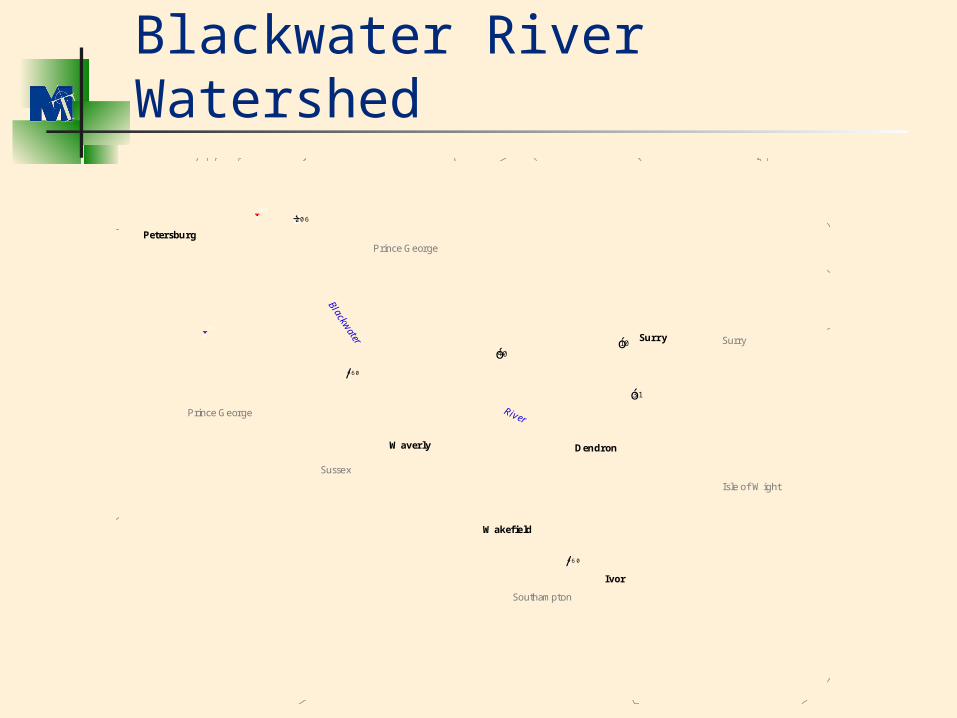
Blackwater River Watershed
#
#
#
#
#
#
Petersburg
Waverly Dendron
Wakefield
Ivor
Surry
.-,295
.-,95
(/460
ø÷106
ôó40ôó10
ôó31
(/460
Blackwater
RiverPrince George
Sussex
Southampton
Isle of Wight
Surry
Prince George
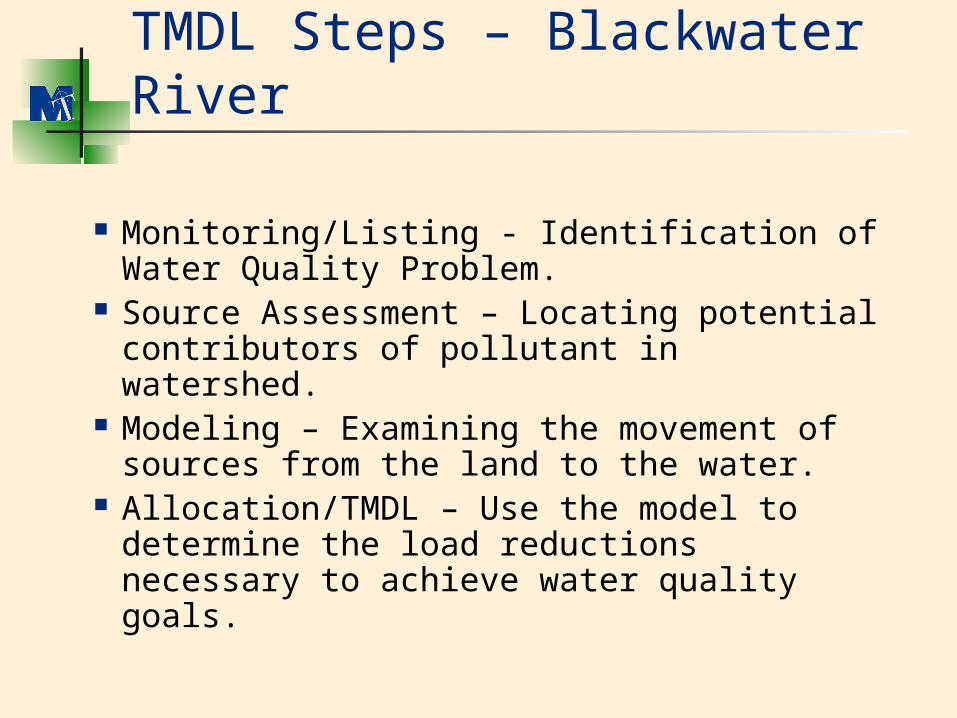
TMDL Steps – Blackwater River
Monitoring/Listing - Identification of Water Quality Problem.
Source Assessment – Locating potential contributors of pollutant in watershed.
Modeling – Examining the movement of sources from the land to the water.
Allocation/TMDL – Use the model to determine the load reductions necessary to achieve water quality goals.
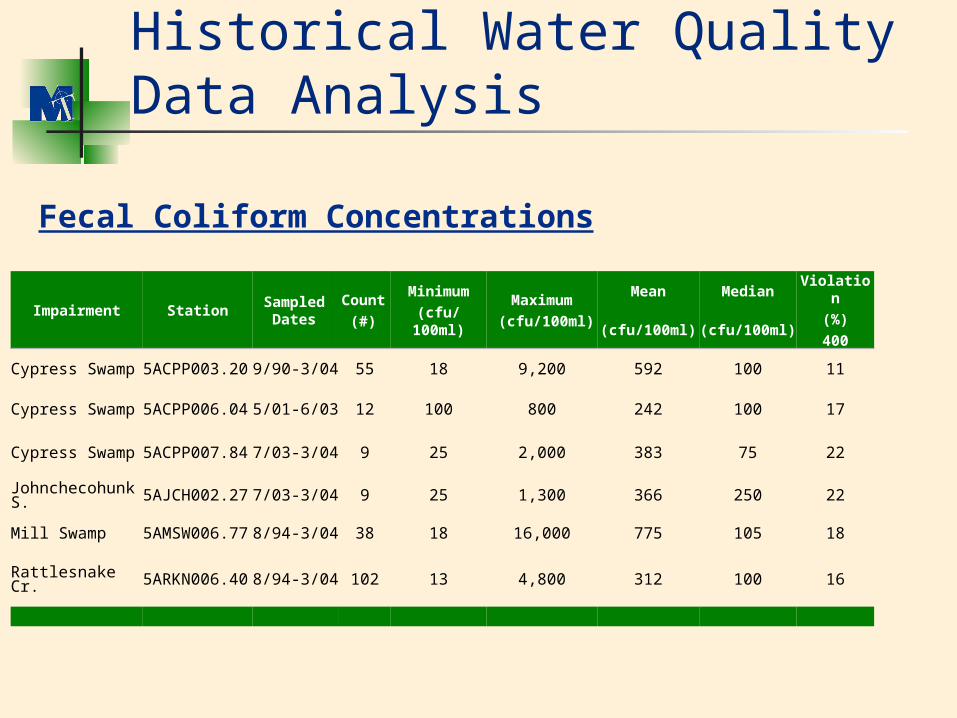
Historical Water Quality Data Analysis
Impairment StationSampled
DatesCount
(#)Minimum
(cfu/100ml)Maximum
(cfu/100ml)Mean
(cfu/100ml)
Median
(cfu/100ml)
Violation(%)400
Cypress Swamp 5ACPP003.20 9/90-3/04 55 18 9,200 592 100 11
Cypress Swamp 5ACPP006.04 5/01-6/03 12 100 800 242 100 17
Cypress Swamp 5ACPP007.84 7/03-3/04 9 25 2,000 383 75 22
Johnchecohunk S. 5AJCH002.27 7/03-3/04 9 25 1,300 366 250 22
Mill Swamp 5AMSW006.77 8/94-3/04 38 18 16,000 775 105 18
Rattlesnake Cr. 5ARKN006.40 8/94-3/04 102 13 4,800 312 100 16
Fecal Coliform Concentrations
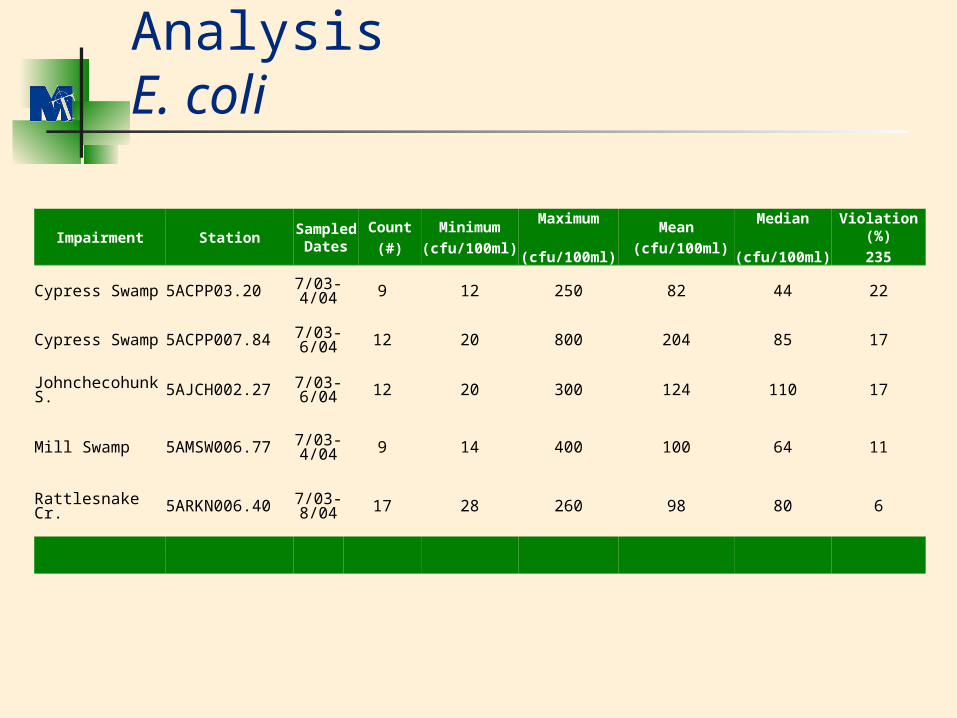
Water Quality Data Analysis E. coli
Impairment StationSampled Dates
Count(#)
Minimum(cfu/100ml)
Maximum
(cfu/100ml)
Mean (cfu/100ml)
Median
(cfu/100ml)
Violation (%)235
Cypress Swamp 5ACPP03.20 7/03-4/04 9 12 250 82 44 22
Cypress Swamp 5ACPP007.84 7/03-6/04 12 20 800 204 85 17
Johnchecohunk S. 5AJCH002.27 7/03-
6/04 12 20 300 124 110 17
Mill Swamp 5AMSW006.77 7/03-4/04 9 14 400 100 64 11
Rattlesnake Cr. 5ARKN006.40 7/03-8/04 17 28 260 98 80 6
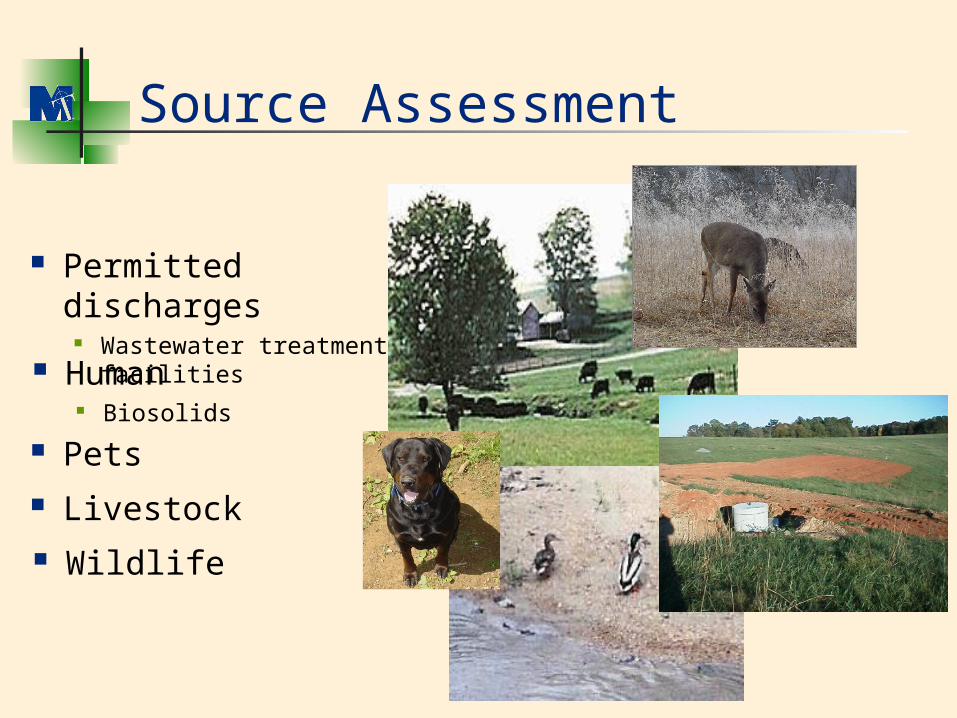
Source Assessment
Livestock Wildlife
Pets
Permitted discharges
Wastewater treatment facilities Human
Biosolids
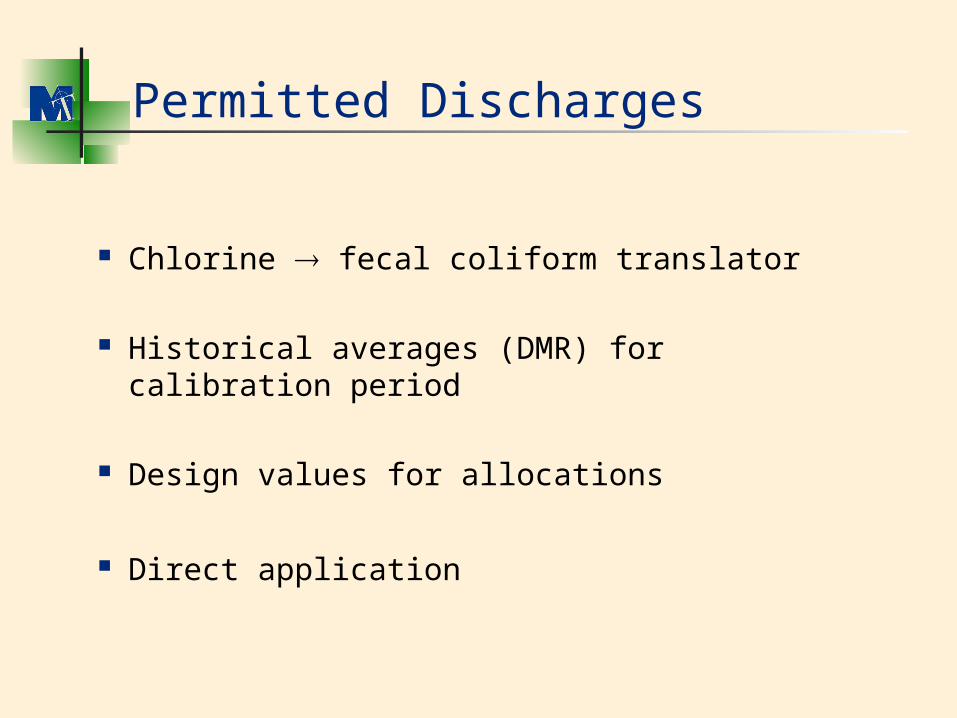
Permitted Discharges
Chlorine fecal coliform translator
Historical averages (DMR) for calibration period
Design values for allocations
Direct application
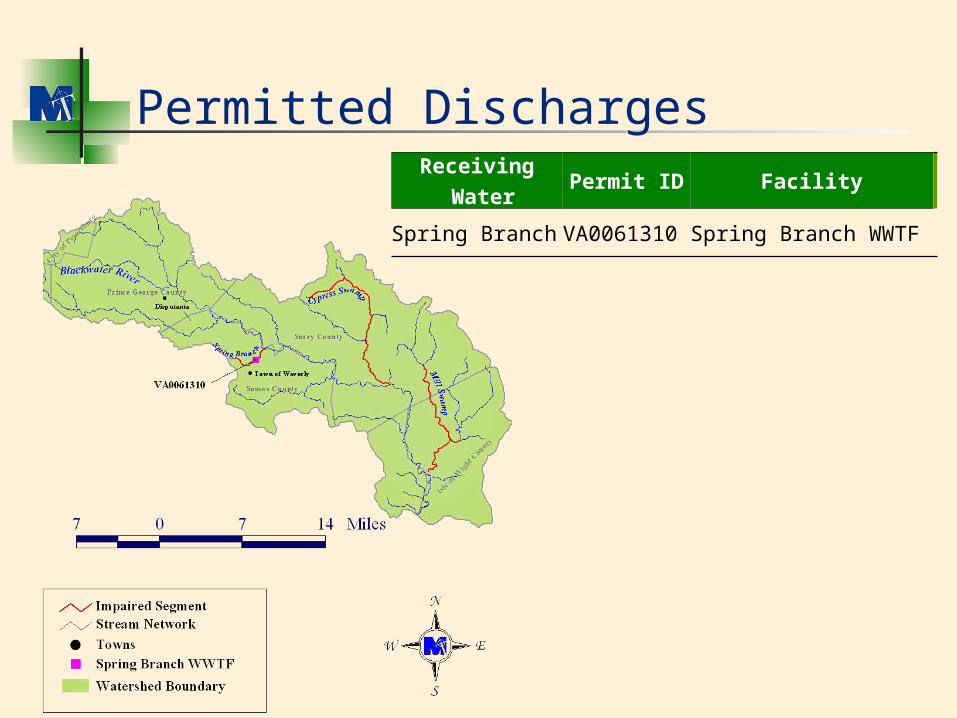
Permitted DischargesReceiving
WaterPermit ID Facility
Spring Branch VA0061310 Spring Branch WWTF
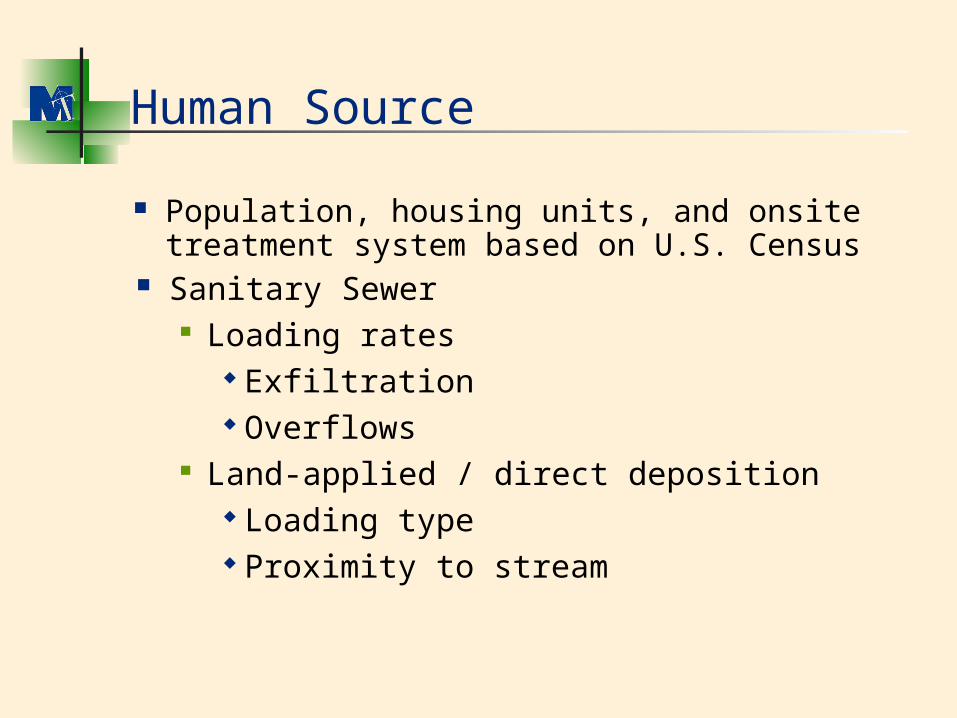
Human Source
Population, housing units, and onsite treatment system based on U.S. Census
Sanitary Sewer Loading rates
Exfiltration Overflows
Land-applied / direct deposition Loading type Proximity to stream
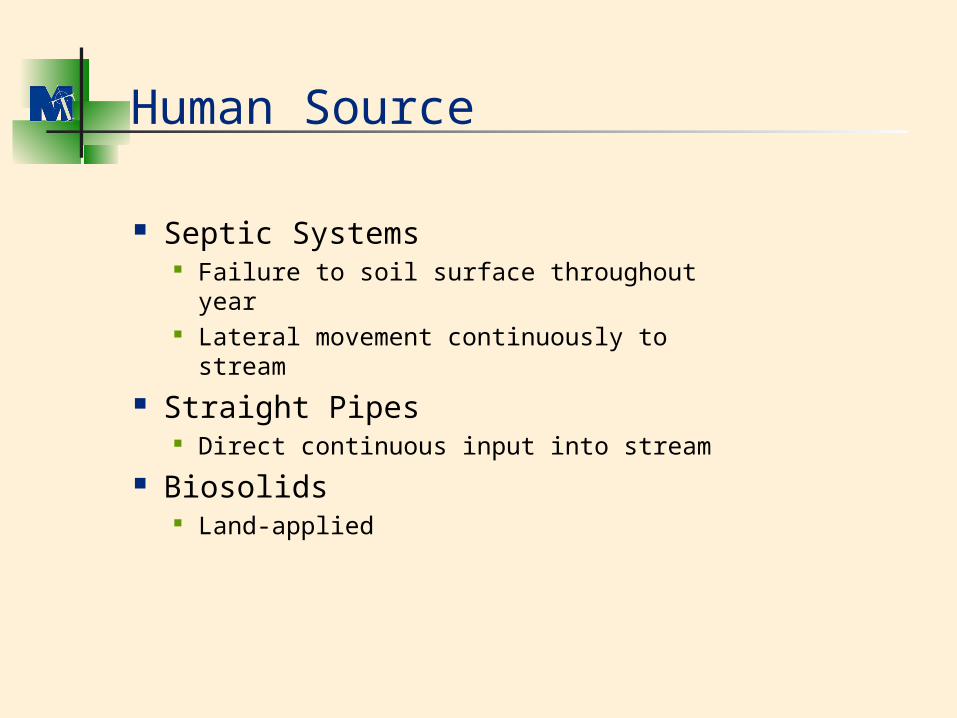
Human Source
Septic Systems Failure to soil surface throughout year Lateral movement continuously to
stream Straight Pipes
Direct continuous input into stream Biosolids
Land-applied

Human Source
#S
#S
#S
#S
#S
#S
#S
Petersburg Claremont
Surry
Rushmere
Wakefield
Ivor
Waverly
ø÷156
I-295
I-95
U-460
ôó10
ôó40
ø÷258
2 0 2 Miles
S
N
EW
Model Area
Population Census 20000 - 11 - 22 - 55 - 88 - 1212 - 2020 - 3030 - 4646 - 7373 - 112
Major Roads#S Towns
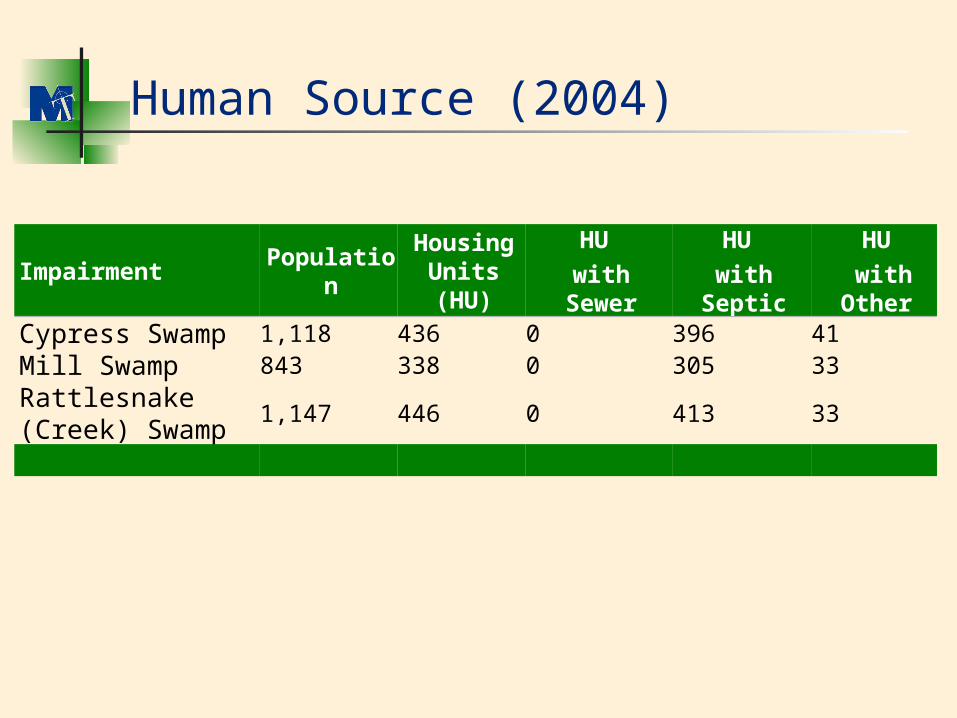
Human Source (2004)
ImpairmentPopulatio
n
Housing Units (HU)
HU with
Sewer
HU with
Septic
HU with Other
Cypress Swamp 1,118 436 0 396 41Mill Swamp 843 338 0 305 33Rattlesnake (Creek) Swamp
1,147 446 0 413 33
Pet Source
Population/household based on literature values, veterinarians, and animal control
Translated to housing units based on U.S. Census
Land-applied
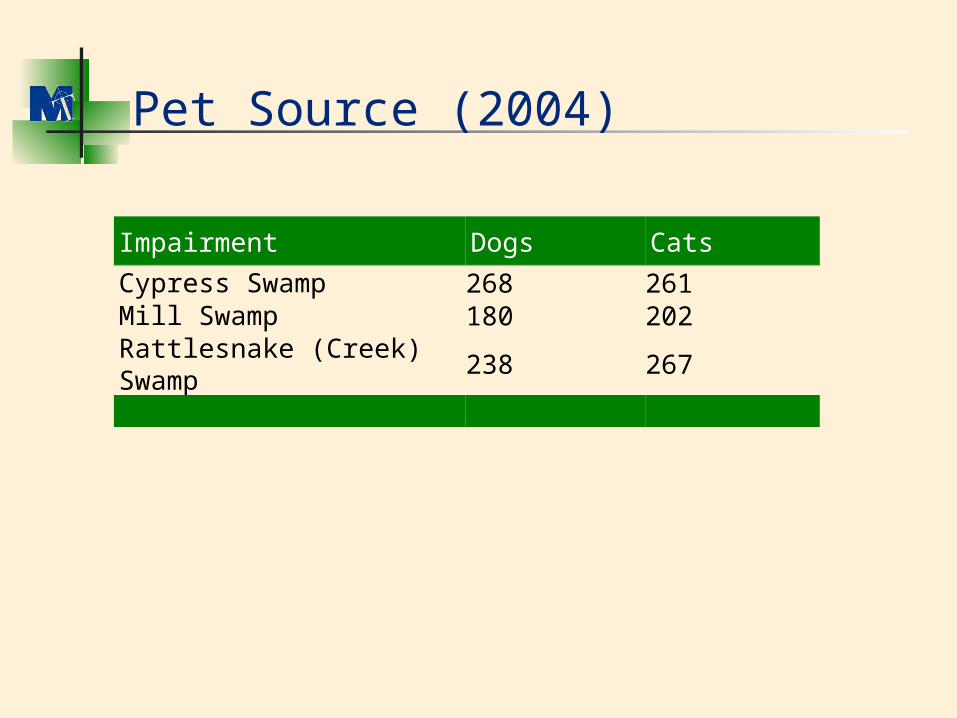
Pet Source (2004)
Impairment Dogs CatsCypress Swamp 268 261Mill Swamp 180 202Rattlesnake (Creek) Swamp
238 267
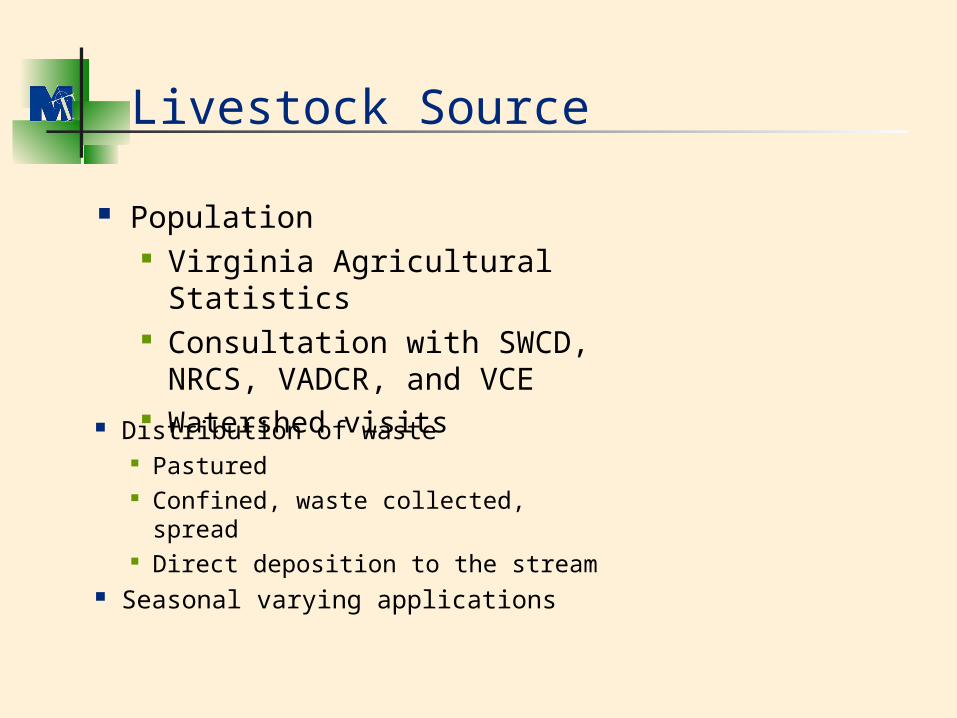
Livestock Source
Distribution of waste Pastured Confined, waste collected,
spread Direct deposition to the stream
Seasonal varying applications
Population Virginia Agricultural
Statistics Consultation with SWCD,
NRCS, VADCR, and VCE Watershed visits
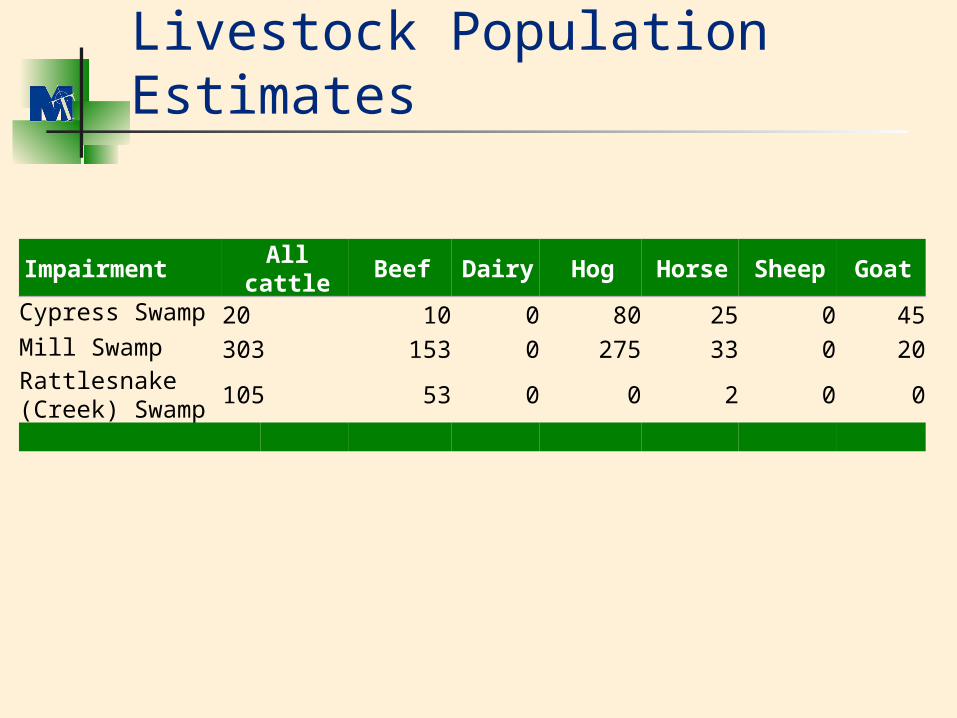
Livestock Population Estimates
Impairment All cattle Beef Dairy Hog Horse Sheep Goat
Cypress Swamp 20 10 0 80 25 0 45Mill Swamp 303 153 0 275 33 0 20Rattlesnake (Creek) Swamp
105 53 0 0 2 0 0
Wildlife Source
Population Animal densities from VDGIF biologists Habitat from literature values
Distribution of waste based on habitat
Land-applied Direct deposition to the stream
Seasonal variations based on migration patterns and food sources
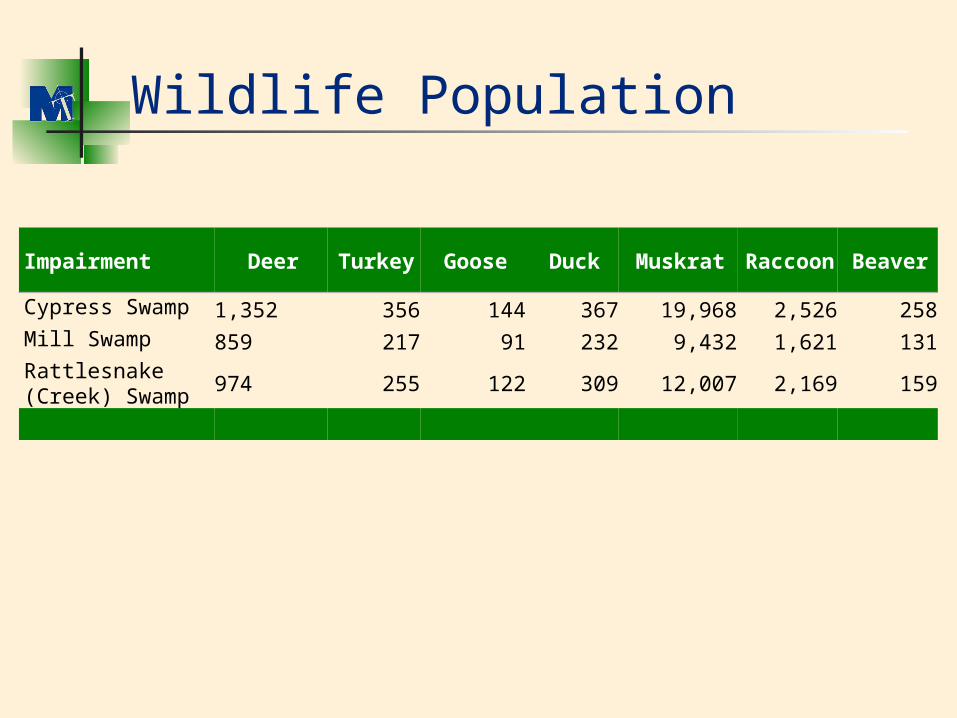
Wildlife Population
Impairment Deer Turkey Goose Duck MuskratRaccoo
nBeaver
Cypress Swamp 1,352 356 144 367 19,968 2,526 258Mill Swamp 859 217 91 232 9,432 1,621 131Rattlesnake (Creek) Swamp
974 255 122 309 12,007 2,169 159
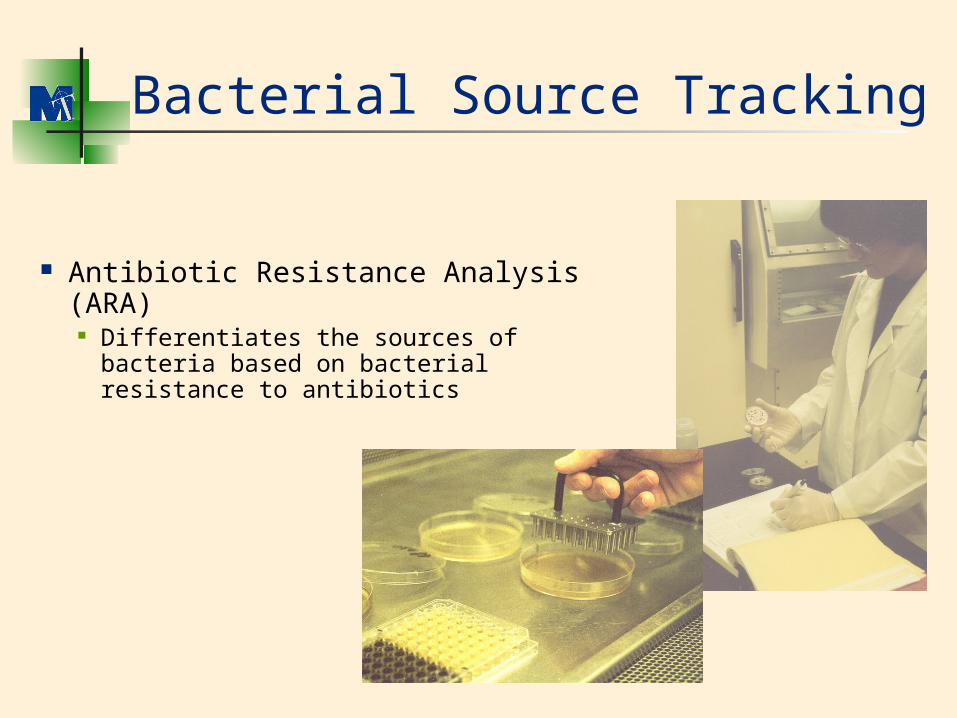
Bacterial Source Tracking
Antibiotic Resistance Analysis (ARA) Differentiates the sources of bacteria
based on bacterial resistance to antibiotics
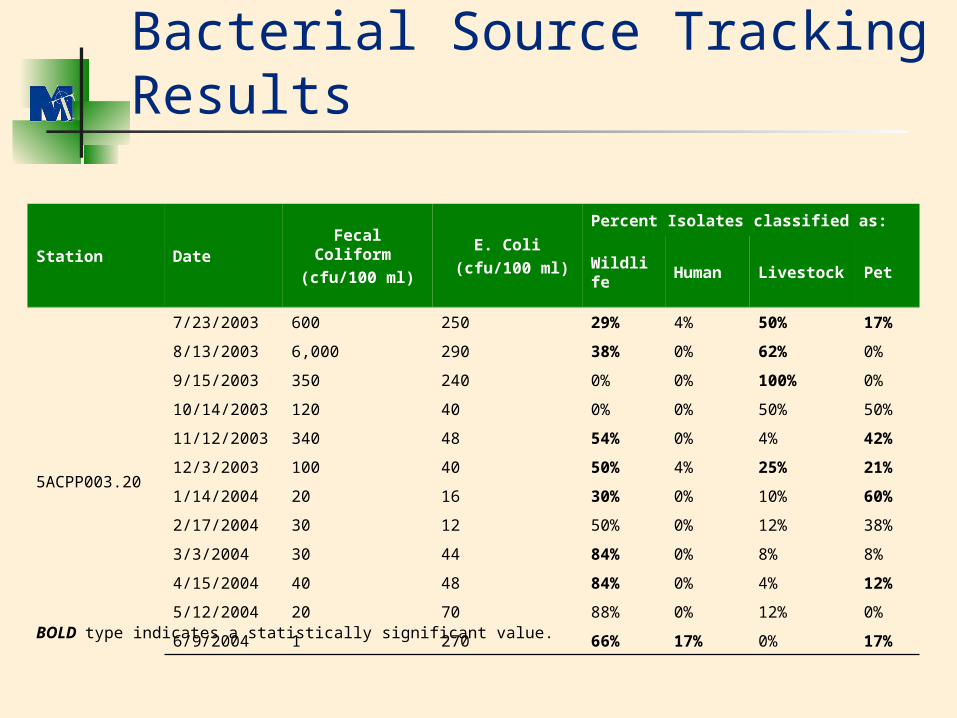
Bacterial Source Tracking Results
Station DateFecal Coliform (cfu/100 ml)
E. Coli (cfu/100 ml)
Percent Isolates classified as:
Wildlife
Human Livestock Pet
5ACPP003.20
7/23/2003 600 250 29% 4% 50% 17%
8/13/2003 6,000 290 38% 0% 62% 0%
9/15/2003 350 240 0% 0% 100% 0%
10/14/2003 120 40 0% 0% 50% 50%
11/12/2003 340 48 54% 0% 4% 42%
12/3/2003 100 40 50% 4% 25% 21%
1/14/2004 20 16 30% 0% 10% 60%
2/17/2004 30 12 50% 0% 12% 38%
3/3/2004 30 44 84% 0% 8% 8%
4/15/2004 40 48 84% 0% 4% 12%
5/12/2004 20 70 88% 0% 12% 0%
6/9/2004 1 270 66% 17% 0% 17%BOLD type indicates a statistically significant value.
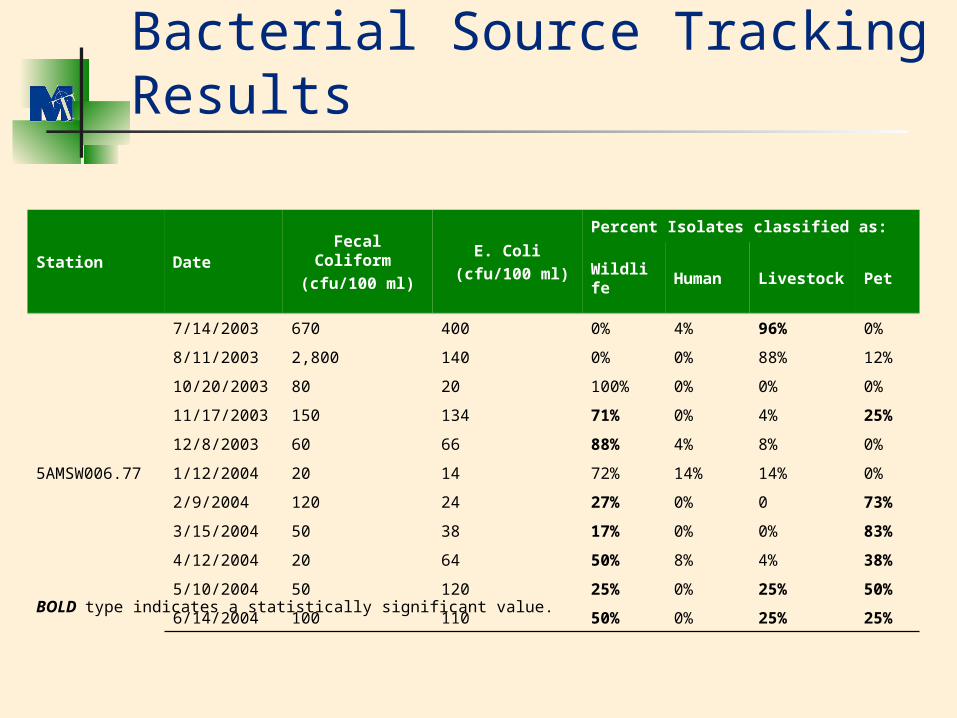
Bacterial Source Tracking Results
Station DateFecal Coliform (cfu/100 ml)
E. Coli (cfu/100 ml)
Percent Isolates classified as:
Wildlife
Human Livestock Pet
5AMSW006.77
7/14/2003 670 400 0% 4% 96% 0%
8/11/2003 2,800 140 0% 0% 88% 12%
10/20/2003 80 20 100% 0% 0% 0%
11/17/2003 150 134 71% 0% 4% 25%
12/8/2003 60 66 88% 4% 8% 0%
1/12/2004 20 14 72% 14% 14% 0%
2/9/2004 120 24 27% 0% 0 73%
3/15/2004 50 38 17% 0% 0% 83%
4/12/2004 20 64 50% 8% 4% 38%
5/10/2004 50 120 25% 0% 25% 50%
6/14/2004 100 110 50% 0% 25% 25%BOLD type indicates a statistically significant value.
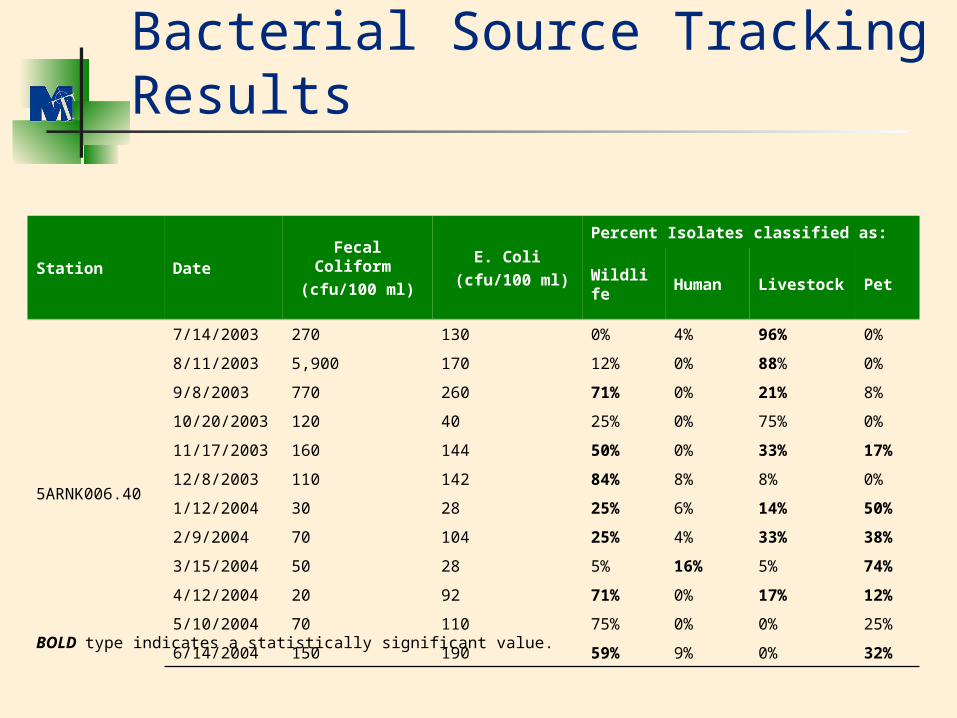
Bacterial Source Tracking Results
Station DateFecal Coliform (cfu/100 ml)
E. Coli (cfu/100 ml)
Percent Isolates classified as:
Wildlife
Human Livestock Pet
5ARNK006.40
7/14/2003 270 130 0% 4% 96% 0%
8/11/2003 5,900 170 12% 0% 88% 0%
9/8/2003 770 260 71% 0% 21% 8%
10/20/2003 120 40 25% 0% 75% 0%
11/17/2003 160 144 50% 0% 33% 17%
12/8/2003 110 142 84% 8% 8% 0%
1/12/2004 30 28 25% 6% 14% 50%
2/9/2004 70 104 25% 4% 33% 38%
3/15/2004 50 28 5% 16% 5% 74%
4/12/2004 20 92 71% 0% 17% 12%
5/10/2004 70 110 75% 0% 0% 25%
6/14/2004 150 190 59% 9% 0% 32%BOLD type indicates a statistically significant value.
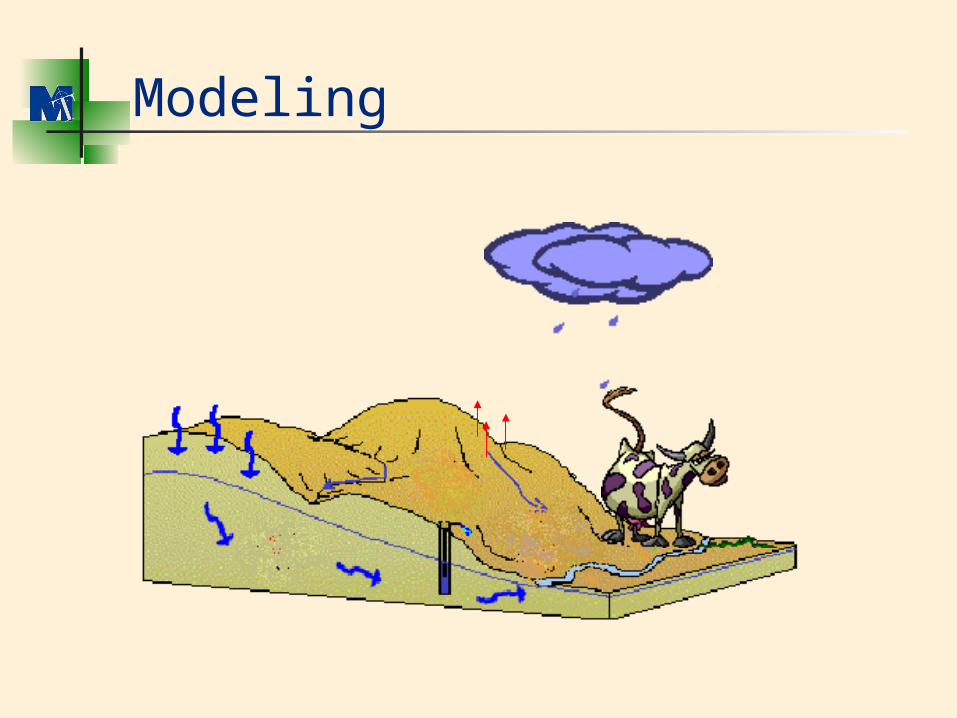
Modeling
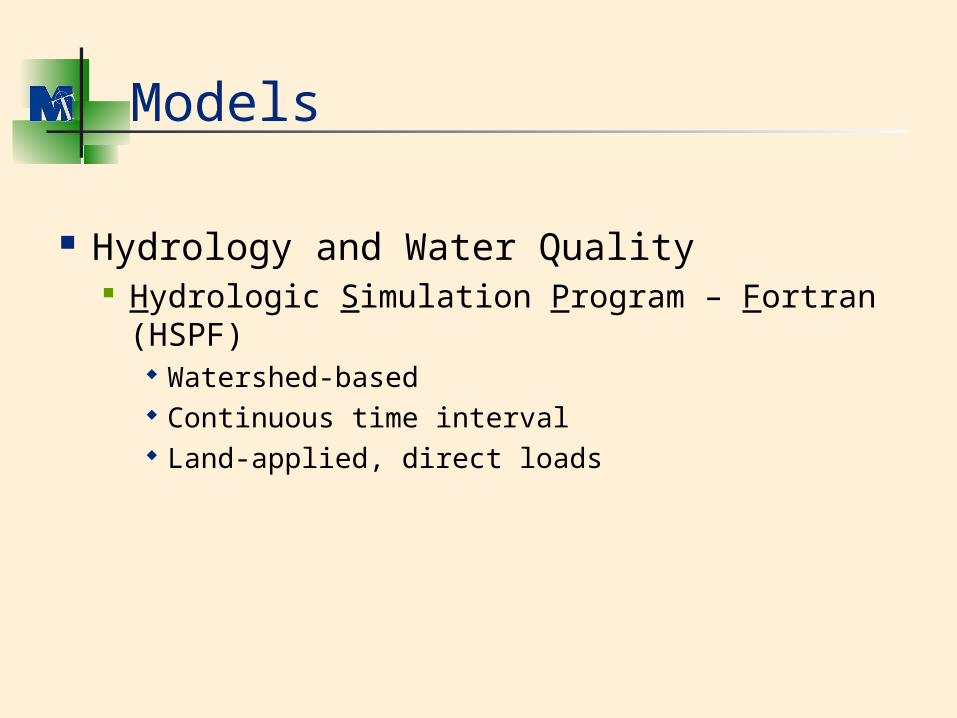
Models
Hydrology and Water Quality Hydrologic Simulation Program – Fortran (HSPF)
Watershed-based Continuous time interval Land-applied, direct loads
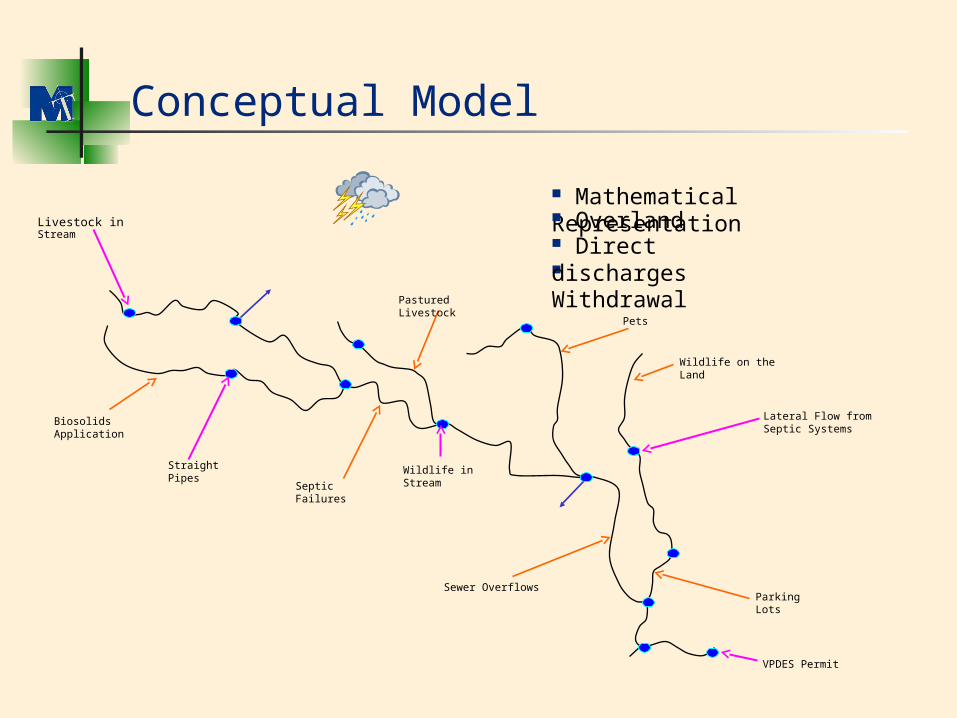
Wildlife in Stream
VPDES Permit
Conceptual Model
Mathematical Representation
Withdrawal Direct discharges
Overland
Wildlife on the Land
Pastured Livestock
Straight Pipes
Lateral Flow from Septic Systems
Parking Lots
Livestock in Stream
Septic Failures
Sewer Overflows
Biosolids Application
Pets
Hydrologic Modeling Components
Climatic data Land use Topography Soils Stream channel characteristics Point source discharge/withdrawal Flow data
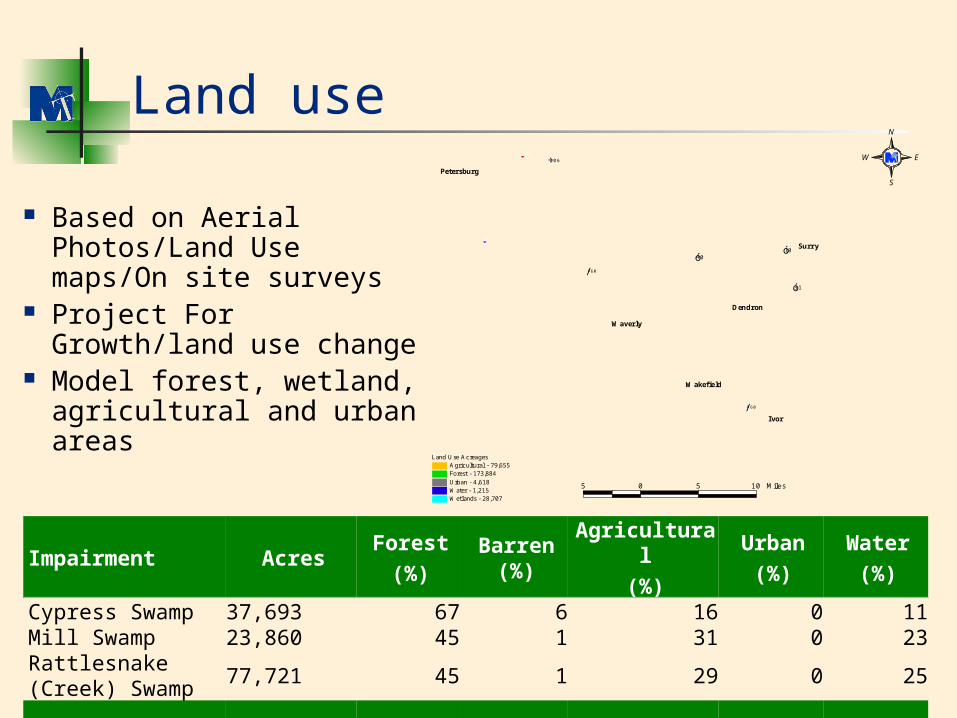
Land use
#
#
#
#
#
#
Petersburg
Waverly
Dendron
Wakefield
Ivor
Surry
.-,295
.-,95
(/460
ø÷106
ôó40ôó10
ôó31
(/460
Land Use AcreagesAgricultural - 79,655Forest - 173,884Urban - 4,618Water - 1,215Wetlands - 28,707
5 0 5 10 Miles
S
N
EW
Impairment AcresForest
(%)Barren
(%)Agricultural
(%)Urban
(%)Water
(%)Cypress Swamp 37,693 67 6 16 0 11Mill Swamp 23,860 45 1 31 0 23Rattlesnake (Creek) Swamp
77,721 45 1 29 0 25
Based on Aerial Photos/Land Use maps/On site surveys
Project For Growth/land use change
Model forest, wetland, agricultural and urban areas
Water Quality Modeling Components
Sources Fecal production FC densities FC distribution
Delivery Mechanisms Direct Land-applied
Temporal Variation
Allocation Scenarios
Project impact of Load Reductions from various sources. (Ex: 99% Human, 60% livestock, 0% Wildlife).
Explore impact of BMP’s. Develop reduction/BMP scenarios that
will achieve water quality standards.
Public Meeting 2 Public Review Submit to EPA State Approval Implementation Plan Development Implementation