Embed Size (px)
Citation preview
University of Rhode Island University of Rhode Island
DigitalCommons@URI DigitalCommons@URI
Open Access Master's Theses
2005
Choosing a Leader: Measurement of Adolescent Perceptions of Choosing a Leader: Measurement of Adolescent Perceptions of
Leadership Leadership
Catherine Stephan University of Rhode Island
Follow this and additional works at: https://digitalcommons.uri.edu/theses
Recommended Citation Recommended Citation Stephan, Catherine, "Choosing a Leader: Measurement of Adolescent Perceptions of Leadership" (2005). Open Access Master's Theses. Paper 1662. https://digitalcommons.uri.edu/theses/1662
This Thesis is brought to you for free and open access by DigitalCommons@URI. It has been accepted for inclusion in Open Access Master's Theses by an authorized administrator of DigitalCommons@URI. For more information, please contact [email protected].

CHOOSING A LEADER:
.5F 7~4,3 (_~
$147 J.oo'S
MEASUREMENT OF ADOLESCENT PERCEPTIONS OF LEADERSHIP
BY
CATHERINE STEPHAN
A THESIS SUBMITTED IN PARTIAL FULLFILLMENT OF
THE REQUIREMENTS FOR THE DEGREE OF
MASTER OF ARTS
IN
PSYCHOLOGY
UNIVERSITY OF RHODE ISLAND
2005

Abstract
As the world becomes more complex and demanding , effective leadership is
a progressively more important resource. Effective leadership skills are a valuable
commodity in many areas of life, such as government , business , community and
educational systems. Although there are a considerable number of studies
pertaining to adult perceptions of leadership (Fiedler , 1967, Gouldner , 1950, Hook,
1955, Klonsky , 1983, Morris & Hackman , 1969, Suedfeld,& Rank , 1976, Wood ,
1913 ), there is a limited amount of research available regarding the development
of leadership perceptions in adolescents. This is somewhat surprising given
several research findings that identify the development of leadership skills in
adolescents as an important indicator of positive social adjustment (McCullough ,
Ashbridge & Pegg, 1994; Scales, Benson & Leffert, 2000). Similarly, the
literature pertaining to the measurement of adolescent perceptions leadership is
sparse. In fact, most measures of leadership for children and adolescents have
been found to be psychometrically inadequate (Oakland, Falkenberg & Oakland ,
1996). Presently , there are no published measures of adolescent perceptions of
peer leaders. Although there is some literature on adolescents and leadership
emerging within the gifted child literature , there are remarkably few studies
pertaining to ways that adolescents develop perceptions of effective leadership
(Karnes , & Bean , 2001, Oakland, Falkenburg & Oakland , 1996).
The goal of this project was to test a newly developed 20-item measure of
adolescent perceptions of peer leadership. This scale is based upon the integrated
use of Fielder ' s Contingency theory of leadership and Selman's theory of social

awareness development. The hypothesized model for understanding adolescent
perception of peer leaders suggested that the development of social awareness will
impact an adolescent's perception of effective peer leadership . Thus, it was
hypothesized that as adolescents develop higher levels of social awareness ,
decisions regarding the effectiveness of a potential peer leader will be determined
by the goodness of fit between individual leader characteristics and the social
context. It was hypothesized that there are three main factors that adolescents
consider when making decisions about peer leaders: instrumental behaviors ,
physical attributes and personality characteristics .
In this study, adolescents were asked to rate peers that were perceived to be
effective leaders in three separate scenarios (government , athletic , social contexts).
Confirmatory factor analysis and principal component analyses were utilized to
investigate the hypothesized three factor structure . Results revealed that the factor
structure was not well supported by the original 20 item scale. Post hoc analyses
guided the revision of the scale and led to an improved overall fit of the
measurement model that maintained an acceptable level of fit across all three
situations. It was concluded that further research was needed to verify the
appropriateness of the post hoc revisions and to provide independent replication of
the hypothesized three factor structure . Although additional analyses did not
reveal the presence of significant age differences , some gender differences were
noted .

Acknowledgements
I would like to thank all my committee members, Bryan Blissmer, Margie
Rogers, Joe Rossi and Sue Rossi for all their time and support. I would also like to
thank all of my friends and family who have provided ongoing emotional
encouragement. Returning to school after so many years of working would not
have been possible without all their understanding and support.
lV

Table of Contents
Abstract. . . ........ . . .. . .. . . . .. . . . .. .... .. . . .. .. . . .. .... .. . . . .. .. .... . ..... . ... .. ....... ii
Acknowledgment .. .... .. .. . .. . .... . . ... .. . ... .. . .. . . .. . ....... . ...... . .... . . . ..... ... iv
Table of Contents ... . ... . ..... . . . .. . . .. .... .. . ... .. . . . . .. .................... . .... .. .. v
List of Tables .... . ... . .. . . . ... . ..... . .. . ..... . .. . ........................ . ... . . .. .... .. vii
List of Figures .... . .... . .... .. .. . . .. ... . ... ... . . ... . .......... . . . ............ . ........ viii
Background and Introduction . .. .. ...... . ....... . ....................... . .... ... .. .. 1
Overview of Adult Leadership Literature . . .. . .. . ........ . .... . ... . .. . ... .. 1
Fiedler's Contingenc y Theory of Leadership . . ... . .. .. ......... . . . .. . .. ... 3
Predictors of Leadership in Adolescents ..... . ...... . ... .. . . ............... 6
Social Awareness Development .. .. . ................ . .. .. ................... 10
Research Proposal . . . . . . . . . . . . . . . . . . . . . . . . . . . . . . . . . . . . . . . . . . . . . . . . . . . . . . . . . . . . 15
Method ........ . . .. .... . .. . . . .. .. .. . .. . ............. . . .. .... .. .................. . ....... 17
Subjects .. . .. . .. .. . ..... . .. . .. ....... . .... . . .. .. .. .... . .. . . . . . ... . ... . .... . .... . 17
Measures . . . . . . . . . . . . . . . . . . . . . . . . . . . . . . . . . . . . . . . . . . . . . . . . . . . . . . . . . . . . . . . . . . . . . . 1 7
Procedure . . . . . . . . . . . . . . . . . . . . . . . . . . . . . . . . . . . . . . . . . . . . . . . . . . . . . . . . . . . . . . . . . . . . . 18
Results . ... . .... .. .... . ........ . .. . . . . . .. .. .... . ...... .. . . . . .. ... ... . ..... . . . ... . ... . ... 20
Preliminary Analyses ................ . ...... . ........ . ........................ 20
Survey Order Effects ... . .... . ..... . .... . ................. . ............. .. .... 23
Principal Component Analysis . ... . .. ...... . ........... . .. . ... . ..... .. .... . .23
Confirmatory Factor Analysis . . . .. .. . .. .. ..... . ... . . . . . ... . . . . . . . ........... 28
Explorator y Analyses . . ...... . .. .. ... . . ... ....... . . . . . ...... . ........... ........ 30
V

Alternative Model Comparisons ... ... . ..................... . ........ .. ... ... 34
Between Group Analyses ........ . .............................. .. ........... 38
Discussion . . . .. . . . . . . .... . ... . . . . ... . . . .. .... .. .. . ..... . ...... .. . ..... .. . ......... ..... 40
Measurement Issues . .... ... . ..................... .. . .. .... .. .......... .. . . ... .40
Social Awareness Development in Adolescent Perceptions of
Leadership ....... . ...... ... .. . .. ... ... . ... .. . .. ......................... . .. .. .. 42
Gender Differences ... ................................ . ........... .. ......... .42
Limitations and Future Research .. .. . .. .. .. .. .. .. ....... .. ............. ..... 43
Appendices .. .. .. . .. .. ... . . . . . . ..... . ....... . .. . ................ . ..... . .... . .... . .... .. 45
Appendix A .... . . . .. . . . . . .. . .... . .. . . .. ...... . ..... . .... . . . ... . ......... . ....... 45
Appendix B . ... . ... . ........ . ............. . .. . ..... . .. .. ........... . ...... . ..... 46
Appendix C .. .. .. .. . . . . ... . .. .. . ..... .. ... . . ..... .. . ... .. ... . . .. .. .. . . .......... 4 7
Appendix D . . . .. . . . . . . ... .. . .. ... . .. .. . . . .... . .. . ...... .. ... . ....... . ... . .. .. . .. 48
Appendix E .. .... . . . . . . . . . .. .. ... . .. .. ........ .. ......... . ..... . .......... . ....... 49
Bibliography . ............ . ... . ............... . .... . .. . ..... . ... . .. . .... . ... . ...... . .... 50
Vl

List of Tables
Table Page
Table 1 Fiedler's Contingency Theory Components ....... . ..... . ........... . ... 6
Table 2 Selman' s Social Awareness Development. . .. ... . .............. . ..... ... 12
Table 3 The Hypothesized Factor Structure ..... .. ... . .. . ............... .. .... .... 15
Table 4 Means and Standard Deviations of Survey Items .... . . ........... .... . .21
Table 5 Government Situation Component Loadings .... ... ... ......... .... . . .. 25
Table 6 Sport Situation Component Loadings .................................... 26
Table 7 Social Situation Component Loadings .............. . .................... 27
Table 8 Revised Scale Factor Loading Structure- Government Situation .... 31
Table 9 Revised Scale Factor Loading Structure- Sport Situation .... .... .. ... 31
Table 10 Revised Scale Factor Loading Structure- Social Situation ......... .32
Table 11 Revised Scale Correlations .. ... .......................... . ......... ..... 33
Table 12 Revised Scale Means , Standard Deviations and
Coefficient Alphas .................... .. .... .. ............................... 34
Table 13 Comparison of Measurement Models for the Government
Situation .. .... . .. ... . ... ... . .............. . ... ... ... .. .. ..... ........ . ..... 35
Table 14 Comparison of Measurement Models for the Sport Situation .... 36
Table 15 Comparison of Measurement Models for the Social Situation .... 36
Table 16 Maximum-likelihood Correlations Between Factors Across
Situations .. .. . .... .... . .. .. .......... .. . . ... ... ... ... ..... .. ................ 3 8
Vll
List of Figures
Figure Page
Figure 1 - Conceptual Model . .... .. ..... . .. . . .. . . . ... . . ........ .. . . . ........... . ... . 3 7
Vlll

Background and Introduction
In today's world, effective leadership is more crucial than ever. Given the
sparse amount of literature available regarding youth leadership, more information
is needed in the area of adolescent leadership and adolescent perceptions of peer
leadership (Schneider , Ehrhart & Ehrhart , 2002). Increasing the understanding of
adolescent perceptions of effective leadership provides valuable insight into the
role various mechanisms play in the development of leadership in youth. In order
to further explore this area , a review of literature pertaining to adult leadership ,
Fiedler' s Contingency Model of leadership, predictors of adolescent leadership ,
and social awareness is warranted.
Overview of Adult Leadership Literature
A majority of available research on adult leadership examines the leadership
process in a very limited capacity (Scales , Benson & Leffert , 2000). Much of the
research reviewed focused upon specific personal variables that enhance the
probability that leadership behaviors will emerge. These researchers believe
leaders are simply born and that they possess "special " characteristics that enable
them to rise to the top of most situations (Gouldner , 1950). This "great man"
approach to leadership emphasizes internal personal characteristics that are
considered to be important for effective leadership. These characteristics facilitate
the leader ' s ability to obtain and hold on to their position as a leader (Gouldner,
1950; Hook , 1955; Wood , 1913).
Conversely , some researchers believe that anyone can be a leader if they are
in the right place at the right time (Gouldner , 1950). This is the social determinism
1

approach: it stresses the importance of the social climate and the direction of social
movements and values. While the "great man" approach views leadership as
primarily a function of the individual , social determinists consider leadership
primarily a function of the situation (Gouldner, 1950; Simonton, 1979; Suedfeld &
Rank , 1976).
Others believe that the development of leadership entails more than the
possession of a certain set of personality qualities or simply being caught up in a
particular social situation (Blank, 1986; Fiedler, 1967; Fiedler, 1978; Suedfeld, &
Rank, 1978). For example , Fiedler (1967) presents an integrative approach to
leadership. In this view, almost anyone can become a leader under certain
circumstances , but some people and personality sets are more regularly identified
with leadership. According to Fiedler (1967), the successful development of
leadership occurs when an individual is able to successfully combine their personal
attributes effectively within a given situation. It appears that an underlying
"goodness-of-fit " model may play a role in the development of leadership .
Individuals who are able to make successful "goodness-of-fit" decisions regarding
leadership are not only aware of the salient personality characteristics of a
potential leader and the demands of the situation, but are also conscious of how
these two factors are interrelated. The ability to put together these types of
environmental cues is often referred to as social awareness. It is hypothesized that
individuals with higher levels of social awareness will be more likely to utilize
integrative cognitive processes when selecting a leader than individuals with lower
levels of social awareness.
2
-
Fiedler 's Contingency Theory of Leadership
Fiedler ' s Contingenc y theory predicts that the leader ' s contribution to group
functioning depends upon both the personal characteristics of the leader and the
favorableness of the situation. A positive interaction between a situation and a
person ' s attributes is needed for successful leadership to occur. Fiedler's
Contingency theory has four major components: leader variables , the relationship
between the leader and group members , task structure , and position power
(Fiedler , 1967). Fiedler's theoretical components are summarized in Table 1.
The first component addresses the personality of the leader. Fiedler (1967)
identifies two types of leader personalities: task oriented and interpersonal. The
task oriented leader is mainly interested in completing the current task. Their
decisions are primarily based upon the demands and nature of the assigned
activity. The second type of leader is the more interpersonal leader who
emphasizes relational aspects of the group. The interpersonal leader places a
greater value on group satisfaction and successful interactions of the group.
The second major component of this theory is the leader-member
relationship. This involves the leader ' s personal relations with the group or
organization. Fiedler considered the general group atmosphere to be the most
important component in predicting the amount of influence a leader will have in
the group . These relations can range anywhere from highly positive to highly
negative . This suggests that the leader who attempts to be flexible and sensitive to
the group ' s needs increases their probability that they will be a successful leader
within the confines of that particular group.
3

-
A third component is the task structure. Task structure may be defined along
three dimensions: goal clarity, solution specificity and decision verifiability. The
first dimension , goal clarity , refers to how well the group understands the plan for
achieving the goal. The next feature is solution specificity , which refers to the
idea that there may be more than one way to solve the problem . The third element
of the task structure is decision verifiability. This means that once a decision has
been made , the group is comfortable with the final outcome.
The last feature of Fielder's theory is labeled position power; this simply
refers to the amount of power and authority that the leadership position inherently
carries with it. These four components are important parts of a systems approach
to leadership; no one part is independent of all the others.
The interdependence of components permits different combinations of
features to be used to predict whether or not an individual will be successful as a
leader. Fiedler ( 1969) contended that there is no such thing as a good leader for all
situations . He further concluded that , "A leader who is effective in one situation
may or may not be successful in another" (p. 42). Although most research focuses
upon the first dimension, personality of the leader, this is considered to be a
limited view and not likely to result in an accurate prediction of leadership
potential.
An interactional model of leadership considers effective leadership as the
relationship between a specific situation and the personal characteristics of the
leader. The term "goodness-of-fit" denotes the degree to which the leader's
personality and values match the demands and expectations of a specific situation.
4

Fiedler (1978) has continued to expand upon the interactional model of leadership
by describing leadership as a dynamic system. This implies that effective
leadership is an ongoing process that continually affects the way the organization
and the leader interact with each other. For example, effective task-oriented
leaders are not likely to be as successful in less structured group settings or in
groups where the goals are not clearly defined. Likewise, leaders who emphasize
interpersonal relationships may not be successful in situations where the group
dynamics are very poor and the task is very structured.
Blank (1986) found that many high school leaders rely on personal
characteristics ( e.g., charisma), however , these personal characteristics were not
sufficient for the leaders to maintain their positions independent of the demands of
the task. High school leaders believed that the most effective leader is one who is
concerned about the group task as well as whether the group members feel
positively about each other. This suggested that at the high school level there
seems to be recognition of the importance of both personality variables and the
compatibility between the leader and the target task.
This conceptual framework has been provided as a guide to facilitate the
understanding of the interactions between leaders and the environment. Thus, it is
not enough for a leader to just be in the right place at the right time. It is also not
enough for a leader to simply possess a particular set of "leadership
characteristics" or skills. An effective leader is a person who not only has several
positive leadership characteristics but is also perceived as being able to fit into the
situation and its demands.
5
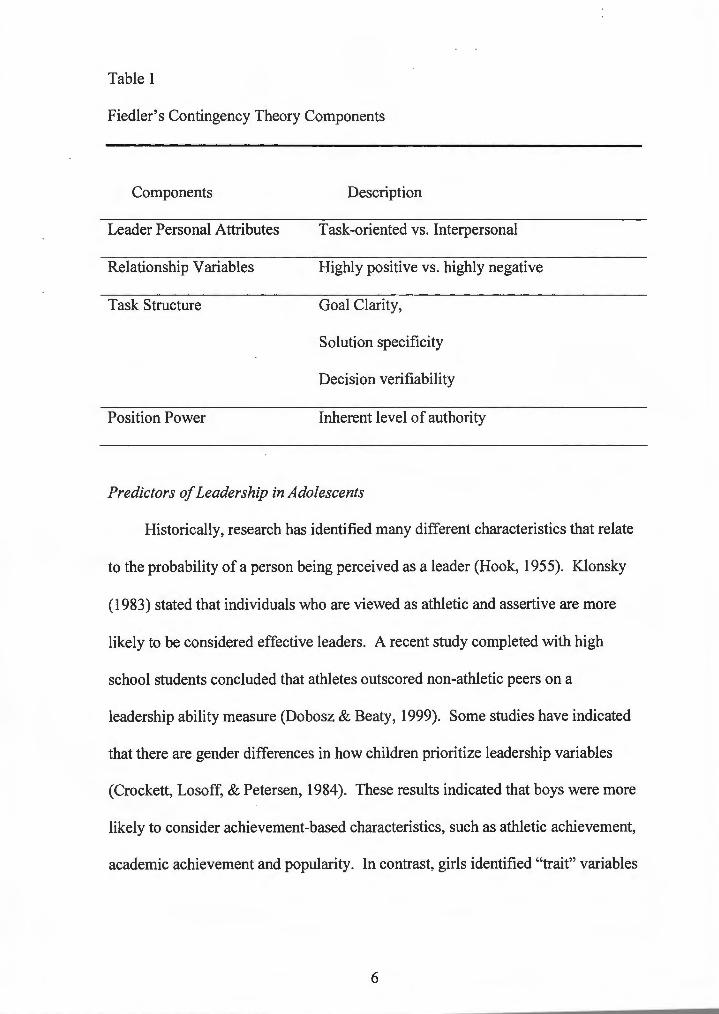
Table 1
Fiedler's Contingency Theory Components
Components
Leader Personal Attributes
Relationship Variables
Task Structure
Position Power
Description
Task-oriented vs. Interpersonal
Highly positive vs. highly negative
Goal Clarity ,
Solution specificity
Decision verifiability
Inherent level of authority
Predictors of Leadership in Adolescents
Historically, research has identified many different characteristics that relate
to the probability of a person being perceived as a leader (Hook , 1955). Klonsky
(1983) stated that individuals who are viewed as athletic and assertive are more
likely to be considered effective leaders. A recent study completed with high
school students concluded that athletes outscored non-athletic peers on a
leadership ability measure (Dobosz & Beaty , 1999). Some studies have indicated
that there are gender differences in how children prioritize leadership variables
(Crockett, Losoff, & Petersen, 1984). These results indicated that boys were more
likely to consider achievement-based characteristics , such as athletic achievement,
academic achievement and popularity. In contrast , girls identified "trait" variables
6

such as personality and physical appearance as more important in determining a
peer leader.
Hannah ( 1979) identified two clusters of behaviors that may characterize a
leader. The first cluster was referred to as instrumental behaviors: this includes
such features such as having many ideas, being hard working , having
organizational abilities and possessing athletic or other special talents. These
instrumental traits were considered to be highly useful in the completion of a task
goal. A second cluster of characteristics described personality traits such as being
friendly , attractive , popular , enthusiastic , sensitive and having a "good"
personality. The personality cluster identified traits that were highly effective in
improving the satisfaction and interpersonal dynamics within a group. Morris and
Hackman (1969) also found that leaders compared to non-leaders emphasized
facilitative activities (i.e. , proposed solutions , worked well in the group) and
tended to de-emphasize detrimental activities or behaviors ( e.g., argumentative ,
critical). Similarly , McCullough et al. (1994) found that adolescent leaders were
more likely to have an internal locus of control than non-leader adolescents.
Adolescent leaders also were found to have higher career aspirations than their
non-leader peers.
Popularity has also been identified as an important trait for leaders. Peery
( 1979) defined a popular person as having both high social impact and high peer
acceptance. Research has found that the impact of an individual's popularity
greatly depends upon age of the recipient and their understanding of concepts such
as friendship , gender relationships and personality features (Oppenheimer &
7

Thijasen , 1983 ). Thus , the impact of popularit y appears to have a differential
impact upon children at various stages of social awareness. As noted in other
reviews (Asher & Hymel , 1981; Hartup , 1983 ), popularity has been found to be a
multi-dimensional construct , which includes gender, race , physical attractiveness ,
special education status , social knowledge , abilit y to engage others in an
interaction , intelligence and academic achie vement. Therefore , it is difficult to
gain a clear understanding of the role popularity plays among children and
adolescents and its relationship to their perceptions of a successful peer leader.
Attractiveness is a characteristic that is often associated with popularity
(Asher , Markell & Hymel , 1981; Hartup , 1983) . Zakin (1983) stated that
"attractiveness is a powerful attribute which can compensate for deficiencies in
other areas " (p. 120). He concluded that attractiveness is more influential in
choosing peer preferences than either athletic ability or sociability (Zakin , 1983).
Creativity and flexibility characteristics were also found to be important for
leadership acquisition (Fu , Canaday , & Fu , 1982). Creativity was defined as the
ability to generate original and unique ideas . The term flexibility refers to the
ability to adjust the leadership role to fit the needs of the group and complete the
task. Blank ( 1986) surveyed high school leaders and found that high school
leaders rated a flexible response style as essential for the maintenance of effective
leadership.
Several researchers have found that intelligence plays an important role in
the development of leaders (Breckenbridge & Vincent , 1968 ; Fleming , 1935;
Gouldner , 1950 ; Morris & Hackman , 1969 ; Schneider et al , 2002). Breckenbridge
8
and Vincent (1968) demonstrated that children who possess above average
abilities were more able to sustain a leadership role. Leadership was found to be
related to the leader ' s age, intelligence , school marks and social status. Gouldner
(1950) stated that leaders tend to have higher intelligence than the group average.
However , Gouldner added that there is an optimal degree of intelligence beyond
which intelligence seems to interfere with leadership acquisition (i.e., some highly
intelligent individuals lack social skills needed for leadership) . Morris and
Hackman ( 1969) also supported this notion and suggested that in some social
situations high achievement and intelligence may be a "social liability".
Fleming (1935) found that leadership correlated with the ability to be: lively,
amusing , intelligent , athletic , interesting, having a pleasant voice, being a good
sport , not being modest and having a wide range of interests. Additionally ,
Nutting (1923) found that gymnastic team captains were picked for the following
reasons : slightly higher intelligence , physical ability , older chronologically and
above average popularity status.
Thus, historically , most research on leadership has simply provided a list of
characteristics that appear to be correlated with leadership (Morris & Hackman ,
1969). There are benefits to these findings because they identify qualities that
appear be most likely associated with leadership potential. However , experience
tells us that not all leaders exhibit this wide array of characteristics. The research
frequentl y ignores many other factors that may influence leadership, such as group
composition , social climate or the nature of the task. To date, the research fails to
identify any single variable as the critical component in successful leadership.
9

Davis and Luthans (1984) state that this reductionist tendency in leadership
research , in which general leadership categories are identified and singled out
because they appear to explain a great deal , does not provide greater insight into
the construct of leadership . According to Davis and Lutherans, "leadership is a
relational and interactive construct in which one does not judge a manager's
leadership capacity by observing that person's behavior in isolation" (p.239).
Thus, studying leadership in a one-dimensional manner may not be a very useful
technique for the identification of critical components needed for the
understanding of adolescent perceptions of peer leadership.
Social Awareness Development
The use of Fiedler' s Contingency theory requires an individual to have a
high degree of social awareness. Social awareness may be defined as the ability to
identify and interpret social cues. Thus, to select an effective leader, individuals
must be aware and consider the interaction between interpersonal and situational
variables.
Selman (2003) identified two core social competencies in the development of
social awareness. The first core competency is identified as the ability to be aware
of one's own point of view. This encompasses the understanding of one's own
point of view as well as the ability to express it or to know when to keep it to
oneself. The second core competency includes the capacity to keep in mind the
point of view of another person, group or society as a whole.
Selman ( 1976) theorizes that there are five levels of social awareness
development in children. The first stage is referred to as the egocentric level; this
10
is characterized by the child's basic inability to recognize that others may interpret
the same actions and events in a different manner than they do. The second stage
is termed the subjective level, this refers to the unilateral or the "one-way" aspect
of relationships. Relationships are based on concrete acts and their prosocial
effects. It is during the next stage that relationships begin to be viewed as
reciprocal. Often these reciprocal attitudes toward each other are limited to
pragmatic or instrumental interests. In the fourth stage, the child recognizes that
people are multi-dimensional. Ironically, it is during this stage that the child over
generalizes the most salient traits of a person as the primary feature of the whole
person. It is not until the emergence of the final stage that there is a qualitative
difference in the way a child views peer relations. In this stage, relationships
involve a very interdependent process that includes the consideration of peers as
multi-dimensional entities that influence others differently across various contexts.
An increase in social awareness results in the development of core social
competencies. The first core competency entails the ability to take another's point
of view. This refers to a child's capacity to empathize and understand the social
implications that may be faced by others. A second important dimension of this
social competency is the movement away from physical attributes and toward
psychological attributes. The child moves away from concrete attributional
thinking ("I like him because he has a lot of toys") toward a more personality
attributional thinking ("I like him because he is nice"). The child places increasing
value on other factors, such as personality or intelligence.
11

Table 2
Selman's Stages of Social Awareness Development
Developmental Stage
Egocentric level
Preschool (ages 3-5)
Subjective level
Early elementary (ages 6- 7)
Reciprocal level
Upper elementary (ages 8- 11)
Mutual (third person) level
Middle school (ages 12- 14)
Societal (multidimensional) level
High School (ages 14 and up)
Description
Individual does not clearly differentiate the
perceptions of others from own perceptions.
Individual understands that own personal
perspective can be different from others.
Individual begins to understand another's
view their of own perception.
Individual understands perspective of others
in relation to self.
Individual understands own perspective
within the context of multiple perspectives.
An integration of Fiedler ' s Contingency model of leadership and Selman' s
development of interpersonal awareness suggests that a child's ability to select
appropriate peer leaders develops alongside the emergence of social awareness.
12
Based upon the theoretical work presented by Fiedler , leadership is a complex
combination ofleader personality , task demands , situation and interactional
characteristics within the group. However , according to Selman (1980) , children
do not begin to consider the interactional aspects of relationships until they have
reached the final stage of social awareness. Selecting a leader using Fiedler' s
Contingency model requires an individual to have a high level of social awareness.
This includes the cognitive ability to integrate and analyze the impact of all
relevant factors. Thus , younger children would be expected to rely heavily on
concrete and physical factors to choose peer leaders. For example , she (a peer) is
the captain of the team because she 's the one who owns the football. As children
move into the pre-adolescent stage they are more likely to choose leaders based on
an over-generalization of highly valued and salient personality characteristics , with
little consideration given to the situation or task demands , he (peer) is the student
council representative because he is popular and well-liked.
It is not until adolescents reach the last stage of social awareness that more
sophisticated methods of selecting peer leaders emerge. At this level, leaders are
chosen based upon the integration of personality traits , skill level and situational
factors. For example, she (peer) is the class president because she is intelligent ,
energetic , organized and well-liked. At this level , adolescents focus upon both
personality aspects and instrumental factors. Instrumental behaviors are defined as
skills or behaviors needed for an individual to successfully complete a particular
task.
13

The literature revealed that most of the research on leadership has been done
at the second stage (characterized by unilateral relationships), by studying
characteristics that seem to be found most commonly in leaders. Although this
approach provides some impo1iant data, it does very little to increase our
understanding of how adolescents perceive peer leaders .
14

Research Proposal
This project was designed to investigate the psychometric properties of a
theory-based measure of leadership in adolescents. This instrument was developed
based upon the available research on adolescent leadership. Data utilized in this
study was collected by the primar y investigator as part of a previous study . The
data collected was analyzed to address the following hypotheses:
1. The measurement scale conceptualized three primary dimensions that
adolescents consider when making judgments about leadership among peers (i .e.,
instrumental , physical, and personality) . This study sought to confirm a three
factor structure within the obtained sample . The three factors were expected to be
correlated.
Table 3
The Hypothesized Factor Structure:
Instrumental Physical Personality
1. Able to solve problems 4. Involved in many 2. Cooperative
activities
9. Well organized 6. Popular 3. Sensitive to
other' s feelings
12. Creative 7. A good athlete 5. A fun person
14. Intelligent 11. Good looking 8. Friendly
16. Hard worker 15. An older student 10. Honest
18. Able to take control 17. Talkative 13. Likeable
20 . Well dressed 19. Enthusiastic
15

2. Based upon Selman's stages of social development, as adolescents
become more socially aware, they will rely more on interactional properties to
make leadership choices. It was hypothesized that there would be significant
differences between the peer leader ratings completed by older (high school)
students and younger (middle school) students. Thus, two additional predictions
were proposed:
(a) Younger pre-adolescents will show a greater tendency to over
generalize one particular aspect of an individual in their selection of peer leaders
and relied more heavily on concrete (physical attributes) characteristics of the
nominated peers. Thus, middle school students would have higher scores on items
reflecting physical attributes of a peer leader than high school students.
(b) Older adolescent (high school students) leader choices would reflect the
recognition of the need to match leader traits with the demands of the situation. It
was expected that the older adolescents would be more able to recognize the
interactional properties of leadership and rate peer leaders in terms of a goodness
of-fit model. High school students would be expected to have higher scores on
items that assess instrumental aspects of a peer leader than middle school students.
16

Method
Subjects
The subjects in this study were both male and female students in the seventh
and twelfth grade of a southern Rhode Island public school system. This school
region encompasses several small , rural towns and was at the time of the survey
administration , primarily a White , working class community. The total sample
size was 255 students [176 seventh graders (69%) and 79 twelfth graders (31 %)].
The seventh grade sample consisted of72 males (41%) and 104 females (59%)
between the ages of 12 years, 3 months to 14 years, 6 months. The twelfth grade
sample comprised of 36 males (46%) and 43 females (54%), ranging in age from
17 years, 2 months to 19 years of age. The distribution of gender did not differ
across grade (x2 (1,255) = 0.485, p = .486).
Measures
This investigation was conducted with the use of a newly created leadership
instrument developed by the primary research investigator and supported by the
available research on leadership. Item selection was reviewed by a small group of
three school psychology graduate students to assess relevance, age-appropriateness
and readability of all scale items. The final survey consisted of a list of 20
characteristics on which the subjects rated a perceived peer leader on a 5-point
Likert scale. Likert scale choices ranged from "very true of this person" to "not
true of this person". The 20 items on the survey were categorized into three
attributional dimensions: instrumental, physical , and personality. The instrumental
scale included six items emphasizing peer traits useful in task completion (i.e.,
17
well organized , intelligent). The physical scale consisted of seven items stressing
highly salient and concrete features of an individual (i.e., good looking , popular ).
Finally, the personality scale was comprised of seven items focusing on
interpersonal skills of the potential leader (i.e., friendly , likeable). These three
dimensions were incorporated into three survey situations: student government ,
athletic team , and social committee .
Procedure
A short presentation (approximately 10 minutes) was given to students in the
seventh and twelfth grade during their social studies classes. Each presentation
included information regarding the nature of the surveys and the importance of
parental permission for the participation in the study. When parent consent forms
were sent back, students ' names were then placed on a list of students eligible for
continued participation.
The administration of all three surveys was completed by the primary
investigator approximately 3-5 weeks after the initial presentation. This study
primarily consisted of the administration of three separate survey situations to
students in the seventh and twelfth grade. Students who were not interested in
participating or did not return parent permission forms were given 10 minutes of
free time. In an attempt to control for any order effects , survey order was
counterbalanced.
Students were given standardized directions prior to the administration of
any survey (see Appendix B). Each survey required the students to think of a peer
that they perceived as an effective leader in each of the three situations: a student
18

government position , an athletic team position , and a social committee position.
The students were asked to rate the peer chosen for each situation on the 20 listed
characteristics. Students filled out one survey for each of the three leadership
positions during a single administration session. Total administration time for the
completion of the three survey forms was approximately 10 to 15 minutes.
To ensure student ' s privacy , students were instructed not to write their name
or any other identifying information on survey forms. Students were asked to
record their gender and the month and year of their birth (i.e., this was included
solely to get an estimated age range of participating students).
19
Results
Preliminary Analyses
Prior to any statistical analyses , the entire data set was checked for accuracy
and missing data points. Data from the entire sample was retained for analyses.
The results of descriptive statistic computations revealed that the item means
tended to fall within the higher end of possible scores with the highest item mean
of 4.62 on item number 5 on the social situation scale ("fun person"). The lowest
item mean was 2.21 found on the sport situation scale for item number 15 ("an
older student"). The item means and standard deviations are listed in Table 4.
20
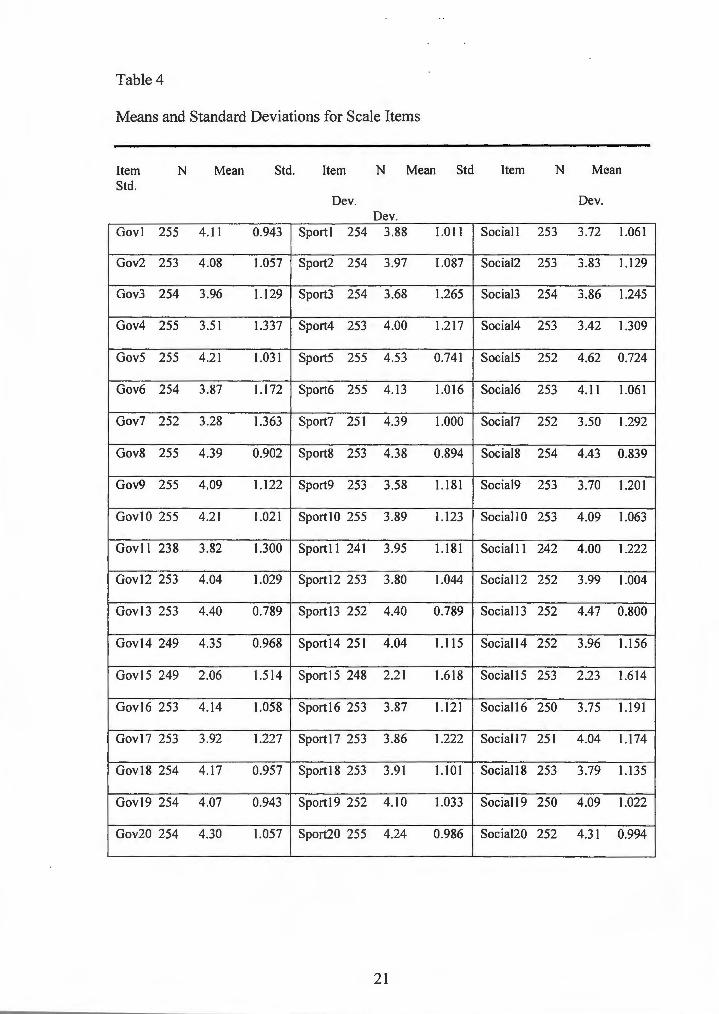
Table 4
Means and Standard Deviations for Scale Items
Item Std.
Gov !
Gov2
Gov3
Gov4
Gov5
Gov6
Gov7
Gov8
Gov9
N
255
253
254
255
255
254
252
255
255
GovIO 255
Gov] I 238
Govl2 253
Govl3 253
Govl4 249
Govl5 249
Govl6 253
Govl7 253
Govl8 254
Govl9 254
Gov20 254
Mean Std.
4 .11 0.943
4.08 1.057
3.96 1.129
3.51 1.337
4.21 1.031
3.87 1.172
3.28 1.363
4.39 0.902
4.09 1.122
4.21 1.021
3.82 1.300
4.04 1.029
4.40 0.789
4.35 0.968
2.06 1.514
4.14 1.058
3.92 1.227
4.17 0.957
4.07 0.943
4.30 1.057
Item N Mean Std
Dev. Dev.
Sportl 254 3.88 1.011
Sport2 254 3.97 1.087
Sport3 254 3.68 1.265
Sport4 253 4.00 1.217
Sport5 255 4.53 0.741
Sport6 255 4.13 1.016
Sport? 251 4.39 1.000
Sport8 253 4.38 0.894
Sport9 253 3.58 1.181
SportlO 255 3.89 1.123
Sport! l 241 3.95 1.18]
Sportl2 253 3.80 1.044
Sport13 252 4.40 0.789
Sportl4 251 4.04 1.115
Sportl5 248 2.21 1.618
Sportl6 253 3.87 1.121
Sport I 7 253 3.86 1.222
Sport I 8 253 3.91 I. I 01
Sport I 9 252 4.10 1.033
Sport20 255 4.24 0.986
21
Item N Mean
Dev.
Social! 253 3.72 1.061
Social2 253 3.83 1.129
Social3 254 3.86 1.245
Social4 253 3.42 1.309
Social5 252 4.62 0.724
Social6 253 4.11 1.061
Social? 252 3.50 1.292
Social8 254 4.43 0.839
Social9 253 3.70 1.201
Social JO 253 4.09 1.063
Social 11 242 4.00 1.222
Social12 252 3.99 1.004
Social13 252 4.47 0.800
Social14 252 3.96 1.156
Social15 253 2.23 1.614
Sociall6 250 3.75 I.I 91
Sociall7 251 4.04 1.174
Social18 253 3.79 1.135
Social19 250 4.09 1.022
Social20 252 4.31 0.994

A review of this data revealed that all items exhibited an acceptable amount
of variance which suggested that the item was able to discriminate between
subjects ' responses. The largest variances in scores was noted within item number
15 ("an older student") in the government (2.291 ), sport (2.617) and social (2.604)
situations. The lowest amount of variance within an item was found for item
number 5 ("a fun person") on the sport (0.550) and social situations (0.524),
respectively .
The item skewness and kurtosis were evaluated across all three survey
situations as an indicator of normality within the data distribution. Most items
were found to fall within the recommended guidelines of 2.0 for skewness and 4.0
for kurtosis (Tabachnich & Fidel , 2001). One item (item 5 on the social survey)
was found to slightly exceed the recommended limits in skew (-2.203) and kurtosis
(5.112). This suggested that the responses on this item tended to be tightly
distributed at the high end of possible scores. After careful consideration , the item
was retained due to the relatively small magnitude of the violation.
A review of the initial inter-item correlation matrix of all scale items
revealed no collinearity between scale items (i.e., no correlations exceeded .6). It
was interesting to note that the correlations of identical items across the three
situations were similarly low. The highest correlation of a set of identical items
across situations was found for item 15 ("an older student") ranging from .482 to
.551. Overall, this suggested that items appeared to function differently or
discriminate across each situation.
22
Survey Order Effects
A 6 x 9 MANOV A was completed to investigate the possibility of any order
effects between scale and situation despite the researcher ' s effort to
counterbalance survey order. The overall result suggested the presence of an order
effect , Wilks A= 0.719 , F(45, 835)= 1.421, p< .05, multivariate 112 = .064.
Follow-up analyses revealed a single order effect for the Instrumental skill scale
within the government situation, F(5, 194)= 2.335, p= .044, 112 = .057. A review of
Tukey tests revealed that there was a significant order effect only between the 2nd
and 5th orders of survey presentation. Higher scores were found for the
government Instrumental skills scale on the fifth order. Although these analyses
identified a significant order effect , the single occurrence of an order effect across
the multiple comparisons and the very small effect size for the order effect
suggests that it is not likely to represent a systematic order effect but rather seems
to be reflective of a random effect.
Principal Components Analysis
A principal components analysis (PCA) was chosen as a method to gain
further exploratory insight into the underlying component structure of the scale.
PCA provides an unconstrained analysis of the pattern of variance and covariance
among scale items.
The results of the PCA with a varimax rotation suggested that a three factor
solution for understanding the adolescent perceptions of peer leadership was
viable. This decision was based upon the review of several indices such as
Cattell' s scree plot procedure (Cattell, 1966), parallel analysis (Horn , 1965) and
23

theoretical relevance. The parallel analysis procedure compared the sample
produced set of eigenvalues to the average eigenvalue of a random data set of the
same sample size. Components are retained if the eigenvalues of this data set
exceed the eigenvalue of the random data set (Velicer et al., 2000). Finally,
theoretical considerations supported the retention of three components as
indicators of an Instrumental , Physical and Personality dimensions when assessing
adolescent perceptions of peer leaders.
As a result of the PCA, two scale items were discarded (i.e., "talkative" and
"older student") due to complex component loadings as well as low component
loadings across all three situations. The PCA results for the government , sport and
social situations are shown in Tables 5, 6 and 7, respectively.
24
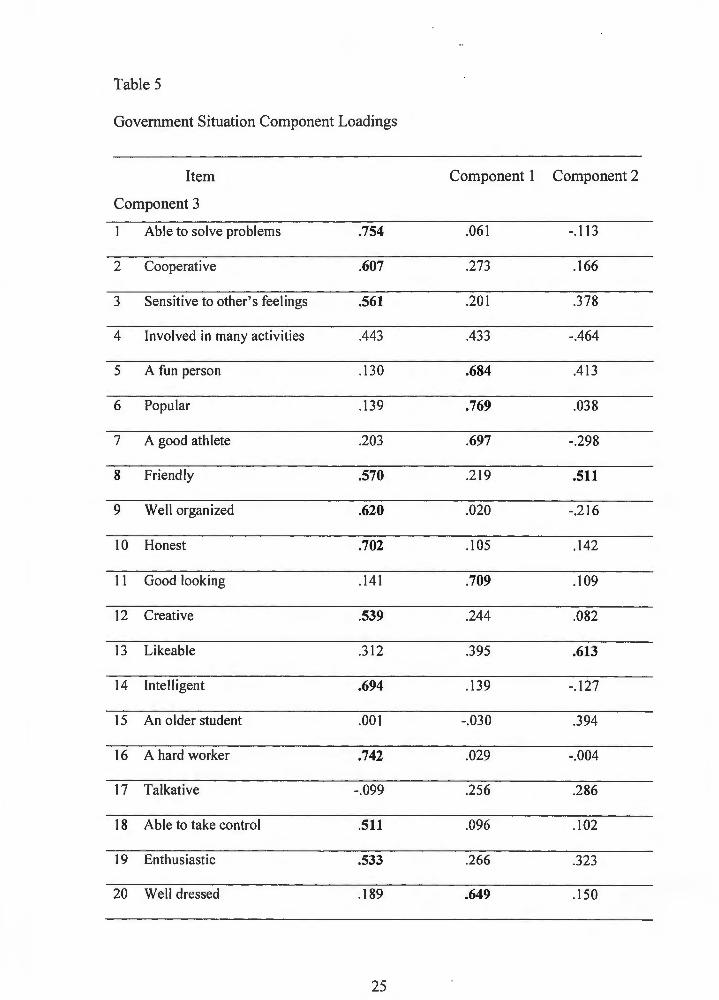
Table 5
Government Situation Component Loadings
Item Component 1 Component 2
Component 3
Able to solve problems .754 .061 -.I 13
2 Cooperative .607 .273 .166
3 Sensitive to other ' s feelings .561 .201 .378
4 Involved in many activities .443 .433 -.464
5 A fun person .130 .684 .413
6 Popular .139 .769 .038
7 A good athlete .203 .697 -.298
8 Friendly .570 .219 .511
9 Well organized .620 .020 -.216
10 Honest .702 .105 .142
I I Good looking .141 .709 .109
12 Creative .539 .244 .082
13 Likeable .312 .395 .613
14 Intelligent .694 .139 -.127
15 An older student .001 -.030 .394
16 A hard worker .742 .029 -.004
17 Talkative -.099 .256 .286
18 Able to take control .511 .096 .102
19 Enthusiastic .533 .266 .323
20 Well dressed .189 .649 .150
25
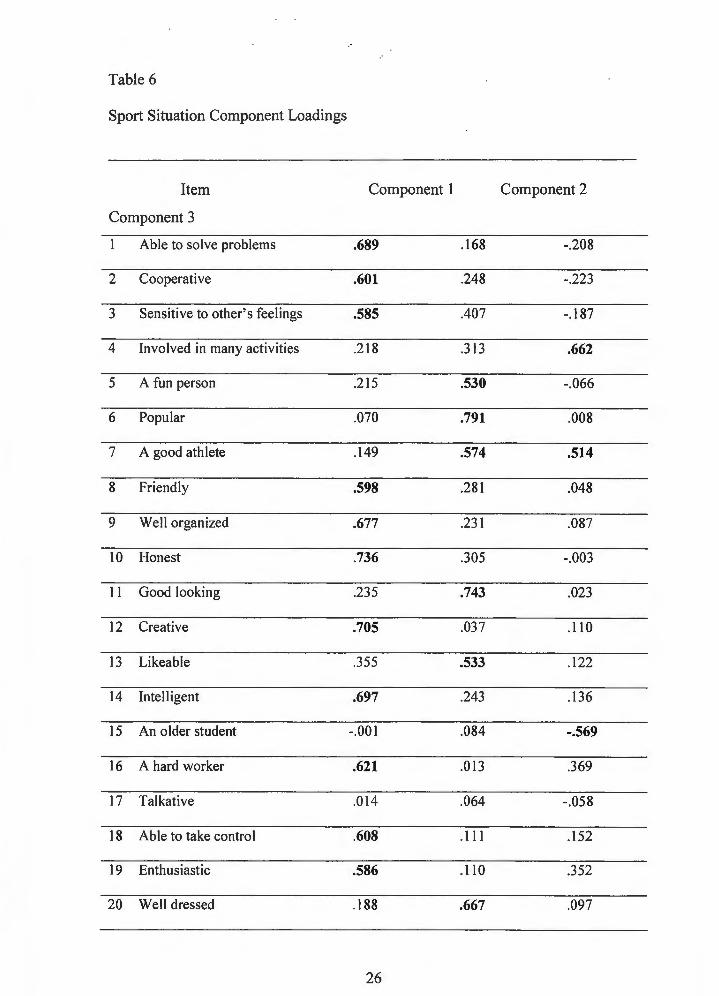
Table 6
Sport Situation Component Loadings
Item Component 1 Component 2
Component 3
Able to solve problems .689 .168 -.208
2 Cooperative .601 .248 -.223
3 Sensitive to other's feelings .585 .407 -.187
4 Involved in many activities .218 .313 .662
5 A fun person .215 .530 -.066
6 Popular .070 .791 .008
7 A good athlete .149 .574 .514
8 Friendly .598 .281 .048
9 Well organized .677 .231 .087
10 Honest .736 .305 -.003
11 Good looking .235 .743 .023
12 Creative .705 .037 .110
13 Likeable .355 .533 .122
14 Intelligent .697 .243 .136
15 An older student -.001 .084 -.569
16 A hard worker .621 .013 .369
17 Talkative .014 .064 -.058
18 Able to take control .608 .111 .152
19 Enthusiastic .586 .110 .352
20 Well dressed .188 .667 .097
26
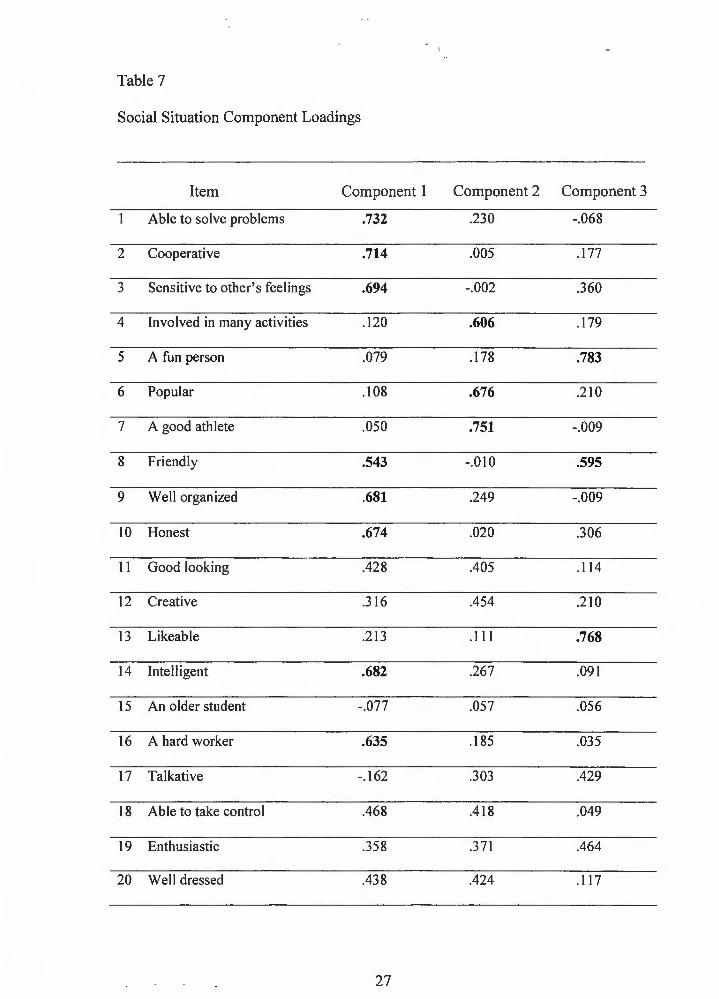
Table 7
Social Situation Component Loadings
Item Component 1 Component 2 Component 3
Able to solve problems .732 .230 -.068
2 Cooperative .714 .005 .177
3 Sensitive to other ' s feelings .694 -.002 .360
4 Involved in many acti vities .120 .606 .179
5 A fun person .079 .178 .783
6 Popular .108 .676 .210
7 A good athlete .050 .751 -.009
8 Friendl y .543 -.010 .595
9 Well organized .681 .249 -.009
10 Honest .674 .020 .306
11 Good looking .428 .405 .114
12 Creative .316 .454 .210
13 Likeable .213 .111 .768
14 Intelligent .682 .267 .091
15 An older student -.077 .057 .056
16 A hard worker .635 .185 .035
17 Talkati ve -.162 .303 .429
18 Able to take control .468 .418 .049
19 Enthusiastic .358 .371 .464
20 Well dressed .438 .424 .117
27
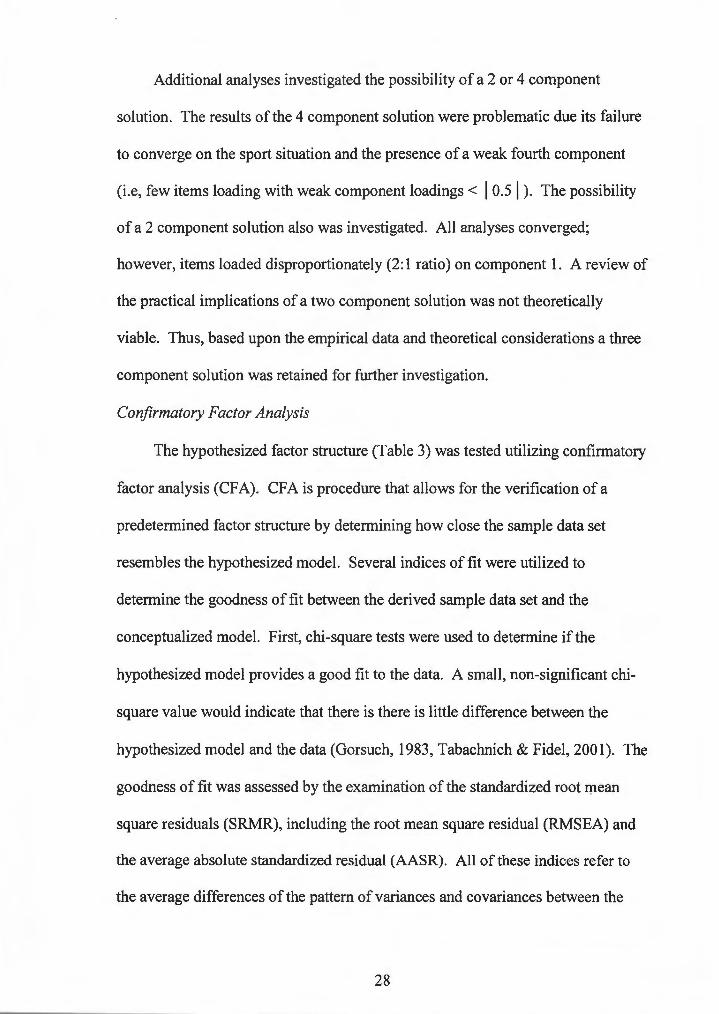
Additional analyses investigated the possibility of a 2 or 4 component
solution. The results of the 4 component solution were problematic due its failure
to converge on the sport situation and the presence of a weak fourth component
(i.e, few items loading with weak component loadings < I 0.5 I ). The possibility
of a 2 component solution also was investigated . All analyses converged;
however, items loaded disproportionately (2: 1 ratio) on component 1. A review of
the practical implications of a two component solution was not theoretically
viable. Thus, based upon the empirical data and theoretical considerations a three
component solution was retained for further investigation.
Confirmatory Factor Analysis
The hypothesized factor structure (Table 3) was tested utilizing confirmatory
factor analysis (CF A). CFA is procedure that allows for the verification of a
predetermined factor structure by determining how close the sample data set
resembles the hypothesized model. Several indices of fit were utilized to
determine the goodness of fit between the derived sample data set and the
conceptualized model. First , chi-square tests were used to determine if the
hypothesized model provides a good fit to the data. A small, non-significant chi
square value would indicate that there is there is little difference between the
hypothesized model and the data (Gorsuch , 1983, Tabachnich & Fidel , 2001). The
goodness of fit was assessed by the examination of the standardized root mean
square residuals (SRMR), including the root mean square residual (RMSEA) and
the average absolute standardized residual (AASR). All of these indices refer to
the average differences of the pattern of variances and covariances between the
28
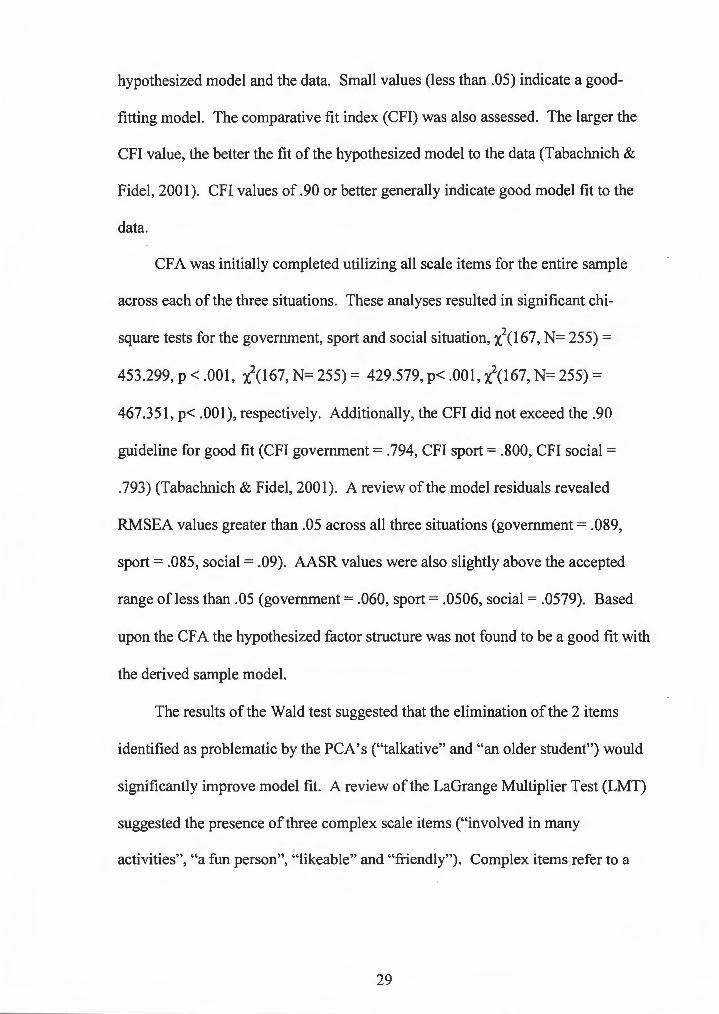
hypothesized model and the data. Small values (less than .05) indicate a good
fitting model. The comparative fit index (CFI) was also assessed . The larger the
CFI value , the better the fit of the hypothesized model to the data (Tabachnich &
Fidel , 2001 ). CFI values of. 90 or better generally indicate good model fit to the
data.
CF A was initially completed utilizing all scale items for the entire sample
across each of the three situations. These analyses resulted in significant chi
square tests for the government , sport and social situation , x2C167, N= 255) =
453.299, p < .001, :l(I67 , N= 255) = 429.579 , p< .001, x2C167, N= 255) =
467.351 , p< .001 ), respectively. Additionally , the CFI did not exceed the .90
guideline for good fit (CFI government = . 794, CFI sport = .800 , CFI social =
.793) (Tabachnich & Fidel , 2001). A review of the model residuals revealed
RMSEA values greater than .05 across all three situations (government= .089,
sport= .085, social= .09). AASR values were also slightly above the accepted
range of less than .05 (government = .060, sport = .0506 , social = .0579). Based
upon the CF A the hypothesized factor structure was not found to be a good fit with
the derived sample model.
The results of the Wald test suggested that the elimination of the 2 items
identified as problematic by the PCA's ("talkative " and "an older student") would
significantly improve model fit. A review of the LaGrange Multiplier Test (LMT)
suggested the presence of three complex scale items ("involved in many
activities", "a fun person" , "likeable " and "friendly "). Complex items refer to a
29

scale item that loads on more than one factor and creates ambiguity within
analyses .
Exploratory Analyses
Further analyses were completed for explorato ry purposes to refine the
Adolescent Perception of Peer Leader Effectiveness (APPLE) scale items.
Information from both the initial PCA and CF A suggested that several of the
original scale items were poor items. Based upon these analyses , six original items
were discarded (i.e., "involved in many activities" , "a fun person ", "likeable" ,
"friendly", "an older student" and "talkative").
A follow-up CF A was completed utilizing the revised version of the scale
(Table 8). The CF A results revealed an overall improvement in fit across all three
situations . Although the chi-square indices were significant [government: x2c74,
N=255) =123 .815, p< .001; sport: x2c74, N=255) =169 .553, p< .001; social: x2c74,
N=255) = 156.667, p< .001)], there was an improvement in the CFI across all
situations (government= .944, sport= .914, social= .917). Additional indices of
fit also demonstrated an overall improvement in RMSEA across situations
(government= .055, sport= .075, social= .070) and AASR (government= .0354,
sport= .0393, social= .0445). Overall, these findings suggested that the revised
Adolescent Perception of Peer Leader Effectiveness scale was a better fit to the
derived sample.
30

Table 8
Revised Scale Factor Loading Structure- Government Situation
Instrumental Loading Physical Loading Personal Loading
I. Able to solve problems . 73 6 . Popular .70 2 . Cooperative
9. Well organized . 53 7 . A good .51 3. Sensitive to others
athlete
12. Creative .55 II. Good .74 10. Honest
looking
14. Intelligent . 66 20 . Well- .69 I 9. Enthusiastic
dressed
16. Hard worker .70
18. Able to take control .49
Table 9
Revised Scale Factor Loading Structure- Sport Situation
Instrumental
Loading
I . Able to solve problems
9. Well organized
12. Creative
14. Intelligent
16. Hard worker
18. Able to take control
Loading Physical
.66 6. Popular
.73 7. A good athlete
.62 11. Good looking
. 71 20 . Well dressed
.57
.56
31
Loading Personal
.66 2. Cooperative
.53 3. Sensitive to others
.81 10. Honest
.68 19. Enthusiastic
.68
.61
.70
.61
.60
.63
.81
.54
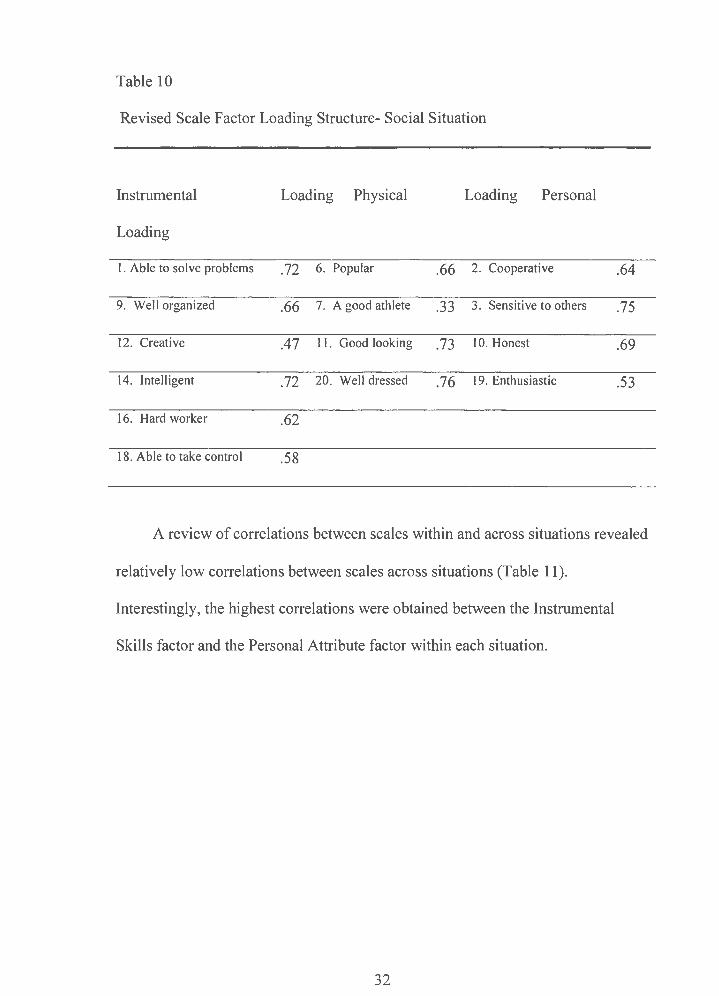
Table 10
Revised Scale Factor Loading Structure- Social Situation
Instrumental Loading Physical Loading Personal
Loading
I . Able to solve problems .72 6. Popular .66 2. Cooperative .64
9. Well organized .66 7. A good athlete .33 3. Sensitive to others .75
12. Creative .47 11. Good looking .73 10. Honest .69
14. Intelligent .72 20. Well dressed .76 19. Enthusiastic .53
16. Hard worker .62
18. Able to take control .58
A review of correlations between scales within and across situations revealed
relatively low correlations between scales across situations (Table 11 ).
Interestingly , the highest correlations were obtained between the Instrumental
Skills factor and the Personal Attribute factor within each situation :
32

Table 11
Revised Scale Correlations
Table 11
Revised Scale Correlations
Instrumental Loading Physical Loading Personal Loading
Gov . Gov. Gov. Sport Sport Sport Social Social Social
Inst. Phys . Pers . Inst. Phys. Pers. Inst. Phys. Pers.
Gov. Inst. 1.00
Gov. Phys. 0.34 1.00
Gov . Pers . 0.62 0.43 1.00
Sport Instr. 0.36 0.28 0.41 1.00
Sport Phys. 0.26 0.32 0.40 0.44 1.00
Sport Pers. 0.30 0.23 0.45 0.68 0.51 1.00
Social Instr. 0.25 0.36 0.34 0.30 0.25 0.33 1.00
Social Phys. 0.15 0.32 0.33 0.17 0.33 0.31 0.47 1.00
Social Pers. 0.15 0.25 0.35 0.15 0.23 0.29 0.69 0.42 1.00
Internal scale consistency was assessed for the three scales across all
scenarios (i.e. , government , sport , social) by calculating Cronbach ' s alpha (see
Table 12). All scores except the Physical Scale in the social situation obtained
adequate internal consistency value of . 70 or higher (De Vellis, 1991 ).
33

Table 12
Scale Means , Standard Deviations and Coefficient Alphas
Scales Number Cronbach ' s Mean Standard of Items Alpha Deviation
Government- 6 .78 24.91 4.22
Instrumental
Government- 4 .76 15.30 3.68
Physical
Government- 4 .73 16.37 3.15
Personal
Sport- Instrumental 6 .80 23.26 4.58
Sport- Physical 4 .75 16.82 3.14
Sport- Personal 4 .75 15.63 3.43
Social- Instrumental 6 .79 22.89 4.76
Social- Physical 4 .69 15.96 3.26
Social- Personal 4 .74 15.87 3.37
Alternati ve Model Comparisons
Four models (null , 1 factor , 3 factor uncorrelated, 3 factor correlated) were
constructed and tested to explore plausible alternative factor configurations for the
Adolescent Perception of Peer Leader Effectiveness scale (APPLE) across all three
situations . The Null model posits that there is no relationship between scale items.
This model was not considered to be a viable model , however , it is used for a
34

baseline comparison for which the remaining three models are compared. The 1-
Factor model is the most basic model and suggests that there is only one
underlying factor influencing adolescent perceptions of peer leader effectiveness.
An uncorrelated three factor model hypothesizes that there are three separate
independent factors that can explain adolescent perceptions of peer leaders.
Finally , the correlated three factor model would suggest that the three factors
utilized to explain adolescent perceptions are related constructs and may provide
evidence that there is a higher order construct for adolescent perceptions of peer
leaders.
The competing models of adolescent perceptions of peer leaders were
evaluated and compared across all three situations (see Tables 13, 14 and 15).
Table 13
Comparison of Measurement Models for the Government Situation
Model ?
df AASR RMSEA CFI p x-
Null Model 984 .558 91 0.2562 0.209 0.000 p < .001
I Factor 272 . 171 77 0.0552 0. 106 0.782 p < .001
Model
3 Factor 295.210 77 0.1846 0.112 0.756 p < .001
uncorrelated
3 Factor- 123.815 74 0.0354 0.055 0.944 p < .001
correlated
35

Table 14
Comparison of Measurement Models for the Sport Situation
Model ?
df AASR RMSEA CF! p x-
Null Model 1026.002 91 0.2928 0.232 0.000 p < .001
1 Factor 297.421 77 0.0553 0.112 0.803 p < .001
Model
3 Factor 426.388 77 0.1942 0.141 0.687 p < .001
uncorrelated
3 Factor- 169.553 74 0.0393 0.075 0.914 p < .001
correlated
Table 15
Comparison of Measurement Models for the Social Situation
Model ?
df AASR RMSEA CF! p x-
Null Model 1086.232 91 0.3553 0.219 0.000 p < .001
1 Factor 252.355 77 0.0516 0.100 0.824 p < .001
Model
3 Factor 358 .828 77 0.2382 0.128 0.716 p < .001
uncorrelated
3 Factor- 156.667 74 0.0445 0.070 0.917 p < .001
correlated
36
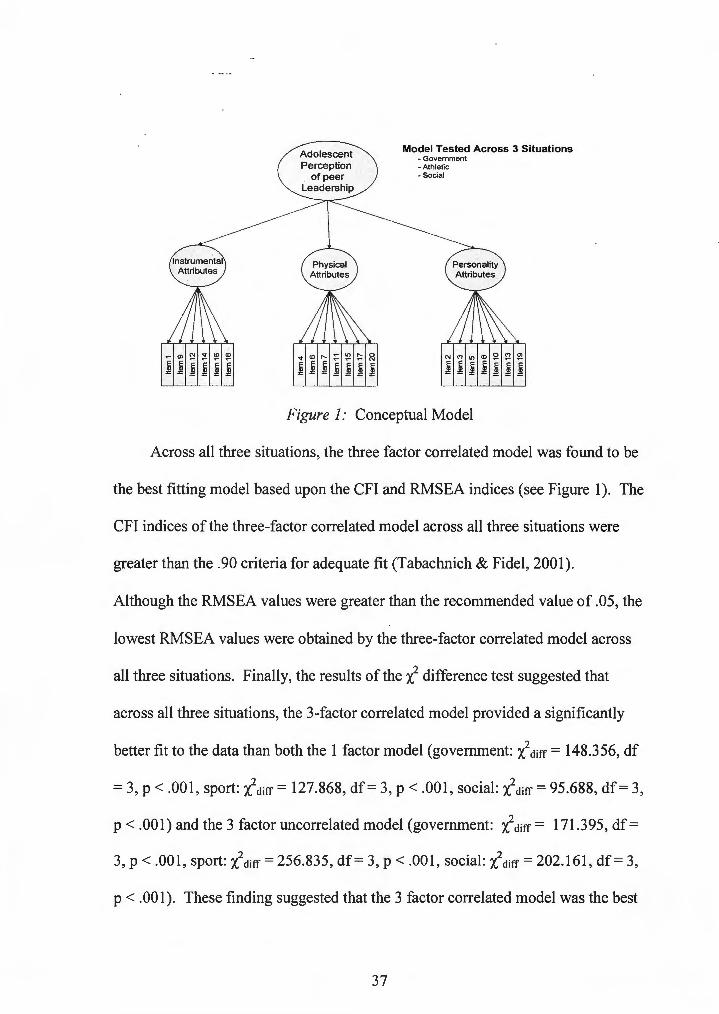
Adolescent Model Tested Across 3 Situations -Government -Athletic -Soc ial
Figure I: Conceptual Model
Across all three situations , the three factor correlated model was found to be
the best fitting model based upon the CFI and RMSEA indices (see Figure 1). The
CFI indices of the three-factor correlated model across all three situations were
greater than the .90 criteria for adequate fit (Tabachnich & Fidel, 2001).
Although the RMSEA values were greater than the recommended value of .05, the
lowest RMSEA values were obtained by the three-factor correlated model across
all three situations. Finally , the results of the x2 difference test suggested that
across all three situations, the 3-factor correlated model provided a significantly
better fit to the data than both the 1 factor model (government: x2diff = 148.356, df
= 3, p < .001, sport: X2diff = 127.868, df= 3, p < .001, social: x2
diff = 95.688, df= 3,
p < .001) and the 3 factor uncorrelated model (government: x2diff = 171.395, df=
3, p < .001, sport : X2<liff = 256.835 , df = 3, p < .001, social: x2
diff = 202.161 , df = 3,
p < .001). These finding suggested that the 3 factor correlated model was the best
37

fit to the data. The correlations between factors across the three situations are
provided in Jable 16.
Table 16
Maximum-likelihood Correlations between factors across situations
Situation Instrumental & Instrumental & Physical &
Physical Personality Personality
Government .42 .86 .56
Sport .54 .94 .65
Social .61 .87 .59
Between Group Analyses
A single 2x2x3 MANO VA was run to determine if there were age and
gender effects in adolescent perceptions of leadership . The overall results of the
MANOV A revealed no significant age differences across scales (Wilks' A= .995,
F (3, 194) = 0.347, p = .792) and no significant interaction between age and gender
(Wilks ' A= .971, F (3, 194) = 1.945, p = .124). However , there was a significant
difference noted between genders (Wilks' A= .924, F (3, 194) = 5.344, p < .001,
multivariate 112 = .076) with females rating peer leaders higher than males.
Follow-up ANOV A tests confirm this tendenc y for female students to rate peers
higher was consistent across all three scales : Instrumental scale F ( 1, 196) =
4.973, p = .027, 112 = .0275, Physical scale F (1, 196) = 7.223, p = .008, 112 = .036
and Personalit y scale F (1, 196) = 14.986, p < .001, 112 = .071.
38
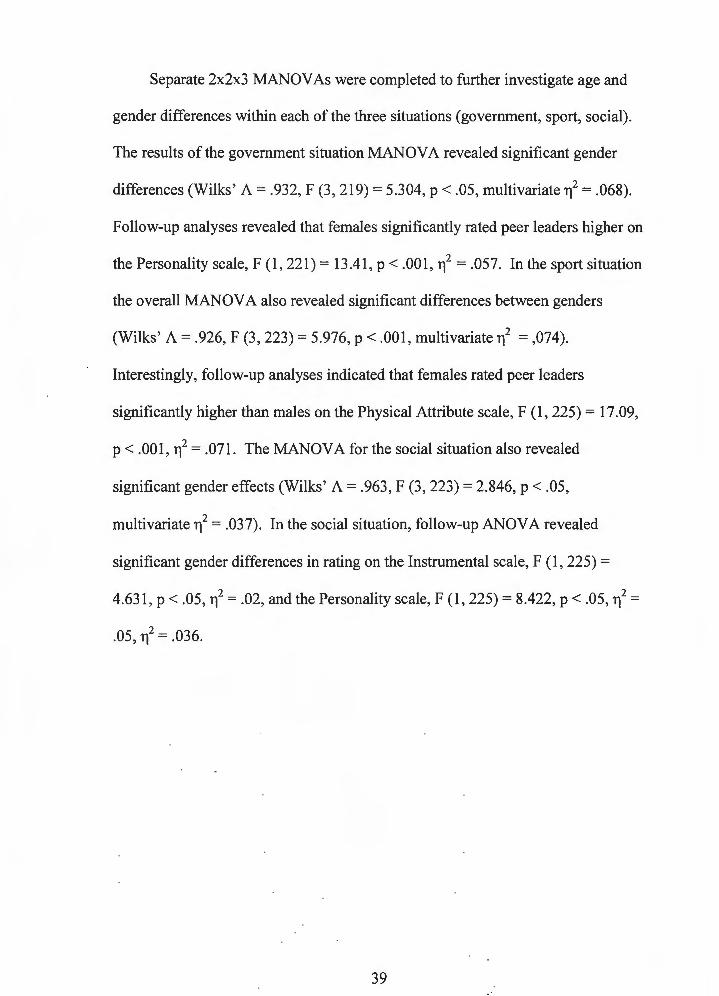
Separate 2x2x3 MANOVAs were completed to further investigate age and
gender differences within each of the three situations (government, sport , social).
The results of the government situation MANOVA revealed significant gender
differences (Wilks ' A= .932, F (3, 219) = 5.304, p < .05, multivariate 112 = .068).
Follow-up analyses revealed that females significantly rated peer leaders higher on
the Personality scale, F (1, 221) = 13.41, p < .001, 112 = .057. In the sport situation
the overall MANOV A also revealed significant differences between genders
(Wilks ' A= .926, F (3, 223) = 5.976, p < .001, multivariate 112 = ,074).
Interestingly , follow-up analyses indicated that females rated peer leaders
significantly higher than males on the Physical Attribute scale, F (1,225) = 17.09,
p < .001, 112 = .071. The MANOVA for the social situation also revealed
significant gender effects (Wilks ' A= .963, F (3, 223) = 2.846, p < .05,
multivariate 112 = .037). In the social situation , follow-up ANOV A revealed
significant gender differences in rating on the Instrumental scale, F (1, 225) =
4.631 , p < .05, 112 = .02, and the Personality scale, F (1, 225) = 8.422, p < .05, 112 =
.05, 112 = .036.
39

Discussion
Overall , the results of this investigation found some preliminary support for
the existence of a three-factor measurement model for adolescent perceptions of
peer leaders. Although the initial confirmatory factor analyses revealed that the
proposed underlying factor structure of the Adolescent Perceptions of Peer Leader
Effectiveness (APPLE) was not strongly supported by the available data,
exploratory post-hoc modifications significantly improved the model fit without
violating the context of the original model. A second finding revealed no
significant age differences between high school and middle school students in their
measured perceptions of peer leaders.
Measurement Issues
Adolescence is a time of great physical , emotional, cognitive and social
change. As part of this change process , adolescents shape their perceptions of
themselves and others around them. Little is known about how adolescents
conceptualize leadership . This is partly due to the overall sparse nature of
empirical research on adolescent leadership and partly due to the lack of published
measures of adolescent perceptions on leadership. In the process of developing the
APPLE scale, this research project focused on understanding and identifying the
dimensions that underlie adolescent perceptions of peer leaders.
Although the preliminary investigation of the underlying factor structure of
this scale revealed discrepancies between the hypothesized model and the current
sample , these analyses provided valuable insight for the revision of this scale. The
initial analyses of the adolescent perceptions of peer leader scale suggested the
40

presence of six poorly performing scale items. Two of these items ( e.g.,
"talkative" and "an older student") were deleted due to their failure to load
significantly on any factor and suggested that these items were not consistently
able to contribute to any of the hypothesized underlying constructs. Another four
items were deleted from the scale due to the complex nature of their relationship to
the three hypothesized factors (i.e., items loaded on more than 1 factor). These
post hoc revisions to the scale resulted in a 14 item questionnaire that not only
provided a statistical good fit to the data but also maintained the structure and
theoretical integrity of the original hypothesized model.
An analysis of the revised 14 item scale revealed that the three factor
structure (instrumental, physical , personality) was maintained across all three
scenarios (government, sport, social). It was noted that the factor structure was
most strongly supported within the government leadership scenario. One possible
explanation may lie in the fact that the government scenario is the most task
specific situation and that the strongest factor across all settings was the factor that
measured specific instrumental behaviors. In contrast, the social and sport
scenarios required multiple skill sets (i.e., instrumental abilities, personality skills
and physical attributes). Thus, the measurement of these additional skills may
have compromised the model fit due to the weaker nature of the factors structure
designed to measure personality and physical attributes. Overall, these findings
suggested that there is evidence that the general factor structure was consistent
across situations.
41

Social Awaren ess Developm ent in Adolescent Perceptions of Leadership
Additional analyses revealed that there were no significant age differences
noted between the high school and middle school students. However , a review of
group means revealed that middle school students on average endorsed items on
the all three scales at a higher rate than high school students. In addition , higher
variability of item responses was noted for the middle school' sample. These
findings suggest that a wider range of variability in the perception of effective peer
leaders within the middle school sample than the high school sample. Additional
research would be needed to determine if these differences are suggestive of a
developmental difference or a unique characteristic of this particular sample. At
this time, there appears to be very limited support for the role of social awareness
in the development of the perception of peer leaders .
Gender Differences
Interestingly, there was a significant gender difference in the way students
rated their perception of an effective peer leaders. Although both groups tended to
rate perceived leaders highly , both younger and older female students, on average,
rated their perception of effective leaders across all three scenarios significantly
higher than their male counterparts. This finding seems to suggest that female
students tended to support their perceptions of effective leadership with a stronger
endorsement of peer leaders ' abilities than male students. Furthermore , these
differences were not consistent across scales or situations. For example , in the
government situation females rated peer leaders significantly higher on the
Personality scale. In contrast , females rated peer leaders significantly higher in the
42
sport situation on the Physical scale. Lastly, females rated Instrumental and
Personality scales higher in the social situation. These finding suggest that
females may endorse scale items higher if the item is perceived as central to
successful leadership within a particular situation. Further research is needed to
determine if these differences are due to true differences in the perception of
effective peer leader or due to an overall tendency for females to respond higher to
Likert scale items.
Limitations and Future Research
There are several limitations to this study that are related to sampling issues.
First, the demographic composition of the sample did not represent a diverse group
of adolescents across several variables (i.e., age, ethnicity, socio-economic status).
Next, there was a large discrepancy between the middle school and high school
sample sizes. Thus, analyses were more heavily weighted by the middle school
sample. Additionally, the relatively small high school sample made separate PCA
and CF A for the high school sample statistically problematic. Finally, sample size
was not large enough to conduct a split-half cross-validation of the model, thus
true confirmatory analyses were not possible.
Another limitation of this study concerns the post hoc refinement of this
scale. Due to these follow-up analyses, two factors (Personality skills, Physical
attributes) have been reduced to four items. Although the paring down of the
original scale was justified statistically and theoretically and maintained adequate
coefficient alphas , this resulted in a weakening of the Personality and Physical
attribute scales.
43

Finally , this study is limited due to its cross-sectional design . These results
are reflective of a single point in time and limited conclusions can be made about
the consistenc y over time for the factor structure of this measurement of
adolescent perception. Although the conclusions are somewhat limited , this
project was able to provide some preliminary support for the hypothesized 3-factor
structure by demonstrating that the same 3-factor structure was consistent across
three situations .
This study has several implications for future research. First , there is the
need to verify the post hoc revisions made to this scale on an independent sample.
Once independent verification of the measurement model has been established, the
next step would be to administer the scale to another sample for replication of the
model. Once the measurement scale has been verified and replicated , future
research can address more specific issues raised within this project regarding the
role of gender , age and social awareness in the development of adolescent
perceptions of effective peer leadership.
44

Appendices
Appendix A
Consent Form
To: Parents and Students
From: C. Stephan
Date:
A survey of young people's understanding of social relations is being conducted in the Chariho high school. Students from the seventh and twelfth grade have been selected to participate . This project has been authorized as part of the education and research program at the University of Rhode Island under the supervision of Dr. Janet Kulberg, Dr. Jacqueline Wilk, and Dr. Joseph Rossi.
Students will be asked to complete three surveys concerning the characteristics they value in three peer leadership situations . Each survey will take approximately five to ten minutes to complete. The entire project will be completed during one classroom period. Participation is voluntary and students are free to refuse to answer any specific item or questions. Students will be told not to include any identifying information and responses will be coded by age and sex. Every possible precaution will be taken to insure student confidentiality.
The investigator and the school administrators do not foresee any harm or risk to students as a result of their participation. If there are any concerns or questions, please call Ms. Stephan at 783-1211. Otherwise, please return this form to the school as soon as possible.
Thank you for your cooperation.
My son/daughter, ___________________ _
_______ may participate in this research project.
_______ may not participate in this research project.
Date Signature of parent or guardian
45

Appendix B
Directions
"You and other students in the school have been selected to be part of a
research project about what students think about different types of leaders. You
will be handed a three-page survey with some questions on it. This is not a test.
There are no right or wrong answers. The investigators would like you answer this
survey the way you really think. This is a voluntary project, if there are some
questions or items which you are not comfortable answering, you may choose not
to respond to those particular items. When you have completed the survey, please
turn the sheet over on your desk. These forms will be collected and put in a sealed
envelope. No one but the people working on this project from the University of
Rhode Island will see your paper. If you have any questions just raise your hand.
(Hand out forms)
Now in the top right hand corner of the page, please write down the month
and year that you were born. Do not write your name or any other identifying
information on your paper. Remember if you have any questions raise your hand.
You may begin. "
46
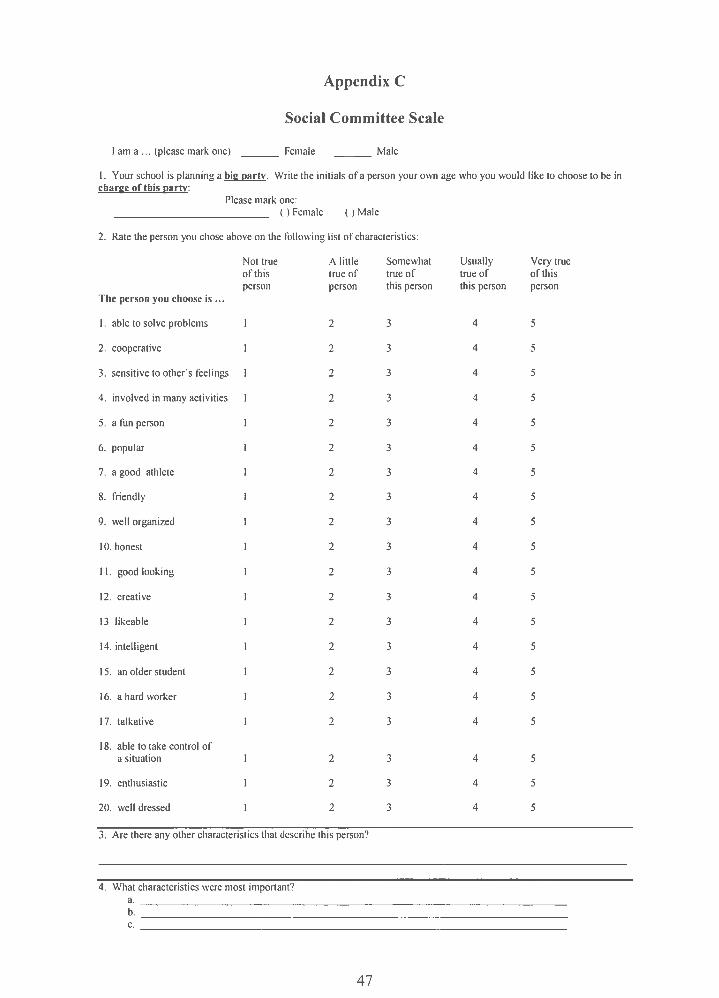
Appendix C
Social Committee Scale
I am a ... (please mark one) Female Male
I. Your school is planning a big partv. Write the initials ofa person your own age who you would like to choose to be in charge of this partv:
Please mark one: () Female () Male
2. Rate the person you chose above on the following list of characteristics:
Not true A little Somewhat Usually Very true of this true of true of true of of this person person this person this person person
The person you choose is ...
I. able to solve problems 2 3 4 5
2. cooperative 2 3 4 5
3. sensitive to other's teelings 2 3 4 5
4. involved in many activities 2 3 4 5
5. a fun person 2 3 4 5
6. popular 2 3 4 5
7. a good athlete 2 3 4 5
8. friendly 2 3 4 5
9. well organized 2 3 4 5
10. honest 2 3 4 5
11. good looking 2 3 4 5
12. creative 2 3 4 5
13 likeable 2 3 4 5
14. intelligent 2 3 4 5
15. an older student 2 3 4 5
16. a hard worker 2 3 4 5
17. talkative 2 3 4 5
18. able to take control of a situation 2 3 4 5
19. enthusiastic 2 3 4 5
20. well dressed 2 3 4 5
3. Are there any other characteristics that describe this person?
4. What characteristics were most important?
a. ----------------------------------b. ----------------------------------c. ----------------------------------
47
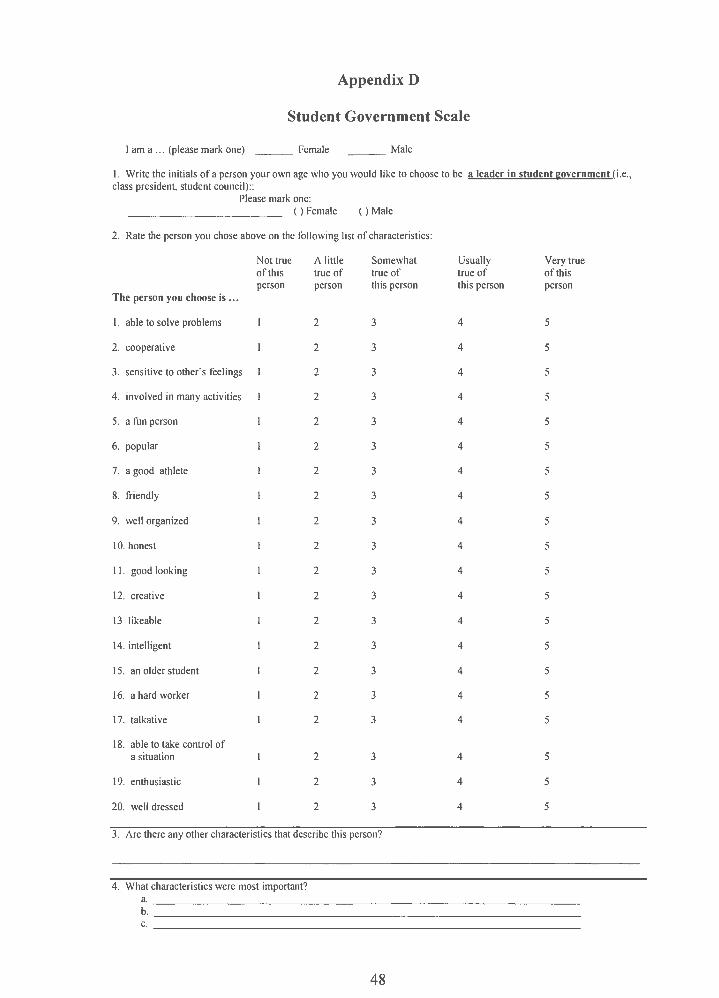
Appendi x D
Student Government Scale
I am a ... (please mark one) Female Male
1. Write the initials of a person your own age who you would like to choose to be a leader in student government (i.e., class president, student council)::
Please mark one: ( ) Female ( ) Male
2. Rate the person you chose above on the following list of characteristics:
Not true A little Somewhat Usually Very true of this true of true of true of of this person person this person this person person
The person you choose is ...
I. able to solve problems 2 3 4 5
2. cooperative 2 3 4 5
3. sensitive to other's feelings 2 3 4 5
4. involved in many activities 2 3 4 5
5. a fun person 2 3 4 5
6. popular 2 3 4 5
7. a good athlete 2 3 4 5
8. friendly 2 3 4 5
9. well organized 2 3 4 5
IO. honest 2 3 4 5
1 I. good looking 2 3 4 5
12. creative 2 3 4 5
13 likeable 2 3 4 5
14. intelligent 2 3 4 5
15. an older student 2 3 4 5
16. a hard worker 2 3 4 5
17. talkative 2 3 4 5
18. able to take control of a situation 2 3 4 5
19. enthusiastic 2 3 4 5
20. well dressed 2 3 4 5
3. Are there any other characteristics that describe this person?
4. What characteristics were most important9
a. --- - - -- - -- - -- - - - -- ---- -- - -- - - -- - - -b. - - -- - -- -- ---- - - - - ------ - ------- - - -c. --- ---- - ----- - ----- ---- - - ---- - -- --
48
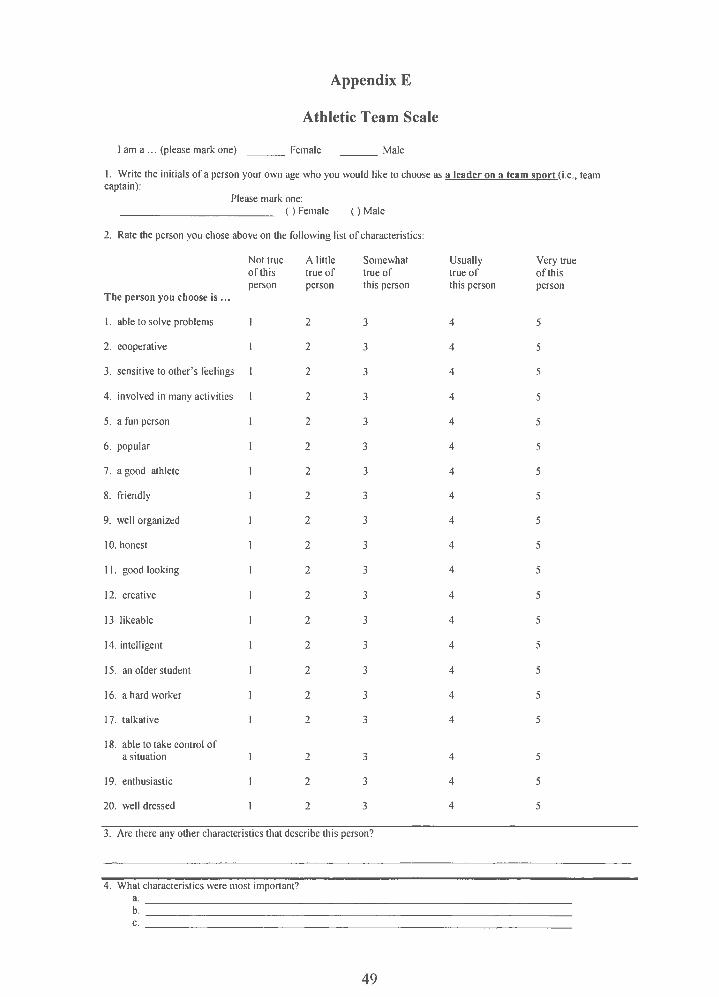
Appendi x E
Athletic Team Scale
I am a ... (please mark one) Female Male
I. Write the initials of a person your own age who you would like to choose as a leader on a team sport (i.e., team captain):
Please mark one: () Female () Male
2. Rate the person you chose above on the following list of characteristics:
Not true A little Somewhat Usually Very true of this true of true of true of of this person person this person this person person
The perso n you choose is .. .
I. able to solve problems 2 3 4 5
2. cooperative 2 3 4 5
3. sensitive to other's feelings 2 3 4 5
4. involved in many activities 2 3 4 5
5. a fun person 2 3 4 5
6. popular 2 3 4 5
7. a good athlete 2 3 4 5
8. friendly 2 3 4 5
9. well organized 2 3 4 5
IO. honest 2 3 4 5
I I. good looking 2 3 4 5
12. creative 2 3 4 5
13 likeable 2 3 4 5
14. intelligent 2 3 4 5
15. an older student 2 3 4 5
16. a hard worker 2 3 4 5
17. talkative 2 3 4 5
18. able to take control of a situation 2 3 4 5
19. enthusiastic 2 3 4 5
20. well dressed 2 3 4 5
3. Are there any other characteristics that describe this person?
4. What characteristics were most important?
a. - -- -- -- -- - ------ --- ---- ---- -- -----b. ----------- - -- -- ---------- ---- ----c. ----------- -- - - ---- - ------ ---- ----
49

Bibliography
Asher, S. R, Markell , R . A. & Hymel , S. (1981 ). Identifying children at risk in
Peer relations : A critique of the rate-of-interaction approach to assessment.
Child Development , 52 (4), 1239- 1245 .
Bean , S. M. , & Karnes , F. A. (2001). Developing leadership potential of gifted
students . In F. A. Karnes & S. M. Bean (Eds.) , Methods and materials for
teaching the gifted (pp. 559-586). Waco , TX: Prufrock Press.
Blank, T. 0. (1986) . What high school leaders think of leadership. High School
Journal. 69, 207-213.
Breckenridge , M. E. , & Vincent , E. L. (1965). Child development. Philadelphia:
Saunders.
Catell , R. B. (1966). The scree test for number of factors. Multivariate Behavioral
Research, I, 245-276
Davis , T. R. , & Luthans , F. (1984). Defining and researching leadership as a
behavioral construct: An idiographic approach. Journal of Applied
Behavioral Sciences . 20, 237-251.
DeVellis, R. F. (2003). Scale development : Theory and applications (2nd Ed.).
Newbury Park : Sage Publications.
Dobosz , R. P. , & Beaty , L.A. (1999). The relationship between athletic
participation and high school students' leadership ability. Adolescence , 34
(133), 215- 220.
Fiedler , F. E. (1978). Recent developments in research on the contingency model.
In L. Berkowitz (ed.) . Group Processes. New York: Academic Press.
50
Fiedler , F. E. (1967). A theory of leadership effectiveness. New York: McGraw
Hill.
Fleming , E.G. (1935). A factor analysis of the personality of high school leaders.
Journal of Applied Psychology, 42, 267-284.
Fu, V. R., Canaday , H., & Fu, D. T. (1982) . Creativity and leadership in
preschoolers . The Journal of Genetic Psychology , 141, 291-292 .
Gorsuch , R. L. (1983). Factor analysis . (2nd ed.). Hillsdale, NJ: Lawrence
Erlbaum Associates .
Gouldner, A. (1950). Studies in leadership. New York: Harper & Row.
Guadagnoli, E. , & Velicer , W. F. (1988). Relation of sample size to the stability
of component patterns. Psychological Bulletin , 103(2), 265- 275 .
Hannah , M. E. (1979). High school situational and personal components.
Journal of Psychology , 103, 163-168.
Hook , S. (1955) . The hero in history. Boston: Beacon Press.
Horn , J. (1965) . A rationale and test for the number of factors in factor analysis.
Psychometrika , 30, 179-185.
Klonsky , B. G. (1983) . The socialization and development of leadership. Genetic
Psychology Monographs, 108, 98- 135.
Lautenschlager , G. J. (1989). A comparison of alternatives to conducting Monte
Carlo analyses for determining parallel analysis criteria. Multivariate
Behavioral Research, 24(3), 365- 395.
51

McCullough , P. M., Ashbridge, D. & Pegg , R. (1994). The effect of self-esteem ,
family structure , locus of control and career goals on adolescent leadership
behavior. Adolescence , 29 (115), 605- 611.
Morris , C. G., & Hackman , J. R. (1969) . Behavioral correlations of perceived
leadership. Journal of Personality and Social Psychology , 13, 350-361.
Nutting , R. L. (1976). Some characteristics of leaderships. School and Society ,
18, 387-390.
Oakland, T., Falkenberg , B. A., & Oakland , C. (1996). Assessment of leadership
in children , youth and adults. Gifted Child Quarterly , 40 (3), 138- 146
Oppenheimer , L., & Thijssen , F. (1983). Children ' s thinking about friendships
and its relation to popularity. The Journal of Psychology , 114, 69-78.
Peery , J. C. (1979). Popular , amiable , isolated, rejected: A reconceptualization of
sociometric status in preschool children. Child Development , 50, 1231-1234.
Scales , P. C., Benson , P. L., & Leffert, N. (2000). Contribution of developmental
assets to the prediction of thriving among adolescents. Applied
Developmental Science, 4(1), 27-46.
Schneider , B., Ehrhart , K. H. & Ehrhart, M. G. (2002). Understanding high
school leaders II. Peer nominations of leaders and their correlates. The
Leadership Quarterly , 13, 275- 299.
Selman, R. L. (2003). The promotion of social awareness: Powerful lessons from
the partnership of developmental theory and classroom practice . New
York: Russell Sage Foundation.
52

Selman , R. L. (1980). The growth of interpersonal understanding :
Developmental and clinical analyses. New York : Academic Press .
Selman , R. L. (1976). Toward a structural analysis of developing interpersonal
relations concepts: Research with normals and disturbed adolescent boys. In
A. Pick (Ed.) , Tenth annual Minn esota symposium on child psychology.
(pp. 156-200). Minneapolis: University of Minnesota Press.
Simonton , D. F. (1979). Multiple discovery and invention: Zeitgeist, genius or
chance? Journal of Personality and Social Psychology , 37, 1603-1616.
Suedfeld, P., & Rank, A. D. (1976). Revolutionary leaders: Long-term success as
a function of changes in conceptual complexity. Journal of Personality and
Social Psychology , 3 4, 169-178.
Tabachnick , B. G., & Fidell , L. S. (2001). Using multivariate statistics. (41h Ed.).
Boston: Allyn & Beacon.
Velicer , W. F. (1976). Determining the number of components from the matrix of
partial correlations. Psychometrika , 41(3), 149-159.
Velicer, W. , Eaton , C., & Fava , J. (2000). Construct explication through factor of
component analysis: A review and evaluation of alternative procedures for
determining the number of factors or components. In R. Griffin , & E.
Helmes (Eds.), Problems and Solutions in Human Assessment : A Festschrift
to Douglas Jackson at Seventy . Boston : Kluwer Academic Publishers.
Wood , F. A. (1913). The infh1ence of monarchs. New York: Macmillan.
53
Zakin, D. F. (1983). Physical attractiveness, sociability , athletic ability and
children ' s preferences for their peers. The Journal of Psychology, 115, 117-
112.
54