Embed Size (px)
Citation preview
RESEARCH ARTICLE Open Access
Chloroplast genomes as a tool to resolvered algal phylogenies: a case study in theNemalialesJoana F. Costa1*, Showe-Mei Lin2, Erasmo C. Macaya3,4, Cindy Fernández-García5 and Heroen Verbruggen1
Abstract
Background: Obtaining strongly supported phylogenies that permit confident taxonomic and evolutionary interpretationshas been a challenge in algal biology. High-throughput sequencing has improved the capacity to generate data and yieldsmore informative datasets. We sequenced and analysed the chloroplast genomes of 22 species of the order Nemaliales asa case study in the use of phylogenomics as an approach to achieve well-supported phylogenies of red algae.
Results: Chloroplast genomes of the order Nemaliales are highly conserved, gene-dense and completely syntenic withvery few cases of gene loss. Our ML estimation based on 195 genes recovered a completely supported phylogeny,permitting re-classification of the order at various taxonomic levels. Six families are recognised and the placement ofseveral previously contradictory clades is resolved. Two new sub-orders are described, Galaxaurineae and Nemaliineae,based on the early-branching nature and monophyly of the groups, and presence or absence of a pericarp. Analyses ofsubsets of the data showed that >90 % bootstrap support can be achieved with datasets as small as 2500 nt and thatfast and medium evolving genes perform much better when it comes to resolving phylogenetic relationships.
Conclusions: In this study we show that phylogenomics is an efficient and effective approach to investigate phylogeneticrelationships. The six currently circumscribed Nemaliales families are clustered into two evolutionary lineages with strongstatistical support based on chloroplast phylogenomic analyses. The conserved nature of red algal chloroplast genomes isa convenient and accessible source of data to resolve their ancient relationships.
Keywords: Plastid genomes, Chloroplast phylogenomics, Red algae, Nemaliales, Conserved genomes
BackgroundMolecular phylogenies are the cornerstone of biodiver-sity and evolutionary research but many phylogeneticrelationships are contradictory or not known withcertainty, for example due to low statistical support. Oneof the major challenges in designing phylogenetic studiesis to decide how much molecular data is needed toachieve a satisfactory result [1, 2].High throughout sequencing (HTS) techniques have
made the acquisition of multilocus datasets easy, evenfor non-model organisms. Their use has become com-mon practice for comparative and phylogenetic analysesof entire genomes (phylogenomics). This provides uswith insights not only into phylogenetic relationships
but also how other features of the genome (e.g. genomesynteny, gene loss, intergenic regions) evolve. Whileobtaining eukaryotic nuclear genomes still presentssignificant challenges in terms of sequencing coverage,assembly and annotation [3], for photosynthetic organ-isms there is a more accessible alternative - their plastidgenomes.Chloroplast genomes are an attractive option for phy-
logenomic studies for various reasons. First of all, theyare present in multiple copies in each cell, thereforechloroplast DNA (cpDNA) data is easily obtained frombulk DNA extractions. Additionally, they are relativelysmall in size (~100-190 kb) and exhibit low variability ingene content and (in some groups) gene arrangement[4], meaning that assembly and annotation are straight-forward. Furthermore, the non-recombinant nature ofplastids makes them a good tool when inferring ancientphylogenetic relationships [5].
* Correspondence: [email protected] of BioSciences, University of Melbourne, Parkville, VIC 3010, AustraliaFull list of author information is available at the end of the article
© 2016 The Author(s). Open Access This article is distributed under the terms of the Creative Commons Attribution 4.0International License (http://creativecommons.org/licenses/by/4.0/), which permits unrestricted use, distribution, andreproduction in any medium, provided you give appropriate credit to the original author(s) and the source, provide a link tothe Creative Commons license, and indicate if changes were made. The Creative Commons Public Domain Dedication waiver(http://creativecommons.org/publicdomain/zero/1.0/) applies to the data made available in this article, unless otherwise stated.
F. Costa et al. BMC Evolutionary Biology (2016) 16:205 DOI 10.1186/s12862-016-0772-3
The oldest eukaryotic fossil is believed to be a red alga(Bangiomorpha pubescens) dated as being 1.2 billionyears old [6]. However resolving the red algal tree of lifehas been challenging with the relationships betweenFlorideophyceae – the most diverse class of red algae –especially difficult to resolve. While the five florideo-phyte subclasses are well supported, within these line-ages many early-branching nodes are yet to be resolved[1, 7, 8]. A study comparing ten red algae chloroplastgenomes showed the potential of plastid phylogenomicsto unravel relationships among red algal classes andtheir constituent lineages [9]. Among the eukaryoteswith primary plastids (Archaeplastida), red algal chloro-plast genomes are the most conserved and have thehighest gene content [9, 10]. This is a potential perfectcombination of features to resolve the ancient relation-ships among red algal groups: a conserved architectureof the genome, which simplifies data processing, and ahigh number of genes that are likely to hold enoughphylogenetic signal.A persistent problem within the Florideophyceae is
found in the order Nemaliales. The Nemaliales belong tothe subclass Nemaliophycideae, one of the earliestbranching clades within the florideophytes. Molecularclocks suggest that the Nemaliales diverged from otherNemaliophycideae lineages approximately 200 Ma ago[8]. There are 276 species of Nemaliales currentlydescribed [11] distributed across 34 genera and 6 fam-ilies. The Liagoraceae is the most species-rich family,followed by the Scinaiaceae and Galaxauraceae. Threemonogeneric families have been recently recognised: there-instated Nemaliaceae and the new Yamadaellaceaeand Liagoropsidaceae [12]. However, the phylogeneticrelationships among these six families have not beenresolved with confidence and we lack a comprehensivereference phylogeny for the group. The placement ofScinaiaceae has been contradictory in previous studies[12–14] and the relationships between the remainingfamilies have low support [12]. The early brancheswithin the Liagoraceae also have low support [12, 15].Analyses of whole cpDNA genomes greatly improved
phylogenetic resolution in the green plant lineage [16–20].Despite its promising features, chloroplast phylogenomicshas not been widely applied to resolve phylogenetic rela-tionships among red algae. The Nemaliales are a goodmodel to assess the utility of plastid phylogenomics in redalgae - an old photosynthetic group with ambiguousphylogenetic relationships.This study aims to (1) characterize chloroplast ge-
nomes of Nemaliales, (2) use the data to reconstruct awell-supported phylogenetic tree and, based on theseresults, (3) revise the classification of the order and (4)evaluate the utility of chloroplast phylogenomics inred algae. Our approach consists of high-throughput
sequencing of a phylogenetically diverse set of Nemalialesspecies, comparison of genomes across the group, andphylogenetic analyses of the complete dataset and subsetsthereof.
MethodsTaxon sampling and sequencingWe selected 19 taxa representing the six families ofNemaliales and 3 closely related outgroup species fromthe orders Palmariales and Acrochaetiales (Table 1).Genomic DNA was isolated from silica gel dried tissue
or herbarium vouchers using an adapted CTAB protocol[21]. In brief, samples were incubated at 60 °C for anhour in CTAB buffer with proteinase K and DNA wasextracted in two subsequent steps with 24:1 chlorofor-m:isoamyl alcohol. DNA was precipitated in 80 % iso-propanol at 4 °C for 2 h and eluted in 0.1× TE buffer.Library preparation and sequencing was performed
either at the Georgia Genome Facility (University ofGeorgia, GA, USA) or at the Genome Center of theCold Spring Harbor Marine Laboratory (NY, USA) usingdifferent Illumina platforms (Additional file 1). For thefirst sequencing run, libraries of 350 nucleotide (nt) frag-ments were prepared from DNA extracts of each sampleusing a TruSeq Nano LT kit. Each library was given aunique barcode and sequenced on the Illumina HiSeq2000 platform. Because the laboratory at the Universityof Melbourne is carrying out chloroplast genome pro-jects of green and red algae, for subsequent runs wepooled DNA extracts of a red and a green alga, resultingin substantial savings for library preparation. For these, li-braries of 500 nt fragments were prepared using a KAPA-BIOSYSTEMS DNA Library Preparation Kit (KK8232)and sequenced on either HiSeq 2500 or NextSeq 500.
Assembly, annotation and syntenyAssembly and annotation followed [22]. In brief, originalsequencing reads were trimmed with CLC GenomicsWorkbench 7.5.1 (CLC bio, Aaarhus, Denmark) with aquality threshold of 0.05 and de novo assembly wasperformed in both CLC Genomics Workbench 7.5.1and MEGAHIT v0.1.2 [23]. In CLC, assembly was per-formed with automatic k-mer size and default parame-ters. In MEGAHIT, we used 10 kmer sizes (21–91 insteps of 10 and 99).Chloroplast contig sequences were identified with
blastx searches against a custom-built database contain-ing known plastid genes of Florideophyceae. Contigsidentified as cpDNA from Nemaliales were imported toGeneious 6.1.7 where any ambiguities were resolved bymapping original reads (medium sensitivity, up to 5 iter-ations). Different assemblers gave similar results, withcontigs often having a different starting position in thegenome. The circular-mapping nature of the genomes
F. Costa et al. BMC Evolutionary Biology (2016) 16:205 Page 2 of 13
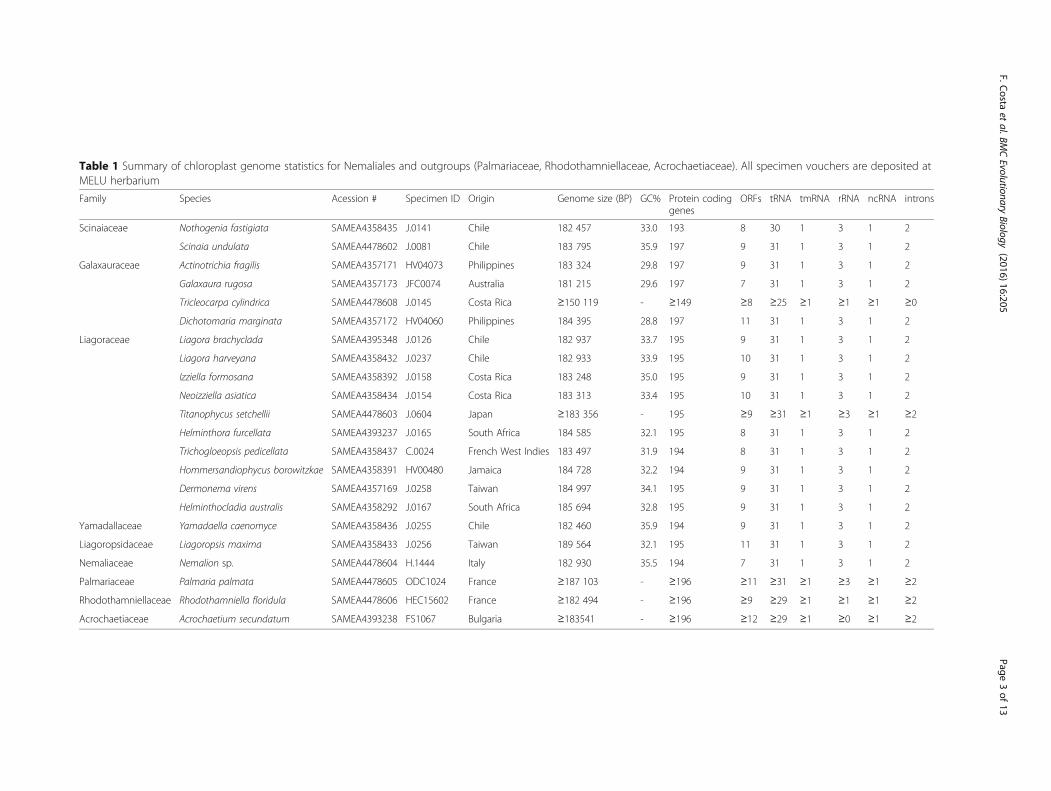
Table 1 Summary of chloroplast genome statistics for Nemaliales and outgroups (Palmariaceae, Rhodothamniellaceae, Acrochaetiaceae). All specimen vouchers are deposited atMELU herbarium
Family Species Acession # Specimen ID Origin Genome size (BP) GC% Protein codinggenes
ORFs tRNA tmRNA rRNA ncRNA introns
Scinaiaceae Nothogenia fastigiata SAMEA4358435 J.0141 Chile 182 457 33.0 193 8 30 1 3 1 2
Scinaia undulata SAMEA4478602 J.0081 Chile 183 795 35.9 197 9 31 1 3 1 2
Galaxauraceae Actinotrichia fragilis SAMEA4357171 HV04073 Philippines 183 324 29.8 197 9 31 1 3 1 2
Galaxaura rugosa SAMEA4357173 JFC0074 Australia 181 215 29.6 197 7 31 1 3 1 2
Tricleocarpa cylindrica SAMEA4478608 J.0145 Costa Rica ≥150 119 - ≥149 ≥8 ≥25 ≥1 ≥1 ≥1 ≥0
Dichotomaria marginata SAMEA4357172 HV04060 Philippines 184 395 28.8 197 11 31 1 3 1 2
Liagoraceae Liagora brachyclada SAMEA4395348 J.0126 Chile 182 937 33.7 195 9 31 1 3 1 2
Liagora harveyana SAMEA4358432 J.0237 Chile 182 933 33.9 195 10 31 1 3 1 2
Izziella formosana SAMEA4358392 J.0158 Costa Rica 183 248 35.0 195 9 31 1 3 1 2
Neoizziella asiatica SAMEA4358434 J.0154 Costa Rica 183 313 33.4 195 10 31 1 3 1 2
Titanophycus setchellii SAMEA4478603 J.0604 Japan ≥183 356 - 195 ≥9 ≥31 ≥1 ≥3 ≥1 ≥2
Helminthora furcellata SAMEA4393237 J.0165 South Africa 184 585 32.1 195 8 31 1 3 1 2
Trichogloeopsis pedicellata SAMEA4358437 C.0024 French West Indies 183 497 31.9 194 8 31 1 3 1 2
Hommersandiophycus borowitzkae SAMEA4358391 HV00480 Jamaica 184 728 32.2 194 9 31 1 3 1 2
Dermonema virens SAMEA4357169 J.0258 Taiwan 184 997 34.1 195 9 31 1 3 1 2
Helminthocladia australis SAMEA4358292 J.0167 South Africa 185 694 32.8 195 9 31 1 3 1 2
Yamadallaceae Yamadaella caenomyce SAMEA4358436 J.0255 Chile 182 460 35.9 194 9 31 1 3 1 2
Liagoropsidaceae Liagoropsis maxima SAMEA4358433 J.0256 Taiwan 189 564 32.1 195 11 31 1 3 1 2
Nemaliaceae Nemalion sp. SAMEA4478604 H.1444 Italy 182 930 35.5 194 7 31 1 3 1 2
Palmariaceae Palmaria palmata SAMEA4478605 ODC1024 France ≥187 103 - ≥196 ≥11 ≥31 ≥1 ≥3 ≥1 ≥2
Rhodothamniellaceae Rhodothamniella floridula SAMEA4478606 HEC15602 France ≥182 494 - ≥196 ≥9 ≥29 ≥1 ≥1 ≥1 ≥2
Acrochaetiaceae Acrochaetium secundatum SAMEA4393238 FS1067 Bulgaria ≥183541 - ≥196 ≥12 ≥29 ≥1 ≥0 ≥1 ≥2
F.Costa
etal.BM
CEvolutionary
Biology (2016) 16:205
Page3of
13

was predicted by mapping the end and start (~1000 bp)of a given contig to the contig inferred by the otherassembler.Gene prediction was carried out in MFannot (http://
megasun.bch.umontreal.ca/cgi-bin/mfannot/mfannotIn-terface.pl) and Glimmer 3 [24], and manually inspectedand annotated in Geneious 6.1.7. Considering the collin-earity of red algae chloroplast genomes, visual inspectionof contigs was performed simultaneously across multiplespecies to help identify unrecognised or misidentifiedgenes by the automated tools. Colinearity became par-ticularly useful for undetected genes. If the automatedtools did not identify a gene in a given species, we wouldalign that gene from all other species with the genomeregion where we would expect to find it. Depending onlevels of similarity, alignment quality and the presence ofstart and stop codons, the gene was either annotatedor not. Once contigs were completely annotated, cod-ing sequences were extracted and gene alignmentsacross species were built. These alignments weremanually verified and the procedure was repeateduntil all remaining annotation issues (e.g. positions ofstart codons) were resolved.Synteny between genomes was compared using the pro-
gressive Mauve algorithm in Geneious 6.1.7 using the fullalignment option, automatically calculated seed weightsand automatically calculated minimum locally collinearblocks (LCB) score.
Phylogenetic analysisWe filtered our final gene alignments to retain onlyCDSs (coding DNA sequences) present in more than 6taxa. Alignments of individual genes were performed atthe amino acid level using MAFFT v7.245 [25] and nu-cleotide alignments recovered based on the matchingamino-acid alignment using revTrans [26]. Both amino-acid (aa) and nucleotide alignments (nt) were checkedmanually in Geneious and concatenated. For both the ntand aa alignments, phylogenetic trees were estimatedusing maximum likelihood (ML) with RAxML v8.0.26[27]. We analysed both datasets from 500 randomizedmaximum parsimony starting trees with (1) a modelsuggested by a model tester (see below), and (2) a muchsimpler model to test if model choice would affecttopology and bootstrap support. For the aa data, the MLphylogeny was inferred using both a cpREV + Γ + Fmodel as suggested by ProtTest 3.4.1 [28] and a simpleLG + CAT model. For the nt data, estimations were doneusing a simple GTR + Γ model and a partitioned GTR+ Γ + I model as suggested by PartitionFinder [29].
Data requirement simulationsIn order to evaluate how much chloroplast genome dataare needed to resolve the phylogeny and whether genes
with different rates of evolution performed better orworse at resolving the phylogeny, we analysed subsets ofthe data and evaluated how support changed as a func-tion of the size of the subset.First, we calculated the rates of individual genes. We
optimized a GTR + Γ model using the ML tree obtainedfrom the concatenated dataset and re-calculated thebranch lengths from the gene alignments. The total treelength was than divided by the length of the treeobtained from the concatenated alignment. This valuereflects the rate of the gene relative to the overall rate ofthe protein-coding parts of the chloroplast genome, withgenes >1 being faster and genes <1 slower.Second, we performed analyses on random subsets of
the alignment. For this, non-parametric bootstrappingwas used to create datasets of different sizes (1 k, 2.5 k,5 k, 10 k, 25 k, 50 k, 100 k) and those datasets were ana-lysed using RAxML with a GTR + Γ model. The boot-strap support was summarized and plotted as a functionof alignment size. Five replicate analyses each consistingof 100 bootstrapped datasets were run for each align-ment size. This procedure is similar to that used byVerbruggen et al. [1] but without extrapolation beyondthe original alignment size.Third, we extended the non-parametric bootstrapping
method to evaluate how well fast, medium rate and slowgenes performed in terms of inferring the phylogeny.Genes less than 800 nt were excluded for these analyses.We subdivided the remaining genes into slow, mediumrate, and fast categories (using relative rate thresholds of0.75 and 1.5). Then, genes were concatenated within eachcategory and the procedure from the paragraph above wasrepeated. Alignment lengths were kept shorter (1 k, 2.5 k,5 k, 10 k) because fewer data are available per categoryand after exclusion of short genes.
ResultsSequencingTo resolve the Nemaliales phylogeny we assembled andcharacterised 17 complete and 5 draft plastid genomes.The average coverage of the plastid contigs varied be-tween 130× in one of the Tricleocarpa contigs and4,140× in Izziella (see Additional file 1 for sample bysample coverage). Overall samples sequenced with theNextSeq500 presented better coverage (Additional file1). We are uncertain about the reason behind this, itcould be for a number of reasons, for example, becausemore data was generated or because assemblers performbetter with longer reads.
AssemblyOf the plastid genomes we consider complete, all butone assembled into a single contig using the automaticassemblers. The exception (Actinotrichia) assembled into
F. Costa et al. BMC Evolutionary Biology (2016) 16:205 Page 4 of 13
three contigs that showed similarity to Nemaliales’ plas-tid DNA. The contigs overlapped in two different posi-tions by 892 bp and 268 bp and could be manuallyjoined into a supercontig, and read mapping showedgood coverage across the joints. Circularity could beconfirmed for the supercontig and it was collinear tocomplete genomes of the closely related Dichotomariaand Galaxaura.For the ingroups Tricleocarpa and Titanophycus as well
as the three outgroups, chloroplast genomes were assem-bled into multiple contigs. We were able to join themultiple contigs manually for the three outgroups andTitanophycus but were unable to confirm their circularity.Extending the original contigs through read mapping didnot result in matching ends due to ambiguities in theassembly of the ribosomal RNA cistron (rns/rnl region).Nonetheless, all genes identified in the circular mappinggenomes were also present in these four draft genomes.For Tricleocarpa, contigs were short (6628 bp –79,809 bp) and they could not be joined with confidence.
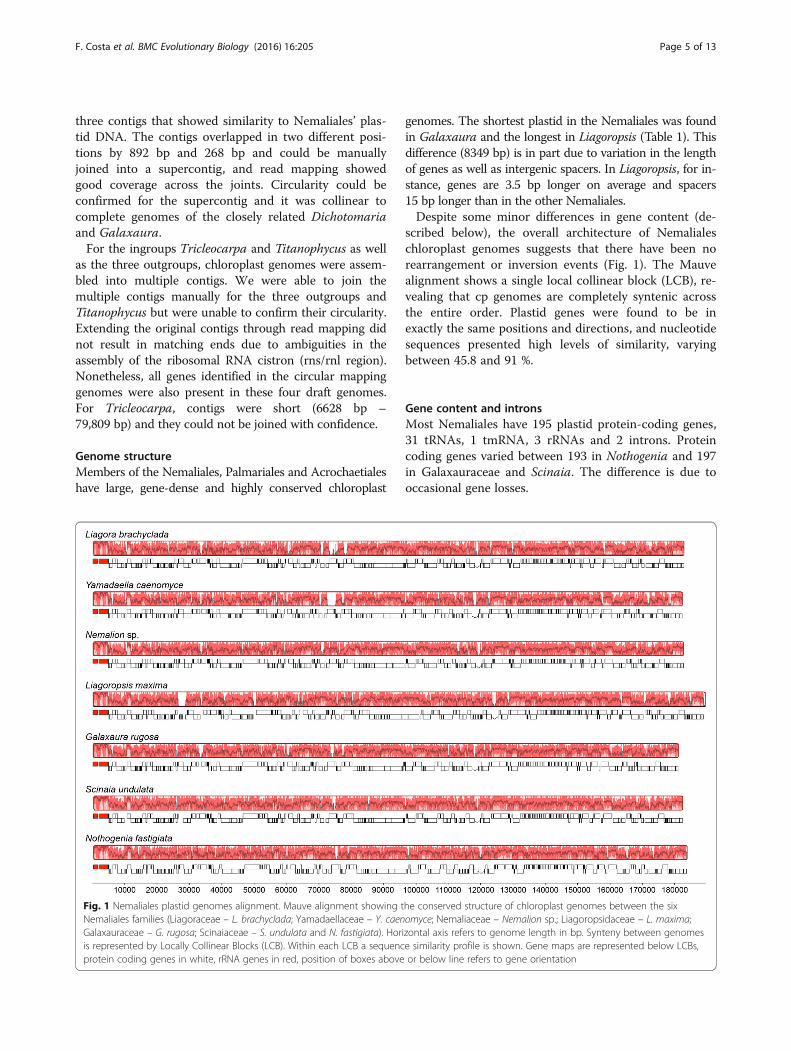
Genome structureMembers of the Nemaliales, Palmariales and Acrochaetialeshave large, gene-dense and highly conserved chloroplast
genomes. The shortest plastid in the Nemaliales was foundin Galaxaura and the longest in Liagoropsis (Table 1). Thisdifference (8349 bp) is in part due to variation in the lengthof genes as well as intergenic spacers. In Liagoropsis, for in-stance, genes are 3.5 bp longer on average and spacers15 bp longer than in the other Nemaliales.Despite some minor differences in gene content (de-
scribed below), the overall architecture of Nemalialeschloroplast genomes suggests that there have been norearrangement or inversion events (Fig. 1). The Mauvealignment shows a single local collinear block (LCB), re-vealing that cp genomes are completely syntenic acrossthe entire order. Plastid genes were found to be inexactly the same positions and directions, and nucleotidesequences presented high levels of similarity, varyingbetween 45.8 and 91 %.
Gene content and intronsMost Nemaliales have 195 plastid protein-coding genes,31 tRNAs, 1 tmRNA, 3 rRNAs and 2 introns. Proteincoding genes varied between 193 in Nothogenia and 197in Galaxauraceae and Scinaia. The difference is due tooccasional gene losses.
Fig. 1 Nemaliales plastid genomes alignment. Mauve alignment showing the conserved structure of chloroplast genomes between the sixNemaliales families (Liagoraceae – L. brachyclada; Yamadaellaceae – Y. caenomyce; Nemaliaceae – Nemalion sp.; Liagoropsidaceae – L. maxima;Galaxauraceae – G. rugosa; Scinaiaceae – S. undulata and N. fastigiata). Horizontal axis refers to genome length in bp. Synteny between genomesis represented by Locally Collinear Blocks (LCB). Within each LCB a sequence similarity profile is shown. Gene maps are represented below LCBs,protein coding genes in white, rRNA genes in red, position of boxes above or below line refers to gene orientation
F. Costa et al. BMC Evolutionary Biology (2016) 16:205 Page 5 of 13
The most widely lost gene is pbsA. It is absent inNothogenia, Trichogloeopsis, Nemalion and Yamadaella.The hypothetical protein ycf41 is absent in Hommer-sandiophycus and petP (ycf86) was only found in theGalaxauraceae family and in Scinaia. The hypotheticalproteins ycf35 and ycf46 in Nothogenia appear to bepseudogenes having similar aa sequences but prematurestop codons. The same pseudogene pattern is found forycf21 in Yamadaellaceae, Liagoropsidaceae and Liagora-ceae. tRNA-Met is present in all taxa in 3 copies.We found two group II introns in all taxa. The one
in the chlB gene and contains an intronic ORF. Thesecond group II intron was found in one of thetRNA-Met copies.
Alignment statisticsThe alignment of concatenated amino acid sequencescomprised 48,470 characters of which 23,152 were vari-able (47.7 %) and 18,454 (79.7 %) parsimony-informative.The concatenated nucleotide alignment is 145,410 bplong, with 86,313 variable sites (59.3 %) of which 76,031(88 %) were informative.
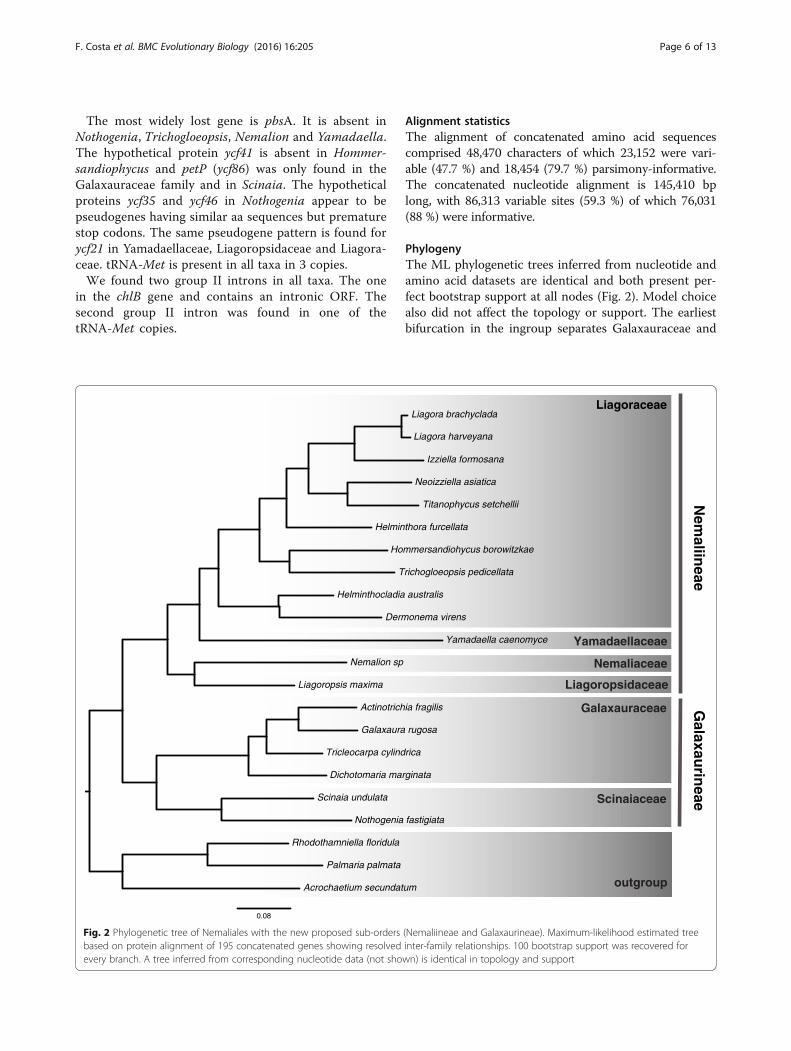
PhylogenyThe ML phylogenetic trees inferred from nucleotide andamino acid datasets are identical and both present per-fect bootstrap support at all nodes (Fig. 2). Model choicealso did not affect the topology or support. The earliestbifurcation in the ingroup separates Galaxauraceae and
0.08
Liagora brachyclada
Dermonema virens
Galaxaura rugosa
Helminthocladia australis
Actinotrichia fragilis
Nothogenia fastigiata
Acrochaetium secundatum
Helminthora furcellata
Izziella formosana
Trichogloeopsis pedicellata
Palmaria palmata
Neoizziella asiatica
Scinaia undulata
Titanophycus setchellii
Dichotomaria marginata
Nemalion sp
Liagoropsis maxima
Tricleocarpa cylindrica
Hommersandiohycus borowitzkae
Rhodothamniella floridula
Yamadaella caenomyce
Liagora harveyana
Liagoraceae
Yamadaellaceae
Nemaliaceae
Liagoropsidaceae
Galaxauraceae
Scinaiaceae
outgroup
Nem
aliineae
Galaxau
rineae
Fig. 2 Phylogenetic tree of Nemaliales with the new proposed sub-orders (Nemaliineae and Galaxaurineae). Maximum-likelihood estimated treebased on protein alignment of 195 concatenated genes showing resolved inter-family relationships. 100 bootstrap support was recovered forevery branch. A tree inferred from corresponding nucleotide data (not shown) is identical in topology and support
F. Costa et al. BMC Evolutionary Biology (2016) 16:205 Page 6 of 13
Scinaiaceae from the Nemaliaceae, Liagoropsidaceae,Yamadaellaceae and Liagoraceae. Within the Galaxaura-ceae, Dichotomaria is the earliest branching genus andActinotrichia and Galaxaura are recovered as sister line-ages. Nemaliaceae and Liagoropsidaceae are shown to besister families, and the same is true of Yamadaellaceaeand Liagoraceae. Within the Liagoraceae, Helminthocla-dia and Dermonema form an early-branching clade.Hommersandiophycus clusters with Trichogloeopsis. Thesister genera Titanophycus and Neoizziella are the mostclosely related to the Liagora + Izziella clade.
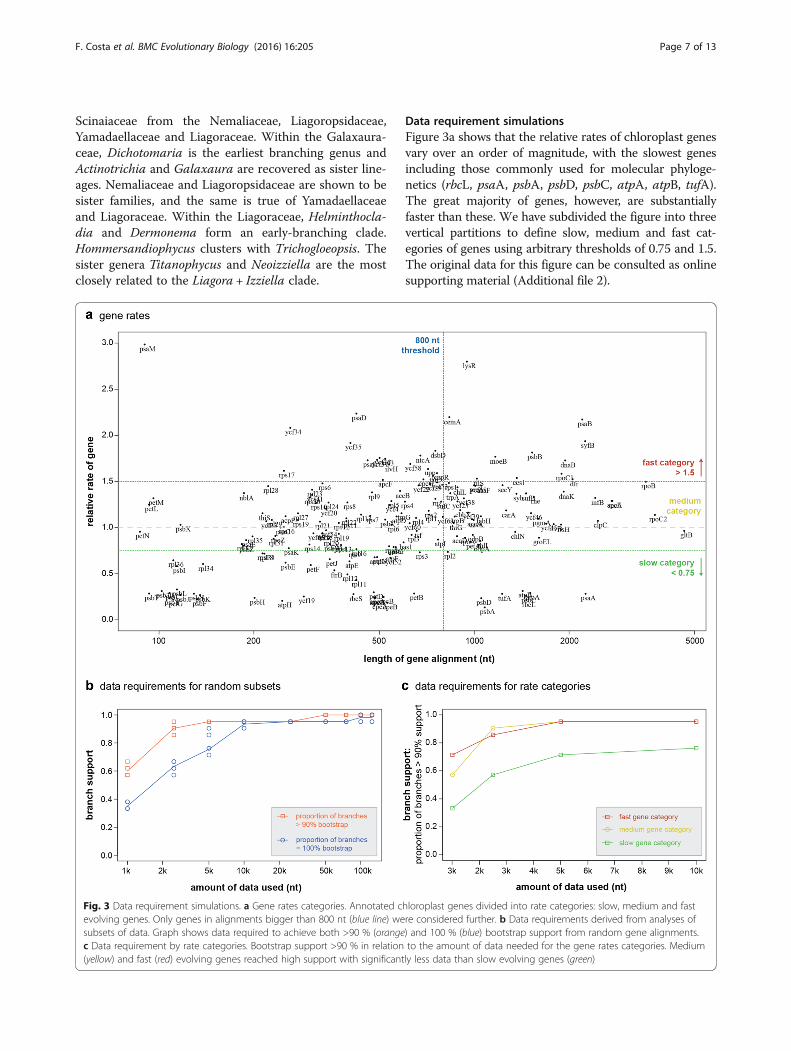
Data requirement simulationsFigure 3a shows that the relative rates of chloroplast genesvary over an order of magnitude, with the slowest genesincluding those commonly used for molecular phyloge-netics (rbcL, psaA, psbA, psbD, psbC, atpA, atpB, tufA).The great majority of genes, however, are substantiallyfaster than these. We have subdivided the figure into threevertical partitions to define slow, medium and fast cat-egories of genes using arbitrary thresholds of 0.75 and 1.5.The original data for this figure can be consulted as onlinesupporting material (Additional file 2).
Fig. 3 Data requirement simulations. a Gene rates categories. Annotated chloroplast genes divided into rate categories: slow, medium and fastevolving genes. Only genes in alignments bigger than 800 nt (blue line) were considered further. b Data requirements derived from analyses ofsubsets of data. Graph shows data required to achieve both >90 % (orange) and 100 % (blue) bootstrap support from random gene alignments.c Data requirement by rate categories. Bootstrap support >90 % in relation to the amount of data needed for the gene rates categories. Medium(yellow) and fast (red) evolving genes reached high support with significantly less data than slow evolving genes (green)
F. Costa et al. BMC Evolutionary Biology (2016) 16:205 Page 7 of 13
Random subsampling of our entire chloroplast align-ment showed that analyses with 2500 nt already achieveda high proportion of branches exceeding 90 % bootstrapsupport (Fig. 3b). With alignments of 10,000 nt and up,the great majority of branches had reached 100 % boot-strap support (Fig. 3b).A similar analysis carried out on fast, medium-rate
and slow genes showed that while fast and medium-rategenes rapidly achieve high bootstrap support, slow genesramp up much more slowly (Fig. 3c). It is striking thateven for alignments with 10,000 nt from slow genes,bootstrap support is inferior to alignments of just2500 nt from fast or medium-rate genes. Trees inferredfrom concatenated alignments of the three rate categor-ies recovered the same topology.
DiscussionNemaliales plastid genomesChloroplast genomes in the order Nemaliales are con-sistent with those of other red algae: they are large,gene-dense and feature a highly conserved gene order.The longest known plastid genome in red algae arefound in the Bangiophyceae with the longest beingPorphyra pulchra with ~194 kb followed by the corallineSporolithon durum with ~191 kb [10]. Liagoropsis is thethird longest plastid genome described so far with~189 kb. The difference in plastid size within the orderis only ~8000 bp, and even the smallest among them(Galaxaura) still rank among the largest plastid ge-nomes of Archaeplastida [4].Within Nemaliales families, the earliest divergent
clades typically exhibit longer plastid genomes. However,this is not a result of differing gene content. Gene com-position is highly conserved with only five genes absentin some of the taxa. The differences in genome sizes arecaused mostly by changes in the length of non-codingregions. For example, within Liagoraceae, the Liagoralineage has reduced intergenic spacers when comparedto Helminthocladia or Dermonema; the same is truewithin Galaxauraceae, where the lineage Actinotrichia+Galaxaura present shorter intergenic regions whencompared to Dichotomaria (Additional file 1). Thispattern could be of evolutionary interest in the lightof the ‘lower-cost strategy’ [30] and faster replicationof plastids [31].The highly conserved genome architecture in Nema-
liales is remarkable considering that the order diverged~200 Ma ago [8] and other groups of algae show muchhigher levels of rearrangement [32, 33].The only gene missing from several Nemaliales taxa is
pbsA, an important gene involved in the production ofphycobilins, the light-harvesting proteins characteristicof red algae [34]. This gene has been lost in several taxain the Rhodomelaceae as well (P. Diaz Tapia, personal
communication) but other than that has never been re-ported missing from florideophyte plastids. In the unice-lular Cyanidiophyceae, the earliest divergent class of redalgae, it has been found in the nucleus instead [35, 36]but phylogenetic inferences showed that this nuclearpbsA gene is more closely related to nuclear pbsA fromgreen plant lineage than to plastid pbsA of other redalgae [34]. This suggests that the Cyanidiophyceae nu-clear pbsA gene was not transferred from the plastid.We cannot confirm whether pbsA has been transferredto the nucleus in Nemaliales.petP is a subunit of the cytochrome b6f complex with
no essential role in the overall function of the complex[37]. It has been identified in cyanobacteria and in ban-giophytes but it is apparently absent in green algae andland plants [38]. It is found in Chondrus and Gratelou-pia [9, 39], and in this study in the Galaxauraceae andScinaia. This suggests that it might have been lost twicewithin the Nemaliales: once in Nothogenia and once inthe ancestor of the Nemaliaceae + Liagoropsidaceae +Yamadaellaceae + Liagoraceae clade.The third missing gene, absent in Hommersandiophy-
cus, is ycf41. Ycf41 is a hypothetical protein of unknownfunction that has been annotated in heterokonts [40]and in all florideophytes’ plastid genomes with the ex-ception of Laurencia in the Rhodomelaceae [22].Three pseudogenes are found in the Nemaliales. The
function of ycf21 is unknown and it was also found as apseudogene in Sporolithon durum [10]. The function ofycf35 and ycf46 genes is still uncertain but they arethought to be involved in CO2 uptake and utilization[41]. These genes are present in cyanobacteria and othereukaryotic algae but have been lost in green plants [40–43].Within the florideophytes they have only been reported ab-sent in the coralline Calliarthron [9].Gene loss in red algal plastids is rare and there is no
apparent functional relationship between genes beinglost, suggesting it is a stochastic process. Apart frompbsA, the genes not found in some Nemaliales taxa areeither of unknown function or play no essential role.Red algal plastids present an uncommonly low number
of introns [9, 10] and only two group II introns werefound in the Nemaliales. Group II introns are found inbacterial, chloroplast and mitochondrial genomes, areself-splicing and are believed to be the ancestor of spli-ceosomal introns [44, 45], which are considered to becrucial in the evolution of eukaryotes [46]. One of theseintrons was found in the tRNA-Met gene in all taxa. Thisintron is present in all other florideophyte plastids de-scribed to date [9, 22] but not for the classes Cyanidiophy-ceae, Porphyridiophyceae and Bangiophyceae [47–49].Despite being uncommon in plastid tRNAs, group IIintrons appear to be retained once they are acquired[50] which suggests that this intron was gained by a
F. Costa et al. BMC Evolutionary Biology (2016) 16:205 Page 8 of 13
Florideophyceae ancestor. A second group II intronwas found in the chlB gene that together with chlNand chlL encodes for the LIPOR enzyme responsiblefor chlorophyll synthesis in the absence of light [51].This gene complex has been lost extensively acrossdifferent photosynthetic eukaryotic lineages with noevidence of it being transferred to the nucleus [52]. Itwas also widely lost in florideophytes. They were onlyreported in this study and in the Corallinales [9, 10].Following the divergence of Hildenbrandiophyceae,the Coralinales and Nemaliales are the earliest diver-gent clades in the Florideophyceae suggesting that theloss of the LIPOR complex happened later in the evolu-tion of the group. These three lineages also happen to bethe only calcified florideophytes, which might explainthe preservation of a complex for light-independentchlorophyll synthesis. However, if the LIPOR complexis present, always has this group II intron in chlBgene, that along with the tRNA-Met intron, couldhave been acquired when the florideophytes divergedfrom the other red algal lineages.It is still not understood which phenomena are causing
such high level of conservatism in red plastids. It seemslikely that most of the genes found in the plastid acrossall red algae are essential for plastid function, but inother algal lineages part of these genes have been trans-ferred to the nucleus.
Phylogeny of NemalialesBased on a diverse set of Nemaliales, our cp phyloge-nomics approach recovered a fully resolved phyl-ogeny of the order that was previously unsupported[12, 13, 15, 53, 54].Our phylogeny confirms that the Nemaliales is com-
prised of six families. Scinaiaceae, Galaxauraceae and Lia-goraceae are long-recognised families [13] and the earlybranching nature of the recently resurrected Nemalia-ceae and the newly proposed Yamadaellaceae andLiagoropsidaceae supports their recognition at a hightaxonomic level.The three new families were proposed based on a
concatenated dataset of psaA and rbcL [12]. Our largerdataset improves the resolution at deep nodes thus wecan confidently confirm their relationships. The Yama-daellaceae and Liagoropsidaceae develop multiple initialgonimoblasts per zygote, whereas in the Liagoraceae andNemaliaceae a single one is produced [12]. Consideringthat Galaxauraceae and Scinaiaceae [53, 55] zygotes pro-duce a single initial gonimoblast it is likely that this wasthe ancestral state and that the production of multiplegonimoblasts was independently acquired by Yamadael-laceae and Liagoropsidaceae.The placement of Scinaiaceae has been a controversial
node in phylogenetic studies [12–14]. It is now clear that
this exclusively non-calcified family is more closelyrelated to the exclusively calcified Galaxauraceae than toany other family.This phylogenomics approach also revealed to be use-
ful at lower taxonomic levels. Within Galaxauraceae,Dichotomaria is the earliest diverging genus and Tricleo-carpa position within the family is finally resolved show-ing that Actinotrichia and Galaxaura are sister lineages.These relationships were contradictory and had low sup-port in recent multi-gene phylogenies [14, 56].In Liagoraceae, the overall topology of our ML tree is
mostly concordant to recent phylogenies of the family ofboth plastid and nuclear markers [12, 15] but wherepreviously support was low to weak, our tree is resolvedat all levels. The non-calcified Helminthocladia andDermonema form the earliest divergent clade within theLiagoraceae. It is interesting to consider that these dee-per branching genera were once accepted as the typegenus’ of two distinct families: Helminthocladiaceae [57]and Dermonemataceae [58], respectively. As previouslyshown, the newly described genus Hommersandiohycus[59] clusters with Trichogloeopsis. Helminthora in ourtree represents a lineage of its own but previous studieshave shown that it clusters with high support withCumagloia [12, 59, 60], a genus not included in our ana-lysis. Curiously, Liagora, the generitype and the most di-verse genus in the family diverged later within the clade.
Re-classification of NemalialesThe fact that our ML inference is fully supported acrossall taxonomic levels allows us to propose a more refinedclassification with high confidence. Therefore we suggesttaxonomic rearrangement of the Nemaliales order to becomposed of two sub-orders: the Galaxaurineae for theGalaxauraceae and Scinaiaceae and the Nemaliineae forthe remaining families.Galaxaurineae J.F. Costa, S.M. Lin, E.C. Macaya, C.
Fernández-García, H. Verbruggen subordo nov.Diagnosis: Recognized primarily based on monophyly
in phylogenetic trees derived from chloroplast genomedata. Members form a single intial gonimoblast from thezygote, and carposporophytes are immersed in concepta-cles covered with a consolidated pericarp. Two families,Galaxauraceae and Scinaiaceae, are included. The morpho-logical features used for separating genera mainly includinga combination of cortex morphology, the heteromorphic,dimorphic or isomorphic life history whether or not invo-lucral/sterile filaments intermixing with gonimoblasts.
Genera included in suborderGalaxauraceae
Galaxaura Lamouroux (type genus)Actinotrichia Decaisne
F. Costa et al. BMC Evolutionary Biology (2016) 16:205 Page 9 of 13
Dichotomaria Lamarck
Scinaiaceae
Scinaia Bivona-BernardiTricleocarpa Huisman & BorowitzkaNothogenia MontagneGloiophloea AgardhWhidbeyella Setchell & N. L. Gardner
Nemaliineae J.F. Costa, S.M. Lin, E.C. Macaya, C.Fernández-García, H. Verbruggen subordo nov.Diagnosis: Recognized primarily based on monophyly in
phylogenetic trees derived from chloroplast genome data.Members form single or multiple primary gonimoblasts.Carposporophytes are naked or with an unconsolidatedinvolucre of filaments. Four families, Nemaliaceae,Liagoraceae, Yamadaellaceae, and Liagoropsidaceae, areincluded. The number of gonimoblast initials and celldivision orientation of zygotes are the most importantmorphological criteria for separating the families in thesuborder. The morphological features used for separat-ing genera mainly including a combination of thalluswhether or not calcified, whether or not involucral/ster-ile filaments intermixing with gonimoblasts, involucral/sterile filaments morphologies and where they being pro-duced, whether or not cells of carpogonial branch fused,morphologies of carposporophytes and carposporangia.
Genera included in suborderNemaliaceae
Nemalion Duby (type genus)
Liagoraceae
Akalaphycus Huisman, I.A. Abbott & A. R. SherwoodCumagloia Setchell & N. L. GardnerCylindraxis KraftDermonema Harvey ex HeydrichDotyophycus I. A. AbbottGanonema K. C. Fan & Yung-C. WangGloiocalis S.-M. Lin, Huisman & D. L. BallantineGloiotrichus Huisman & KraftHelminthocladia AgardhHelminthora AgardhHommersandiophycus S.- M. Lin & HuismanIzziella DotyLiagora LamourouxMacrocarpus S.-M. Lin, S. Y. Yang & HuismanNeoizziella S.-M. Lin, S. Y. Yang & HuismanPatenocarpus YoshizakiSinocladia C. K. Tseng & W. LiStenopeltis Itono & Yoshizaki
Titanophycus Huisman, G. W. Saunders & A. R.SherwoodTrichogloea KützingTrichogloeopsis I. A. Abbott & DotyYoshizakia S.-M. Lin, Huisman & C. Payri
Liagoropsidaceae
Liagoropsis Yamada
Yamadaellaceae
Yamadaella I. A. Abbott
Plastid phylogenomics in red algaeThis study shows that chloroplast genomes are a usefulsource of data to resolve phylogenetic relationships inred algae. The highly conserved nature of these genomesstreamlines the assembly and annotation process. Ourstudy, with denser sampling within a single order, alongwith other studies, with sparser but broader sampling,show that chloroplast genomes provide power to resolvephylogenetic relationships at all levels. We clearly dem-onstrated that the medium-rate and rapidly evolvingplastid genes resolve phylogenetic relationships withinthe order for alignments as short as 2500 bp, while slowgenes had much poorer performance. While the mediumand fast evolving genes reached 100 bootstrap values forall but one node (Additional file 3), the slow genes onlyrecovered 70 % of the nodes with full support. Two ofthese nodes had a bootstrap value lower than 60, whichwould be considered as inconclusive in molecular phy-logenies. The choice of these slow evolving markersmade sense in the early days of molecular phylogeneticswhen data generation was dependent on PCR amplifica-tion but in this HTS era we have easy access to more in-formative genes. Even for projects with limited budgets,employing HTS to obtain lower-coverage data fromplastid genomes would seem like a reasonable strategy.While such data may not permit complete assembly ofthe genomes, the gene data derived from smaller contigscan be extracted and used in phylogenetic analysis. Con-sidering that our analyses of subsamples of data yieldedgreat support for alignments > 2500 nt, incompletenessof the datasets seems unlikely to result in major de-creases in phylogenetic support.We should highlight that 17 of our 22 taxa were
pooled with a green algae species prior to library prepar-ation and we were still able to confidently assemblyentire plastids for most of them. This reflects an obviouslower cost per sample with similar outcomes. However,we did notice that high quality DNA is required whenusing HTS techniques (ratios of ~1.8 and ~2.0-2.2 forabsorbance between 260 nm and 280 nm, and 260 nm
F. Costa et al. BMC Evolutionary Biology (2016) 16:205 Page 10 of 13
and 230 nm, respectively). The major difficulty in isolat-ing high quality DNA in algae is related to the level ofpolysaccharides and polyphenols present in the tissue[61]. If not totally removed these compounds can inter-fere and inhibit downstream applications [62]. We foundthat our adapted CTAB protocol resulted in good qualitygenomic DNA for HTS purposes in most of our targetspecies but experiments with other red algae indicatethat this cannot be generalized (unpublished results),and it is worthwhile to carry out trials prior to large-scale HTS projects [63].It is also worth noting that while our study focused on
chloroplast DNA, total genomic DNA was sequenced,yielding useful additional data from the mitochondrion andnucleus that can be used for phylogenetics. This means thatfrom the same HTS data many other questions can beaddressed with no extra cost and limited extra labour.
ConclusionsWe showed that chloroplast phylogenomics is an attract-ive approach for phylogenetic studies in red algae: notonly because they are highly conserved, and thus straight-forward to work with, but also because their plastidscontain enough signal to solve phylogenetic relationshipsacross taxonomic levels. Moreover considering the keyrole of red plastids in the emergence of the eukaryotic cell,the generation of more HTS data for distinct red algalgroups can shed light on eukaryote evolution.
Additional files
Additional file 1: Summary table of sequencing and assembly informationper sample. Illumina platform used for each sample is discriminated with thecorrespondent length of individual reads in brackets. Number ofpaired-end reads (PE reads) generated for each sample in millions(M). Average, minimum and maximum coverage per contig is shown.(XLSX 44 kb)
Additional file 2: Details of individual evolutionary relative rates pergene: slow category (<0.75), medium category (0.75-1.5) and fastcategory (>1.5). All genes are represented but for further analysis onlyalignments ≥ 800 bp were considered. (XLSX 41 kb)
Additional file 3: Maximum likelihood aa trees estimated for thedifferent gene rate categories showing full support for every node forfast category, a single node < 100 bootstrap for the medium and weaksupport for multiple nodes in the slow rate category. (PDF 841 kb)
AbbreviationsAa: Amino acid; CDS: Coding DNA sequence; cp: Chloroplast;CTAB: Cetyltrimethylammonium bromide; HTS: High-throughput sequencing;ML: Maximum likelihood; nt: Nucleotide
AcknowledgementsWe would like to thank Robert Anderson, Barret L. Brooks, Olivier De Clerck, EricCoppejans, Fabio Rindi and Tom Schils for kindly providing us with samples.
FundingFunding was provided by the Australian Research Council (FT110100585 to HV),the Australian Biological Resources Study (RFL213-08 to HV) and the Universityof Melbourne (MIRS/MIFRS to JFC and FAPESP/UOM SPRINT grant to HV). EMwas supported by Grant NC120030 from the Millennium Scientific Initiative.
Availability of data and materialsThe datasets generated and analysed in this study are available at theEuropean Nucleotide Archive repository (http://www.ebi.ac.uk/ena), studyaccession number: PRJEB14925; and TreeBase (https://treebase.org).
Authors’ contributionsHV conceived the project. Fieldwork was carried out by HV, SML, EM,CF and acknowledged colleagues. Design, data generation and analysiswere performed by JFC and HV. JFC drafted the manuscript and allauthors contributed to the writing. All authors read and approved thefinal manuscript.
Competing interestsThe authors declare that they have no competing interests.
Consent for publicationNot applicable.
Ethics approval and consent to participateNot applicable.
Author details1School of BioSciences, University of Melbourne, Parkville, VIC 3010, Australia.2Institute of Marine Biology, National Taiwan Ocean University, Keelung20224, Taiwan. 3Departamento de Oceanografıa, Universidad de Concepción,Casilla 160-C, Chile. 4Millennium Nucleus Ecology and SustainableManagement of Oceanic Island (ESMOI), Coquimbo, Chile. 5Escuela deBiología, Centro de Investigación en Ciencias del Mar y Limnología (CIMAR),Universidad de Costa Rica, San Pedro, San José 11501-2060, Costa Rica.
Received: 31 May 2016 Accepted: 28 September 2016
References1. Verbruggen H, Maggs CA, Saunders GW, Le Gall L, Yoon HS, De Clerck O.
Data mining approach identifies research priorities and data requirementsfor resolving the red algal tree of life. BMC Evol Biol. 2010;10:16.
2. Lemmon EM, Lemmon AR. High-throughput genomic data in systematicsand phylogenetics. Annu Rev Ecol Evol Syst. 2013;44:99–121.
3. Ekblom R, Wolf JBW. A field guide to whole-genome sequencing, assemblyand annotation. Evol Appl. 2014;7:1026–42.
4. Bock R, Knoop V. Genomics of chloroplasts and mitochondria. Bock R,Knoop V, editors. Netherlands: Springer; 2012.
5. Leliaert F, Tronholm A, Lemieux C, Turmel M, DePriest MS, Bhattacharya D,et al. Chloroplast phylogenomic analyses reveal the deepest-branchinglineage of the Chlorophyta, Palmophyllophyceae class. nov. Sci Rep NaturePublishing Group. 2016;6:25367.
6. Butterfield NJ. Bangiomorpha pubescens n. gen., n. sp. : implications for theevolution of sex, multicellularity, and the Mesoproterozoic/Neoproteorozoicradiation of eukaryotes. Paleobiology. 2000;26:386–404.
7. Le Gall L, Saunders GW. A nuclear phylogeny of the Florideophyceae(Rhodophyta) inferred from combined EF2, small subunit and large subunitribosomal DNA: Establishing the new red algal subclass Corallinophycidae.Mol Phylogenet Evol. 2007;43:1118–30.
8. Yang EC, Boo SM, Bhattacharya D, Saunders GW, Knoll AH, Fredericq S, GrafL, Yoon HS. Divergence time estimates and the evolution of major lineagesin the florideophyte red algae. Sci Rep. 2016;6:21361.
9. Janouškovec J, Liu SL, Martone PT, Carrè W, Leblanc C, Collèn J, KeelingPJ. Evolution of red algal plastid genomes: ancient architectures, introns,horizontal gene transfer, and taxonomic utility of plastid markers. PLoSOne. 2013;8:e59001.
10. Lee J, Kim KM, Yang EC, Miller KA, Boo SM, Bhattacharya D, et al.Reconstructing the complex evolutionary history of mobile plasmids in redalgal genomes. Sci Rep Nature Publishing Group. 2016;6:23744.
11. Guiry MD, Guiry G. Algaebase, World-wide electronic publication. Galway:National University of Ireland; 2016.
12. Lin SM, Rodriguez-Prieto C, Huisman JM, Guiry MD, Payri C, Nelson WA, etal. A phylogenetic re-appraisal of the family Liagoraceae sensu lato(Nemaliales, Rhodophyta) based on sequence analyses of two plastid genesand postfertilization development. J Phycol. 2015;51:546–59.
F. Costa et al. BMC Evolutionary Biology (2016) 16:205 Page 11 of 13

13. Huisman JM, Harper JT, Saunders GW. Hylogenetic study of the nemaliales(rhodophyta) based on large-subunit ribosomal DNA sequences supportssegregation of the scinaiaceae fam. nov. And resurrection of dichotomariaLamarck. Phycol Res. 2004;52:224–34.
14. Lam DW, Verbruggen H, Saunders GW, Vis ML. Multigene phylogeny of thered algal subclass Nemaliophycidae. Mol Phylogenet Evol. 2016;94:730–6.
15. Popolizio TR, Schneider CW, Lane CE. A molecular evaluation of theLiagoraceae sensu lato (Nemaliales, Rhodophyta) in Bermuda includingLiagora nesophila sp. nov. and Yamadaella grassyi sp. nov. J Phycol. 2015;51:637–58.
16. Wu CS, Chaw SM, Huang YY. Chloroplast phylogenomics indicates thatGinkgo biloba is sister to cycads. Genome Biol Evol. 2013;5:243–54.
17. Lu JM, Zhang N, Du XY, Wen J, Li DZ. Chloroplast phylogenomics resolveskey relationships in ferns. J Syst Evol. 2015;53:448–57.
18. Melton JT, Leliaert F, Tronholm A, Lopez-Bautista JM. The completechloroplast and mitochondrial genomes of the green macroalga Ulva sp.UNA00071828 (Ulvophyceae, Chlorophyta). PLoS One. 2015;10:1–21.
19. Sun L, Fang L, Zhang Z, Chang X, Penny D, Zhong B. Chloroplastphylogenomic inference of green algae relationships. Sci Rep. 2016;6:20528.
20. Fučíková K, Lewis PO, Lewis LA. Chloroplast phylogenomic data from thegreen algal order Sphaeropleales (Chlorophyceae, Chlorophyta) revealcomplex patterns of sequence evolution. Mol Phylogenet Evol. 2016;98:176–83.
21. Doyle J. DNA Protocols for Plants. In: Hewitt, Godfrey M., Johnston AWB,Young JPW, editors. Mol. Tech. Taxon; Springer Berlin Heidelberg; 1991. p.283–93.
22. Verbruggen H, Costa JF. The plastid genome of the red alga Laurencia.J Phycol. 2015;51:586–9.
23. Li D, Liu CM, Luo R, Sadakane K, Lam TW. MEGAHIT: an ultra-fast single-node solution for large and complex metagenomics assembly via succinctde bruijn graph. Bioinformatics. 2014;31:1674–6.
24. Delcher AL, Bratke KA, Powers EC, Salzberg SL. Identifying bacterial genesand endosymbiont DNA with Glimmer. Bioinformatics. 2007;23:673–9.
25. Katoh K, Standley DM. MAFFT multiple sequence alignment softwareversion 7: improvements in performance and usability. Mol Biol Evol. 2013;30:772–80.
26. Wernersson R, Pedersen AG. RevTrans: multiple alignment of coding DNAfrom aligned amino acid sequences. Nucleic Acids Res. 2003;31:3537–9.
27. Stamatakis A. RAxML version 8: a tool for phylogenetic analysis and post-analysis of large phylogenies. Bioinformatics. 2014;30:1312–3.
28. Darriba D, Taboada GL, Doallo R, Posada D. ProtTest-HPC: fast selection ofbest-fit models of protein evolution. Lect. Notes Comput. Sci. (includingSubser. Lect Notes Artif Intell Lect Notes Bioinformatics). 2011;6586 LNCS:177–84.
29. Lanfear R, Calcott B, Ho SYW, Guindon S. PartitionFinder: combinedselection of partitioning schemes and substitution models for phylogeneticanalyses. Mol Biol Evol. 2012;29:1695–701.
30. Wu CS, Lai YT, Lin CP, Wang YN, Chaw SM. Evolution of reduced andcompact chloroplast genomes (cpDNAs) in gnetophytes: Selection toward alower-cost strategy. Mol Phylogenet Evol. 2009;52:115–24.
31. McCoy SR, Kuehl JV, Boore JL, Raubeson LA. The complete plastid genomesequence of Welwitschia mirabilis: an unusually compact plastome withaccelerated divergence rates. BMC Evol Biol. 2008;8:130.
32. Campbell MA, Presting G, Bennett MS, Sherwood AR. Highly conservedorganellar genomes in the Gracilariales as inferred using new data from theHawaiian invasive alga Gracilaria salicornia (Rhodophyta). Phycologia. 2014;53:109–16.
33. Leliaert F, Lopez-Bautista JM. The chloroplast genomes of bryopsis plumosaand tydemania expeditiones (bryopsidales, chlorophyta): compact genomesand genes of bacterial origin. BMC Genomics. 2015;16:204.
34. Hoffman R and ZD. Red algae in the genomic age. Red Algae GenomicAge. 2010;13:45–60.
35. Nozaki H, Takano H, Misumi O, Terasawa K, Matsuzaki M, Maruyama S, et al.A 100 %-complete sequence reveals unusually simple genomic features inthe hot-spring red alga Cyanidioschyzon merolae. BMC Biol. 2007;5:28.
36. Matsuzaki M, Misumi O, Shin-I T, Maruyama S, Takahara M, Miyagishima S-Y,et al. Genome sequence of the ultrasmall unicellular red algaCyanidioschyzon merolae 10D. Nature. 2004;428:653–7.
37. Rexroth S, Rexroth D, Veit S, Plohnke N, Cormann KU, Nowaczyk MM, et al.Functional characterization of the small regulatory subunit PetP from thecytochrome b6f complex in thermosynechococcus elongatus. Plant Cell.2014;26:3435–48.
38. Volkmer T, Schneider D, Bernát G, Kirchhoff H, Wenk S-O, Rögner M. Ssr2998of Synechocystis sp. PCC 6803 is involved in regulation of cyanobacterialelectron transport and associated with the cytochrome b6f complex. J BiolChem. 2007;282:3730–7.
39. DePriest MS, Bhattacharya D, López-Bautista JM. The plastid genome ofthe red macroalga grateloupia taiwanensis (Halymeniaceae). PLoS One.2013;8:1–7.
40. Le Corguillé G, Pearson G, Valente M, Viegas C, Gschloessl B, Corre E, et al.Plastid genomes of two brown algae, Ectocarpus siliculosus and Fucusvesiculosus: further insights on the evolution of red-algal derived plastids.BMC Evol Biol. 2009;9:253.
41. Jiang H-B, Song W-Y, Cheng H-M, Qiu B-S. The hypothetical protein Ycf46 isinvolved in regulation of CO2 utilization in the cyanobacteriumSynechocystis sp. PCC 6803. Planta. 2014;241:145–55.
42. Ghimiray D, Sharma BC. Comparative and bioinformatics analyses of thesolanaceae chloroplast genomes : plastome organization is more or lessconserved at family level. 2014;2:21–6.
43. Liu F, Pang S. Chloroplast genome of Sargassum horneri (Sargassaceae,Phaeophyceae): comparative chloroplast genomics of brown algae. J ApplPhycol. 2016;28(2):1419–26.
44. Bonen L, Vogel J. The ins and outs of group II introns. Trends Genet. 2001;17:322–31.
45. Doolittle WF. The trouble with (group II) introns. Proc Natl Acad Sci. 2014;111:6536–7.
46. Csuros M, Rogozin IB, Koonin EV. A detailed history of intron-rich eukaryoticancestors inferred from a global survey of 100 complete genomes. PLoSComput Biol. 2011;7:1–9.
47. Glöckner G, Rosenthal A, Valentin K. The structure and gene repertoire of anancient red algal plastid genome. J Mol Evol. 2000;51:382–90.
48. Ohta N, Matsuzaki M, Misumi O, Miyagishima SY, Nozaki H, Tanaka K, et al.Complete sequence and analysis of the plastid genome of the unicellularred alga Cyanidioschyzon merolae.[erratum appears in DNA Res. 2003 Jun30;10(3):137]. DNA Res. 2003;10:67–77.
49. Smith DR, Hua J, Lee RW, Keeling PJ. Relative rates of evolution among thethree genetic compartments of the red alga Porphyra differ from those ofgreen plants and do not correlate with genome architecture. MolPhylogenet Evol Elsevier Inc. 2012;65:339–44.
50. Turmel M, Otis C, Lemieux C. The chloroplast genome sequence of Charavulgaris sheds new light into the closest green algal relatives of land plants.Mol Biol Evol. 2006;23:1324–38.
51. Armstrong GA. Greening in the dark: light-independent chlorophyllbiosynthesis from anoxygenic photosynthetic bacteria to gymnosperms.J Photochem Photobiol B Biol. 1998;43:87–100.
52. Hunsperger HM, Randhawa T, Cattolico RA. Extensive horizontal genetransfer, duplication, and loss of chlorophyll synthesis genes in the algae.BMC Evol Biol. 2015;15:16.
53. Wang WL, Liu SL, Lin SM. Systematics of the calcified genera of thegalaxauraceae (Nemaliales, Rhodophyta) with an emphasis on taiwanspecies. J Phycol. 2005;41:685–703.
54. Lindstrom SC, Gabrielson PW, Hughey JR, Macaya EC, Nelson WA.Sequencing of historic and modern specimens reveals cryptic diversity in\nNothogenia\n (Scinaiaceae, Rhodophyta). Phycologia. 2015;54:97–108.
55. Liu S, Lin S, Wang W. Molecular phylogeny of the genusDichotomaria(Galaxauraceae, Rhodophyta) from the Indo-Pacific region,including a new species D. hommersandiifrom South Africa. Eur J Phycol.2013;48:221–34.
56. Liu S-L, Lin S-M, Chen P-C. Phylogeny, species diversity and biogeographicpatterns of the genus Tricleocarpa (Galaxauraceae, Rhodophyta) from theIndo-Pacific region, including T. confertus sp. nov. from Taiwan. Eur J Phycol.2015;50:439–56.
57. Doty MS, Abbott IA. Studies in the Helminthocladiaceae (Rhodophyta):Helmintbocladia. PACIFIC Sci. 1961;XV.
58. Abbott IA. Dotyophycus pacificum gen. et sp. nov., with a discussion ofsome families of Nemaliales (Rhodophyta). Phycologia. 1976;15:125–32.
59. Lin S-M, Huisman JM, Ballantine DL. Revisiting the systematics of Ganonema(Liagoraceae, Rhodophyta) with emphasis on species from the northwestPacific Ocean. Phycologia. 2014;53:37–51.
60. Lin S-M, Huisman JM, Payri CE. Characterization of Liagora ceranoides(Liagoraceae, Rhodophyta) on the basis of rbc L sequence analyses andcarposporophyte development, including Yoshizakia indopacifica gen. et sp.nov. from the Indo-Pacific region. Phycologia. 2013;52:161–70.
F. Costa et al. BMC Evolutionary Biology (2016) 16:205 Page 12 of 13
61. Hoarau G, Coyer JA, Stam WT, Olsen JL. A fast and inexpensive DNAextraction/purification protocol for brown macroalgae: Technical article. MolEcol Notes. 2007;7:191–3.
62. Maeda T, Kawai T, Nakaoka M, Yotsukura N. Effective DNA extractionmethod for fragment analysis using capillary sequencer of the kelp.Saccharina J Appl Phycol. 2013;25:337–47.
63. Fraser ZHC, Change E. Seaweed phylogeography. 2016. p. 363–86.
• We accept pre-submission inquiries
• Our selector tool helps you to find the most relevant journal
• We provide round the clock customer support
• Convenient online submission
• Thorough peer review
• Inclusion in PubMed and all major indexing services
• Maximum visibility for your research
Submit your manuscript atwww.biomedcentral.com/submit
Submit your next manuscript to BioMed Central and we will help you at every step:
F. Costa et al. BMC Evolutionary Biology (2016) 16:205 Page 13 of 13

![Using full chloroplast genomes of ‘red’ and ‘yellow’ Bixa ... › content › pdf › 10.1186 › s12864-020-06916-0.pdf[3], and is beginning the assembly of a concordant database](https://img.dokumen.tips/doc/110x75/60d94324b914135f0b60407e/using-full-chloroplast-genomes-of-areda-and-ayellowa-bixa-a-content.jpg)