Embed Size (px)
Citation preview

COGENT HYDROLOGIC
In-Situ Measurement of Seepage Velocity andChlorobenzene Degradation Rates in Freshwater
Sediment
Andrew J.B. Cohen, Ph.D.Principal HydrogeologistCogent HydroLogic, LLCWestfield, New Jersey

Acknowledgements
URS Corporation, Newark, DE

General Outline1. Background
3. Conceptual Model
2. Sampling
4. Pore Water Measurements andModeling 0
20
40
60
80
100
120
0.0 0.5 1.0
Dept
h [c
m]
C/Co
Analytical Solution
SCD78-Chlorobenzene

Freshwater Canal
Non-tidal 200 wide 4 deep Sediment: 3.5 thick

Sediment Characteristics
5
Top of Sediment
Sediment/Aquifer Contact
Organic-rich silt

Primary VOCs
Monochlorobenzene Dichlorobenzenes Benzene Aniline N-nitrosodiphenylamine O-toluidine
6

SedimentCores
On-shore soil boringsInclined Wells
Sediment Piezometers
Example Sampling

Site Characterization

Sampling
Aquifer
0
1
2
3
4
5
6
Depth (ft)
Peepers CentrifugingBulkchemistry
Sediment
CanalSurface Water
Groundwater
Piezometers

Sampling
147 Sediment samples 76 Sediment borings 70 Soil borings 43 GW sampling locations 14 Surface water samples 13 Sediment peepers for pore water analysis 40 Centrifuge samples 8 Temporary Piezometers
10

Chlorobenzene Distribution
11

Groundwater Bird’s Eye View
12

>24”
6-12”
18-24”
Sediment13
0-6”Sediment
Sed. Conc.(mg/Kg)

DNAPL
Vert. Exagg. = 10x
SN
Canal
Sediment
N
S
Cross-Section14
Confining Unit
Aquifer
Residual DNAPL
Conceptual Model ofGroundwater—Surface Water Interaction
15

Conceptual Model
Cross-section
16
Canal
ResidualDNAPL
SEEP
15

Conceptual Model
Cross-section
17
Canal
ResidualDNAPL
15
Also:Very HighChlorideConcentrationsAssociated withOn-Site Brine Use

Pore Water Analysis

Methods
Use sediment peepers to measure pore waterconcentration profiles
Fit data with an analytical solution to estimate fate &transport characteristics (inverse modeling)

5” X 14” 1” sample depth interval Incubation time: 3-8 wks
Sediment “Peepers”
Source: http://ead.univ-angers.fr/~geologie/pages_membres/EM_english.html

Sediment Peeper21
This study: 5” x 14” Teflon housing Teflon membrane 28 rows spaced 0.5 in 5 cm3 and 10 cm3
samples:– VOCs– Chloride– Iron, Nitrate, Sulfate,
Manganese– pH, ORP, Spec. Cond.

Peeper Locations22
Sediment ChlorobenzeneConc. (mg/Kg) in the 6”-
12” depth interval
200 ftPLAN VIEW

0 1,000 2,000 3,000-10
-505
101520253035404550556065707580859095
100
Concentration (micrograms/liter)
Depth Below Top of Sedim
ent (cm)
SCD79
0 1,000 2,000 3,000-10
-505
101520253035404550556065707580859095
100
Concentration (micrograms/liter)
Depth Below Top of Sedim
ent (cm)
SCD77
0 1,000 2,000 3,000-10
-505
101520253035404550556065707580859095
100
Concentration (micrograms/liter)
Depth Below Top of Sedim
ent (cm)
SCD78
0 1,000 2,000 3,000-10
-505
101520253035404550556065707580859095
100
Concentration (micrograms/liter)
Depth Below Top of Sedim
ent (cm)
SCD82
0 1,000 2,000 3,000-10
-505
101520253035404550556065707580859095
100
Concentration (micrograms/liter)
Depth Below Top of Sedim
ent (cm)
SCD83
0 1,000 2,000 3,000-10
-505
101520253035404550556065707580859095
100
Concentration (micrograms/liter)
Depth Below Top of Sedim
ent (cm)
SCD84
ND (4 ug/L)
Chlorobenzene Pore Water Profiles
84
83
80
81
82
7977
78
20 ug/L

Redox
Anaerobic sediment Very thin oxic/anoxic transition zone
-300-200-100 0 100 200 300-20-15-10
-505
1015202530354045505560657075808590
ORP (mV)
Depth Below Top of Sedim
ent (cm)
-300-200-100 0 100 200 300-20-15-10
-505
1015202530354045505560657075808590
ORP (mV)
Depth Below Top of Sedim
ent (cm)
-300-200-100 0 100 200 300-20-15-10
-505
1015202530354045505560657075808590
ORP (mV)
Depth Below Top of Sedim
ent (cm)
-300-200-100 0 100 200 300-20-15-10
-505
1015202530354045505560657075808590
ORP (mV)
Depth Below Top of Sedim
ent (cm)
SCD77 SCD78 SCD81 SCD83

Chloride
Chlorobenzene
Chlorobenzene (micrograms/Liter)
Chloride (milligrams/Liter)
• VOC trends ≠ Cl trend• Evidence of
ChlorobenzeneDegradation?
Chloride and Chlorobenzene Profiles
Flow

Pore Water Modeling
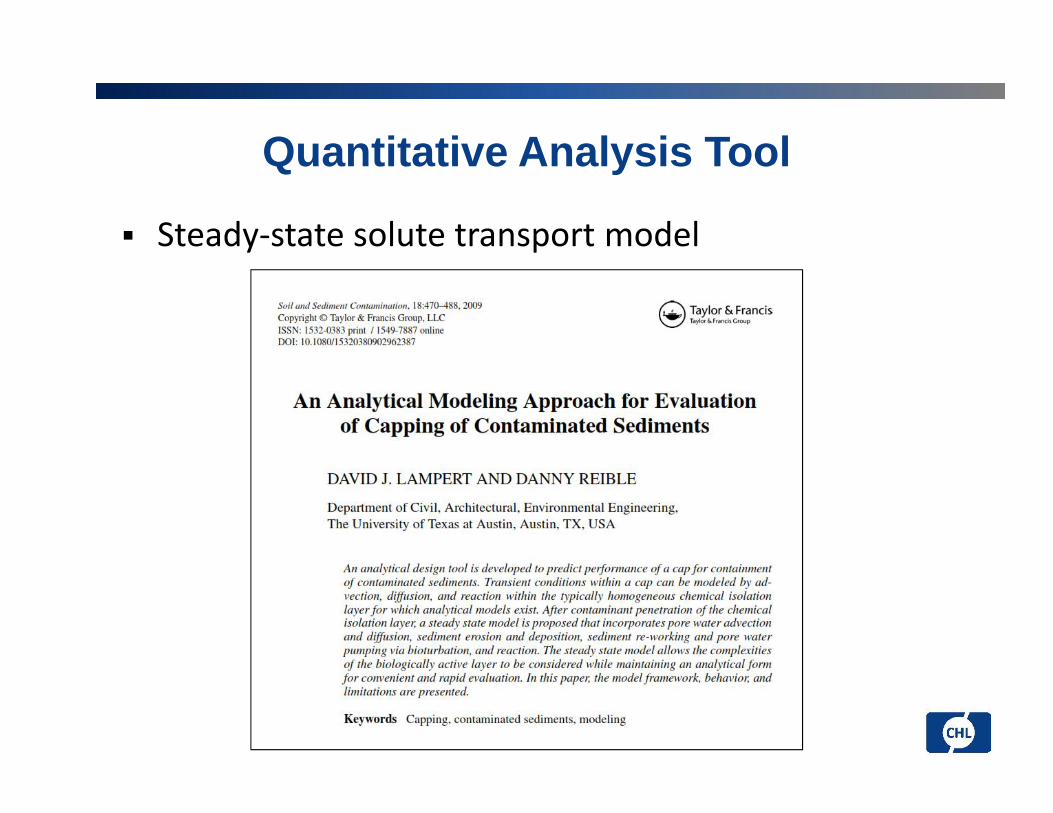
Quantitative Analysis Tool
Steady-state solute transport model

Contaminated Sediment
Surface Water
Cap Analytical Model
Aquifer
PoreWater in
Sand CapUpward
flow
Boundary Condition
Bioturbation zone

Surface Water
Analytical Model – can be used w/out a “cap”
Aquifer
Pore Water inNatural Sediment
Boundary Condition
Upwardflow
Bioturbation zone

Quantitative Analysis: Step-wise Approach
1. Use conservative species (chloride) to quantifymechanical transport processes• Advection• Diffusion• Bioturbation
2. Analyze VOC data using model to quantifydegradation rate

Chloride Profile0 500,000 1,000,000 1,500,000 2,000,000 2,500,000 3,000,000
-5
0
5
10
15
20
25
30
35
40
45
50
55
60
65
70
75
80
Depth (in)
Chloride Porewater Conc (ug/L) at Location SCD81
sediment
surface water
aquifer
Peeper

Chloride Data + Analytical Solution
Data match yields pore water velocity
32
v=30 cm/yr v=22 cm/yr
CC

Chlorobenzene + Analytical Solution
Consistent with literature and other site data
0
20
40
60
80
100
120
0.0 0.5 1.0
Dept
h [c
m]
C/Co
Analytical Solution
SCD78-Chlorobenzene
t1/2=504 dv=27 cm/yr
0
20
40
60
80
100
120
0.0 0.5 1.0
Dept
h [c
m]
C/Co
Analytical Solution
SCD78-Chlorobenzene
t1/2=280 dv=48 cm/yr

Summary
Unusual cause of sediment contamination at this site:– Groundwater plume discharge
Used analytical model of pore water flux to estimate fate andtransport parameters
Chloride plume provides unique condition to indirectly measureseepage velocity
The estimated chlorobenzene anaerobic degradation half-life isconsistent with literature values (280-504 days).
Findings consistent with other site data:– Presence of dehalococcoides in sediment– Compound-Specific Isotope Analysis using sediment pore water samples
34

END