Embed Size (px)
Citation preview

CHIRIOTTI EDITORI
ISSN 1120-1770
Volume XIVNumber 2
2002
Sp
ediz
ion
e in
ab
. po
st. c
om
ma
26 -
art
. 2 -
leg
ge
549/
95 n
. 2/2
002
- To
rin
o

Ital. J. Food Sci. n. 2, vol. 14 - 2002 97
ITALIAN JOURNAL OF FOOD SCIENCE(RIVISTA ITALIANA DI SCIENZA DEGLI ALIMENTI)
Property of the University of PerugiaSupported in part by the Italian Research Council (CNR) - Roma - Italy
Editor-in-Chief:Paolo FantozziDipartimento di Scienze degli Alimenti, Università di Perugia, S. Costanzo, I-06126 Perugia, ItalyTel. +39 075 5857910 - Telex 662078 UNIPG - Telefax +39 075 5857939-5852067E-mail: [email protected]
Assistant Editor:S. Mary F. Traynor, F.S.E.Dipartimento di Scienze degli Alimenti, Università di Perugia, S. Costanzo, I-06126 Perugia, ItalyTel. +39 075 5857912 - Telex 662078 UNIPG - Telefax +39 075 5857939-5852067E-mail: [email protected]
Publisher:Alberto ChiriottiChiriotti Editori s.p.a., Viale Rimembranza 60, I-10064 Pinerolo, ItalyTel. +39 0121 393127 - Telefax +39 0121 794480E-mail: [email protected] - URL: www.chiriottieditori.it
Aim: The Italian Journal of Food Science is an international journal publishing original, basic andapplied papers, reviews, short communications, surveys and opinions in food science(chemistry, analysis, microbiology), food technology (engineering, processing) and related areas(nutrition, safety, toxicity, physiology, dietetics, economics, etc.). Upon request and free of charge,announcements of congresses, presentations of research institutes, books and proceedings mayalso be published in a special “News” section.
Review Policy:The Advisory Board with the Editor-in-Chief will select submitted manuscripts in relationshipto their innovative and original content. Referees will be selected from the Advisory Boardand/or from the “IJFS Official Referee List” composed of 200 qualified Italian or foreignscientists. Acceptance of a paper rests with the referees.
Frequency: Quarterly - One volume in four issues. Guide for Authors and annual indices will bepublished only in number 4 of each volume.
Impact Factor: 0.812 published in the 2000 Journal of Citation Reports, Institute for Scientific Information
Subscription Rate: 2002: Volume XIV Ordinary € 120.00Supporting € 500.00
IJFS is abstracted/indexed in: Chemical Abstracts Service (USA); Foods Adlibra Publ. (USA); Gialine- Ensia (F); Institut Information Sci. Acad. Sciences (Russia); Institute for Scientific Information;CurrentContents®/AB&ES; SciSearch® (USA-GB); Int. Food Information Service - IFIS (D);Int. Food Information Service - IFIS (UK); EBSCO Publishing.
IJFS has a page charge of € 20.00 up to 5 pages; extra pages are € 30.00.Reprints (100) will be sent free of charge.

98 Ital. J. Food Sci. n. 2, vol. 14 - 2002
ITALIAN JOURNAL OF FOOD SCIENCE
ADVISORY BOARD
G. AnelliIst. di Tecnologie AgroalimentariUniversità della TusciaViterbo, ItalyP. BaldiniStaz. Sperim. per l’Industriadelle Conserve AlimentariParma, ItalyC.H. BellCentral Science LaboratorySand HuttonYork, UKA. BertrandInstitut d’OenologieUniversité de BordeauxTalence Cedex, FranceL.B. BullermanDept. of Food Science and TechnologyUniversity of Nebraska-LincolnLincoln, NE, USAC. CannellaIst. Scienza dell’AlimentazioneUniversità di Roma (La Sapienza)Roma, ItalyA. CarnaciniIst. Industrie AgrarieUniversità di BolognaBologna, ItalyM. CatalanoIst. di Industrie AgrarieUniversità di BariBari, ItalyJ.C. CheftelLaboratoire de Biochimie etTechnologie AlimentairesUniversité des Sciences et TechniquesMontpellier, FranceS. CondonDepartment of Food MicrobiologyUniversity CollegeCork, IrelandA. Dal Belin PeruffoDip. Scientifico TecnologicoUniversità di VeronaVerona, ItalyJ.M. FaubionDept. of Grain Science and IndustryKansas State UniversityManhattan, Kansas, USAM.A. De FeliceDip. di Scienze e TecnologieAgro-Alimentari e MicrobiologicheUniversità del MoliseCampobasso, Italy
P.F. FoxDepartment of Food ChemistryUniversity CollegeCork, IrelandD. GallantLaboratoire de TechnologieAppliquée à la NutritionINRA Centre de Recherches de NantesNantes Cedex, FranceS. GarattiniIst. di Ricerche Farmacologiche“Mario Negri”Milano, ItalyA.M. GattusoDip. Economia, Ingegneria eTecnologie Agro-ForestaliUniversità di PalermoPalermo, ItalyR. GiangiacomoIstituto Sperim. Lattiero-CasearioLodi, ItalyM. KarelDept. of Food ScienceRutgers UniversityNew Brunswick, NJ, USAJ.W. KingFood Quality & Safety Research UnitNCAUR-ARS/USDAPeoria, Illinois, USAT.P. LabuzaDept. of Food and Nutritional SciencesUniversity of MinnesotaSt. Paul, MN, USAP. MasiDip. di Scienze degli AlimentiUniversità di Napoli Federico IIPortici, ItalyR. MassiniIst. di Produzioni ePreparazioni AlimentariUniversità di Bari (Sede di Foggia)Foggia, ItalyR. MaterassiDip. di Scienze e TecnologieAlimentari e MicrobiologicheSez. di Microbiologia ApplicataUniversità di FirenzeFirenze, ItalyB. MincioneIst. di Microbiologia eTecnologie Agrarie e ForestaliUniversità di Reggio CalabriaGallina di Reggio Calabria, Italy
J. O'BrienSchool of Biological SciencesUniversity of SurreyGuilford, Surrey, UKM. OhshimaSchool of AgricultureNagoya UniversityNagoya, JapanC. PeriDip. di Scienze e TecnologieAlimentari e MicrobiologicheSez. Tecnologie AlimentariUniversità di MilanoMilano, ItalyS. PorrettaAssociazione Italiana diTecnologie Alimentari (AITA)Milano, ItalyG.B. QuagliaIstituto Naz. della Nutrizione (INN)Unità di Tecnologie AlimentariRoma, ItalyP. RomanoDip. di Biologia, Difesae Biotecnologie Agro-ForestaliUniversità della BasilicataPotenza, ItalyC. RussoIst. di Industrie AgrarieUniversità di CataniaCatania, ItalyE. SenesiInstituto Sperim. per la ValorizzazioneTecnologica dei Prodotti Agricoli(I.V.T.P.A.)Milano, ItalyP. ShermanDept. of Food and Nutritional SciencesKing’s College LondonKensington, London, UKG.W. SmithersCSIRO Div. of Food ProcessingDairy Research LaboratoryHighett, Victoria, AustraliaP. SpettoliDip. di Biotecnologie AgrarieUniversità di PadovaPadova, ItalyL. StepaniakDept. of Food ScienceAgricultural University of NorwayÅsNLH, NorwayJ.R. WhitakerDept. of Food Science and TechnologyUniversity of CaliforniaDavis, CA, USA

Ital. J. Food Sci. n. 2, vol. 14 - 2002 99
PAPER
- Key words: HPLC, imidocarb, validated method -
VALIDATION OF ANALYTICAL METHODSFOR THE DETERMINATION OF IMIDOCARBIN TISSUES AND MILK OF CATTLE, SHEEP
AND GOATS
VALIDAZIONE DI METODI ANALITICI PER LA DETERMINAZIONEDELL’IMIDOCARB IN TESSUTI E LATTE DI BOVINO, PECORA E CAPRA
G. CRESCENZO, O.R. LAI, C. BELLOLI, G. SASSO and P. ORMASDipartimento di Sanità e Benessere degli Animali, Facoltà di MedicinaVeterinaria, Università degli Studi di Bari, S.P. per Casamassima km 3,
70010 Valenzano (BA), Italy
ABSTRACT
In accordance with the Guidelines onValidation of Analytical Procedures sug-gested by the European Agency for theEvaluation of Medicinal Products(EMEA), three methods were used toassess and validate the most suitableprocedure to analyse residual imido-carb concentrations in edible tissuesand milk of cows, sheep and goats.Based on the criteria selected to identi-fy the most suitable analytical method,the best performances were obtainedusing a hexane/isoamyl alcohol liquid-liquid extraction procedure for sheepmilk; after exposing the matrices to en-
RIASSUNTO
Per individuare la metodica analiticapiù idonea per lo studio delle concen-trazioni residuali di imidocarb nei tes-suti edibili e nel latte di bovino, pecora ecapra, sono stati valutati e validati, inottemperanza con le “Guidelines on Va-lidation of Analytical Procedures” stabi-lite dalla European Agency for the Eva-luation of Medicinal Products (EMEA),tre metodi analitici descritti in lettera-tura cui sono state apportate alcunemodifiche. Sulla base di criteri stabilitiper selezionare il metodo analitico piùidoneo, le migliori prestazioni sono sta-te ottenute con un metodo d’estrazione

100 Ital. J. Food Sci. n. 2, vol. 14 - 2002
zymatic digestion before extraction, thesame method was used for the muscle,liver, kidney and fat of sheep and goatsand for goat milk; and an acetone/chlo-roform liquid-liquid extraction methodwas used for all the matrices of cows.The selected methods fulfil the valida-tion criteria recommended by the EUauthorities. The total recovery rangedfrom 70.1% (sheep liver) to 90.8% (cat-tle muscle). The accuracy of the recov-eries was always <30% and the preci-sion of the different methods was al-ways <15% for intra-assay precisionand <16% for inter-assay precision. Theresults obtained show that differentmatrices and animal species have dif-ferent extraction requirements, whichstresses the importance of validatingroutine analytical methods for appro-priate combinations of species and tis-sues.
liquido-liquido esano/alcool isoamilicoper il latte di pecora, con la stessa estra-zione previa esposizione delle matrici adigestione enzimatica per il muscolo, ilfegato, il rene ed il grasso di pecora e dicapra e per il latte di capra e con unmetodo estrattivo liquido-liquido aceto-ne/cloroformio per tutte le matrici di bo-vino. I metodi selezionati soddisfano pie-namente i criteri di validazione racco-mandati dalle autorità della ComunitàEuropea. I recuperi medi ottenuti sonocompresi in un intervallo tra il 70.1%(fegato di pecora) ed il 90.8% (muscolodi bovino). L’accuratezza dei recuperi èrisultata sempre <30% e la precisionedei differenti metodi per le diverse ma-trici sempre <15% per le valutazioni in-tra-assay e <16% per le inter-assay. Irisultati ottenuti mostrano differenzesostanziali nelle esigenze estrattive perle diverse matrici studiate e sottolinea-no ulteriormente l’importanza di un’ac-curata validazione dei metodi analiticiper ciascuna matrice e ciascuna specieanimale.
INTRODUCTION
Imidocarb is a chemotherapeuticagent belonging to the family of carbani-lide derivatives (3.3’-bis(2-imidazolin-2-yl)-carbanilide) having antiprotozoal ac-tivity. It is usually administered as thedipropionate salt and has been used forover 20 years in the treatment andprophylaxis of some protozoal diseasessuch as babesiosis and anaplasmosis indomestic animals, including food-pro-ducing species (cattle, horse, sheep andgoat) (KUTTLER, 1975; 1980; WHO, 1999).
Although imidocarb has proved to bean effective babesiocide and anaplasmo-cide (BEVERIDGE, 1969; RODRIGUEZ andTREES 1996; BRASSEUR et al., 1998),there are some concerns about admin-istering imidocarb to food-producingspecies. The literature concerning the
chemotherapeutic properties of the drugis not supported by adequate investiga-tions on its pharmacokinetic and resid-ual behaviour. The available data areincomplete, limited to some aspects orsome animal species, and have beenobtained without sufficiently reliable andvalidated methods (ALIU et al., 1977;TARBIN and SHEARER, 1992; COLDHAMet al., 1994, 1995; GUMMOW et al., 1995).
It has been reported (ALIU et al., 1977),however, that large amounts of imidocarbpersist in the animal’s body; this has en-gendered concern about its impact onfood for human consumption. Its pro-longed persistence may be ascribed to:
1) the resistance of the drug to bi-otransformation processes, as reportedin in vitro studies on cattle (COLDHAM etal., 1994, 1995) and in vivo studies onsheep (ALIU et al., 1977);

Ital. J. Food Sci. n. 2, vol. 14 - 2002 101
2) the binding of the drug to nuclearcomponents, causing the formation oflarge deposits (particularly in the liverand kidney), that release the moleculevery slowly (COLDHAM et al., 1994, 1995).
In 1998 the European Agency for theEvaluation of Medicinal Products (EMEA)published the conclusions and recom-mendations of the Committee for Veter-inary Medicinal Products with the pro-visional Maximum Residue Limits(MRLs) (expiration 1.1.2002) (CVMP,1998b) for imidocarb in the edible tis-sues of cattle and sheep (300 µg/kg formuscle, 50 µg/kg for fat, 2,000 µg/kgfor liver, 1,500 µg/kg for kidney and 50µg/kg for milk of both species). Variousdocuments (CVMP, 1998b; WHO, 1999)have indicated that the analytical meth-ods suggested in the literature appearto be suitable for regulatory use, but thatadditional investigations would be nec-essary to fully validate the routine ana-lytical methods for appropriate combi-nations of species and tissue matrices.
For the purpose of such validation, aseries of tests were performed on differ-ent matrices of sheep and cattle usingthe available analytical methods withsome modifications. These investigationswere also extended to the milk and edi-ble tissues of goat. Although it is con-sidered a “minor” food-producing spe-cies, these animals are commonly raisedfor human food in Italy and have a con-siderable economic importance especial-ly for milk and dairy products.
The overall characteristics of the ex-traction and analytical procedures test-ed (i.e. recoveries, simplicity, rapidity andconvenience of the procedures, as well asthe cost of the assay and the possibilityof avoiding the use of dangerous solvents)were considered in order to select the bestmethod to analyse imidocarb concentra-tions in the various matrices of the dif-ferent animal species. The suitability ofthe method selected for detecting thepresence of the residual concentration ofimidocarb in the matrices was then con-
firmed by evaluating the validation pa-rameters, namely specificity, linearity,range, accuracy, precision, detection andquantification limit according to theGuidelines on Validation of AnalyticalProcedures suggested by the EMEA(CVMP, 1998a; 2001). The aims of thisinvestigation were to provide data to char-acterise and validate the performance andsuitability of the analytical methods usedto measure imidocarb in edible tissues ofcattle, sheep and goats and to provide atool for further experimental studies onresidue depletion in these important food-producing animal species.
MATERIALS AND METHODS
Chemicals
Acetonitrile and water, both of HPLCgrade, acetone, chloroform, hexane andmethanol were obtained from LAB-SCANAnalytical Sciences (Labscan limited,Dublin, Ireland); 1-pentansulfonic acid,sodium salt 98% HPLC grade and hydro-chloric acid were purchased from ROMILLtd. (Cambridge, CB5 9QT, UK); triethyl-amine, glacial acetic acid, sodium hydrox-ide, sodium chloride and sodium hydro-gen carbonate were obtained from BDHLaboratory Supplies (Poole, BH15 1TD,UK); subtilisin Carlsberg, protease TypeVIII bacterial, phosphate buffered saline(PBS), pH 7.4, isoamyl alcohol and trif-luoroacetic acid were obtained from Sig-ma Chemical Co. (St. Louis, Mo., USA);imidocarb dipropionate analytical stand-ard was kindly supplied by SheringPlough-Animal Health (Verona, Italy).
All solvents and reagents were of ana-lytical-reagent grade.
Analytical procedure
StandardsThe imidocarb stock standard solution
(1 mg/mL) was prepared from the imi-docarb dipropionate reference standard

102 Ital. J. Food Sci. n. 2, vol. 14 - 2002
(batch n. 400196 – 96.1% as is/via base).Five milligrams were accurately weighed,dissolved in 5 mL of distilled water andstored at 4°C. An intermediate standardsolution (100 µg/mL) was prepared bydiluting 200 µL of stock standard solu-tion to 2 mL with water. To assess thelinearity between the reference standardconcentrations and detector response,working standard solutions (10.0 – 5.0 –2.5 – 1.0 – 0.5 – 0.25 – 0.1 – 0.05 – 0.025µg/mL) were obtained from progressivedilutions. Further dilutions were pre-pared to determine the limit of detectionof the method. Intermediate and work-ing solutions were prepared daily.
HPLC systemThe HPLC system (Beckman Instru-
ments, Inc.) was equipped with Program-mable Solvent Module mod. 126, Scan-ning Detector Module mod. 167 and MS-DOS Epson 386sx with System Gold 2000software; Injection valve Rheodyne mod.7725i with a 50 µL loop. Separation wasachieved on a C18 RP column, ABZ+Plus150x4.6 mm 5 µm with pre-column (Su-pelco Inc., Supelco Park, Bellefonte, PA).
High-performance liquid cromatogra-phy
The high performance liquid chroma-tographic conditions used were based onthose described by GUMMOW et al. (1995)for the determination of diminazene incattle plasma with imidocarb used as aninternal standard, with slight modifica-tions. The mobile phases were ace-tonitrile (phase A) and 0.005M 1-pentan-sulfonic acid sodium salt in water con-taining 0.1% triethylamine, adjusted topH 3.2 with glacial acetic acid (phase B).The mobile phases were prepared daily,filtered through a 0.45 µm filter (phasefiltration apparatus with membrane fil-ters – nylon filter 66 – 0.45 µm x 47 mm– Supelco Inc., Supelco Park, Bellefon-te, PA) and degassed under vacuum.
The analysis was performed at a flowrate of 1 mL/min in linear gradient elu-
tion: 0-2 min 10% A; 2-8 min 20% A; 8-12 min 20% A; 12-15 min 10% A. TheUV detector was set at 250 nm.
Extraction procedures
ProtocolThe stock standard solution (1 mg/mL)
was prepared and stored as describedpreviously. Intermediate (100 µg/mL) andworking solutions were prepared daily.Drug-free homogenised samples (2 g) ofeach tissue, or 2 mL of milk, were spikedin triplicate at 3 different final concen-trations of imidocarb dipropionate (1.0,0.5, 0.25 µg/g or mL), stored for 12 h at4°C and then processed with the appro-priate extraction method. Such trials wererepeated on three different days, in orderto establish the intermediate precision ofthe method.
ProceduresThree previously described extraction
methods were used with some modifica-tions to assess and validate the mostsuitable procedure for the matrices in-vestigated.
- Method described by ALIU et al.(1977).
The method is based on a liquid-liq-uid extraction procedure. Briefly, 2 g ofhomogenised tissue in 2 mL of distilledwater (or 2 mL of milk) were made alka-line with 2 mL of 1M NaOH, added to 8mL hexane/isoamyl alcohol (v/v 3:2),vortex-mixed for 1 min, ultrasonicatedfor 20 min at 40°C and centrifuged(4,500 g for 30 min). The organic phasewas collected in a fresh tube, back-ex-tracted with 1 mL of 1N HCl by vortex-mixing for 1 min and ultrasonicated for20 min at 40°C and then centrifuged(4,500 g for 30 min). The aqueous phasewas collected, filtered through a 0.45 µmsyringe filter (Chromafil Einmalfilter type0-45/15, 0.45 µm x 15 mm – Mackery-Nagel, Duren, Germany) and analysedby HPLC.

Ital. J. Food Sci. n. 2, vol. 14 - 2002 103
- Method described by COLDHAM et al.(1994; 1995).
Before the extraction, the sample (2 gof homogenised tissue in 2 mL of dis-tilled water or 2 mL of milk) was enzy-matically digested by adding 2 mg ofsubtilisin in 500 µL of PBS. The samplewas vortex-mixed for 1 min and placedin a thermostatic bath at 56°C for 1 h,with mixing every 10 min. After diges-tion, the sample was made alkaline with2 mL of 1M NaOH. Then, the extractionprocedure previously described for ALIUet al. (1977) was performed.
- Method described by TARBIN andSHEARER (1992).
Some modifications were made to thelast phases of the above procedures.
The homogenised tissue (2 g in 2 mLof distilled water), or 2 mL of milk, 1 mLof 1M aqueous sodium hydrogen carbon-ate and 5 mL acetone were vortex-mixedfor 2 min, placed in an ultrasonic bathfor 10 min at 40°C and centrifuged for10 min at 3,000 g. The supernatant wascollected in a fresh tube and extractionof the matrix was repeated. Chloroform(10 mL), a saturated aqueous solutionof NaCl (4 mL) and 10M NaOH (0.4 mL)were added to the combined superna-tants and vortex-mixed for 1 min, placedin an ultrasonic bath for 10 min at 40°Cand centrifuged (3,000 g for 10 min). Thesubnatant was collected and 1M HCl (0.8mL) was added; it was vortex-mixed for1 min, placed in an ultrasonic bath for10 min at 40°C and centrifuged.
The aqueous phase (about 1 mL) wascollected, filtered through a 0.45 µm sy-ringe filter (Chromafil Einmalfilter type0-45/15, 0.45 µm x 15 mm) and ana-lysed by HPLC.
Validation proceduresValidation of the analytical methods
was performed in accordance with theGuidelines on Validation of AnalyticalProcedures suggested by the EMEA(CVMP, 1998a; 2001).
Linearity of the detector response wasevaluated over the range of concentra-tions from 0.025 to 10 µg/mL (n=3 foreach concentration) by calculating a re-gression line using the least squaremethod. The runs test was applied toanalyse the deviation of the actual datapoints from the regression line.
Specificity of the analytical method foreach matrix was checked by comparingthe chromatograms of blank and spikedsamples after processing with the extrac-tion procedure selected for the investi-gated matrix (n=3 for each matrix).
The recovery was assessed by compar-ing the measured concentration in thespiked samples after extraction with theknown amount of drug added before theextraction. For each matrix, this is ex-pressed as a percentage and reported asthe mean ± SD of 9 replicates for eachconcentration tested (1.0, 0.5, 0.25 µg/g or mL). The mean recovery is expressedas the mean ± SD of 27 determinations(3 concentrations/9 replicates).
Moreover, to express the closeness ofagreement between the known concen-trations and the measured concentra-tions, the accuracy of the recovery wasdetermined by taking the difference be-tween the mean concentration found andthe known added amount of imidocarband then expressing it as a percentage.In the range of concentrations tested, thelimit for the accuracy of recovery of themethods assayed was set at 30%.
The precision of the chromatographicmethod was expressed as the repeata-bility under the same operating condi-tions over a 1-day time interval (intra-assay precision) and as intermediateprecision under intra-laboratory varia-tions over a 3-day period (inter-assayprecision). This was calculated as therelative standard deviation (coefficient ofvariation) of the mean of the values re-corded after extraction (triplicate) foreach matrix investigated and spiked at3 different imidocarb concentrations overa 1-day (intra-assay precision) or 3-day

104 Ital. J. Food Sci. n. 2, vol. 14 - 2002
(inter-assay precision) period. In therange of concentrations tested, the limitfor the precision of the methods assayedwas set at 15% for intra-assay precisionand 16% for inter-assay precision.
Data from the inter-assay evaluationwere also used to test the linearity afterextraction from spiked samples by cal-culating the regression line with the leastsquare method. The runs test was per-formed to determine whether the datadiffered significantly from a straight line.
The Limit of Detection (LOD) was de-termined by establishing the minimumlevel at which the drug was detected re-liably, by analysis of the standard solu-tions with known concentrations of imi-docarb (based on visual evaluation).
The Limit of Quantification (LOQ) wasvalidated at the level of the lowest MRLestablished for imidocarb (50 µg/kg infat and milk) and at one-half and twicethe MRL (CVMP, 1996). The LOQ wasbased on the lowest concentration usedto construct the standard calibrationcurve (0.1, 0.05 and 0.025 µg/mL; 3 rep-licates/5 days) and is expressed as themean of the measured amount of stand-ard (n= 15) plus 3 times the standarddeviation of the mean.
RESULTS
Imidocarb eluted with a retention timeof 9.2±0.10 min. (n=27). The calibrationcurve of the detector response was line-ar (runs test; P>0.05) over the concen-tration range selected (0.025-10 µg/mL)with a regression line equation y = 4.34x+ 0.042 and a correlation coefficientequal to 0.9997.
Under the experimental conditions,the LOD of the detector system was 0.005µg/mL (Fig. 1) and the LOQ was 0.025µg/mL. Considering the concentrationfactor obtained using the extraction pro-cedures performed on 2 g (or 2 mL) ma-trices, the actual LOQ for imidocarb inall tissues and milk was 0.0125 µg/mL.
After a preliminary screening, basedon the criteria we set for defining the bestmethod to determine imidocarb in thedifferent matrices analysed for the dif-ferent animal species (i.e. recoveries,simplicity, rapidity and convenience ofthe procedures as well as cost of the as-say and the possibility of avoiding theuse of dangerous solvents), the methoddescribed by ALIU et al. (1977) proved tobe suitable for obtaining a good perform-ance for sheep milk only since the re-coveries obtained for all the other ma-trices tested were inconsistent. The en-zymatic digestion of the sample, as sug-gested by COLDHAM et al. (1994, 1995),improved the extraction potential of thishexane/isoamyl alcohol liquid-liquid
Fig. 1 - Chromatogram of the standard solution ofimidocarb 0.005 µg/mL (LOD).

Ital. J. Food Sci. n. 2, vol. 14 - 2002 105
procedure, thus obtaining average recov-eries that were always higher than 60%for the muscle, liver, kidney and fat ofsheep and goats and for goat milk. Thisprocedure, however, failed to give valua-ble extraction results for the muscle, liv-er, kidney, fat and milk of cows (recov-eries were always inconsistent and lessthan 20%). For these matrices, the ace-tone/chloroform liquid-liquid methoddescribed by TARBIN and SHEARER(1992) appeared to be the most reliableprocedure. Based on these preliminaryobservations, the method described byALIU et al. (1977) was submitted to fur-ther validation for sheep milk, the meth-od suggested by COLDHAM et al. (1994,1995) was validated for muscle, liver,kidney and fat of sheep and for all thegoat matrices investigated and the meth-od described by TARBIN and SHEARER(1992) was validated for the cow matri-ces.
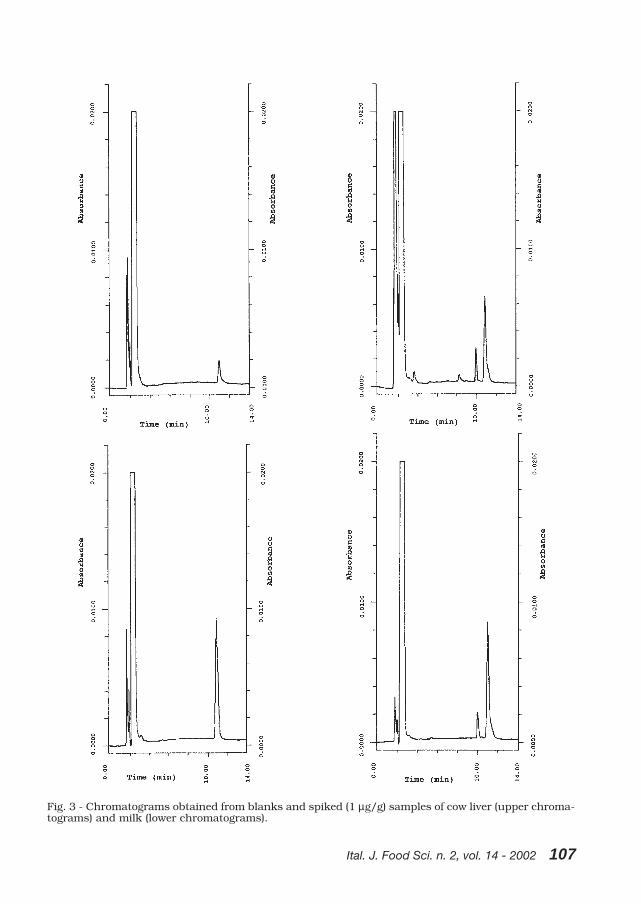
Imidocarb extracted from tissue elut-ed free of interference; typical blank andspiked sample chromatograms obtainedfrom liver and milk, using the selectedextraction conditions for each matrix, areshown in Figs. 2 and 3. The same fig-ures also depict the specificity of the an-alytical procedures (lack of interferenceat the imidocarb retention time in thechromatograms of the blank samples) forthe milk and liver of sheep, goats andcattle. The specificity was confirmed forall the matrices analysed.
The accuracy of the recoveries and themean recovery obtained for each matrix,as well as the precision of the differentmethods expressed by the relative stand-ard deviation (coefficient of variation)calculated over a 1-day (intra-assay pre-cision) or a 3-day period (inter-assayprecision) are reported for sheep matri-ces (Table 1), goat matrices (Table 2) andcow matrices (Table 3).
The linearity after extraction fromspiked samples (runs test P>0.05) is re-ported in Table 4, where the equationsfor the regression analysis and correla-
tion coefficients are reported for the tis-sues and milk of the three animal spe-cies.
DISCUSSION
The validation parameters obtained forthe HPLC analytical procedure selectedfor the detection of imidocarb in foodproducts of animal origin ensure that themethod is suitable for regulatory useaccording to the MRLs for imidocarb inthe edible tissues of cattle and sheep(CVMP, 1998b) and according to theguidelines on validation of analytical pro-cedures suggested by the European au-thorities (CVMP, 1998a; 2001).
By introducing the mobile phase flowrate in linear gradient elution into theoriginal method (GUMMOW et al., 1995),a significant improvement in peak reso-lution was obtained. Moreover, the shiftto 9.18 min of retention time versus 5.4min described by GUMMOW et al. (1995)produced a much “cleaner-looking” chro-matogram, ensured separation of imido-carb from possible co-extractives andallowed a relatively short run time whichis suitable for practical purposes (rou-tine analysis) since the run is done in15 min.
Given that the aim of the present in-vestigation was to validate analyticalmethods suitable for the regulatory eval-uation of imidocarb in milk and edibleanimal tissue, the sensitivity of the meth-od was not fully evaluated and the LOQwas calculated in compliance with therequirements for the LOQ/MRL ratio asestablished by the EU authorities (CVMP,1996), at the lowest concentration on astandard curve including the MRL val-ues and one-half and twice the MRL. Thismade it possible to obtain actual LOQsfor imidocarb in all tissues and in milk(0.0125 µg/mL), ensuring good precisionand detection of the drug at the MRLsset by the EU authorities (300 µg/kg formuscle, 50 µg/kg for fat, 2,000 µg/kg

106 Ital. J. Food Sci. n. 2, vol. 14 - 2002
Fig. 2 - Chromatograms obtained from blanks and spiked (1 µg/g) samples of sheep liver (upper chro-matograms) and milk (lower chromatograms).
Ital. J. Food Sci. n. 2, vol. 14 - 2002 107
Fig. 3 - Chromatograms obtained from blanks and spiked (1 µg/g) samples of cow liver (upper chroma-tograms) and milk (lower chromatograms).

108 Ital. J. Food Sci. n. 2, vol. 14 - 2002
Table 1 - Recovery, accuracy and precision of imidocarb determination in sheep matrices spiked withdifferent concentrations of the drug and extracted with the suitable method: liver, muscle, fat andkidney (COLDHAM et al., 1994; 1995), milk (ALIU et al., 1977).
Matrix Fortification Recovery Mean recovery Accuracy Intra-day mean Inter-dayµg/g ± s.d. % (n=9) ± s.d. (n=27) % reading (n=3) R.S.D. % reading (n=9) R.S.D. %
liver 1 70.2±0.72 70.1±2.21 29.8 0.71 0.64 0.70 1.030.5 69.7±3.17 30.3 0.35 9.56 0.35 4.550.25 70.4±2.25 29.6 0.18 3.45 0.18 3.19
muscle 1 77.8±1.97 74.3±2.65 22.2 0.77 2.42 0.78 2.540.5 76.8±2.51 23.2 0.39 2.30 0.38 3.270.25 76.6±3.42 23.4 0.20 2.14 0.19 4.46
fat 1 90.7±1.84 84.91±3.76 9.3 0.92 2.73 0.91 2.030.5 86.5±3.66 13.5 0.44 3.08 0.43 4.230.25 87.0±4.17 13.0 0.22 4.21 0.22 4.79
kidney 1 88.5±1.20 83.8±2.33 11.5 0.89 0.86 0.88 1.360.5 86.9±2.21 13.1 0.44 2.60 0.43 2.550.25 85.4±2.48 14.6 0.22 4.23 0.21 2.91
milk 1 80.2±1.53 75.5±3.31 19.8 0.81 3.25 0.80 1.900.5 77.4±3.69 22.6 0.38 2.27 0.39 4.770.25 77.3±3.70 22.7 0.19 2.96 0.19 4.79
for liver, 1,500 µg/kg for kidney and 50µg/kg for milk of cows and sheep).
To date, no MRL values have been es-tablished for meat and milk of a “minorspecies”, like goat. However the EMEAhas published guidelines whereby the
Table 2 - Recovery, accuracy and precision of imidocarb determination in goat matrices (liver, muscle,fat, kidney and milk) spiked with different concentrations of the drug and extracted with the suitablemethod (COLDHAM et al., 1994; 1995).
Matrix Fortification Recovery Mean recovery Accuracy Intra-day mean Inter-dayµg/g ± s.d. % (n=9) ± s.d. (n=27) % reading (n=3) R.S.D. % reading (n=9) R.S.D. %
liver 1 71.3±0.76 71.2±2.68 28.7 0.72 0.64 0.71 1.070.5 71.9±3.18 28.1 0.35 4.68 0.36 4.420.25 70.5±3.42 29.5 0.18 4.22 0.18 4.85
muscle 1 76.7±1.80 72.5±2.82 23.3 0.77 2.68 0.77 2.340.5 74.8±3.15 25.2 0.39 1.46 0.37 4.210.25 74.0±2.92 26.0 0.19 4.01 0.19 3.94
fat 1 89.9±2.12 86.34±3.64 10.1 0.92 1.68 0.90 2.350.5 88.6±3.63 11.4 0.45 3.54 0.44 4.090.25 90.1±4.89 9.9 0.22 5.62 0.23 5.43
kidney 1 88.4±2.39 83.6±2.85 11.6 0.89 1.81 0.88 2.710.5 85.7±2.93 14.3 0.44 2.05 0.43 3.420.25 85.9±2.67 14.1 0.22 1.37 0.21 3.10
milk 1 64.7±2.59 59.6±3.83 35.3 0.62 1.45 0.65 4.010.5 61.3±2.34 38.7 0.30 4.10 0.31 3.820.25 59.6±4.53 40.4 0.15 7.85 0.15 7.60
MRL established for cattle (considered amajor species) could be extrapolated tothe other minor ruminant species suchas goats (CVMP, 1997). Hence, the resid-ual levels set for cattle and sheep canalso apply to goats and the proposed

Ital. J. Food Sci. n. 2, vol. 14 - 2002 109
Table 3 - Recovery, accuracy and precision of imidocarb determination in cow matrices (liver, muscle,fat, kidney and milk) spiked with different concentrations of the drug and extracted with the suitablemethod (TARBIN and SHEARER, 1992).
Matrix Fortification Recovery Mean recovery Accuracy Intra-day mean Inter-dayµg/g ± s.d. % (n=9) ± s.d. (n=27) % reading (n=3) R.S.D. % reading (n=9) R.S.D. %
liver 1 75.0±8.56 76.2±8.86 25.0 0.75 4.55 0.75 11.410.5 71.4±9.18 28.6 0.38 5.40 0.36 12.860.25 82.1±5.49 17.9 0.21 4.82 0.21 6.69
muscle 1 89.6±10.6 90.8±7.79 10.4 0.96 9.61 0.90 11.860.5 88.9±6.10 11.1 0.43 2.23 0.44 6.850.25 93.7±5.7 6.3 0.23 5.75 0.23 6.08
fat 1 93.1±4.56 90.1±7.18 6.9 0.93 5.71 0.93 4.900.5 91.2±6.77 8.8 0.43 13.26 0.46 7.420.25 86.0±8.41 14.0 0.19 10.58 0.22 9.77
kidney 1 86.4±7.30 87.9±7.82 13.4 0.88 8.21 0.86 8.440.5 84.6±8.43 15.4 0.42 12.92 0.42 9.970.25 92.7±5.76 7.3 0.23 4.23 0.23 6.21
milk 1 85.7±7.50 84.8±6.78 14.3 0.83 14.62 0.86 8.750.5 82.4±4.38 17.6 0.42 4.20 0.41 5.320.25 86.3±8.02 13.7 0.22 12.95 0.22 9.29
Table 4 - Linearity parameters of the selected methods after extraction of imidocarb in sheep, goat andcow tissues and milk (samples spiked with 1.0, 0.5, 0.25 mg/mL imidocarb dipropionate). Runs test>0.05.
Sheep Goat CowTissue Regression line Correlation Regression line Correlation Regression line Correlation
equation coefficient equation coefficient equation coefficient
Liver y = 0.702x - 0.0002 0.9999 y = 0.711x + 0.0004 0.9999 y = 0.741x + 0.006 0.9978Muscle y = 0.778x - 0.002 0.9999 y = 0.768x - 0.0046 0.9998 y = 0.893x - 0.0008 0.9998Fat y = 0.908x - 0.0078 0.9993 y = 0.898x - 0.0012 0.9999 y = 0.935x - 0.0062 0.9998Kidney y = 0.887x - 0.0044 0.9999 y = 0.884x - 0.0059 0.9997 y = 0.857x - 0.0046 0.9993Milk y = 0.803x - 0.0058 0.9989 y = 0.649x - 0.0086 0.9989 y = 0.853x - 0.0014 0.9989
method appears to be suitable for inves-tigating residues in this species.
The findings of this investigation showremarkable differences in the extractionrequirements for imidocarb among thematrices and animal species analysed.The strong retention of the drug in theliver (MOORE et al. 1996) was confirmedby the recoveries obtained from thismatrix; the values were always lowerthan those of the other tissues but high-er than those reported in the literature(COLDHAM et al., 1994, 1995). Consid-
ering the good precision (less than 15%)of the methods used for the tissue ana-lysed and the complexity of the matrix,accuracy of the recoveries is consideredto be satisfactory.
As stated previously, the criteria fordefining the most suitable method to bevalidated were based on the recoveriesobtained in preliminary trials, as well assimplicity, rapidity, convenience, costand safety of the procedures.
Based on these criteria, the best per-formances for sheep milk were obtained

110 Ital. J. Food Sci. n. 2, vol. 14 - 2002
with the method described by ALIU etal. (1977), for the muscle, liver, kidneyand fat of sheep and goats and for goatmilk with the method described by COLD-HAM et al. (1994, 1995) and for the mus-cle, liver, kidney, fat and milk of cowswith the method described by TARBIN etal. (1992).
The method described by ALIU et al.(1977) features all the required charac-teristics and thus is suitable for the de-termination of imidocarb in sheep milk,as demonstrated by the precision andaccuracy of the recovery values obtainedin this study. The method was, however,totally inadequate for extracting imido-carb from tissues; this is probably dueto the strong bonding to the cellular com-ponents, as described by MOORE et al.(1996). A similar explanation can be sug-gested for the unsatisfactory extractionperformances when applied to cow andgoat milk, which are characterised byquantitatively different cellular compo-nents (RUCKEBUSCH et al., 1991;SCHODER et al., 1993).
The accuracy of the extraction of imi-docarb from the tissue of sheep and goatsand from goat milk was improved by firstenzymatically digesting the samples, assuggested by COLDHAM et al.(1994,1995); satisfactory parameterswere obtained with a single extractioninstead of the two suggested by COLD-HAM et al. (1994, 1995), thus making theprocedure faster and more cost-effective.Even if the accuracy of the recovery val-ues calculated for goat milk were higherthan the set limit (30%), the good preci-sion and linearity of the method mayensure good analytical results. This pro-cedure may therefore be preferred overother more complicated and more expen-sive methods.
The enzymatic breakdown of imido-carb bonds from the cellular componentswas not enough to extract the drug fromthe cow tissues and milk. For these ma-trices, some of the conditions suggestedby TARBIN and SHEARER (1992) were
used (clean-up with acetone in the pres-ence of sodium carbonate and chloro-form), but the modified purification pro-cedure that was followed, resulted in afaster, easier and less expensive methodthan the original one. Moreover, goodrecovery, precision and linearity of themethods were obtained starting with lesstissue (about 1/5), requiring the use ofless solvent, mainly of acetone and chlo-rinated compounds, further curbingcosts and enhancing safety.
Although data from inter-laboratorytrials are also necessary for a conclusivevalidation, the results obtained are ingood agreement with the EU validationcriteria (CVMP, 1998a; 2001) and, regard-less of the tissue and animal speciesanalysed, a substantial number of sam-ples could be processed per day with allthe extraction procedures.
While no hypothesis may be put forthto explain the differences in the extrac-tion steps required for the different tis-sues or, for the same matrix, among thedifferent species, the results clearly in-dicate the importance of fully validatingroutine analytical methods for appropri-ate combinations of species and tissuematrices.
ACKNOWLEDGEMENTS
The authors thank Dr. Luciano Gobbi (Mallinck-rodt Veterinary) for supplying the imidocarbstandard and Dr. Athina Papa for revising theEnglish text. This investigation was supportedby a grant from the Ministry of University andof Scientific and Technological Research, 1998and by a grant (UE/Italian State) from the Mul-tiregional Operative Programme, 1994-1999).
REFERENCES
Aliu Y.O., Davis P.H., Camp B.J. and Kuttler K.L.1977. Absorption, distribution and excretion ofimidocarb dipropionate in sheep. Am. J. Vet.Res. 38: 2001.
Beveridge E. 1969. Babesicidal effect of basicallysubstituted carbanilides. Res. Vet. Sci. 10: 534.

Ital. J. Food Sci. n. 2, vol. 14 - 2002 111
Brasseur P., Lecoublet S., Kapel N., Favennec L.and Ballet J.J. 1998. In vitro evaluation of drugsusceptibilities of Babesia divergens isolates.Antimicrob. Agents Chemother. 42: 818.
Coldham N.G., Moore A.S., Sivapathasundaram S.and Sauer M.J. 1994. Imidocarb depletion fromcattle liver and mechanism of retention in iso-lated bovine hepatocytes. Analyst 9: 2549.
Coldham N.G., Moore A.S., Dave M., Graham P.J.,Sivapathasundaram S., Lake B.G. and Sauer M.J.1995. Imidocarb residues in edible bovine tissuesand in vitro assessment of imidocarb metabolismand cytotoxicity. Drug Metab. Disp. 23: 501.
CVMP (Committee for Veterinary Medicinal Prod-ucts) 1996. Position paper on Requirements forLOQ/MRL ratio. EMEA/CVMP/274/96-FINAL.
CVMP (Committee for Veterinary Medicinal Prod-ucts) 1997. Note for Guidance on the Estab-lishment of Maximum Residue Limits for MinorAnimal Species. EMEA/CVMP/153a/97-FINAL.
CVMP (Committee for Veterinary Medicinal Prod-ucts) 1998a. Guideline on Validation of Analyt-ical Procedures: Methodology. EMEA/CVMP/VICH/591/98-FINAL.
CVMP (Committee for Veterinary Medicinal Prod-ucts) 1998b. Imidocarb. Summary report.EMEA/MRL/444/98.
CVMP (Committee for Veterinary Medicinal Prod-ucts) 2001. Development and Validation of aproposed regulatory method. EMEA/CVMP/573/00-FINAL.
Gummow B., Du Preez J.L. and Swan G.E. 1995.Paired-ion extraction and high-performance liq-uid chromatographic determination of dimina-
zene in cattle plasma: a modified method.Onderstepoort J. Vet. Res. 62: 1.
Kuttler K.L. 1975. The effect of imidocarb treat-ment on Babesia in the bovine and the tick(Boophilus microplus) Res. Vet. Sci. 18: 198.
Kuttler K.L. 1980. Pharmacotherapeutics of drugsused in treatment of anaplasmosis and babesi-osis. J. Am. Vet. Ass. 176: 1103.
Moore A.S, Coldham N.G. and Sauer M.J. 1996 Acellular mechanism for imidocarb retention inedible bovine tissues. Toxicol. Lett. 87: 61.
Rodriguez R.I. and Trees A.J. 1996. In vitro re-sponsiveness of Babesia bovis to imidocarb di-propionate and selection of a drug-adapted line.Vet. Parasitol. 62: 35.
Ruckebusch Y., Phaneuf L.P. and Dunlop R. 1991.“Physiology of Small and Large Animals” p. 619.B.C. Decker Inc., Philadelphia, Hamilton.
Schoder G., Baumgartner W. and Pernthaner A.1993. Variation of somatic cell counts in sheepand goat milk during the lactating period. In“Proceedings of the International Symposiumon Machine Milking of Small Ruminants” May14-20, Budapest, Hungary – Asbury Publica-tions Ltd, Cheltenham, UK.
Tarbin J.A. and Shearer G. 1992. High-perform-ance liquid chromatographic determination ofimidocarb in cattle kidney with cation-exchangeclean-up. J. Chromatogr. 577: 376.
WHO 1999. Technical Report Series 888. – Evalu-ation of certain veterinary drug residues in food.50th report of the Joint FAO/WHO Expert Com-mittee on Food Additives. Rome – Italy, 17-26February 1998.
Revised paper received December 13, 2001 Accepted March 5, 2002

112 Ital. J. Food Sci. n. 2, vol. 14 - 2002

Ital. J. Food Sci. n. 2, vol. 14 - 2002 113
PAPER
- Key words: antioxidant capacity, beer, chemiluminescence, luminol, tea, wine -
CHEMILUMINESCENT DETERMINATIONOF ANTIOXIDANT CAPACITY
OF BEVERAGES
DETERMINAZIONE CHEMILUMINESCENTEDELLA CAPACITÀ ANTIOSSIDANTE IN BEVANDE
S. GIROTTI, L. BOLELLI, F. FINI, R. BUDINI1 and G. ARFELLI2
Unità Complessa di Scienze Chimiche, Radiochimiche e MetallurgicheUniversità degli Studi di Bologna, Via San Donato 15, 40127 Bologna, Italy
1 Dipartimento di Chimica “Ciamician”,Università degli Studi di Bologna, Via Selmi 2, 40126 Bologna, Italy
2 Dipartimento di Scienze degli Alimenti,Università degli Studi di Bologna, Via San Giacomo 7, 40126 Bologna, Italy
ABSTRACT
The antioxidant capacity of variousbeverages was determined via chemi-luminescence in a rapid and sensitivemanner. The method is based on theinhibition of light generated by a radi-cal intermediate of the oxidation of lu-minol and catalyzed by horseradishperoxidase. The beers and wines ana-lyzed showed that the antioxidant ca-pacity may be related to the totalpolyphenol content. A low quantity ofsample, short measuring times and therapid preparation of samples are thenumerous advantages of this method.Repeatability and reproducibility, ex-
RIASSUNTO
La capacità antiossidante di diversebevande può essere determinata in unmodo rapido e sensibile tramite la che-miluminescenza. Il metodo è basatosull’inibizione della luce generata da unintermedio radicalico della reazione diossidazione del luminolo e catalizzatadalla perossidasi da rafano. Le birre e ivini analizzati hanno mostrato che lacapacità antiossidante può essere mes-sa in relazione al contenuto totale dipolifenoli. Una piccola quantità di cam-pione, tempi di misura brevi e la rapi-da preparazione dei campioni sono trai vantaggi di questo metodo. L’impreci-

114 Ital. J. Food Sci. n. 2, vol. 14 - 2002
pressed as coefficient of variation, werenormally less than 10%.
sione (ripetibilità e riproducibilità)espressa come coefficiente di variazio-ne è normalmente inferiore al 10%.
INTRODUCTION
Substances which perform an antioxi-dant action are of increasing clinical andnutritional interest (SIMONETTI et al.,1997), since they are capable of neutral-izing the harmful effects of free radicals,that generally have a very high chemicalreactivity (DUTHIE, 1999; ROBERFROIDand CALDERON, 1995).
At the biological level, the mechanismsthat are quantitatively most importantin triggering and maintaining radicalizedreactions are the monoelectronic reduc-tion of oxygen and lipid peroxidation,mostly involving O2, H2O2 and polysatu-rated fatty acid molecules (DUTHIE,1999).
The life of free radicals is extremelyshort, and if they are not immediatelyneutralized by a physiological accepter,they can damage biological systems tosuch an extent that a chain reaction isset off, which may even cause a varietyof pathological conditions (GHISELLI etal., 2000A; GERMAN and WALZEM, 2000).
All aerobic organisms have developedmore or less complex systems to neu-tralize free radicals before their poten-tially harmful effect is activated, most ofwhich derive directly or indirectly fromO2. Nutritional elements are also ex-tremely important (ROBERFROID andCALDERON, 1995).
Foods that have potential or definiteantioxidant capacities are mainly vege-tables and fruits, as well as beverageslike red wine, tea and beer. Wine is wellappreciated because of its organolepticqualities and is also a source of antioxi-dant substances such as flavonoids (an-thocyanins, flavonols, catechins and leu-coanthocynanins) and resveratrol
(NATELLA et al., 2001; GERMAN andWALZEM, 2000). The beneficial effects oftea derive primarily from ingredientssuch as antioxidant substances(polyphenols or flavonoids), nutritionalcompounds and xanthine (mainly caf-feine) (DUFFY et al., 2001).
Beer contains tannins, which are anti-oxidants, as well as other antioxidantssuch as carotenoids and tocopherols(GOUPY et al., 1999) capable of reducingthe oxidization of low density lipoproteins(LDL) and neutralizing the “pro-oxidiz-ing” effects of ethanol (GERMAN andWALZEM, 2000). The polyphenols foundin beer include phenolic acids, whoseantioxidant activities are greater whenthese substances are present in a boundform (MAILLARD and BERSET, 1995). Thepolyphenol content of beer varies accord-ing to the barley cultivar used and tendsto decrease (ca. 30%) during the malt-ing process (YADAV et al., 2000). Hopsalso contribute to the antioxidant activ-ity in beer, particularly due to thepolyphenols, which are about 2-5%.
It has been reported that the con-sumption of food and beverages rich inflavonoids, and in particular polyphenolsmay increase the antioxidant capacity ofhuman serum (WHITEHEAD et al., 1992;GERMAN and WALZEM, 2000; GHISELLIet al., 2000B). Black tea has considera-ble protective effects against oxidationof human red blood cells and the perox-idation of membrane lipids in vitro (HAL-DER and BHADURI, 1998). Moderate con-sumption of beer by patients with coro-nary illnesses tends to increase plasmalevels of high-density lipoproteins (HDL)and tocopherol (GORINSTEIN et al., 1997).This is controversial, however, becauseother studies have not shown any effect

Ital. J. Food Sci. n. 2, vol. 14 - 2002 115
of these beverages on plasma antioxidantcapacity and LDL oxidizability (DE VRIESet al., 2001; VISSERS et al., 2001) andactually the real effect of these substanc-es in vivo is yet to be established. Thereis no statistical evidence that coronaryheart disease is reduced in areas of highred wine consumption, but wine hasbeen shown to reduce endothelin-1 syn-thesis and this may help prevent coro-nary heart disease (CORDER et al., 2001).
Meanwhile, there is growing interestin substances with antioxidant capaci-ties, and numerous methods for deter-mining antioxidant capacity have beendeveloped and compared (PRIOR andCAO, 1999; DUTHIE, 1999; BENZIE andSZETO, 1999). The aim of this study wasto optimize and apply a chemilumines-cent (CL) method (WHITEHEAD et al.,1992) to determine the antioxidant ac-tivity in various beverages.
MATERIALS AND METHODS
Reagents
Luminol (5-amino-2,3-dihydrophthala-zine-1,4-dione) and horseradish peroxi-dase (HRP, E.C. 1.11.1.7, Grade II) wereobtained from Boehringer Mannheim(Germany), and hydrogen peroxide (30%)was from Merck (Milan, Italy). Trolox (6-hydroxy-2,5,7,8-tetramethylchroman-2-carboxylic acid, 98% pure), a water solu-ble vitamin E analogue, from Fluka (Mi-lan, Italy) was used as the reference anti-oxidant. All other reagents and com-pounds were of analytical-reagent grade.All of the solutions were prepared withpyrogen-free reagent-grade water usinga Mill-Q system (Millipore, Milan, Italy).
Samples
Red wine samples were diluted1:1,000 in 0.1 M potassium phosphatebuffer (pH 7.4) and stored in the darkfor about 10 min before analysis.
Tea samples were prepared directlyusing teabags or by weighing 1.5 g of tea(loose, the equivalent of one teabag) andpouring in 100 mL of distilled water,which had been brought to boiling. Partof the solution was filtered after 3, 5, 7and 10 min to allow complexation of thecaffeine with the tannins. It was thencooled and diluted 1:1,000 with 0.1 Mpotassium phosphate buffer (pH 7.4),before analysis.
The samples of sweetened tea wereprepared in the same way as the teafor the calibration curves, with the ad-dition of 1 teaspoonful of sugar (4 g), 2teaspoonfuls (8 g) and 3 teaspoonfulsof sugar (12 g) to 150 mL of tea.
Beer was diluted 1:100 with 0.1 Mpotassium phosphate buffer (pH 7.4)without de-aeration.
Instrumentation
An LKB-Wallac 1250 luminometer(Turku, Finland) was used to measurelight emission. It used a photomultipliertube as detector, which converted thelight produced by the sample into anelectric signal. The signal was amplifiedand then displayed on paper by meansof an LKB 2210 potentiometric recorder,which converted it into mV.
Chemiluminescent assay
The CL mixture was prepared at thetime of analysis by mixing 3 mL of 10mM hydrogen peroxide solution with 50µL of 2 mM luminol solution, and then200 µL of the mixture was supplement-ed with 20 µL of the peroxidase solu-tion, obtained by diluting the stock so-lution (1 mg/mL) in a suitable manner(normally 1:7) in 0.1 M potassiumphosphate buffer (pH 7.4) (GIROTTI etal., 2002).
The peroxidase catalyzed the oxidationof the luminol. This mixture constitutedthe reference system, representing 100%of the light emission in the absence of

116 Ital. J. Food Sci. n. 2, vol. 14 - 2002
inhibition by the sample or standardantioxidant solutions.
To evaluate the total antioxidant ca-pacity of the samples examined, 10 µLof the sample or the standard solutionswere injected into the cuvette once theemission had reached a maximum. Byrecording the data on paper, the kinet-ics of the emission could be followed todetect the time when the reaction wasat a maximum. As an analytical param-eter, the time required to reach 30% ofthe initial light emission was measured,and the antioxidant capacity was ex-pressed by comparing the inhibition timeof the samples with those of the variouspoints on the calibration curve, ex-pressed as mM of Trolox in the bever-age.
Calibration curves
A stock solution of 10 µM Trolox (2.5mg/L) was diluted in 0.1 M potassiumphosphate buffer (pH 7.4), and the cali-bration curve was drawn in the intervalof 1-10 µM. In the case of wine, oenocy-
the phenol OH groups in an alkalinemedium by adding sodium carbonate(SINGLETON and ROSSI, 1965). Measure-ments were made after two hours byreading the absorbance at 750 nm on aSHIMADZU PC 1204 spectrophotome-ter (Shimadzu, Kyoto, Japan) and cal-culating the concentration (g/L) accord-ing to a calibration curve using gallicacid as standard in the range 12.5-500mg/L.
RESULTS AND DISCUSSION
The CL method suggested by WHITE-HEAD et al. (1992) was modified and op-timized for the various matrices ana-lysed, with the aim of obtaining a meth-od which was simple to perform, widelyapplicable and reliable, and which alsoused stable, low-cost and easily handledreagents.
Light emission occurs when luminol,the CL substrate, is oxidized by hydro-gen peroxide in a catalytic reaction withHRP:
anine (E-163, natural coloring agent), anextract of Vitis vinifera (Enocianina For-naciari, Italy), made of a mixture of grapeanthocyanins, was also used as a refer-ence standard, by diluting an aqueoussolution of 60 mg/L oenocyanine to con-centrations between 3 and 30 mg/L.
Standard solutions for the calibrationcurve of sweetened tea were made byadding 4, 8 and 12 g of sugar to threecontainers each containing 150 mL ofblack tea infusion.
Polyphenol analysis
The method was based on the reac-tion of the Folin Ciocalteau reagent with
Continuous light emission depends onthe constant production of free radicalintermediates derived from luminol andoxygen. For this reason light emission issensitive to interference by radical scav-enging (chain-breaking) antioxidants butwill be restored when all the added anti-oxidants have been consumed in the re-action. If the generation of radical inter-mediates is constant, then the length oftime of light suppression will be directlyrelated to the amount of antioxidantpresent (WHITEHEAD et al., 1992).
Reagents for CL determination werehighly stable, could be kept for monthsand used for numerous experiments,apart from the hydrogen peroxide solu-
H2O2/OH-
LUMINOL → PHTALATE ION + N2 + H2O + light (425 nm)Catalyst (HRP)
Ital. J. Food Sci. n. 2, vol. 14 - 2002 117
tion, which had to be prepared beforethe analysis, and was stable for 5-6hours.
Evaluation of antioxidant capacity oftea samples
Various varieties of teas were preparedfor infusion, and their antioxidant ca-pacity was determined after infusion for3, 5, 7 and 10 min. The results (notshown) showed that the antioxidant ca-pacity generally remained constant withregard to infusion time, although maxi-mum antioxidant activity took place af-ter 5 min, which is in agreement withthe literature (LIEBERT et al., 1999).
The antioxidant capacity of tea in tea-bags was lower (ca. 10-30%) than thatof loose leaf tea, probably because thebag material inhibited the extraction ofthose substances into the solution (LAN-GLEY-EVANS, 2000).
The antioxidant capacity of loose leaf
teas corresponded to a concentration ofTrolox of around 4.2±0.2 mM (standarddeviation, n = 3) for green (non-ferment-ed) tea, and 3.4±0.2 mM for black (fer-mented) tea, with the exception of Twin-ings black tea, which had a higher anti-oxidant capacity than other teas (around5.1±0.3 mM) probably due to the pres-ence of lemon as a flavouring (BENZIEand SZETO, 1999).
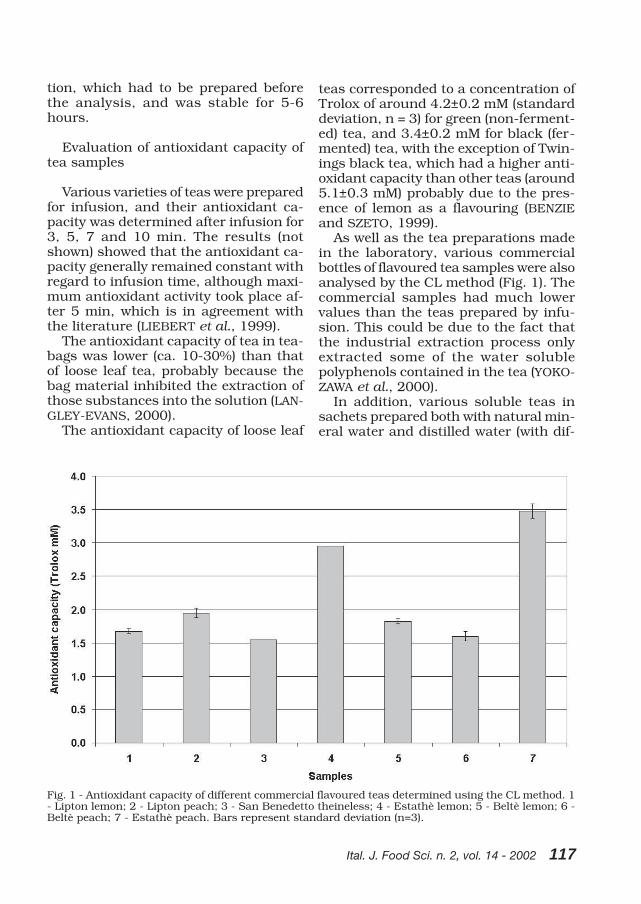
As well as the tea preparations madein the laboratory, various commercialbottles of flavoured tea samples were alsoanalysed by the CL method (Fig. 1). Thecommercial samples had much lowervalues than the teas prepared by infu-sion. This could be due to the fact thatthe industrial extraction process onlyextracted some of the water solublepolyphenols contained in the tea (YOKO-ZAWA et al., 2000).
In addition, various soluble teas insachets prepared both with natural min-eral water and distilled water (with dif-
Fig. 1 - Antioxidant capacity of different commercial flavoured teas determined using the CL method. 1- Lipton lemon; 2 - Lipton peach; 3 - San Benedetto theineless; 4 - Estathè lemon; 5 - Beltè lemon; 6 -Beltè peach; 7 - Estathè peach. Bars represent standard deviation (n=3).

118 Ital. J. Food Sci. n. 2, vol. 14 - 2002
ferent ion content) were analyzed. Nodifference in the antioxidant capacitywas detected with regard to the waterused, and it was therefore concluded thatthe ions dissolved in the water do notinterfere with the analysis. As with bot-tled tea, the antioxidant capacity of sol-uble teas in sachets was far lower (be-tween 1.4 and 1.6 mM Trolox), comparedwith tea infusions, which reached val-ues higher than 5 mM of Trolox, as inthe case of Twinings.
The antioxidant activity of black teainfusion was evaluated after 5 min, af-ter adding increasing amounts of sugar(saccarose), as this substance couldhinder the inhibition of CL, and there-fore reduce the apparent antioxidantcapacity. The addition of variousamounts of sugar, equivalent to 1, 2 or3 teaspoonfuls, reduced the antioxidantcapacity, and the greater the amount ofsugar added, the more was the antioxi-
dant capacity reduced (Fig. 2). The lengthof time between the injection of the sam-ple and the return of the light signal to30% of the initial value decreased, goingfrom 0 to 4, 8 and 12 g of sugar added.For the 12 g addition it was impossibleto detect any antioxidant capacity, be-cause it was not possible to measure thelight inhibition.
The addition of an aspartame-basedsweetener to the same amount of tea alsoreduced the antioxidant activity to a sim-ilar degree as adding one teaspoonful ofsugar. The inhibition was similar to the4 g addition (Fig. 2, thin continuous line).
Evaluation of antioxidant capacity inbeer samples
Despite the high specificity and sen-sitivity of the chromatographic tech-niques normally used for the determi-nation of total polyphenols in a variety
Fig. 2 - Comparative inhibition curves of tea solutions containing 4 g ( ), 8 g ( ), 12 g (.......) ofsugar and the unsugared tea solution ( ) using the CL method.L L L

Ital. J. Food Sci. n. 2, vol. 14 - 2002 119
of matrices [GOUPY et al., 1999], the CLmethod has the advantage of being sim-ple, rapid and easy to apply to evaluatethe antioxidant capacity of beer. Thesample could be analysed directly, with-out removing gas (it was simply diluted)and without requiring specific tempera-ture, pH, or other conditions, such asHPLC.
Fig. 3 shows the antioxidant capacityof various types of beers. These valueswere in accordance with the polyphenolcontent (y = 0.0001x - 0.017, r = 0.815, y= CL method and x = polyphenol content,p<0.01) derived from the raw materials(malt, maize, hops) and in particular fromthe different degrees of barley toasting.
As shown in Fig. 3, the antioxidantcapacity was far higher in Weiss andGuinness, an almost black dark full-bodied beer having an aromatic verybitter taste, which was produced by theaddition of caramel with a low alcoholcontent (4°-5°). In comparison to light
beers, the higher antioxidant capacityof dark beer could be due to the greaternumber of Maillard reaction productsand the greater amount of hops added(CARNOVALE, 1996). In the case of Weiss,a different base raw material (grain asopposed to barley) is used and thechemical and physical stabilizationtreatments are milder, therefore allow-ing substances with antioxidant activi-ty to remain.
Evaluation of antioxidant capacity inwine samples
Red wine is an important food in termsof containing certain types of radical“scavenger” molecules. The correlationbetween the polyphenol content in wineand the CL antioxidant capacity has beenpreviously demonstrated, r = 0.8525,p<0.01 (GIROTTI et al., 2002).
To confirm the reliability of the CLmethod, various types of red wines were
Fig. 3 - Antioxidant capacity of different beer samples determined using the CL method (gray bar) withvarying polyphenol contents (white bar). 1 - Peroni; 2 - Moretti; 3 - Dreher; 4 - Beck’s; 5 - Guinnessextra; 6 - Weiss; 7 - Adelscott. Bars represent standard deviation (n=3).

120 Ital. J. Food Sci. n. 2, vol. 14 - 2002
analyzed. The antioxidant capacity of thevarious wines depended directly on thepolyphenol content. In this respect, itwas interesting to look at the differenc-es between the various cultivars, the areaof production and the winemaking tech-nique used with regard to the same cul-tivar. In particular, the antioxidant ca-pacity was lower in the “novello” wine(100% carbonic maceration) comparedto the Sangiovese wines produced in thetraditional manner from the same redgrapes (Fig. 4). In this case too, the prep-aration of the wine samples was verysimple, and only required dilution.
To detect the possible antioxidant ef-fect caused by the ethanol contained inthe various wine samples, ethanol solu-tions were prepared in buffers with thesame degree of alcohol (12%) as thewines analyzed. The inhibition of the sig-nal from such solutions was negligible
(Fig. 5). White wines as references werealso analyzed under the same conditions(Fig. 5). The inhibition effect was notice-ably different: the signal did not fall tovalues close to zero after injection as withthe red wine samples, and in addition itrose again very rapidly, though it did notregain the maximum emission level. Thecalculation of the antioxidant capacityfor white wine must be slightly modified,as the signal was not inhibited up tovalues below 30% of the initial value.Therefore, it was necessary to use an-other parameter (70% of inhibition) tocalculate the possible antioxidant capac-ity of white wine, which was, however,less significant than that of red wine.
The change in antioxidant capacityduring aging of Sangiovese wine in oakbarrels is shown in Fig. 6. The antioxi-dant capacity determined by the CLmethod was compared with the total
Fig. 4 - Antioxidant capacity of different wine samples determined using the CL method (gray bar) withvarying polyphenol contents (white bar). 1 = Cabernet sauvignon; 2 = Montepulciano; 3 = Lambrusco diSorbara; 4 = Sangiovese A; 5 = Sangiovese B: 6 = Sangiovese C; 7 = Sangiovese “novello”. Bars representstandard deviation (n=3).

Ital. J. Food Sci. n. 2, vol. 14 - 2002 121
Fig. 5 - Comparative inhibition curves of a 12% ethanol solution (....... ), white wine (�__�__) and red wine(-. -. -. -) using the CL method.
polyphenol content. The antioxidant ca-pacity was not linear compared with thatof total polyphenols, particularly between50 to 150 days of storage, while the gen-eral increase of the antioxidant capacitywith time is in accordance with the lim-ited but constant increase in polyphe-nol content.
CONCLUSIONS
The CL method is suitable for determin-ing the antioxidant capacity of beverages,and offers numerous advantages over chro-matographic methods. It is simple, onlyrequiring dilution of the sample, fast witha good detection limit (1 µM of Trolox), rel-
Fig. 6 - Antioxidant capacity of Sangiovese wine determined using the CL method (- - - - - - - -) and itstotal polyphenol content (________) during affination in oak casks.
L L L_._._
122 Ital. J. Food Sci. n. 2, vol. 14 - 2002
atively inexpensive (about 0.31 Euro peranalysis) and reagents are stable over time,without the need for excessively costly in-struments, or instruments which requirea high degree of handling. Repeatability andreproducibility, expressed as a coefficientof variation, were normally less than 10%.Therefore, the CL system could be readilyapplied to study tea, beer and wine, alsoevaluating different production conditions,like the effect of storage and type of barrelon the antioxidant capacity of red wine.
ACKNOWLEDGEMENTS
This work was supported by grants from MURST(Ministero della Università e della Ricerca Scien-tifica e Tecnologica) and from the University ofBologna (Ricerca Fondamentale Orientata andFunds for Selected Research Topics). A specialthanks to Dr. S. Luppi and Dr. L. Maccagnanifor the data collection.
REFERENCES
Benzie I.F. and Szeto Y.T. 1999. Total antioxidantcapacity of teas by the ferric reducing/antioxi-dant power assay. J. Agric. Food Chem. 47: 633.
Carnovale E. 1996. “Maillard Reaction Products: Nu-tritional Aspects”. Proceedings of Round Table on:Maillard reaction, Cluep (Ed.) p. 87. Padova, Italy.
Corder R., Douthwaite J.A., Less D.M., Khan N.Q.,Viseus dos Santos A.C., Wood E.G. and CarrierM.J. 2001. Health: Endothelin-1 synthesis re-duced by red wine. Nature 414: 863.
De Vries J.H.M., Hollman P.C.H., van Amersfoot I,Olthof M.R. and Katan M.B. 2001. Red wine is apoor source of bioavailable flavonols in men. J.Nutrit. 131: 745.
Duffy S.J., Keaney J.F., Holbrook M., Gokce N.,Swerdloff P.L., Frei B. and Vita J.A. 2001. Short-and long-term black tea consumption reversesendothelial dysfunction in patients with coro-nary artery disease. Circulation 104: 151.
Duthie G.G. 1999. Determination of activity of antioxi-dants in humans subjects. Proc. Nutr. Soc. 58: 1015.
German J.B. and Walzem R.L. 2000. The healthbenefits of wine. Annu. Rev. Nutrit. 20: 561.
Ghiselli A., Serafini M., Natella F. and Scaccini C.2000a. Total antioxidant capacity as a tool toassess redox status: critical view and experimen-tal data. Free Radic. Biol. Med. 29: 1106.
Ghiselli A., Natella F., Guidi A., Montanari L., Fan-tozzi P. and Scaccini C. 2000b. Beer increasesplasma antioxidant capacity in humans. J. Nutr.Biochem. 11: 76.
Girotti S., Bolelli L., Budini R. and Arfelli G. 2002.Comparison of analytical methods in determin-ing total antioxidant capacity in red wine. Anal.Letters 35: 747.
Gorinstein S., Zemser M., Berliner M., GoldsteinR., Libman I., Trakhtenberg S. and Caspi A.1997. Moderate beer consumption and positivebiochemical changes in patients with coronaryarteriosclerosis. J. Internal Med. 242: 219.
Goupy P., Hugues M., Boivin P. and Amiot M.J. 1999.Antioxidant composition and activity of barley(Hordeum vulgare) and malt extract and isolatedphenolic compounds. J. Sci. Food Agric. 79: 1625.
Halder J. and Bhaduri A.N. 1998. Protective role ofblack tea against oxidative damage of humanred blood cells. Biochem. Biophys. Res. Com-mun. 244: 903.
Langley-Evans S.C. 2000. Antioxidant potential ofgreen and black tea determined using the ferricreducing power (FRAP) assay. Int. J. Food Sci.Nutr. 51: 181.
Liebert M., Licht U., Böehm V. and Bitsch R. 1999.Antioxidant properties and total phenolics contentof green and black tea under different brewing con-ditions. Z. Lebensm. Unters. Forsch. A 208: 217.
Maillard M.N. and Berset C. 1995. Evolution ofantioxidant activity during kilning: role of in-soluble bound phenolic acids of barley and malt.J. Agric. Food Chem. 43: 1789.
Natella F., Ghiselli A., Guidi A., Ursini F. and Scac-cini C. 2001. Red wine mitigates the postpran-drial increase of LDL susceptibility to oxidation.Free Radic. Biol. Med. 30: 1036.
Prior R.L. and Cao G. 1999. In vivo total antioxi-dant capacity: comparison of different analyti-cal methods. Free Radic. Biol. Med. 27: 1173.
Roberfroid M. and Calderon B.P. (Eds.). 1995. “FreeRadicals and Oxidation Phenomena in Biologi-cal Systems”. Marcel Dekker, Inc., New York.
Simonetti P., Pietta P. and Testolin G. 1997.Polyphenol content and total antioxidant poten-tial of selected Italian wines. J. Agric. FoodChem. 45: 1152.
Singleton V.L. and Rossi J.A. 1965. Colorimetry oftotal phenolics with phosphomolybdic-phospho-tungstic acid reagents. Am. J. Enol. Vitic. 16: 144.
Visser M.N., Zock P.L., Wiseman S.A., Meyboom S.and Katan M.B. 2001. Effect of phenol-rich ex-tra virgin olive oil on markers of oxidation inhealthy volunteers. Eur. J. Clin. Nutr. 55: 334.
Yadav S.K., Luthra Y.P., Sood D.R. and AggarwalN.K. 2000. Giberellic acid (GA3) induced changesin proanthocyanidins and malt quality of two-and six-row husked barleys. Plant Foods Hu-man Nutr. 55: 87.
Yokozawa T., Cho E. J., Hara Y. and Kitani K.2000. Antioxidative activity of green tea treat-ed with radical initiator 2,2’-azobis(2-aminopropane)dihydrochloride. J. Agric. FoodChem. 48: 5068.
Whitehead T.P., Thorpe G.H.G. and Maxwell S.R.L.1992. Enhanced chemiluminescent assay forantioxidant capacity in biological fluids. Anal.Chem. 266: 265.
Revised paper received February 6, 2001 Accepted April 5, 2002

Ital. J. Food Sci. n. 2, vol. 14 - 2002 123
PAPER
- Key words: Bread-making, durum wheat, new cultivars, quality -
BREAD-MAKING QUALITYOF ITALIAN DURUM WHEAT
(TRITICUM DURUM DESF.) CULTIVARS
QUALITÀ PANIFICATORIA DI VARIETÀ ITALIANE DI FRUMENTO DURO
M. PALUMBO, A. SPINA and G. BOGGINIIstituto Sperimentale per la Cerealicoltura, Sezione di Catania, Via Varese 43,
95123 Catania, Italy - e-mail: [email protected]
ABSTRACT
The bread-making characteristics of23 Italian durum wheat cultivars grownin Sicily in 1998-1999 are reported.Protein content, farinograph curves, al-veographic parameters, glutenin com-position and semolina colour were de-termined and an experimental bread-making test was carried out. Environ-mental conditions strongly affected thequalitative characteristics of the varie-ties. All the technological evaluationsshowed a wide range of variation alsoamong genotypes in all environments.Loaf volume was correlated with alveo-graphic P/L. The new cultivars Colora-
RIASSUNTO
Vengono riportati i risultati delle ana-lisi relative alla qualità panificatoria,condotte su 23 varietà di grano durocoltivate in Sicilia nel biennio 1997/98-1998/99. Sui campioni di semola sonostati determinati il contenuto proteico,i parametri farinografici ed alveograficinonché il colore della semola; è statoinoltre effettuato il test di panificazio-ne sperimentale. Le condizioni ambien-tali hanno influenzato sensibilmente lecaratteristiche qualitative delle varietàin prova. I risultati delle valutazionichimiche e tecnologiche hanno mostra-to in tutti gli ambienti un’ampia varia-

124 Ital. J. Food Sci. n. 2, vol. 14 - 2002
do, Mongibello, Varano and Svevo arewell suited for bread-making and arecharacterized by the “7+8” or “6+8”HMW glutenins.
bilità anche fra i genotipi. Il volume delpane è risultato correlato con il P/L al-veografico. Le nuove cultivar Colorado,Mongibello, Varano e Svevo sono emerseper elevata qualità panificatoria. Que-ste varietà sono caratterizzate dalla pre-senza delle glutenine APM “7+8” o“6+8”.
INTRODUCTION
Early baking studies showed that du-rum wheat flours were unsuitable forbread-making (JAGO and JAGO, 1921;GERHARD, 1925; WIHLFAHRT, 1928).However, SHEPARD (1903) showed thatmany people preferred bread made fromdurum wheat to ordinary bread, due toits palatable and nutritional qualities.GEDDES (1932) reported that breadmade from durum wheat remained freshfor a longer time than bread made fromcommon wheat flours. He also indicatedthat durum wheat was used extensivelyfor bread-making in Russia.
KALTSIKES et al. (1968) produced adurum wheat genotype with high bread-making quality by crossing a durumwheat variety with a common breadwheat variety. AMENDOLA and LUND-BERG (1970) reported that durum flourwas used for French and Italian types ofbread which require a high protein con-tent.
The development of strong gluten du-rum wheat cultivars in Italy, Canada andthe U.S.A. has increased their potentialuse as a bread flour. DEXTER et al. (1981)reported that some new cultivars of du-rum wheat have approached acceptablelevels for baking. They also found no fun-damental differences in the functionalproperties of durum wheat gluten com-pared with that of common wheat.
Genotype is an important factor thataffects the bread-making characteristicsof durum flour (JOSEPHIDES, 1982). DEX-TER et al. (1994) showed the importance
of protein content on durum bread vol-ume and the impact that fermentationtime can have on bread quality. AMMARet al. (2000) have postulated that glutenextensibility is an important factor fordetermining durum bread-making qual-ity. RAO et al. (2001) pointed out theimportance of the balance between glu-ten elasticity and extensibility.
In a number of regions in southernItaly, bread is mainly made from durumwheat. Therefore, BOGGINI (1985) eval-uated the bread-making qualities of 25durum wheat cultivars that were grownin Italy in 1984. Further studies (BOG-GINI et al., 1988, 1994) showed that thebest cultivars for bread-making qualitywere characterized by the γ “45” gliadinband. BOGGINI and POGNA (1989) inves-tigated the bread-making quality of oth-er Italian durum wheat cultivars and theinfluence of the high molecular weight(HMW) glutenin subunits on this char-acteristic and found that the HMW glu-tenin composition appeared to affectbread-making quality. The cultivars hav-ing the subunit pair “7+8” producedhigher bread volumes than cultivars withthe subunit “20” or the subunit pair“6+8”. AMMAR et al. (2000) and PENA etal. (1994) also showed the relationshipbetween HMW glutenin composition andbread-making quality, while LIU et al.(1996) reported a relationship betweengluten strength and LMW glutenin alle-les.
CUBADDA et al. (1987) and PASQUI etal. (1991) have demonstrated that breadvolume, softness and shelf-life depend

Ital. J. Food Sci. n. 2, vol. 14 - 2002 125
on the alveographic characteristics of thedough and doughs with low P/L andmoderate W values give high bread vol-ume and soft crumbs.
QUICK and CRAWFORD (1983) andDICK (1988) in the U.S.A., OZEN (1986)in Turkey, BAKHSHI and BAINS (1987) inIndia and WILLIAMS et al. (1988) in Syriaand Jordan evaluated the bread-makingcharacteristics of the durum wheat va-rieties grown in these countries and thepossibility of using durum wheat flourto improve the quality of common wheat.
BOGGINI and POGNA (1990) blendedcommon wheat flour of poor bread-mak-ing quality with flours from 29 Italiandurum wheat cultivars. The addition of25% durum wheat flour significantly in-creased the loaf volume. The same re-sults were obtained by BOYACIOGLU andD’APPOLONIA (1994 a, b, c), who alsodemonstrated how additives and bakingprocedures influenced durum breadcharacteristics.
This paper reports the bread-makingcharacteristics of Italian durum wheatgenotypes as well as the evolutionarytrends of these characteristics in the Ital-ian germplasm.
MATERIALS AND METHODS
Nineteen new Italian cultivars and fourwidespread varieties of durum wheat(Creso, Duilio, Ofanto, Simeto) weregrown in four Sicilian environments: Lib-ertinia and Mineo, in 1997-98 and Lib-ertinia and Aragona in 1998-99. Follow-ing procedures described by BOGGINI etal. (1994), grain samples were milledusing an experimental laboratory mill(Bona, Monza, Italy) with sieves of 54 and42 GG and the qualitative parameters ofthe semolina were analyzed.
Protein content (% dry matter) wasdetermined with an Infratec 1229 GrainAnalyzer (Foss Tecator, Höganäs, Swe-den) by Near Infrared Transmittance(NIT), using a calibration based on Kjel-
dahl nitrogen determinations. Farino-graph curves were obtained using a mod-el 810105001 Brabender instrument(Brabender OHG, Duisburg, Germany).Water absorption, mixing time, degree ofstability and softening index (12 min af-ter peak time) were measured (AACC,1979b). Alveograph parameters, strengthof the dough (W) and ratio of tenacity (P)to extensibility (L), were determined us-ing a model MA87 Chopin alveograph(Group Tripette & Renaud, Villeneuve-La-Garenne, France) according to UNI(1995). The bread-making test was car-ried out according to the AACC proce-dure (1979a) which was modified fordurum wheat by BOGGINI and POGNA(1989) to obtain two loaves from 100 gof semolina, each. The characteristics ofloaf volume, weight, crust roughness andcolour and crumb porosity were record-ed. Crumb porosity was estimated bymeans of the Dallmann scale. In Italycrumb colour is considered an aestheticadvantage for durum wheat bread.Therefore in the second year of trials, theyellow semolina colour index (b*) wasdetermined using a model CR 300 Mi-nolta colorimeter (Minolta, Osaka, Ja-pan), by means of a CIE colour systemand using the colour space L* a* b*.
Statistical analysis of variance of thequalitative parameters was carried outand the results were then representedin “box plot” (Systat software) where thecentre horizontal line indicates the me-dian of the samples, the length of eachbox shows the range within which thecentral 50% of the values fall and thewhiskers show the range of non anoma-lous values observed (that fall within 1.5Hspreads of the hinges). Values betweenthe inner and outer fences are plottedwith asterisks. Values beyond the outerfences, called far outside values, are plot-ted with empty circles.
SDS-PAGE electrophoretic patterns oflow molecular weight (LMW) and highmolecular weight (HMW) glutenin subu-nits were determined for all genotypes,

126 Ital. J. Food Sci. n. 2, vol. 14 - 2002
according to the method described byDAL BELIN PERUFFO et al. (1981).
RESULTS AND DISCUSSION
All the varieties were characterized byLMW glutenin type 2 and HMW at thelocus Glu A1 type “Nulli”. The subunitsat Glu B1 were quite different (Table 1).The Colosseo and Nefer cultivars had the“13+16” gluteninic component and Par-sifal “6+17”, which are usually onlypresent in small quantities in Italiangermplasm. The majority of cases werecharacterized by the “7+8”, “6+8” and“20” composition. It is also important tonote that the Iride and Italo varieties were
heterogeneous, i.e. having equal percent-ages of two gluten types.
Concerning the semolina colour (Ta-ble 1), the Colorado cultivar had thehighest yellow colour values, while theGianni, Duilio and Creso varieties hadthe lowest values.
Regarding the semolina protein con-tent (Fig. 1), a satisfactory average level(14.3% d. m.) was recorded at Libertin-ia in 1998, where the environmentalconditions also allowed the genotypesto obtain high yields (6.01 t/ha). All thecultivars had a protein content greaterthan 13.0%. In the same year, the sem-olina from the Mineo site, had the low-est average percentage of protein(13.6%), which was probably due to anattack of brown rust which lowered theaverage yield (3.75 t/ha). The Plataniand Ciccio varieties, grown at Mineo in1998 had the lowest protein contentvalues (12.2 and 12.4%, respectively).These two values are lower than the low-est non-anomalous values and aremarked in Fig. 1 with an asterisk. In
Table 1 - Glutenin composition and yellow indexof the 23 durum wheat cultivars.
Cultivars HMW Yellow indexglutenins subunits of
at Glu – B1 semolina (1)
BRONTE 7+8 19.94CICCIO 7+8 21.93COLORADO 6+8 26.93COLOSSEO 13+16 20.16CRESO 6+8 18.50DUILIO 7+8 19.43DURFORT 6+8 23.36FORTORE 7+8 23.02GARGANO 7+8 20.35GIANNI 7+8 17.57IRIDE *7+8/6+8 21.66ITALO *6+8/20 23.25MONGIBELLO 7+8 23.77NEFER 13+16 22.63OFANTO 20 22.11PARSIFAL 6+17 20.98PLATANI 7+8 23.29SAN CARLO 7+8 21.46SIMETO 7+8 22.19SVEVO 7+8 25.05TRESOR 20 22.42VALBELICE 20 21.60VARANO 7+8 20.19
* Heterogeneous composition;(1) Means of two environments, in 1998/99.
Fig. 1 - Protein content of the 23 cultivars in thefour environments: 1 = Libertinia 98; 2 = Mineo98; 3 = Libertinia 99; 4 = Aragona 99.Values between the inner and outer fences are plot-ted with asterisks.

Ital. J. Food Sci. n. 2, vol. 14 - 2002 127
1999, rather high protein contents wererecorded at Libertinia and Aragona, 15.1and 14.8%, respectively, together withsatisfactory average yields (4.98 and5.48 t/ha, respectively). In both locali-ties most of the varieties had proteincontents over 14%; in particular, thecultivars Nefer, Colorado, Svevo andMongibello from Libertinia and SanCarlo, Svevo and Nefer from Aragonaexceeded 16% protein content.
A marked difference between the twoyears is noted in the alveographic indexP/L (Fig. 2). In the first year both locali-ties had low average values with littlevariation. Only the Tresor cultivar fromMineo (marked with an asterisk in Fig.2) had an alveographic index value (2.72)higher than the highest non-anomalousvalue. The same cultivar from Libertiniaalso had the highest non-anomalousvalue (2.34) of all the cultivars examined.In the second year, higher values wererecorded with wider ranges of variationin both localities. This result was due toa sudden rise in the atmospheric tem-perature, particularly at Libertinia, dur-ing physiological maturation, which cancause an increase in gluten tenacity, asalready observed in bread wheat byBORGHI et al. (1997).
Regarding the alveographic index W(Fig. 3), the satisfactory protein levelsreached in 1998 at Libertinia and in1999 at Aragona and Libertinia contrib-uted to the higher values. In both testlocalities in 1998, the cultivar Varanohad strong gluten, as shown by the two“outside values”, that were higher thanthe highest non-anomalous value (aster-isk in Fig. 3). The cultivar Valbelice fromLibertinia in 1999 and even more so fromAragona had a very low dough strength,with W levels below the lowest non-anomalous value (87 and 84 10-4 x Joulesrespectively). At Aragona the value wasstatistically “far outside value” (emptycircle, Fig. 3). At Aragona in 1999, the Wmean value was around 200. San Carloand Durfort had values that were high-
er than the highest non-anomalous val-ue (300 and 268, respectively), while thevalues achieved by Parsifal were slightly
Fig. 2 - Alveographic P/L index of the 23 cultivarsin the four environments: 1 = Libertinia 98; 2 =Mineo 98; 3 = Libertinia 99; 4 = Aragona 99.Values between the inner and outer fences are plot-ted with asterisks.
Fig. 3 - Alveographic index W of the 23 cultivars inthe four environments: 1 = Libertinia 98; 2 = Min-eo 98; 3 = Libertinia 99; 4 = Aragona 99.Values between the inner and outer fences are plot-ted with asterisks. Values beyond the outer fenc-es, called far-outside-values, are plotted with emptycircles.

128 Ital. J. Food Sci. n. 2, vol. 14 - 2002
lower than the lowest non-anomalousvalue (144).
The results from the experimentalbread-making tests showed the lowestaverage bread volume (372 cm3) in sam-ples made with semolina from Libertin-ia in 1999, while the highest bread vol-ume (432 cm3) was obtained in 1998 withsamples made with semolina from thesame locality (Fig. 4). While there was awide range of variation at all the envi-ronments, a value higher than the highnon-anomalous value was only record-ed at Libertinia in 1998 for the cultivarColorado (550 cm3, asterisk, Fig. 4).Comparing the data in Fig. 4 with thatin the previous figures, a negative asso-ciation emerges between the alveograph-ic P/L and the bread volume. In fact, thehighest bread volumes were achieved insamples from environments whichshowed lower tenacity/elasticity ratios.The correlations among the semolinaqualitative parameters and bread char-acteristics show a highly significant neg-ative relationship between loaf volumeand alveographic P/L (r = -0.69 ***),which was previously demonstrated by
BOGGINI et al. (1994). Loaf weight waspositively correlated with farinographicwater absorption (r = 0.57 **) and nega-tively correlated with loaf volume (r = -0.46 *).
In Table 2, the protein content, alveo-graphic indexes (P/L and W) and farino-graph parameters (average of 4 environ-ments) of all the varieties analyzed arereported. Regarding the protein content,the Colorado and Svevo varieties had thehighest average values (15.6%) in all theenvironments, followed by the cultivarsNefer, Mongibello and San Carlo, withvalues between 15.5% and 15.0%. Pla-tani and Ciccio, which had particularlylow protein contents at Mineo in 1998(Fig. 1), also had low protein contents atthe other environments. Colorado, Val-belice and Parsifal had mean alveograph-ic P/L values below 1, while the valuesfor Ofanto were slightly over 1. The sameperformance was observed in all the en-vironments, which indicates a greaterstability of the cultivars in this respect.A high gluten tenacity was confirmed forTresor (Fig. 2), along with Simeto, Duil-io, San Carlo, Gianni and Italo. The cul-tivars Varano, San Carlo and Durfort(already indicated in Fig. 3) and Mon-gibello had the highest mean alveograph-ic W values. These cultivars had high Wvalues in all environments, whereasthere was a large variability betweenyears for the remaining cultivars. Highmean farinographic water absorbtionvalues were recorded particularly for theTresor, Italo, Varano, Svevo and Garga-no cultivars, but all the varieties showedsatisfactory values for this parameter.The San Carlo, Varano, Mongibello andDurfort cultivars had the best values forfarinograph mixing times (>200 s). Thisparameter provides information aboutthe time required to obtain optimaldough consistency. High farinographicdough stability was recorded for Mon-gibello, San Carlo, Varano, Svevo, Cresoand Nefer. In contrast Parsifal, Garga-no, Ofanto and Valbelice showed low sta-
Fig. 4 - Loaf volume of the 23 cultivars in the fourenvironments: 1 = Libertinia 98; 2 = Mineo 98; 3 =Libertinia 99; 4 = Aragona 99.Values between the inner and outer fences are plot-ted with asterisks.

Ital. J. Food Sci. n. 2, vol. 14 - 2002 129
Table 2 - Qualitative characteristics of the 23 cultivars (average of 4 environments).
Cultivars Protein Alveograph Farinographcontent(% d.m.) P/L W water mixing dough
(10-4 J) absorption (%) time (s) stability (s)
BRONTE 14.4 cg 1.85 ci 165.07 eh 60.93 be 156 fh 302 bdCICCIO 13.1 j 2.10 ei 172.99 dg 61.23 ae 166 dh 254 cfCOLORADO 15.6 a 0.68 a 170.32 dg 58.87 fh 190 bf 258 cfCOLOSSEO 14.6 cf 1.75 ch 184.56 cf 61.70 ae 174 bg 288 bdCRESO 14.8 bd 2.19 fi 191.84 ce 61.80 ae 176 bg 356 acDUILIO 14.1 dh 2.54 i 171.22 dg 60.85 be 168 ch 282 bdDURFORT 14.5 cf 1.52 bg 220.71 bd 61.53 ae 202 bc 288 bdFORTORE 14.5 cf 1.39 ae 179.50 dg 60.05 eg 174 bg 252 cfGARGANO 14.8 bc 1.48 bf 137.52 fi 62.21 ad 150 gh 162 efGIANNI 14.0 eh 2.43 hi 155.81 eh 61.18 ae 156 fh 196 dfIRIDE 13.8 gh 1.97 di 183.70 cf 58.54 gh 158 eh 276 ceITALO 14.5 cf 2.24 gi 171.19 dg 62.79 ab 150 gh 188 dfMONGIBELLO 15.1 ac 1.34 ad 232.99 ac 61.31 ae 204 b 448 aNEFER 15.5 ab 1.57 bg 177.31 dg 58.16 h 190 bf 346 acOFANTO 13.6 hj 1.12 ac 119.50 hi 58.98 fh 148 gh 158 fPARSIFAL 14.7 ce 0.94 ab 130.82 gi 60.57 df 172 bg 164 efPLATANI 13.3 ij 1.77 ch 193.40 ce 59.88 eh 180 bg 322 bcSAN CARLO 15.0 ac 2.49 hi 267.29 ab 61.23 ae 258 a 450 aSIMETO 14.0 eh 2.56 i 186.22 cf 61.32 ae 192 be 314 bcSVEVO 15.6 a 1.39 ae 205.28 ce 62.46 ad 182 bg 368 acTRESOR 14.4 cg 2.56 i 208.54 ce 63.09 a 200 bd 250 cfVALBELICE 13.9 fi 0.74 a 93.17 i 60.69 cf 134 h 146 fVARANO 14.8 bc 1.94 di 270.67 a 62.64 ac 236 a 397 abMEANS 14.46 1.76 182.16 60.96 178.96 281.09L.S.D. 0.65 0.64 44.38 1.64 29.34 98.48
Values followed by the same letter are not significantly different at P = 0.05 according to Duncan’s multiple rangetest.
bility values (around 160 s), confirmingthe low gluten strength already indicat-ed by the low alveographic W values.
The main parameters of the bread-making test are reported in Table 3. Theresults demonstrate that Colorado hadthe highest bread volume, followed bySvevo, Mongibello and Varano. The goodbread-making aptitude of these cultivarswas observed in samples from each en-vironment. Similar results, but with low-er volume values, were recorded for For-tore, Valbelice and Parsifal. Loaf weightis important from an economic point ofview because it indicates the bread yield.The variability of this parameter was low.
San Carlo loaves were the heaviest, whileFortore, Colorado, Iride and Parsifalloaves were the lightest. High breadcrumb porosity was recorded for Iride,Italo, San Carlo and Varano, whereasTresor had the lowest value. The Italo,San Carlo and Valbelice varieties showedthe highest roughness of crust values(≥2). The cultivars Ciccio, Creso, Gian-ni, Iride, Nefer, Ofanto and Simeto hadslightly rough crusts (>1.3). The remain-ing varieties showed smooth, regularcrusts (= 1). As for crust colour, durumwheat bread usually has a golden crustand a lighter colour than bread madewith common wheat flour. Ciccio, Bron-

130 Ital. J. Food Sci. n. 2, vol. 14 - 2002
te and Iride, had high yellow index val-ues, while Creso and Italo had highbrown index values.
Evolutionary trends of durum wheatvarieties for bread-making
From 1984 until 1999, the Catania sec-tion of the Experimental Institute for Ce-real Research evaluated 90 durum wheatvarieties. Fig. 5 shows the variation of theloaf volume indexes (using = 100 as theannual average loaf volume of Creso, avariety that is present in all the years)
Table 3 - Results of bread-making test (average of 4 environments).
Cultivars Loaf Loaf Porosity (1) Crust Crust colour (3)
volume weight roughness (2)
(cm3) (g) yellow brownindex (b*) index (a*)
COLORADO 492.50 a 147.8 b 6.3 ad 1.0 e 22.28 bd 14.30 acSVEVO 479.38 ab 151.5 ab 6.3 ad 1.0 e 24.08 bd 14.50 acMONGIBELLO 470.63 ac 150.0 ab 6.3 ad 1.0 e 24.72 ad 14.77 acVARANO 451.25 ad 148.8 ab 5.3 cd 1.0 e 21.90 bd 13.83 acFORTORE 438.13 be 148.0 b 6.5 ac 1.0 e 23.19 bd 14.13 acVALBELICE 438.13 be 148.5 ab 6.8 ab 2.0 ac 23.63 bd 13.90 acPARSIFAL 429.38 ce 147.3 b 6.5 ac 1.0 e 21.76 cd 13.56 bcCICCIO 417.50 df 150.3 ab 6.5 ac 1.5 ce 30.88 a 15.28 abCOLOSSEO 416.88 df 150.0 ab 6.0 ad 1.0 e 27.93 ac 14.41 acOFANTO 411.88 df 149.3 ab 6.0 ad 1.3 de 24.31 bd 14.15 acBRONTE 401.88 eg 151.0 ab 6.8 ab 1.0 e 28.31 ab 14.53 acPLATANI 399.38 eh 148.3 ab 6.5 ac 1.0 e 22.98 bd 13.30 cDURFORT 398.13 eh 149.0 ab 5.8 ad 1.0 e 27.32 ac 15.19 acGARGANO 392.50 eh 150.8 ab 5.8 ad 1.0 e 23.28 bd 14.82 acSAN CARLO 379.38 fh 152.8 a 5.3 cd 2.3 ab 25.30 ad 14.78 acNEFER 377.63 fh 149.5 ab 5.5 bd 1.5 ce 20.71 d 14.54 acSIMETO 376.75 fh 149.8 ab 5.8 ad 1.3 de 24.40 bd 13.54 bcIRIDE 375.00 fh 147.5 b 5.0 d 1.5 ce 28.23 ab 14.70 acTRESOR 365.00 gh 151.3 ab 7.0 a 1.8 bd 24.95 ad 14.32 acITALO 362.63 gh 151.8 ab 5.3 cd 2.5 a 27.45 ac 15.57 aDUILIO 359.38 gh 151.5 ab 6.5 ac 1.8 bd 23.86 bd 14.60 acCRESO 358.75 gh 151.5 ab 5.5 bd 1.5 ce 24.60 bd 15.57 aGIANNI 353.13 h 150.5 ab 5.5 bd 1.8 bd 24.57 bd 13.89 acMEANS 406.31 149.79 6.0 1.38 24.81 14.44L.S.D. 39.19 3.84 1.16 0.60 5.36 1.65
(1) 1: most porous; 8: least porous;(2) 1: smoothest; 4: roughest;(3) 1 year (1999): 2 environments.Values followed by the same letter are not significantly different at P = 0.05 according to Duncan’s multiple rangetest.
obtained in the trials in different years.There are notable changes in the Cresovalues in the nine years, particularly thelow volumes recorded in 1984, 1998 and1999. Such variability is associated withthe late life cycle of this cultivar whichconsequently has a greater sensitivity tohigh temperature stress which occursduring the grain-filling period and whichnegatively affects yield. In fact, these threeyears were characterized by sudden tem-perature increases during the maturationphase, which, as previously noted, alsoinfluenced the protein quality.

Ital. J. Food Sci. n. 2, vol. 14 - 2002 131
Fig. 5 - Trend of loaf volume and best cultivars during the years 1984 to 1999.(Values between the inner and outer fences are plotted with asterisks).
The environmental effect was evidentin 1998 and 1999, in which the samecultivars showed the best bread-makingaptitude (Colorado, Mongibello, Svevoand Varano, Fig. 5), even though thebread volumes were very different in thetwo years. While in 1984 there was agreat variability in the bread-makingaptitude of the genotypes tested, due tothe wider genetic background of the mostdiffuse varieties, from 1988 onwards thevariability decreased due to the restric-tion of the genetic background of thevarieties cultivated in Italy (BOGGINI etal., 1992).
Most of the Italian durum wheat vari-eties, which have been selected on thebasis of their pasta-making quality, havean excessively tenacious and scarcelyextensible gluten, which is unsuitable forthe bread-making process. Only recent-ly have varieties been identified whichare suitable for both bread and pastaproduction.
CONCLUSIONS
The results obtained reveal that thebest cultivars for bread-making are:
- Colorado, which has a high proteincontent (15.6%), along with a balanced
P/L (0.68) and a reasonable W (170.32);- Svevo and Mongibello which have
high protein levels and good alveographicW values, but a relatively high P/L ratio(1.39 -1.43);
- Varano which has the highest meanW value (270.67) and a good protein con-tent (14.8%), but a high P/L ratio (1.94);
- Fortore, even though it has a highP/L value (1.39), has good protein con-tent and a fairly good alveographic Wvalue (179.50).
Valbelice also has good bread-makingquality, which is probably due to a well-balanced alveographic ratio, while Par-sifal, also with a low P/L, shows a medi-um high protein content that can com-pensate for the lower gluten strength.
Among the cultivars with good bread-making quality, Fortore, Mongibello,Svevo and Varano have HMW glutenins“7+8”, Colorado has “6+8”, Valbelice has“20” and Parsifal has “6+17”. The “6+17”composition is very rare in the Italiangermplasm and could be important forgenetically improving the bread-makingquality of durum wheat (BOGGINI andPARISI, 1994).
Overall the results show that, by de-termining the qualitative characteristicsof the different genotypes, it is possibleto choose a variety that is appropriate

132 Ital. J. Food Sci. n. 2, vol. 14 - 2002
for the final product. In different years,in fact, some genotypes emerged that hadhigher bread-making quality and mostof them were recurrent over severalyears. In particular the varieties Adamel-lo, Capeiti 8, Messapia, Trinakria, Val-forte and Valnova were noted during the1980s; Castello and Grazia between the1980s and 1990s; Colorado, Mongibel-lo, Svevo and Varano in 1998-1999.These varieties can be recommended tothe processing industry to help meet theincreasing demand for durum wheat thatis suitable for bread-making.
REFERENCES
AACC (American Association of Cereal Chemists).1979a. Approved method of the AACC, No. 10-10 St. Paul, Minnesota.
AACC (American Association of Cereal Chemists).1979b. Approved method of the AACC, No. 54-21 St. Paul, Minnesota.
Amendola J. and Lundberg D.E. 1970. “Under-standing Baking”. Institution Magazine, Chica-go, IL.
Ammar K., Kronstad W.E. and Morris C.F. 2000.Breadmaking quality of selected durum wheatgenotypes and its relationship with high mo-lecular weight glutenin subunit allelic variationand gluten polymeric composition. Cereal Chem.77: 230.
Bakhshi A.K. and Bains G.S. 1987. Study of thephysico-chemical, rheological, baking and noo-dle quality of improved durum wheat and breadwheat cultivars. J. Food Sci. Tech India 24: 217.
Boggini G. 1985. Valutazione dell’attitudine pani-ficatoria di alcune varietà di grano duro. Tecni-ca Molitoria 7: 579.
Boggini G. and Pogna N.E. 1989. The breadmakingquality and storage protein composition of Ita-lian durum wheat. J. Cereal Sci. 9: 131.
Boggini G. and Pogna N.E. 1990. Utilizzazione delfrumento duro come miglioratore della panifi-cabilità del frumento tenero. Tecnica Molitoria12: 1025.
Boggini G. and Parisi P. 1994. Relazione fra com-posizione proteica e qualità panificatoria in fru-mento duro. Atti “IV giornata internazionale sulgrano duro”, Foggia, N. Di Fonzo and G. RongaEd., P. 171. CCIAA Foggia.
Boggini G., Palumbo M. and Biancardi A.M. 1988.Panificabilità delle varietà italiane di frumentoduro. Risultati di un triennio di prove. TecnicaMolitoria 7: 609.
Boggini G., Annicchiarico P., Longo A. and PecettiL. 1992. Produttività e adattamento di nuovecostituzioni di frumento duro (Triticum durumDesf.). Riv. Agronomia 26: 482.
Boggini G., Tusa P. and Pogna N.E. 1994. Quali-tà panificatoria di genotipi di grano duro acomposizione proteica atipica. Tecnica Moli-toria 8: 825.
Borghi B., Corbellini M., Minoia C., Palumbo M.,Di Fonzo N. and Perenzin M. 1997. Effects ofMediterranean climate on wheat bread-makingquality. Eur. J. Agronomy 6: 145.
Boyacioglu M.H. and D’Appolonia B.L. 1994a.Characterization and utilization of durum wheatfor breadmaking. I. Comparison of chemical,rheological and baking properties between breadwheat flours and durum wheat flours. CerealChem. 71: 21.
Boyacioglu M.H. and D’Appolonia B.L. 1994b.Characterization and utilization of durum wheatfor breadmaking. II.Study of flour blends andvarious additives. Cereal Chem. 71: 28.
Boyacioglu M.H. and D’Appolonia B.L. 1994c.Characterization and utilization of durum wheatfor breadmaking. III. Staling properties of breadbaked from bread wheat flours and durumwheat flours. Cereal Chem. 71: 34.
Cubadda R.E., Pasqui L.A., Caproni E. and VolpiM. 1987. Qualitatseigenschaften von Brat ausDurumweizen. 1. Milleilung: Sortenunter-schiede und bockverhalten. Getreide Mehl undBrot 41: 220.
Dal Belin Peruffo A., Pallavicini C., Varanini Z. andPogna N.E. 1981. Analysis of wheat varieties bygliadin electropherograms; I. Catalogue of elec-tropherogram formulas of 29 common wheatcultivars grown in Italy. Genetica Agraria 35:195.
Dexter J.E., Matsuo R.R., Preston K.R. and Kil-born R.H. 1981. Comparison of gluten strength,mixing properties, baking quality and spaghet-ti quality of some Canadian durum and com-mon wheats. Can. Inst. Food Sci. Technol. J.14: 108.
Dexter J.E., Preston K.R., Martin D. and GanderE.J. 1994. The effects of protein content andstarch damage on the physical dough propiertiesand bread-making quality of Canadian durumwheat. J. Cereal Sci. 20: 139.
Dick J.W. 1988. Evaluation of durum wheat forbread. Atti Simposio “Il grano duro per la pani-ficazione”. CESOET Ed., p.175. Troina (EN),Italy.
Geddes N.F. 1932. Notes on durum wheat, themilling of semolina and the manufacture of ali-mentari pasta. Confidential report. AssociateCommittee on Grain Research, National Re-search Council of Canada. Manitoba, Canada.
Gerhard A.F. 1925. “Handbook for Bakers”. TheCentury Company, New York, N.Y.
Jago W. and Jago C.W. 1921. “The Technology of

Ital. J. Food Sci. n. 2, vol. 14 - 2002 133
Bread-Making”. Bakers’ Helper Company. Chi-cago, IL.
Josephides C.M. 1982. Studies on gluten strengthand quality in Triticum turgidum L. var. durum.Sc. D. Thesis, North Dakota State University,Fargo, ND.
Kaltsikes P.J., Evans L.E. and Bushuk W. 1968.Durum-type wheat with high bread-makingquality. Science 159: 211.
Liu C.Y., Shepherd K.W. and Rathjen A.J. 1996.Improvement of durum pasta-making andbread-making qualities. Cereal Chem. 73: 155.
Özen H. 1986. Effect on bread quality of additionof durum clear flour to bread flour (In Turkish).Sc. D. Thesis. University of Ankara, Turkey.
Pasqui L.A., Paoletti F., Caproni E. and Volpi M.,1991. Proprietà funzionali del grano duro ai finidella panificazione. Tecnica Molitoria 1: 1.
Pena R.J., Zarco-Hernandez J., Amaya-Celis A. andMujeeb-Kazi A. 1994. Relationship betweenchromosome 1B-encoded glutenin subunit com-positions and bread-making quality character-istics of some durum wheat (Triticum turgidum)cultivars. J. Cereal Sci. 19: 243.
Quick J.S. and Crawford R.D. 1983. Bread baking
Paper received July 19, 2001 Accepted December 21, 2001
potential of new durum wheat cultivars. Proc.6th Int. Wheat Genetics Symp. p. 851. Kyoto,Japan.
Rao V.K., Mulvaney S.J., Dexter J.E., EdwardsN.M. and Peressini D. 2001. Stress-relaxationproperties of mixograph semolina-water doughsfrom durum wheat cultivars of variable strengthin relation to mixing characteristics, bread- andpasta-making performance. J. Cereal Sci. 34:215.
Shepard J.H. 1903. Macaroni wheat. Its millingand chemical characteristics. South DakotaAgricultural College Experimental Station Bul-letin 82. Brookings, SD.
UNI (Ente Nazionale Italiano di Unificazione).1995. Metodo per grano duro e semola. Deter-minazione delle caratteristiche reologichetramite alveografia. Metodo UNI, No. 10453.Milano, Italy.
Wihlfahrt J.E. 1928. “A Treatise on Baking”. TheFleischwan Company, New York, N.Y.
Williams P.C., El-Haramein F.J., Nelson W. andSrivastava J.P. 1988. Evaluation of wheat qual-ity for the baking of Syrian-type two-layered flatbreads. J. Cereal Sci. 7: 195.

134 Ital. J. Food Sci. n. 2, vol. 14 - 2002

Ital. J. Food Sci. n. 2, vol. 14 - 2002 135
PAPER
- Key words: greening, Leuconostoc mesenteroides, meat products, smoking -
THE EFFECT OF SMOKING, PACKAGINGAND STORAGE TEMPERATURE ON THE
BACTERIAL GREENING OF FRANKFURTERSCAUSED BY LEUCONOSTOC
MESENTEROIDES SUBSP. MESENTEROIDES
EFFETTO DELL’AFFUMICAMENTO, DEL CONFEZIONAMENTOE DELLA TEMPERATURA DI CONSERVAZIONE SULLA DECOLORAZIONE
VERDE BATTERICA DI FRANKFURTERS CAUSATADA LEUCONOSTOC MESENTEROIDES SUBSP. MESENTEROIDES
K. ANIFANTAKI1, J. METAXOPOULOS1, M. KAMMENOU1,E.H. DROSINOS1* and M. VLASSI2
1Agricultural University of Athens, Department of Food Science and Technology,Laboratory of Food Quality Control and Hygiene, Iera Odos 75, GR-11855,
Athens, Greece. Tel. +10 529 4684, Fax +10 529 4683, e-mail: [email protected] Vekka S.A., Meat Manufacturing Industry, Korinthos, Greece
* Corresponding author
ABSTRACT
The spoilage of frankfurters causedby lactic acid bacteria was examined.Isolates responsible for the green dis-colouration were identified as Leucon-ostoc mesenteroides subsp. mesenter-oides. Naturally smoked or liquidsmoke-treated frankfurters were inoc-ulated with strains of L. mesenteroidesand stored aerobically and under vac-uum at 4° and 12°C. Greening was ob-
RIASSUNTO
Viene studiato il deterioramento deifrankfurters causato dai batteri lattici.In particolare Leuconostoc mesenteroi-des subsp. mesenteroides è stato iden-tificato come responsabile della deco-lorazione verde. Campioni di frankfur-ters affumicati sia naturalmente checon affumicamento per via liquida sonostati inoculati con ceppi di L. mesente-roides e conservati aerobicamente e

136 Ital. J. Food Sci. n. 2, vol. 14 - 2002
served under aerobic storage conditionsfrom the third day onwards and thefrankfurters were more discolouredwhen stored at 12°C compared to 4°C.Uninoculated samples did not discol-our under aerobic conditions. Naturalwood smoking, vacuum packaging andstorage at 4°C were effective againstfrankfurter sausage discolouration.
sotto vuoto a 4° e 12°C. L’inverdimentoè stato osservato sotto conservazioneaerobica a partire dal terzo giorno. L’in-verdimento era più pronunciato a 12°Cpiuttosto che a 4°C. I campioni non ino-culati sotto vuoto non hanno mostratoinverdimento. L’affumicamento natura-le a legna, accompagnato dal confezio-namento sotto vuoto e conservazione a4°C si è dimostrato il più effettivo nelprevenire l’alterazione verde deifrankfurters.
INTRODUCTION
The discolouration of cured meat prod-ucts is a common defect that often occursin cooked, cured meat products. A halfcentury ago, NIVEN et al. (1949) describedthe bacterial surface discolouration of sau-sages, while KORKEALA and BJÖRKROTH(1997), reviewing the spoilage phenome-na of vacuum-packaged, cooked sausag-es, did not mention discolouration.
In Greece, several studies on the mi-crobial ecology of cooked, cured meatshave demonstrated that the dominantspoilage association of these products ismade up of Lactobacillus sakei, and atyp-ical leuconostoc-like bacteria (SAMELISand GEORGIADOU 2000, SAMELIS et al.1998, 2000a, b), with intrinsic, extrin-sic and processing factors playing animportant role. Aerobic storage of “tav-erna” frankfurters resulted in the domi-nance of Leuconostoc mesenteroides sub-sp. mesenteroides and greening of theproduct. Protective cultures made up ofLactobacillus alimentarius and Staphylo-coccus xylosus had little effect on thecolour of the product (KOTZEKIDOU andBLOUKAS 1996, 1998). The adventitiouslactic acid bacteria (LAB) appear to bedominant in spoilage associations(ZHANG and HOLLEY 1999).
The green discolouration in frankfurt-ers and other cured, vacuum-packaged,
thermally processed meat products, iscaused by LAB that produce H2O2 (HOL-ZAPFEL, 1998). In particular, they canbe lactobacilli, leuconostocs or heterof-ermentative strains of streptococci(GUERRERO and CHABELA 2000, GRANTet al., 1988). Weissella viridescens (for-merly: Lactobacillus viridescens) thatproduces H2O2 was the first LAB to whichthe greening defect was attributed (NIV-EN and EVANS, 1957). Subsequent stud-ies have confirmed this (LORINCZ andINCZE, 1961; SHARPE, 1962; GARDNER,1967). Other strains of lactobacilli alsocause greening, e.g. L. jensenii and L.fructovorans (JAY, 1992). Some Leucon-ostoc spp. or Enterococcus spp. such asLeuconostoc mesenteroides, Enterococcusfaecalis (Streptococcus faecalis) and En-terococcus faecium (Streptococcus fae-cium), as well as some Pediococcusstrains may cause surface greening(BORCH and MOLIN, 1989).
Discolouration may also have a non-bacterial origin. Gray or green areas mayoccur in the center of the meat productas soon as it is cut. In most of these cas-es, discolouration is caused by lack ofsufficient curing (GARDNER, 1967).
The aim of this study was to examinethe effect of storage temperature, pack-aging and smoking methods on the on-set of greening in frankfurters inoculat-ed with the microorganism that is re-

Ital. J. Food Sci. n. 2, vol. 14 - 2002 137
sponsible for the greening defect. To dothis, LAB strains were isolated fromfrankfurters that had already developedthe greening defect. The strain thatcaused greening in frankfurters wasidentified as Leuconostoc mesenteroidessubsp. mesenteroides.
MATERIALS AND METHODS
Sausage production
The meat product used in this studywas an emulsion-type sausage in the formof 25 g frankfurters that were commer-cially manufactured by a major Greekmeat producing company. The composi-tion of the sausage was (%): pork (55), lard(25), water (10), starch (5.5), milk protein(1.3), NaCl (1.5), spices (1.0) and additives(0.7), consisting of sodium ascorbate 0.1,polyphosphates, 0.3, potassium nitrate0.015, sodium nitrite 0.015. The raw fro-zen meat was thawed in a water bath andwarmed to a core temperature of -4°C.After grinding, the raw meat was mixedwith salt, starch, skimmed-milk powder,lard, spices and additives, and the mix-ture was stuffed into inedible casings. Thesausages were then cooked to a core tem-perature of 74°C. Liquid smoke was ap-plied just before cooking. Natural smokewas applied during cooking. After cook-ing, the sausages were rinsed with coldwater (10°C) for 10 min until a core tem-perature 30°-35°C was reached. They werethen drained and transferred to an air blastcooling room (-5°C) to cool them to 2°C.The sausages were then skinned and, af-ter storage at 2°C for 18 h, were packed.The finished frankfurters were then trans-ported, under refrigeration to the labora-tory.
Isolation and identification of micro-organisms
Twenty LAB strains that had been iso-lated from different, overtly discoloured
green frankfurters were examined. Theisolation and identification methodsused, including biochemical tests, werepreviously described by SAMELIS et al.(1994, 2000b). The strains were grownin MRS broth (Merck, Darmstadt, Ger-many) at 30°C and stored in the samemedia supplemented with 20% (v/v) glyc-erol (Merck) at -18°C.
Inoculation of sausages
The organisms were subcultured twice(24 h, 30°C) in 10 mL MRS broth (Mer-ck), 1% inoculum. The cells were harvest-ed by centrifugation (10,844 x g for 30min) (Biofuge 22R, Heraeus InstrumentsGmbH, Osterode, Germany), washedtwice and resuspended in 10 mL of 50mM sodium phosphate buffer, pH 7. Thebacterial suspension was diluted withsterile 1/4-strength Ringer’s solution (Ox-oid), which yielded an inoculum of about104-105 cfu mL-1. The frankfurters wereimmersed in 2 L of bacterial suspensionfor 1 min at 20°C, placed on a sterile grateand the surplus solution was allowed todrip off. The inoculation was carried outin a laminar flow cabinet (Nuaire NU-425-400E, Plymouth, MN, USA).
Effect of storage temperature, pack-aging and smoking method
The inoculated and control sampleswere packaged under vacuum using apackaging machine (HENCO VAC 1900,Howden Food Equipment B.V., BA’s-Her-togenbosch, The Netherlands) and awater vapour-impermeable film (type V40-2, 40 µm thick). The oxygen trans-mission rate of the film was <35 cm3/m2/24 h/atm at 20°C and 65% R.H.Each packaged unit contained two sau-sages. Aerobic conditions were estab-lished in half of the vacuum-packed sam-ples by making six holes with a sterilecork borer (5 mm diameter) on the pack-age film (20x15 cm). The packages werethen stored at either 4° or 12°C.

138 Ital. J. Food Sci. n. 2, vol. 14 - 2002
The frankfurters treated with liquidsmoke were sprayed with an aqueousdiluted preparation (20% v/v) for 1 min,just before cooking. Natural wood smok-ing was applied during cooking for 6-7min at 65°C and 65% R.H. Smoke wasproduced in a smoke generator, withbeech wood as fuel, at 300°-350°C andthen through pipes introduced to thecooking chamber.
Microbiological analysis and pH
Frankfurters (25 g) were placed in 225mL of 0.1% peptone water in a sterilestomacher bag, homogenized with a labblender (Stomacher® 400, Seward Med-ical Ltd, London, UK) for 1 min at nor-mal speed and 0.5 min at high speed.Decimal serial dilutions were preparedwith the homogenate in sterile Ringersolution for microbiological determina-tions.
For the total viable counts, samples(0.1 mL) of serial homogenate dilutionswere spread on Plate Count Agar (PCA,Merck) and incubated at 30°C for 72 h.The LAB were determined by the pour-plate method: 1 mL of an appropriatedilution was inoculated into 10 mL ofmolten MRS agar (45°C) (Merck). Aftersetting, the plates were incubated at30°C for 72 h under anaerobic conditions(Gas-Pack System, BBL, Becton Dickin-son, Cockeysville, MD, USA). Thenumber of colonies formed was countedand reported (log10 cfu g-1) for each sam-ple and each medium (SAMELIS andGEORGIADOU, 2000).
The pH value was determined by dip-ping the glass electrode of a pH-meter(WTW pH 526, Weilheim, Germany) intoa homogenized sample: a frankfurter (10g) was mixed with 90 mL of distilled wa-ter and homogenized with a blender(model PB500, Kenwood Ltd, Havant,U.K.). Microbiological analysis and pHmeasurements were conducted on du-plicate samples at intervals of 0, 6 and12 days or 0, 3 and 6 days of storage,
respectively, while macroscopic evalua-tion was performed every three days. Thecoefficient of variation was <5%.
RESULTS AND CONCLUSIONS
Identification of microorganisms
Twenty LAB strains were isolated fromovertly discoloured samples and num-bered consecutively. The isolates werethen divided into hetero- (10) and ho-mofermentative (10) strains. Based onthe identification profile of the heterof-ermentative strains, 3 groups were
Table 1 - Grouping of heterofermentative isolates.
Groupa 1 2 3b
N. of isolates 1 5 4
Cell morphology bC bC bCGram reaction + + +Catalase - - -CO2 from glucose + + +NH3 from arginine - - -Growth at 10°C + + +Production ofdextran from sucrose + + +Growth in8% NaCl - - -10% NaCl - - -
Sugar fermentationMaltose + + -Mannitol + + (+)c
Lactose + + +Arabinose (+) (+) +Raffinose + + +Melibiose + + +Sucrose + + +Cellobiose + (+) +Trehalose + + +Xylose + + +Galactose + + +
a All strains were identified as Leuconostoc mesenter-oides subsp. mesenteroides.b strains of this group, coded as A5, B8 and B9, wereused for inoculation and were correlated with exten-sive greening.c (+), weak reaction.bC, coccobacilli.

Ital. J. Food Sci. n. 2, vol. 14 - 2002 139
formed (Table 1). Although all the strainswere identified as Leuconostoc mesenter-oides subsp. mesenteroides / dextrani-cum by the miniaturized API 50 CH tests(Bio-Mérieux, Marcy l’Etoile, France), thedifferent characteristics of the heterof-ermentative, arginine-negative, cocoidLAB reported by SAMELIS et al. (2000b)distinguish it from group 3 that wasmaltose negative. However, all the groupshad a strong positive fermentation pro-file. An inoculation test was performedinitially to determine which of the threegroups of microbial strains was respon-sible for the greening defect. Once thethird group was determined, three ran-domly selected strains (A5, B8, B9) werethen used separately for further inocu-lations in order to examine the effect ofstorage temperature and packagingmethod on the greening defect.
Effect of storage
Macroscopic observationsOn the third day of storage, the inoc-
ulated samples that had been storedaerobically at 4°C began to develop thegreening defect on their surfaces, andon the fourth day, the green discoloura-tion had spread over the entire surface.The inoculated samples that were pack-aged aerobically and stored at 12°C de-veloped extensive greening on the thirdday. Generally, from the fifth day on, thegreening had spread from the surface in-ward towards the center of the frankfurt-ers regardless of the storage tempera-ture.
Throughout the experiment (12 daysof storage), discolouration was not de-tected in the aerobically packaged, uni-noculated samples, regardless of stor-age temperature. Likewise, the green dis-colouration was not detected in any ofthe vacuum-packaged samples, regard-less of storage temperature or whetherinoculated or not. In all the macroscop-ic observations, strain B9 caused themost severe greening and therefore, this
strain was used to determine the effectof the smoking method on greening. Allof the above samples were naturallysmoked.
Microbial analysis and pH changesThe initial total viable counts (TVC)
were 103 cfu g-1, while the inoculatedsamples had TVC values of 106-107 cfug-1. At the end of the storage period (12days) the TVC were 108-109 cfu g-1 forthe vacuum packaged samples, and anaverage of 109-1010 cfu g-1 (Fig. 1) for theaerobically stored samples. The samplesstored at 4°C were very similar to thoseof the samples stored at 12°C.
Initially, the average LAB count for thefrankfurters was 103-104 cfu g-1. Afterinoculation, the LAB count increased to105-106 cfu g-1 (Fig. 2). After 12 days ofstorage the LAB count reached 108-109
cfu g-1 for inoculated and uninoculatedsamples. Comparing the TVC and LABcounts it is obvious that LAB were thedominant spoilage flora. The pH valuesof the samples are shown in Fig. 3. Theinitial pH values of the frankfurters were6.25-6.30, but they decreased duringstorage, in some cases reaching a finalpH of 5.45 (Fig. 3b).
Comparison of smoking methods onfrankfurters inoculated with strain B9
Macroscopic observationOn the fifth day of storage, the inocu-
lated, liquid smoked-treated samplesthat were packaged aerobically andstored at 4°C developed the green dis-colouration, particularly on the surfac-es, while the samples that were storedat 12°C developed a more intense green-ing defect. The uninoculated, liquid-smoke treated samples that were storedaerobically did not develop any greeningdefect throughout the experiment, re-gardless of storage temperature.
In contrast, the inoculated, naturallysmoked samples that were stored aerobi-cally at 4°C developed the greening defect

140 Ital. J. Food Sci. n. 2, vol. 14 - 2002
Fig. 1 - Total viablecounts (TVC) of frankfurt-ers stored under vacuum(a, c) or aerobically (b, d)at 4°C (a, b) and 12°C (c,d). Uninoculated (�) andinoculated with three het-erofermentative strains oflactic acid bacteria (A5, �;B8, � and B9, �).
Fig. 2 - Lactic acid bacte-ria counts of frankfurtersstored under vacuum (a,c) or aerobically (b, d) at4°C (a, b) and 12°C (c, d).Uninoculated (�) and in-oculated with three het-erofermentative strains oflactic acid bacteria (A5,B8, � and B9, �).

Ital. J. Food Sci. n. 2, vol. 14 - 2002 141
on the 14th day of storage (2 days afterthe end of the anticipated duration of theexperiment). On the same day, the inocu-lated, naturally-smoked samples that werestored aerobically at 12°C developed aneven more intense greening defect than thecorresponding samples stored at 4°C. Noneof the vacuum-packaged samples devel-oped the greening defect during the stor-age period, regardless of storage tempera-ture or smoking method.
Microbial analysis, pH
The LAB population in liquid-smokedfrankfurters was, on the average, less than102 cfu g-1. After inoculation, the popula-tion increased to 105 cfu g-1. The LABcounts increased during sample storage
and after 6 days the count reached 108-109 cfu g-1. The samples stored at 12°Chad slightly larger populations than thosestored at 4°C (Figs. 4a and 4b).
The initial LAB population in natural-ly smoked frankfurters was, on the av-erage, less than 10 cfu g-1, while afterinoculation, it increased to more than 106
cfu g-1. At the end of the storage periodthe LAB counts were 108-109 cfu g-1. Inboth cases, the vacuum-packed sampleshad smaller LAB populations than theaerobically-packaged ones (Figs. 4c and4d). The pH values of the frankfurtersranged from 6.25 to 6.55. During storagepH values decreased in all the inoculatedsamples but increased in the uninocu-lated frankfurters. In some cases, the pHvalue was 5.7 (Fig. 5).
Fig. 3 - pH changesduring the storage offrankfurters storedunder vacuum (a, c)or aerobically (b, d) at4°C (a, b) and 12°C (c,d). Uninoculated (�)and inoculated withthree heterofermen-tative strains of lacticacid bacteria (A5, �;B8, � and B9, �).

142 Ital. J. Food Sci. n. 2, vol. 14 - 2002
Fig. 4 - Lactic acid bacteria countsof frankfurters treated with liquid-smoke (a, b) or naturally smoked(c, d) stored under vacuum (�, �)or aerobically (�, �) at 4°C (a, c)and 12°C (b, d). Uninoculated (�,�) and inoculated with a Leucon-ostoc mesenteroides subsp. me-senteroides strain (B9) (�, �).
Fig. 5 - Changes in pH of frank-furters treated with liquid-smoke(a, b) or naturally smoked (c, d)stored under vacuum (�, �) or aer-obically (�, �) at 4°C (a, c) and12°C (b, d). Uninoculated (�, �)and inoculated with a Leuconostocmesenteroides subsp. mesenter-oides strain (B9) (�, �).

Ital. J. Food Sci. n. 2, vol. 14 - 2002 143
The samples had lower (<109) total vi-able and LAB counts when stored at 4°Cthan those stored at 12°C. This findingagrees with the results from other stud-ies which report that the maximum bac-terial population that can grow on re-frigerated cured meat products is 107-109 cfu g-1 (BORCH et al., 1996).
The results of the present study con-firm the association of greening withspoilage caused by heterofermentativeLAB (Weissella viridenscens, leuconos-tocs). The greening in the frankfurter-type sausages was caused by Leuconos-toc mesenteroides subsp. mesenteroides.These results are in agreement withstudies (SAMELIS and GEORGIADOU,2000 and SAMELIS et al., 2000a, b) onthe effect of different extrinsic, intrinsicand processing factors on the physiolo-gy of spoilage associated with cooked,cured meat products.
Decreased pH values during storage arein agreement with other studies in whichthe final pH of cooked meat productsreached pH values of 5.0-5.3, due to theproduction of lactic acid (GARDNER,1983). The increased pH values noted insome instances may have been causedby metabiotic phenomena (DROSINOS andBOARD, 1995). The pH value and lacticacid concentrations have been proposedas indexes of microbial quality in prod-ucts (KAKOURI and NYCHAS, 1994).
This study confirms that microorgan-isms responsible for bacterial greeningcan grow and spoil in meat products evenat low temperatures (4°C). Vacuum pack-aging is an efficient way to delay the on-set of greening in meat products for a sig-nificant period of time. The smokingmethod used in the production of meatproducts is also of major importance.Natural smoking can delay the onset ofthe greening defect by several days. Insummary, surface greening was causedby bacteria. To avoid contamination, san-itary procedures, such as during slicing(HOLLEY, 1997), are essential during thehandling of cooked, cured meat products.
REFERENCES
Borch E. and Molin G. 1989. The aerobic growthand product formation of Lactobacillus, Leucon-ostoc, Brochothrix and Carnobacterium in batchcultures. Appl. Microbiol. Biotechnol. 30: 81.
Borch E., Kant-Muermans M.L. and Blixt Y. 1996.Bacterial spoilage of meat and cured meat prod-ucts. Int. J. Food Microbiol. 33: 103.
Drosinos E.H. and Board R.G. 1995. Attributes ofmicrobial associations of meat growing as xen-ic batch cultures in a meat juice at 4°C. Int. J.Food Microbiol. 26: 279.
Gardner G.A. 1983. Microbial spoilage of curedmeats. In “Food Microbiology: Advances andProspects”. T.A. Roberts and F.A. Skinner (Ed.),p. 179. Academic Press, London.
Gardner G.A. 1967. Discolouration in cooked ham.Process Biochem. 2: 49.
Grant G.F., McCurdy A.R. and Osborne A.D. 1988.Bacterial greening in cured meats: a review.Can. Inst. Food Sci. Technol. J. 21: 50.
Guerrero I. and Chabela L.P. 2000. Spoilage ofcooked meats and meat products. In “Encyclo-pedia of Food Microbiology”. R.K. Robinson, C.A.Batt and P.D. Patel (Ed.), p. 1266. AcademicPress, London.
Holley R.A. 1997. Impact of slicing hygiene uponshelf life and distribution of spoilage bacteriain vacuum packaged cured meats. Food Micro-biol. 14: 201.
Holzapfel W.H. 1998. The Gram-positive bacteriaassociated with meat and meat products. Ch.2. In “The Microbiology of Meat and Poultry”. A.Davies and R. Board (Ed.), p. 35. Blackie Aca-demic and Professional, London.
Jay J.M. 1992. “Modern Food Microbiology”. VanNostrand Reinhold, New York.
Kakouri A. and Nychas G.J.E. 1994. Storage ofpoultry meat under modified atmospheres orvacuum packs: possible role of microbial me-tabolites as indicator of spoilage. J. Appl. Bac-teriol. 76: 163.
Korkeala H.J. and Björkroth K.J. 1997. Microbio-logical spoilage and contamination of vacuum-packaged cooked sausages. J. Food Prot. 60:724.
Kotzekidou P. and Bloukas J.G. 1996. Effect ofprotective cultures and packaging film perme-ability on shelf-life of sliced vacuum-packedcooked ham. Meat Sci. 42: 333.
Kotzekidou P. and Bloukas J.G. 1998. Microbialand sensory changes in vacuum-packed frank-furter-type sausages by Lactobacillus alimenta-rius and fate of inoculated Salmonella enteritidis.Food Microbiol. 15: 101.
Lorincz F. and Incze K. 1961. Greening in curedmeat by L. viridescens. Fleischwirt. 13: 406.
Niven C.F. and Evans J.B. 1957. Lactobacillus vir-idescens nov. spec., a heterofermentative spe-

144 Ital. J. Food Sci. n. 2, vol. 14 - 2002
cies that produces a green discolouration ofcured meat products. J. Bacteriol. 73: 758.
Niven C.F., Jr. Castellani A.G. and Allanson V.1949. A study of the lactic acid bacteria thatcause surface discolorations of sausages. J.Bacteriol. 58: 633.
Samelis J. and Georgiadou K.G. 2000. The micro-bial association of Greek taverna sausage storedat 4° and 10°C in air, vacuum or 100% carbondioxide, and its spoilage potential. J. Appl.Microbiol. 88: 58.
Samelis J., Kakouri A. and Rementzis J. 2000a.The spoilage microflora of cured, cooked tur-key breasts prepared commercially with or with-out smoking. Int. J. Food Microbiol. 56: 133.
Samelis J., Kakouri A. and Rementzis J. 2000b.Selective effect of the product type and the pack-aging conditions on the species of lactic acid
Revised paper received January 2, 2002 Accepted March 1, 2002
bacteria dominating the spoilage microbial as-sociation of cooked meats at 4°C. Food Micro-biol. 17: 329.
Samelis J., Kakouri A., Georgiadou K.G. andMetaxopoulos J. 1998. Evaluation of the extentand type of bacterial contamination at differentstages of processing of cooked ham. J. Appl.Microbiol. 84: 649.
Samelis J., Maurogenakis F. and Metaxopoulos J.1994. Characterisation of lactic acid bacteriaisolated from naturally fermented greek drysalami. Int. J. Food Microbiol. 23: 179.
Sharpe M.E. 1962. Lactobacilli in meat products.Food Manufacture 37: 582.
Zhang G. and Holley R.A. 1999. Development andPFGE monitoring of dominance among spoil-age lactic acid bacteria from cured meats. FoodMicrobiol. 16: 633.

Ital. J. Food Sci. n. 2, vol. 14 - 2002 145
PAPER
- Key words: aroma, β-lactoglobulin, emulsion, flavor, model mouth -
RELEASE OF VOLATILE COMPOUNDSFROM EMULSIONS: INFLUENCE OF
β-LACTOGLOBULIN AND pH
RILASCIO DI COMPOSTI VOLATILI DALLE EMULSIONI:INFLUENZA DELLA β-LATTOGLOBULINA E DEL pH
S.M. VAN RUTH*, C. KING, M. DELARUE1 and P. GIANNOULI Nutritional Sciences, Department of Food Science, Food Technologyand Nutrition, University College Cork, Western Road, Cork, Ireland
* Corresponding author: Tel. +353 21 4902496; Fax +353 21 4270244;e-mail: [email protected]
1 Visiting student from Institut Universitaire de Technologie, Quimper, France
ABSTRACT
The influence of β-lactoglobulin (0, 1,2%) and pH (3, 6, 9) on the release of20 aroma compounds from oil-in-wa-ter emulsions was studied. The releaseunder equilibrium and mouth condi-tions was measured by equilibriumheadspace analysis and in a modelmouth system combined with gas chro-matography, respectively. Six alcohols,five ketones, four esters, three alde-hydes, one terpene and one sulfur com-pound were investigated. Differencesbetween compounds depended more onchain length than on functional group.The presence of β-lactoglobulin affect-
RIASSUNTO
È studiata l’influenza della β-lattoglo-bulina (0,1,2%) e del pH (3,6,9) sul rila-scio di 20 componenti aromatici daemulsioni olio-acqua. Il rilascio all’equi-librio ed in condizioni simili a quelle dellabocca è stato misurato mediante anali-si dello spazio di testa all’equilibrio e conun modello di bocca artificiale combi-nato con la gas cromatografia. Sono stativalutati sei alcool, cinque chetoni, quat-tro esteri, tre aldeidi, un terpene ed uncomposto solforato. Le differenze tra idiversi composti dipendevano più dellalunghezza della catena che dai gruppifunzionali. La presenza di β-lattoglobu-

146 Ital. J. Food Sci. n. 2, vol. 14 - 2002
ed the aroma release under both equi-librium and mouth conditions. Its con-centration had a significant effect un-der equilibrium conditions but not un-der mouth conditions, which was at-tributed to the extinguishing effect ofthe artificial saliva added. The pH didnot affect the aroma release at all.
lina ha, in ogni prova, influenzato il ri-lascio dell’aroma. La sua concentrazio-ne ha invece effetto sotto condizionid’equilibrio ma non in quelle della boc-ca artificiale, per l’effetto annullante le-gato alla saliva artificiale aggiunta. Il pH,infine, non ha mostrato alcun effetto sulrilascio degli aromi.
INTRODUCTION
Volatile compounds contribute to fla-vor perception. The odor of a food canbe defined as the perception of volatilecompounds prior to eating and is causedby the orthonasal passage of the com-pounds by inhalation through the exter-nal naris. When food is eaten, it is mas-ticated and mixed with saliva, the vola-tiles are released into the oral cavity andfollow the retronasal route to the recep-tor cells in the nose. It has been shownthat the orthonasal (odor) and retrona-sal (aroma) volatile composition differ inquantity, which is probably because ofthe different release conditions (ROB-ERTS and ACREE, 1996).
Interactions between volatile com-pounds and food components play animportant role in the perception of flavor.Volatile compounds may be dissolved,adsorbed, bound, entrapped, encapsulat-ed or diffusion-limited by food compo-nents. The relative importance of each ofthe mechanisms varies with the proper-ties of the volatile compounds and thephysical and chemical properties of thecomponents of the food (KINSELLA, 1988).
β-Lactoglobulin (βLG), the major bovinewhey protein, is one of the most common-ly used whey proteins in the food indus-try. Whey proteins are a potentially sig-nificant source of functional protein in-gredients, for which the market is expand-ing. βLG has been extensively character-ized and is the best described of all foodproteins. βLG is known for its gelating,emulsifying, foaming and binding prop-
erties. It has been studied for its interac-tions with a large variety of small hydro-phobic compounds, among which arearoma compounds (GUICHARD and LANG-OURIEUX, 2000). It has been suggestedthat these compounds may bind insidethe central calyx, which has been provenfor fatty acids (BROWNLOW et al., 1997;QIN et al., 1998; WU et al., 1999). Othercompounds, such as aliphatic aldehydeshave been shown to react with proteinamino groups, causing formation of cov-alently bound products (STAPELFELDTand SKIBSTED, 1994).
The influence of βLG in aqueous solu-tions has been studied extensively(CHARLES et al., 1996; JOUENNE andCROUZET, 1996; PELLETIER et al., 1998;GUICHARD and LANGOURIEUX, 2000),including a collaborative experimentalstudy as part of Cost Action 96 (LANG-OURIEUX and ESCHER, 1999). A largevariety of parameters have been report-ed to affect the binding of aroma mole-cules. These parameters included thecommercial source of the βLG, concen-tration of βLG, the aroma molecule withrespect to the functional group and hy-drophobicity, temperature, pH and NaClconcentration.
The effect of βLG in more complicatedfood systems has received less attention.Many natural and processed foods existeither partly or wholly as emulsions (MC-CLEMENTS, 1998). The impact of βLG inemulsified food systems has been evalu-ated in a few studies. The oil present inthis type of system has a twofold effect.Firstly, most aroma compounds are rela-

Ital. J. Food Sci. n. 2, vol. 14 - 2002 147
tively hydrophobic and thus more solu-ble in oil than in water. Secondly, lipidsinteract with proteins and are likely to bein competition with aroma compounds forthe same binding sites. Research in thisarea includes studies on binary oil/wa-ter systems and on emulsions with mostlya rather limited number of aroma com-pounds. A study on binary systems indi-cated that βLG at the interface increasedthe resistance to transfer of volatile com-pounds as a function of the hydropho-bicity of the compound (ROGACHEVA etal., 1999). Emulsified systems with βLGshowed higher retention for specific vol-atile compounds than emulsions withother whey proteins (GUICHARD andLANGOURIEUX, 2000). It can be assumed,therefore, that βLG in emulsions affectsboth the thermodynamic (partitioning)and the kinetic (mass transfer) compo-nent of the release of volatile compounds.However, no systematic studies have beencarried out so far.
In the present study the effect of βLG,its concentration and the pH on the re-lease of 20 odor active volatile com-pounds from oil-in-water (O/W) emul-sions were evaluated. The influence ofthe parameters was examined underequilibrium and mouth conditions to dis-tinguish the thermodynamic and kinet-ic component of volatile release, and todetermine the potential effects on odorand aroma perception separately.
MATERIALS AND METHODS
Sample materials
The lipid phase of the biphasic andemulsion samples was composed of com-mercial sunflower oil (Suma Wholefoods,Dean Clough, Halifax, UK). Distilled wa-ter was used for the water phase and βLG(Sigma-Aldrich, Steinheim, Germany; pu-rity 90%) as emulsifying agent. The sameoil and water was used for the samplescomposed of one phase only. The 20 aro-
ma compounds included: diacetyl, 2-bu-tanone, ethyl acetate, 2-pentanol, hexanal,1-hexanol, 2-heptanone, heptanal, and α-pinene, which were supplied by Sigma-Aldrich. Dimethyl sulfide, ethyl butyrate,2-octanone, and octanal were purchasedfrom Merck (Hohenbrunn, Munich, Ger-many). 1-Propanol, propyl acetate, 1-bu-tanol, butyl acetate, and 3-methyl-1-bu-tanol were supplied by Lancaster (Walk-erburn, UK), 2-nonanol and 2-decanonewere obtained from Fluka Chemie. Purityof the compounds was greater than 95%.
The artificial saliva consisted of NaH-CO3 (5.208 g), K2HPO4 · 3H2O (1.369 g),NaCl (0.877 g), KCl (0.477 g), and CaCl2· 2H2O (0.441 g), NaN3 (0.5 g), mucin(2.160 g, porcine stomach mucin; Sig-ma-Aldrich), and 200,000 units of α-amylase (hog pancreas α-amylase; Flu-ka Chemie) in 1 L of distilled water, andwas adjusted to pH 7 (VAN RUTH andROOZEN, 2000).
Sample preparation
Sunflower oil-in-water (O/W) emul-sions varying in emulsifier concentrationwere prepared as indicated in Table 1,using a prototype single valve homoge-nizer. By modifying the energy duringhomogenization, O/W emulsions with aconstant mean droplet size (D(3,2)) of0.85 µm were made. The pH was adjust-ed with HCl or NaOH after emulsionpreparation and the 20 aroma com-pounds were added in triplicate, whichresulted in a final concentration of0.001% v/v per compound. The samples,3 replicates per sample, were stored for12 h at 4°C in the absence of light toallow equilibration. The samples with 0%βLG were biphasic samples.
Droplet size measurements
A Malvern Mastersizer laser diffrac-tometer (model S Ver. 2.15, Malvern In-struments, Malvern, UK) was used todetermine the structural characteristics

148 Ital. J. Food Sci. n. 2, vol. 14 - 2002
of the emulsions: the Droplet size(D(3,2)) and the dispersion (D(v,0.9) -D(v,0.1)).
Aroma analysis underequilibrium conditions
For equilibrium headspace gas chro-matography, 2 mL of sample or alterna-tively 1.2 mL of sample and 0.8 mL ofartificial saliva were transferred to a 10mL headspace vial for each replicate sam-ple. The samples were incubated at 37°Cand agitated at 750 rpm for 6 min in theautomated headspace unit (Combipal-CTC Analytics system; JVA AnalyticalLtd.) of the gas chromatograph (GC; Var-ian CP-3800; JVA Analytical Ltd.). Afterequilibration, 2 mL of headspace wasautomatically injected. The GC wasequipped with an injector at 225°C, aBPX5 capillary column (60 m length, 0.32mm i.d., and 1.0 µm film thickness; SGE(Kiln Farm Milton Keynes, UK); heliumcarrier gas 1.9 mL min-1) and a flame ion-ization detector at 300°C. An initial oventemperature of -30°C was used for 1 min,followed by a rate of 100°C min-1 to 40°C.The oven temperature was maintained at40°C for 4 min, and was subsequentlyprogrammed at 2°C min-1 to 90°C, fur-ther at 4°C min-1 to 130°C, and finally at8°C min-1 to 270°C.
Five concentrations of each of the com-pounds were analyzed in triplicate forcalibration, allowing quantification of thecompounds in the air phase.
For determination of air/liquid parti-tion coefficients of each of the com-pounds, air phase concentrations (w/v)under equilibrium conditions were divid-ed by the concentrations in the liquidphase (w/v).
Aroma analysis undermouth conditions
Aroma compounds were isolated in amodel mouth system, the latest versionof which was reported by VAN RUTH andROOZEN (2000). Six millilitres of sampleand 4 mL of artificial saliva were trans-ferred to the sample flask (70 mL, 37°C)of the model mouth system. The head-space was flushed with purified nitro-gen gas (100 mL min-1). The aroma com-pounds released were trapped in Tenax(Tenax TA 60/80; Supelco, Bellefonte,PA) for 1 min. Isolation of the volatilecompounds was carried out with aplunger making up-and-down screwingmovements (52 cycles min-1) to simulatemastication.
The aroma compounds trapped onTenax TA were quantified by combinedgas chromatography (Varian Star 3400
Table 1 - Experimental samples: oil-in-water emulsions and their compositional and structural charac-teristics.
Sample code Oil Water β-lactoglobulin pH Droplet size Dispersion[% w/w] [% w/w] concentration D(3,2) [µm]
[% w/w] [µm]
0%-pH3 40 60 0 3 - -0%-pH6 40 60 0 6 - -0%-pH9 40 60 0 9 - -1%-pH3 40 59 1 3 0.85 5.661%-pH6 40 59 1 6 0.85 5.661%-pH9 40 59 1 9 0.85 5.662%-pH3 40 58 2 3 0.85 5.872%-pH6 40 58 2 6 0.85 5.872%-pH9 40 58 2 9 0.85 5.87

Ital. J. Food Sci. n. 2, vol. 14 - 2002 149
CX, JVA Analytical Ltd., Dublin, Ireland)and mass spectrometry (MS; Varian Sat-urn 3, JVA Analytical Ltd.). Desorptionof the volatile compounds from Tenaxwas performed by a thermal desorption(220°C, 4 min) /cold trap (-120°C) de-vice (Tekmar Purge and Trap 3000 con-centrator, JVA Analytical Ltd.). Througha heated transfer line, the compoundswere directed to the GC column (BPX5capillary column; 60 m length, 0.32 mmi.d., and 1.0 µm film thickness; SGE).The initial oven temperature was 40°Cfor 4 min, and the temperature was sub-sequently programmed to 90° at 2°C min-
1, further to 130° at 4°C min-1, and final-ly at 8°C min-1 to 270°C. Mass spectrawere obtained with 70 eV electron im-pact ionization, while the mass spec-trometer was continuously scanningfrom m/z 25 to 250 at a scan speed of 1scan/s.
The identity of the compounds wasconfirmed by comparison with spectraand retention times of single authenticcompounds and bibliographic data. Sixconcentrations of volatile compounds inpentane were analyzed in triplicate forcalibration, allowing quantification of thecompounds released in the modelmouth.
For quantification of aroma release,the amounts of aroma compounds re-leased in the model mouth (w) were di-vided by the amount present in the sam-ple flask of the model mouth before aro-ma isolation (w) and multiplied by 100(proportion released in percent).
Statistical analysis
Data of triplicate aroma measurementsof the various emulsions were subjectedto non-parametric statistical tests to de-termine significant differences betweenthe samples: Friedman two-way analysisof variance by ranks and sign tests.
Correlations were determined by calcu-lation of Pearson’s product moment cor-relation coefficients (O’MAHONEY, 1986).
RESULTS AND DISCUSSION
The influence of βLG concentrationand pH of 40% oil-in-water emulsionson the release of 20 odor active volatilecompounds was studied under equilib-rium and mouth conditions. Althoughthe emulsions varied in βLG concentra-tion (1% and 2%) and pH (3, 6, 9), theirdroplet size characteristics were keptconstant (Table 1). A control sample of amixture of oil and water in the same ra-tio as the emulsions was analysed as well(0% βLG). Twenty volatile compoundswere selected according to their physi-co-chemical and odor properties(ARCTANDER, 1969; LIDE, 1997) andused throughout the experiments. Theyincluded six alcohols: 1-propanol (alco-holic), 1-butanol (fusel-like), 3-methyl-butanol (fruity-winey), 2-pentanol(winey-ethereal), 1-hexanol (chemical-winey), and 2-nonanol (oily). Five ketoneswere added as well as four esters: 2-bu-tanone (ethereal), diacetyl (buttery), 2-heptanone (fruity-spicy), 2-octanone (flo-ral), 2-decanone (citrus-like), ethyl ace-tate (ethereal-fruity), propyl acetate(fruity), butyl acetate (ethereal-fruity),and ethyl butyrate (fruity). Furthermore,three aldehydes, one terpene and onesulfur compound were evaluated: hex-anal (grassy), heptanal (fatty-rancid),octanal (fruity), α-pinene (pine-like), anddimethyl sulfide (cabbage-like).
Equilibrium conditions
The 20 compounds in the various sam-ples were examined under equilibriumconditions without addition of saliva andtheir air/liquid partition coefficients werecalculated. Firstly, the partition coeffi-cients of the aroma compounds in 100%oil, 100% water, and in oil with 1% βLG,and water with 1% βLG were determined(Table 2). The partition coefficients of thecompounds differed considerably. High-est values were obtained for dimethylsulfide and lowest for octanal through-
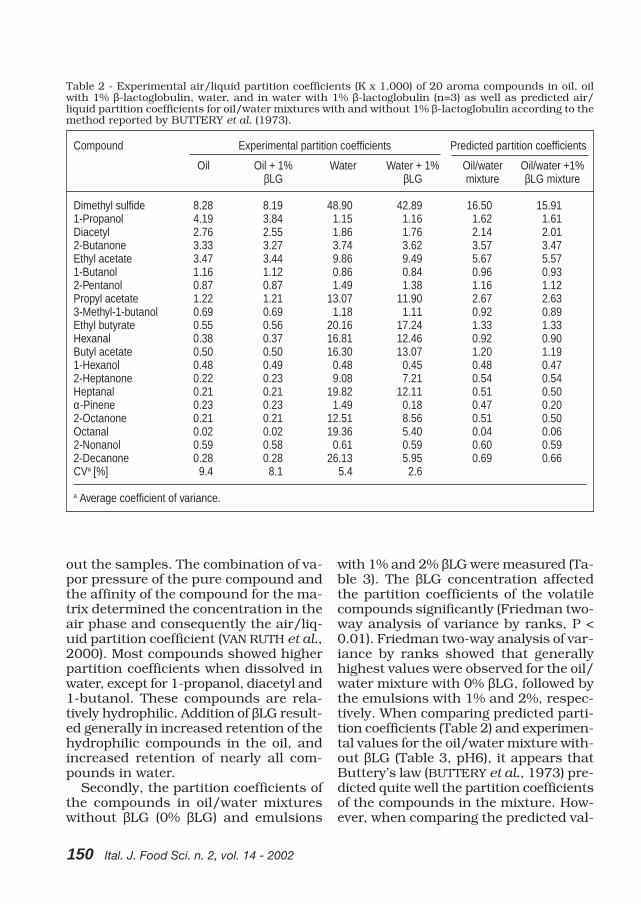
150 Ital. J. Food Sci. n. 2, vol. 14 - 2002
out the samples. The combination of va-por pressure of the pure compound andthe affinity of the compound for the ma-trix determined the concentration in theair phase and consequently the air/liq-uid partition coefficient (VAN RUTH et al.,2000). Most compounds showed higherpartition coefficients when dissolved inwater, except for 1-propanol, diacetyl and1-butanol. These compounds are rela-tively hydrophilic. Addition of βLG result-ed generally in increased retention of thehydrophilic compounds in the oil, andincreased retention of nearly all com-pounds in water.
Secondly, the partition coefficients ofthe compounds in oil/water mixtureswithout βLG (0% βLG) and emulsions
with 1% and 2% βLG were measured (Ta-ble 3). The βLG concentration affectedthe partition coefficients of the volatilecompounds significantly (Friedman two-way analysis of variance by ranks, P <0.01). Friedman two-way analysis of var-iance by ranks showed that generallyhighest values were observed for the oil/water mixture with 0% βLG, followed bythe emulsions with 1% and 2%, respec-tively. When comparing predicted parti-tion coefficients (Table 2) and experimen-tal values for the oil/water mixture with-out βLG (Table 3, pH6), it appears thatButtery’s law (BUTTERY et al., 1973) pre-dicted quite well the partition coefficientsof the compounds in the mixture. How-ever, when comparing the predicted val-
Table 2 - Experimental air/liquid partition coefficients (K x 1,000) of 20 aroma compounds in oil, oilwith 1% β-lactoglobulin, water, and in water with 1% β-lactoglobulin (n=3) as well as predicted air/liquid partition coefficients for oil/water mixtures with and without 1% β-lactoglobulin according to themethod reported by BUTTERY et al. (1973).
Compound Experimental partition coefficients Predicted partition coefficients
Oil Oil + 1% Water Water + 1% Oil/water Oil/water +1%βLG βLG mixture βLG mixture
Dimethyl sulfide 8.28 8.19 48.90 42.89 16.50 15.911-Propanol 4.19 3.84 1.15 1.16 1.62 1.61Diacetyl 2.76 2.55 1.86 1.76 2.14 2.012-Butanone 3.33 3.27 3.74 3.62 3.57 3.47Ethyl acetate 3.47 3.44 9.86 9.49 5.67 5.571-Butanol 1.16 1.12 0.86 0.84 0.96 0.932-Pentanol 0.87 0.87 1.49 1.38 1.16 1.12Propyl acetate 1.22 1.21 13.07 11.90 2.67 2.633-Methyl-1-butanol 0.69 0.69 1.18 1.11 0.92 0.89Ethyl butyrate 0.55 0.56 20.16 17.24 1.33 1.33Hexanal 0.38 0.37 16.81 12.46 0.92 0.90Butyl acetate 0.50 0.50 16.30 13.07 1.20 1.191-Hexanol 0.48 0.49 0.48 0.45 0.48 0.472-Heptanone 0.22 0.23 9.08 7.21 0.54 0.54Heptanal 0.21 0.21 19.82 12.11 0.51 0.50α-Pinene 0.23 0.23 1.49 0.18 0.47 0.202-Octanone 0.21 0.21 12.51 8.56 0.51 0.50Octanal 0.02 0.02 19.36 5.40 0.04 0.062-Nonanol 0.59 0.58 0.61 0.59 0.60 0.592-Decanone 0.28 0.28 26.13 5.95 0.69 0.66CVa [%] 9.4 8.1 5.4 2.6
a Average coefficient of variance.

Ital. J. Food Sci. n. 2, vol. 14 - 2002 151
ues based on oil with 1% βLG and waterwith 1% βLG (Table 2) with experimen-tal values of the emulsion with 1% βLG(Table 3, pH6), generally the experimen-tal values were slightly lower. This re-sult indicates that the formation of theinterface in the emulsion increased theretention of the compounds. The pH ofthe samples had no overall effect on thepartition coefficients (Friedman two-wayanalysis of variance by ranks, P < 0.05).These results are in contrast with theeffect of the pH on βLG in water as re-ported by JOUENNE and CROUZET(2000). The present authors also havefound different results for βLG in water:the retention of volatiles was higher atpH6 and pH9, and lower at pH3 (VANRUTH and VILLENEUVE, 2002).
The effect of the βLG depended on the
chain length of the compound, as wellas on their functional groups. The parti-tion coefficients of ketones as a functionof chain length is demonstrated in Fig.1. In water, partition coefficients in-creased with chain length, whereas wa-ter with 1% βLG showed a less steepslope and a further decrease for 2-de-canone. Table 4 shows the Pearson’scorrelation coefficients of the chainlength and the air/liquid partition coef-ficients of the homologous series of al-cohols, aldehydes, ketones and esters inthe various matrices. The correlationcoefficients for water showed that parti-tion coefficients of ketones, esters and,to lower extent aldehydes, increased lin-early with higher chain length. Alcoholsdid not demonstrate a significant corre-lation; obviously the hydrophilic group
Table 3 - Air/liquid partition coefficients (K x 1,000) of 20 aroma compounds in oil-in-water emulsionsvarying in β-lactoglobulin concentration and pH (n = 3).
Compound 0% βLG 1% βLG 2% βLG
pH3 pH6 pH9 pH3 pH6 pH9 pH3 pH6 pH9
1 Dimethyl sulfide 15.70 15.76 15.59 11.50 12.32 13.99 14.04 15.93 14.852 1-Propanol 1.96 1.97 1.91 1.26 1.27 1.27 1.36 1.39 1.273 Diacetyl 2.10 2.11 2.10 1.98 1.98 1.72 1.58 1.59 1.514 2-Butanone 3.47 3.47 3.39 3.37 3.46 3.61 3.39 3.19 3.695 Ethyl acetate 5.67 5.67 5.61 4.45 4.56 4.80 3.85 4.26 4.776 1-Butanol 1.20 1.13 1.20 0.82 0.81 0.81 0.77 0.82 0.887 2-Pentanol 1.33 1.30 1.32 1.03 1.00 0.95 0.81 0.87 1.018 Propyl acetate 2.61 2.65 2.66 2.46 2.51 2.56 2.32 2.39 2.539 3-Methyl-1-butanol 1.25 1.25 1.27 0.86 0.87 0.87 0.99 1.03 1.20
10 Ethyl butyrate 1.35 1.35 1.34 1.21 1.22 1.22 0.99 1.00 0.9911 Hexanal 0.85 0.85 0.80 0.83 0.77 0.69 0.50 0.32 0.1412 Butyl acetate 1.25 1.23 1.24 1.04 1.05 1.06 1.01 1.01 1.0113 1-Hexanol 1.22 1.22 1.22 0.60 0.61 0.62 0.65 0.68 0.6714 2-Heptanone 0.58 0.58 0.57 0.46 0.47 0.47 0.42 0.41 0.4015 Heptanal 0.51 0.50 0.50 0.34 0.33 0.33 0.31 0.28 0.1916 α-Pinene 0.59 0.58 0.59 0.38 0.39 0.39 0.43 0.35 0.3617 2-Octanone 0.50 0.52 0.53 0.30 0.29 0.30 0.27 0.28 0.2718 Octanal 0.10 0.10 0.10 0.07 0.09 0.07 0.05 0.06 0.0419 2-Nonanol 1.46 1.46 1.46 0.60 0.60 0.60 0.60 0.60 0.6020 2-Decanone 0.69 0.69 0.69 0.30 0.30 0.30 0.29 0.29 0.29
CVa [%] 10.0 5.8 8.3 2.5 3.9 3.8 8.6 5.7 13.6
a Average coefficient of variance.

152 Ital. J. Food Sci. n. 2, vol. 14 - 2002
mainly determines the properties of themolecule in water. When comparing thecorrelation coefficients for water withthose for water with βLG, relatively slightdifferences for alcohols, ketones and es-
Fig. 1 - Partition coefficients of ketones (listed in Table 2) in various matrices as a function of chainlength.
Table 4 - Linear relationships between the chain length of homologous series of alcohols, aldehydes,ketones, and esters and their air/liquid partition coefficients in various matrices: Pearson’s productmoment correlation coefficients.
Compound group Watera Water/βLGa Oil/waterb Oil/water/βLG Oil/water/Tween 20(99:1) (40:60) emulsionb Emulsionc
(40:59:1) (40:59:1)
Alcohols -0.47 -0.50 -0.28 -0.79 -0.81Aldehydes +0.77 -0.90 -0.99 -0.99 -0.99Ketones +0.94 +0.87 -0.85 -0.89 -0.89Esters +0.97 +0.95 -0.98 -0.99 -0.91
a Based on data from VAN RUTH and VILLENEUVE (2002).b Based on present data.c Based on data from VAN RUTH et al. (2002).
ters were observed. However, the posi-tive correlation coefficient for aldehydesin water changed to a negative correla-tion coefficient for water with βLG. Theseresults show that aldehydes demonstrat-

Ital. J. Food Sci. n. 2, vol. 14 - 2002 153
with both βLG and Tween 20. In thesesystems obviously the larger alcoholswere retained to a greater extent thantheir lower molecular weight counter-parts. The fact that an interface existedwith a polar and a non-polar phase atboth sides obviously played a role inde-pendent of the type of emulsifier. Theother compound groups already showeda strong negative correlation for the oil/water mixture itself and remained thesame for the emulsified system.
When comparing the air/liquid parti-tion coefficients of Tween 20 and βLGemulsions, which only differ in emulsifi-er, it was shown that the air/liquid parti-tion coefficients of the compounds wereconsistently higher for the Tween emul-sions (Fig. 2). βLG reduced headspaceconcentrations of the volatile compounds
ed a clear increased affinity for βLG withincreasing chain length. When changingthe matrix from water to an oil/watermixture, the hydrophobic character ofespecially the aldehydes, ketones andesters is shown, by strong negative cor-relations between chain length and par-tition coefficients. Especially the largercompounds of these groups preferred theoil to the water phase with decreasedheadspace concentration as a result. Thefunctional group of the alcohols stillplayed a major role, as alcohols yieldeda low correlation coefficient betweenchain length and partition coefficients.This, however, changed as soon as thesystem was emulsified, which involveda tremendous increase in surface area.A considerable negative correlation wasfound in emulsified oil/water systems
Fig. 2 - Difference in release of 20 aroma compounds from Tween 20 and β-lactoglobulin emulsionsunder equilibrium and mouth conditions (Tween - β-lactoglobulin). Numbers refer to compounds inTable 3.

154 Ital. J. Food Sci. n. 2, vol. 14 - 2002
to a much greater extent than the Tween20. The emulsions had the same dropletsize characteristics. The difference be-tween the emulsions with the two emul-sifiers increased with increasing chainlength, which demonstrated the high af-finity of the larger compounds for βLG.The present results confirm data ofCHARLES et al. (2000), which showed in-creased selective retention of larger sizedvolatile compounds in βLG emulsions incomparison with α-albumine emulsions.
When looking at the single com-pounds, hexanal, 2-nonanol and 2-de-canone showed the largest decrease inpartition coefficients when changingfrom 0% to 2% βLG, i.e. a decrease of62, 59 and 58%, respectively. In addi-tion, 2-pentanol (33%), 1-hexanol (43%),heptanal (44%), α-pinene (40%), 2-oc-tanone (46%) and octanal (40%) showeda considerable decrease. Affinity for βLGappeared to be more affected by thechain length of the compound than bytheir functional groups. The retention ofthe compounds stated above in the emul-sion with 2% βLG (average of 47%) is verysimilar to their retention in water with2% βLG (average of 46%; VAN RUTH andVILLENEUVE, 2002). However, absolutepartition coefficients of the compoundswere considerably lower for the emulsion,because of their affinity for the oil phase.From these results it can be concludedthat βLG exerts a considerable effect onequilibrium headspace concentrations ofvolatile compounds in emulsions. Theseconcentrations relate to the orthonasalroute which links to the odor of a food.
The experiments described above wereall conducted on the pure emulsions. Toallow direct comparison with the mouthconditions studied, additional experi-ments with the 1% βLG and 2% βLGemulsion (pH6) were performed to de-termine the air/liquid partition coeffi-cients of the compounds with additionof saliva. The partition coefficients of thecompounds with addition of artificialsaliva are presented in Table 5. As addi-
tion of saliva also changed the pH frompH6 to pH7, a 1% βLG emulsion at pH7was analysed, to distinguish the effectof the saliva components and the effectof the change in pH (Fig. 3). It is obviousthat the pH change had a minor effectcompared to the overall effect of saliva.Lower partition coefficients were foundfor relatively hydrophilic compounds,such as 2-propanol and diacetyl, where-as compounds with a more hydrophobicnature, e.g. 2-nonanol and 2-decanonedemonstrated an increase of ca. 60%.These changes are likely to be related tothe higher proportion of water in the to-tal matrix (emulsion+saliva) and are inagreement with previous studies (ODAKEet al., 1998; VAN RUTH et al., 2001). How-ever, it is remarkable that each of thealdehydes showed a decrease in the par-
Table 5 - Air/liquid partition coefficients (K x 1,000)of 20 aroma compounds in oil-in-water emulsionsvarying in β-lactoglobulin concentration with ad-dition of artificial saliva (ratio sample:saliva is60:40, pH=7, n=3).
1% βLG + saliva 2% βLG + saliva
Dimethyl sulfide 13.01 12.871-Propanol 1.05 0.69Diacetyl 0.85 0.822-Butanone 3.28 2.77Ethyl acetate 4.68 5.421-Butanol 0.86 0.932-Pentanol 0.78 1.02Propyl acetate 2.93 3.043-Methyl-1-butanol 0.99 0.99Ethyl butyrate 1.43 1.63Hexanal 0.26 0.29Butyl acetate 1.31 1.371-Hexanol 0.89 1.112-Heptanone 0.64 0.35Heptanal 0.31 0.34α-Pinene 0.64 0.672-Octanone 0.44 0.44Octanal 0.08 0.092-Nonanol 0.98 0.982-Decanone 0.50 0.49CVa [%] 10.2 12.5
a Average coefficient of variance.

Ital. J. Food Sci. n. 2, vol. 14 - 2002 155
tition coefficients with addition of sali-va. From their hydrophobicity an in-crease in a more polar matrix would beexpected. The decrease observed is like-ly to be due to other components of theartificial saliva than water. The appar-ent concentration of the aldehydes maybe reduced by binding to the proteins inthe saliva, such as mucin and α-amyla-se (VAN RUTH et al., 2001).
Mouth conditions
The release of the 20 volatile com-pounds from the various emulsions wasstudied in the model mouth system.Emulsions with 1% βLG pH3, 6 and 9,as well as an emulsion with 2% βLG pH6were evaluated. The proportions of the
compounds released are presented inFig. 4. Large differences were observedbetween compounds; proportions re-leased in 1 min varied between 0.1 and3% of the amount initially present inthe emulsion. The proportions of thevarious compounds released from theemulsions related reasonably well to thepartition coefficients of the compoundsin the pure emulsions, but relatedslightly better to the partition coeffi-cients of the compounds in emulsion/saliva mixtures. For instance for the 1%βLG emulsion (pH6), the correlation co-efficients were r = 0.860 and r = 0.875,respectively. The thermodynamic com-ponent dictated the differences in re-lease between compounds to a greatextent.
Fig. 3 - Change in air/liquid partition coefficients of 20 compounds in a 40% oil-in-water emulsionemulsified with 1% β-lactoglobulin by addition of artificial saliva and by the change in pH only associ-ated with addition of artificial saliva.

156 Ital. J. Food Sci. n. 2, vol. 14 - 2002
The βLG concentration had no signif-icant effect on the release from the emul-sions at pH6 (Sign tests, P < 0.05) andthe pH did not affect the overall releasein the emulsion consisting of 1% βLG(Friedman two-way analysis of varianceby ranks, P < 0.05).
The minor effect of βLG on volatile re-lease under mouth conditions agreeswith the equilibrium data of the emul-sion when saliva was added. Althoughthe concentration βLG had a considera-ble effect on retention of volatiles in pureemulsions under equilibrium conditions,this effect was extinguished by the ad-dition of saliva. From the data it can beconcluded that, the βLG concentrationaffected neither the thermodynamic northe kinetic component of the release to
a great extent. Although the concentra-tion of βLG had no considerable effect,the presence of βLG had quite an effect,which can be shown by comparison withanother emulsifier. The release from βLGand Tween 20 emulsions under mouthconditions is compared in Fig. 2. Releasefrom the Tween emulsions was consist-ently higher than release from the βLGemulsions. The difference in release canonly partially be attributed to the ther-modynamic component, which is reflect-ed by the difference under equilibriumconditions (Fig. 2). As a result, βLG musthave affected the kinetic component ofaroma release and thus the resistanceto mass transfer.
The effect of the pH on the aroma re-leased is in line with the thermodynamic
Fig. 4 - Proportions of aroma compounds released from a 40% oil-in-water emulsion under mouthconditions as a function of β-lactoglobulin concentration and pH. Numbers refer to compounds in Table3, compounds with release <0.1% not shown.

Ital. J. Food Sci. n. 2, vol. 14 - 2002 157
data presented in the previous section:no effect of pH was shown under equilib-rium conditions. Obviously, the pH didnot alter the resistance to mass transfer,either. This is partially due to the buffer-ing capacity of the artificial saliva affect-ing the final pH of the emulsions.
βLG as such affected the release ofvolatile compounds from oil-in-wateremulsions. However, the concentrationof βLG and the pH hardly affected therelease, which can be attributed to alarge extent to the influence of saliva. Therelease under mouth conditions is ex-pected to relate to the retronasal per-ception of the compounds, i.e. the aro-ma perceived during eating.
CONCLUSIONS
The presence of βLG affected releaseof volatile flavour compounds from oil-in-water emulsions both under equilib-rium and mouth conditions. The βLGconcentration reduced the equilibriumheadspace concentrations mainly of larg-er sized aroma compounds. The effect ofβLG decreased when artificial saliva wasadded to the emulsion. Under mouthconditions, neither the concentration ofβLG nor the pH exerted a significant ef-fect on the release of volatiles. As a con-sequence, βLG concentrations couldhave an effect on the odor perception ofthe compounds in oil-in-water emul-sions. However, it is likely that this pa-rameter has a rather limited effect on thearoma perceived during eating.
REFERENCES
Arctander S. 1969. “Perfume and Flavor Chemi-cals (Aroma Chemicals)”. Allured PublishingCorporation, Carol Stream, IL, USA.
Brownlow S., Morais Cabral H.H., Cooper R., Flow-er D.R., Yewdall S.J., Polikarpov I., North A.-C.T. and Sawyer L. 1997. Bovine β-lactoglobu-lin at 1.8 A resolution: still an enigmatic lipoc-alin. Structure 5: 481.
Buttery R.C., Guadagni D.G. and Ling L.C. 1973.Flavor compounds: volatiles in vegetable oil andoil/water mixtures. Estimation of odor thresh-olds. J. Agric. Food Chem. 21: 198.
Charles M., Bernal B. and Guichard E. 1996. In-teractions of β-lactoglobulin with flavour com-pounds. In “Flavour Science: Recent Develop-ments”. A.J. Taylor and D.S. Mottram (Eds.), p.433. RSC, London.
Charles M., Lambert S., Brondeur P., Courthau-don J.-L. and Guichard E. 2000. Influence offormulation and structure of an oil-in-wateremulsion on flavor release. In “Flavor Release”.D.D. Roberts and A.J. Taylor (Eds.), p. 342. ACS,Washington.
Guichard E. and Langourieux S. 2000. Interac-tions between β-lactoglobulin and flavour com-pounds. Food Chem. 71: 301.
Jouenne E. and Crouzet J. 1996. Interaction of aro-ma compounds with β-lactoglobulin. In “FlavourScience: Recent Developments”. A.J. Taylor andD.S. Mottram (Eds.), p. 425. RSC, London.
Jouenne E. and Crouzet J. 2000. Effect of pH onretention of aroma compounds by β-lactoglob-ulin. J. Agric. Food Chem. 48: 1273.
Kinsella J.E. 1988. Flavour perception and bind-ing to food components. In “Flavour Chemistryof Lipid Foods”. D.B. Min and T.H. Smouse(Eds.), p. 376. ACS, Washington.
Langourieux S. and Escher F.E. 1999. Interactionsbetween β-lactoglobulin and aroma compounds:a review of the Cost Action 96. In “Proceedingsof Cost Action 96, Zürich, May 13-15 1998”. F.Escher and J. Nüssli (Eds.), p. 81. EC, Luxem-bourg.
Lide D.R. 1997. “CRC Handbook of Chemistry andPhysics”. CRC Press, New York.
McClements D.J. 1998. Lipid-based emulsions andemulsifiers. In “Food Lipids”. C.C. Akoh andD.B. Min (Eds.), p. 55. Marcel Dekker, New York.
Odake S., Roozen J.P. and Burger J.J. 1998. Ef-fect of saliva dilution on the release of diacetyland 2-heptanone from cream style dressings.Nahrung 42: 385.
O’Mahony M. 1986. “Sensory Evaluation of Food”.Marcel Dekker, New York.
Pelletier E., Sostmann K. and Guichard E. 1998.Measurement of interactions between β-lac-toglobulin and flavor compounds (esters, acids,pyrazines) by two HPLC methods: affinity chro-matography and Hummel and Dreyer method.J. Agric. Food Chem. 46: 1506.
Qin B.Y., Creamer L.K., Baker E.N. and JamesonG.B. 1998. 12-Bromododecanoic acid binds in-side the calyx of bovine β-lactoglobulin. FEBSLetters 438: 272.
Roberts D.D. and Acree T.E. 1996. Retronasal re-lease in oil and water model systems with anevaluation of volatility predictors. In “Flavor-Food Interactions”. R.J. Mcgorrin and J.V. Le-land (Eds), p.179. ACS, Washington.

158 Ital. J. Food Sci. n. 2, vol. 14 - 2002
Rogacheva S., Espinoza-Diaz M.A. and Voilley A.1999. Transfer of aroma compounds in water-lipid systems: binding tendency of β-lactoglob-ulin. J. Agric. Food Chem. 47: 259.
Stapelfeldt H. and Skibsted L.H. 1994. Modifica-tion of b-lactoglobulin by aliphatic aldehydesin aqueous solutions. J. Dairy Res. 61: 209.
van Ruth S.M. and Roozen J.P. 2000. Influence ofmastication and artificial saliva on aroma re-lease in a model mouth system. Food Chem.71: 339.
van Ruth S.M., O’Connor C.H. and Delahunty C.M.2000. Relationships between temporal releaseof aroma compounds in a model mouth systemand their physico-chemical characteristics.Food Chem. 71: 393.
van Ruth S.M., Grossmann I., Geary M. and Dela-hunty C.M. 2001. Interactions between artifi-cial saliva and 20 aroma compounds in waterand oil model systems. J. Agric. Food Chem.49: 2409.
van Ruth S.M. and Villeneuve E. 2002. Influenceof β-lactoglobulin, pH and other compounds onthe retention of 20 aroma compounds in water.Food Chem. In press.
van Ruth S.M., de Vries G., Geary M. and Gian-nouli P. 2002. Influence of composition andstructure of oil-in-water emulsions on retentionof aroma compounds. J. Sci. Food Agric. In press.
Wu S.-Y., Perez M.D., Puyol P. and Sawyer L. 1999.β-Lactoglobulin binds palmitate within its cen-tral cavity. J. Biol. Chem. 274: 170.
Revised paper received January 14, 2002 Accepted February 25, 2002

Ital. J. Food Sci. n. 2, vol. 14 - 2002 159
PAPER
- Key words: chicken egg, dietary lipid supplements, flaxseed oil, functional and sensoryproperties, grape oil, palm butter -
EFFECT OF DIETARY VEGETABLE LIPIDSON FUNCTIONAL AND SENSORYPROPERTIES OF CHICKEN EGGS
EFFETTO DI LIPIDI VEGETALI DELLA DIETA SULLE PROPRIETÀFUNZIONALI E SENSORIALI DELLE UOVA DI GALLINA
N. TALLARICO, F. SIRRI, A. MELUZZI, P. PITTIA1, G.P. PARPINELLOand A. FRANCHINI
Dipartimento di Scienze degli Alimenti, Alma Mater Studiorum-Universitàdi Bologna, Via San Giacomo 9, 40126 Bologna, Italy
1 Dipartimento di Scienze degli Alimenti, Università di Udine, Via Marangoni 97,33100 Udine, Italy
ABSTRACT
Trials were carried out with brownlaying hens to study the effects of die-tary addition of 2% palm butter (Palm),grape seed oil (Grape), flax seed oil(Flax), dried Schizochytrium sp. marinealgae (Algae) and lard (Control) on eggquality, and on the sensory and func-tional properties of eggs. The weight ofegg and of its components and theHaugh index were not affected by thetype of lipid supplementation. Algaeyolks showed a more intense colour at-tributable to carotenoids contained inSchizochytrium sp. Consistency indexand flow behaviour index of yolk ho-
RIASSUNTO
Scopo della ricerca è stato studiarel’effetto dell’aggiunta ad una dieta pergalline ovaiole produttrici di uova a gu-scio colorato del 2% di olio di palma(Palm), o olio di vinacciolo (Grape) o oliodi semi di lino (Flax) o alga marina Schi-zochytrium sp. (Algae) o lardo (Control)sulla qualità e sulle proprietà funzionalie sensoriali delle uova. Il peso dell’uovoe delle sue parti, come pure l’indice diHaugh non sono stati influenzati dal tipodi integrazione lipidica della dieta. I tuorlidelle uova del gruppo Algae erano colo-rati più intensamente probabilmente peril maggior contenuto di carotenoidi pre-

160 Ital. J. Food Sci. n. 2, vol. 14 - 2002
mogenates were significantly affected bythe dietary supplementation, whereasemulsion properties and baking prop-erties of Madeira cakes were not affect-ed by dietary treatments. The taste ofhard-boiled eggs was not influenced byflax, palm, grape and lard supplements,whereas the odour of Grape eggs hadthe lowest score (no anomalous taste).As for taste, Grape and Flax Madeiracakes had the lowest and the highestscore, respectively. The different lipidvegetable sources, with the exceptionof flax seed oil, did not depreciate thesensory characteristics of eggs and thebaked products.
senti in Schizochytrium sp. Il trattamentodietetico della gallina modifica gli indicidi consistenza e del comportamento delflusso degli omogenati di tuorlo, mentrenon ha effetto sulle proprietà delle emul-sioni e sulle caratteristiche dei prodottida forno. Il sapore delle uova sode non èstato influenzato dagli integratori lipidi-ci mentre per l’odore le uova del gruppoGrape hanno ottenuto la miglior valu-tazione degli assaggiatori (nessun odo-re anomalo). Le torte Madeira dei grup-pi Grape e Flax hanno ottenuto rispetti-vamente il valore più basso (minor sa-pore anomalo) e più alto (più forte sapo-re anomalo) della scala di valutazionedel sapore. Le differenti fonti lipidichevegetali, con l’eccezione dell’olio di semidi lino, non deprezzano le caratteristi-che sensoriali delle uova o dei prodottida forno a base di uova.
INTRODUCTION
The egg is an important ingredient forthe preparation of several food productssuch as noodles, mayonnaise, cakes andcandy (FORSYTHE, 1963). It may be con-sidered a multifunctional ingredientsince it can perform several simultane-ous functions by its coagulating, foam-ing, emulsifying, colouring, flavouringand anticrystallizing properties as wellas delivering important nutrients (YANGand BALDWIN, 1995).
Many trials have been carried out toimprove the nutritional properties ofeggs. Eggs have been enriched with n-3PUFA such as α-linolenic acid (CASTONand LEESON, 1990; CHERIAN and SIM,1991) or eicosapentaenoic (EPA) anddocosahexaenoic (DHA) acids (FARRELL,1994; HERBER and VAN ELSWYK, 1996;MELUZZI et al., 1997a) and with vitamins(JIANG et al., 1994; SURAI et al., 1997;MELUZZI et al., 2000).
Events such as bovine spongiform en-
cephalopathy, dioxine poisoning and re-curring Salmonella infections have ledto changes in the feed formulation of lay-ing hen diets. Animal meals have beenbanned and other animal ingredientssuch as lipid supplements are not want-ed by large scale-distributors and con-sumers. Therefore, at the present, in It-aly laying hen diet is formulated by us-ing only vegetable sources. Even if theeffects of different lipid supplements onegg composition are known, there is alack of information about the effects ofthese sources on the sensory and func-tional properties of eggs and egg prod-ucts which are more and more consid-ered by the food industry for a betterutilisation of eggs. Furthermore, the for-tification of eggs through hen dietarymanipulation, such as enrichment withn-3 PUFAs, may give a fishy flavour tothe eggs (JIANG et al., 1992, VAN ELSWYKet al., 1995, MELUZZI et al., 1997b) de-pending on the dose or on the type ofthe dietary lipid supplements. A reduc-

Ital. J. Food Sci. n. 2, vol. 14 - 2002 161
tion of overall acceptability and off-fla-vours was also detected by LEESON etal. (1998) when flax seed or vitamin Ewere added to the hen diets.
The aim of our study was to investi-gate the effects of vegetable lipid sourc-es with quite different fatty acid (FA) com-positions, either saturated FA, or n-6PUFA, or n-3 PUFA or long chain n-3PUFA, on the sensory and functionalproperties of eggs.
MATERIALS AND METHODS
Experimental design
One hundred and twenty 24-week-oldHyline brown laying hens, divided into 5groups, were fed isoenergetic diets withthe addition of 20 g/kg vegetable lipidsupplements, of quite different fatty acidprofiles: palm butter (Palm) which has ahigh level of saturated and monounsatu-rated fatty acids (45% palmitic acid and38% oleic acid); grape seed oil (Grape)which contains more than 68% linoleicacid (n-6 PUFA) and a good amount ofoleic acid (18%); flax seed oil (Flax) con-taining approx. 41% α-linolenic acid (n-3PUFA) and 29% oleic acid and driedSchizochytrium sp. marine algae (Algae)whose lipid content (53%) was particu-larly rich in docosahexaenoic acid or DHA(41%). The supplement of the controlgroup (Control) was lard containing oleic(41%), palmitic (27%), stearic (13%) andlinoleic (12%) acids. The diets and thecharacteristics of the lipid supplementswere reported by MELUZZI et al. (2001).
Egg quality evaluation
Four and eight weeks after the begin-ning of the dietary treatment, eggs col-lected for three consecutive days wereused to evaluate yolk, albumen and shellweights and all the eggs collected in oneday were assessed for the yolk index(height:width ratio; FUNK, 1948) and
Haugh index to evaluate the firmness ofthe albumen. The Haugh index was de-termined according to the following equa-tion:
Haugh Units = 100 * log (h - 1.7 * P0.37 + 7.57)
whereH = height of spread egg white in mm;P = egg weight in g.The yolk colour was evaluated accord-
ing to the CIE L* a* b* system using aMinolta colorimeter CR 300 (MinoltaCamera Co., Ltd, Osaka, Japan).
Egg functional properties
Six weeks from the beginning of thedietary treatment the eggs were collectedfor three consecutive days to evaluate thefunctional properties of the yolk since thedifferent fatty acid composition of the di-ets presumably only affected lipid com-ponents of the egg, i.e. yolk. Three poolsof 5 yolks each were used to prepare ho-mogenates and 10 mL per pool were usedto measure the yolk viscosity by using theStress Tech Rheometer (Reologica Instru-ments, AB, Lund, Sweden) equipped witha bob and cup system (CC25) at 20°C.Apparent viscosity was determined fromthe flow curves evaluated in the shear raterange between 0.1220 to 87.67 s-1. Datafrom the shear stress (s) with increasingshear rate (γ) were elaborated followingthe power law equation (τ = Κ* (γ)n). Thevalues of K (Consistency Index, Pa * sn)and n (Flow Behaviour Index, dimension-less) reported, are the average of threemeasurements. Three pools of 4 yolkseach were used to prepare homogenatesand 15 g yolk homogenate +36 g corn oil+39 g water were emulsified by an ultra-turrax for 70 sec at increasing speed from9,000 to 11,000 RPM. At 60 and 120 minthe drainage was measured to evaluatethe amount of non-bound emulsion wa-ter and the water released by the emul-sion, respectively. The stability of emul-sion was then calculated (SCHOLTYSSEK,

162 Ital. J. Food Sci. n. 2, vol. 14 - 2002
1995). Baking quality of the eggs was eval-uated in Madeira cakes prepared accord-ing to the recipes of SCHOLTYSSEK et al.(1994). The dough density was calculat-ed as the ratio of the weight of 100 mL ofdough with respect to volume. Sixtygrams of dough were put in steel rings(i.d.: 100 mm) and baked in a ventilatedoven (SMEG, Alpha 30HX) at 200°C for15 min. Afterwards the cooking loss ofcake volume was measured. The volumewas calculated by filling a container withrape seeds, then the container was emp-tied and filled again with the cake andthe rape seeds. The volume of the remain-ing seeds was considered as the volumeof the cake. In the middle of the cakestwo rectangular samples (20 x 50 mm xheight of the baked cake) were carefullycut and the maximum shear load wasmeasured using a dynamometer InstronUniversal Testing Machine, Mod. 4301,(U.T.M., Instron International Limited,High Wycombe, England) equipped witha load cell of 1 kN at a crosshead speedof 3.33 mm/s.
Sensory evaluation
The organoleptic properties of the eggsand Madeira cakes made with eggs ob-tained from hens receiving dietary lipidsupplement such as grape seed oil, palmbutter, flax seed oil and lard were evalu-ated. The eggs from the Algae group werenot considered since both algae and flaxseed oil contain n-3 PUFA even if thechains of the fatty acids have differentlengths.
Hard-boiled eggs were prepared as fol-lows: eggs were stored at 4°C for 15 daysafter laying, then cooked by placing inboiling water for 8 min. Once cooled toan external temperature of about 40°C,the eggs were peeled and the yolks sepa-rated; they were then divided into 4 piec-es and stored in hermetically closed con-tainers.
Madeira cakes were prepared accord-ing to SCHOLTYSSEK et al. (1994). To de-
termine the dietary effect on the taste andodour of the eggs and on the taste of theMadeira cake, thirty untrained panelistswere recruited from students and staff ofthe Course of Food Science and Technol-ogy (University of Bologna, Italy). Theywere asked to rate any taste or odour oth-er than “typical egg taste or odour” on a7-point hedonic scale (1= no anomaloustaste or odour; 7= strong anomalous tasteor odour) according to LAWLESS and HEY-MANN (1998). Mineral water and unsalt-ed crackers were allowed for mouthcleansing between samples. The tastingsession was conducted in standard greyindividual booths equipped with constantillumination in a sensory evaluation fa-cility according to ISO 8589 (1988).
Statistical analysis
Data concerning the functional prop-erties tested, carried out on fresh, cookedeggs, and Madeira cakes, were submit-ted to one way ANOVA using the GeneralLinear Model procedure of SAS (1985),considering the dietary treatment as fixedeffect. For functional data mean differ-ences were separated by Student-New-man Keuls test, whereas sensory datawere tested by means of Waller-Duncank-ratio multiple comparison test.
RESULTS AND DISCUSSION
Egg quality
The weight of egg and its componentswas not affected by the diet either after 4or 8 weeks of treatment (Table 1). HALLE(1999), feeding broiler breeder hens dietswith the addition of 25 or 50 g/kg of palmbutter or safflower, did not find any sta-tistically significant effects on egg mass,yolk and albumen. Dietary levels ofground and whole flaxseed up to 10%were not found to affect egg weight (EDERet al., 1998). On the contrary CASTON etal. (1994) detected decreases in egg

Ital. J. Food Sci. n. 2, vol. 14 - 2002 163
weights after feeding 10 and 20% groundflax seed and SCHEIDELER and FRONING(1996) also reported a reduction in yolkweight after feeding 5 or 15% ground orwhole flax seed. A decrease in egg weightwas also observed by HERBER and VANELSWYK (1996) in response to 4.8% ma-rine algae in the hen’s diet. VAN ELSWYKet al. (1994) hypothesised that the de-crease in yolk weight in response to then-3 PUFA diet was related to the influ-ence of n-3 PUFA on hepatic lipid metab-olism and particularly to the decrease inthe level of circulating lipids of birdswhich are the source of yolk lipids. In ourstudy the lack of differences in egg sizemight be due to the low proportions oflipid supplements in the hen’s diet.
Yolk index was quite stable and wasnot affected by the duration or the typeof dietary treatment (Table 1). Haughindex, an indicator of albumen firmness,was not affected by the type of lipid sup-plementation of the diet (Table 1).
The results of yolk colour (Table 2)showed lower lightness values (L * axis)from the Algae group, compared to theControl, and a statistically higher red-
ness value (a * axis) than that of all oth-er groups. The more intense colouringof the Algae yolk is attributable to caro-tenoids, specifically canthaxanthin andβ-carotene, occurring in Schizochytriumsp. (HERBER and VAN ELSWYK, 1996).
Functional properties
The values of dough density and bak-ing properties of Madeira cakes ranged
Table 1 - Effects of different dietary lipid supplements on the weight of whole egg and egg componentsafter 4 and 8 weeks of treatment.
Group Whole egg Yolk Albumen Shell Haugh index Yolkg g g g u index
4 weeksControl 65.50 16.10 43.38 6.02 92.14 0.471Palm 63.57 15.54 41.97 6.06 91.56 0.466Grape 65.72 15.84 43.80 6.09 91.74 0.482Flax 66.29 15.98 44.25 6.06 92.07 0.470Algae 63.90 15.56 42.41 5.93 91.04 0.481EMS 28.10 1.56 20.65 0.22 30.67 0.002D,F, 111 111 111 111 109 1098 weeksControl 64.70 15.71 42.86 6.13 90.90 0.470Palm 63.12 15.57 41.51 6.05 90.88 0.477Grape 64.64 15.71 42.64 6.02 91.83 0.485Flax 65.97 15.97 43.87 6.12 90.10 0.486Algae 64.59 16.03 42.46 6.10 90.24 0.482EMS 23.23 1.76 17.13 0.22 37.09 0.0006D,F, 103 102 102 102 100 99
Table 2 - Effects of different dietary lipid supple-ments on yolk colour.
Groups L * a * b *
Control 53.21 A 0.303 b 41.67Palm 52.32 AB 0.397 b 40.80Grape 52.44 AB 0.206 b 41.44Flax 52.20 AB 0.142 b 41.07Algae 51.18 B 0.980 a 41.35EMS1 3.03 0.71 4.73D.F. 108 108 108
1 error mean square.Means with different letters in the same column differsignificantly for P < 0.05, if small, and for P < 0.01, ifcapital.
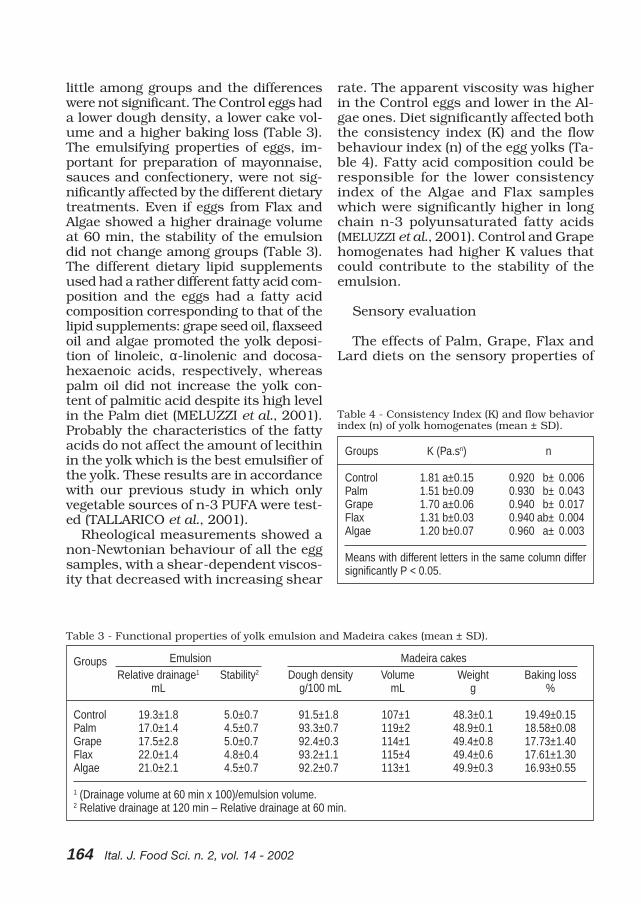
164 Ital. J. Food Sci. n. 2, vol. 14 - 2002
little among groups and the differenceswere not significant. The Control eggs hada lower dough density, a lower cake vol-ume and a higher baking loss (Table 3).The emulsifying properties of eggs, im-portant for preparation of mayonnaise,sauces and confectionery, were not sig-nificantly affected by the different dietarytreatments. Even if eggs from Flax andAlgae showed a higher drainage volumeat 60 min, the stability of the emulsiondid not change among groups (Table 3).The different dietary lipid supplementsused had a rather different fatty acid com-position and the eggs had a fatty acidcomposition corresponding to that of thelipid supplements: grape seed oil, flaxseedoil and algae promoted the yolk deposi-tion of linoleic, α-linolenic and docosa-hexaenoic acids, respectively, whereaspalm oil did not increase the yolk con-tent of palmitic acid despite its high levelin the Palm diet (MELUZZI et al., 2001).Probably the characteristics of the fattyacids do not affect the amount of lecithinin the yolk which is the best emulsifier ofthe yolk. These results are in accordancewith our previous study in which onlyvegetable sources of n-3 PUFA were test-ed (TALLARICO et al., 2001).
Rheological measurements showed anon-Newtonian behaviour of all the eggsamples, with a shear-dependent viscos-ity that decreased with increasing shear
rate. The apparent viscosity was higherin the Control eggs and lower in the Al-gae ones. Diet significantly affected boththe consistency index (K) and the flowbehaviour index (n) of the egg yolks (Ta-ble 4). Fatty acid composition could beresponsible for the lower consistencyindex of the Algae and Flax sampleswhich were significantly higher in longchain n-3 polyunsaturated fatty acids(MELUZZI et al., 2001). Control and Grapehomogenates had higher K values thatcould contribute to the stability of theemulsion.
Sensory evaluation
The effects of Palm, Grape, Flax andLard diets on the sensory properties of
Table 3 - Functional properties of yolk emulsion and Madeira cakes (mean ± SD).
Groups Emulsion Madeira cakesRelative drainage1 Stability2 Dough density Volume Weight Baking loss
mL g/100 mL mL g %
Control 19.3±1.8 5.0±0.7 91.5±1.8 107±1 48.3±0.1 19.49±0.15Palm 17.0±1.4 4.5±0.7 93.3±0.7 119±2 48.9±0.1 18.58±0.08Grape 17.5±2.8 5.0±0.7 92.4±0.3 114±1 49.4±0.8 17.73±1.40Flax 22.0±1.4 4.8±0.4 93.2±1.1 115±4 49.4±0.6 17.61±1.30Algae 21.0±2.1 4.5±0.7 92.2±0.7 113±1 49.9±0.3 16.93±0.55
1 (Drainage volume at 60 min x 100)/emulsion volume.2 Relative drainage at 120 min – Relative drainage at 60 min.
Table 4 - Consistency Index (K) and flow behaviorindex (n) of yolk homogenates (mean ± SD).
Groups K (Pa.sn) n
Control 1.81 a±0.15 0.920 b± 0.006Palm 1.51 b±0.09 0.930 b± 0.043Grape 1.70 a±0.06 0.940 b± 0.017Flax 1.31 b±0.03 0.940 ab± 0.004Algae 1.20 b±0.07 0.960 a± 0.003
Means with different letters in the same column differsignificantly P < 0.05.

Ital. J. Food Sci. n. 2, vol. 14 - 2002 165
hard-boiled eggs and Madeira cakes arereported in Table 5. For clarity of pres-entation, we refer to Palm, Grape, Flaxand Lard “samples”, indicating eggs andcakes obtained from diets with the cor-responding supplement. Panelists wereunable to distinguish a difference (P >0.05) in taste among the four differenthard-boiled egg samples, the mean val-ues ranging from 3.4 (Palm) to 4.0 (Lard).Conversely, there was a statistically sig-nificant difference (P = 0.00002) in eggodour, with the Grape sample having thelowest score (3.1). AHN et al. (1995) re-ported that the flavour scores of eggsfrom diets supplemented with 3% α-li-nolenic acid (the main fatty acid of flaxseed) were higher, therefore less favour-able, than those from the Control group.On the contrary, LEESON et al. (1998)found no significant difference in aro-ma, flavour, and overall acceptability ofboiled eggs from hens whose diets con-tained 10 or 20% flax seed. Moreover,an off-flavour was slightly perceived ineggs from flax-fed birds during taste-panel studies involving fresh and storedeggs (CASTON et al., 1994). HALLE (1999),feeding hens diets with the addition of2.5 or 5% palm butter, gave no mentionof modifications in egg flavour or odour.As regards the taste evaluation of Ma-deira cakes, the panelists identified asignificant difference among samples (P
< 0.01). In particular, the Grape sampleobtained the lowest score (3.2) and wasconsidered the one with the least anom-alous taste, whereas the Flax samplehad the highest score (5.1). These datapartially confirmed the results obtainedfrom hard-boiled eggs. In fact, Grapesamples (hard-boiled eggs and Madeiracakes) had the lowest scores, thus sug-gesting that these samples are charac-terised by a less anomalous taste. Palmand Lard samples (for eggs and Madei-ra cakes) had intermediate scores,whereas Flax Madeira cake had thehighest value, thus having the highestanomalous egg taste. Differences in eval-uation between hard-boiled eggs andMadeira cakes from the Flax diet maybe due to different thermal treatment.In few cases panelists reported the per-ception of fishy notes in Madeira cakesamples. These results are the initialcontribution to understanding of thesensory properties of eggs obtained froma grape seed oil based diet.
Even if far from being conclusive, theresults of the sensory analysis suggestthe different vegetable sources tested,with the exception of flax seed oil, do notdepreciate the sensory characteristics ofeggs and the baked product. However,supplementing the laying hen diet witha low amount of flax seed oil to enrichthe egg yolk with n-3 PUFA (MELUZZI etal., 2001), makes eggs or egg based cakesless appreciated by ordinary consumers,particularly when they are baked at hightemperatures. The functional propertiesof eggs were little affected by the dietarytreatment of the laying hens with theexception of the consistency and flowbehaviour indexes of yolk, therefore thereare no negative indications for their useby the food industry.
ACKNOWLEDGEMENTS
This study was supported by a fund from the EmiliaRomagna Region (Italy).
Table 5 - Sensory evaluation of boiled eggs andMadeira cakes.
Groups Taste Boiled eggs Madeira cakesOdour Taste
Lard 4 4.9 A 3.9 BPalm 3.4 4.7 A 4.2 BGrape 3.7 3.1 B 3.2 CFlax 3.7 4.8 A 5.1 AP NS 0.00002 0.000006
Means with different capital letters in a column differsignificantly for P < 0.01.

166 Ital. J. Food Sci. n. 2, vol. 14 - 2002
REFERENCES
Ahn D.U., Sunwoo H.H., Wolfe F.H. and Sim J.S.1995. Effects of dietary α-linolenic acid andstrain of hen on the fatty acid composition, stor-age stability, and flavor characteristics of chick-en eggs. Poultry Sci. 74: 1540.
Caston L. and Leeson S. 1990. Research note: di-etary flax and egg composition. Poultry Sci. 69:1617.
Caston L., Squires E.J. and Leeson S. 1994. Henperformance, egg quality, and sensory evalua-tion of eggs from SCWL hens fed dietary flax.Can. J. Anim. Sci. 74: 347.
Cherian G. and Sim J.S. 1991. Effect of feedingfull fat flax and canola seeds to laying hens onthe fatty acid composition of eggs, embryos andnewly hatched chicks. Poultry Sci. 70: 917.
Eder K., Roth-Maier D.A. and Kirchgeßner M. 1998.Laying performances and fatty acid composi-tion of egg yolk lipids of hens fed diets with var-ious amounts of ground or whole flaxseed. Arch.Geflugelk. 62: 223.
Farrell D.J. 1994. Fortification of hen’s eggs withomega-3 long chain fatty acid and their effectson humans. In “Egg Uses and Processing Tech-nologies. New Developments”. Sim J.S. and Na-kai S. (Eds.). p. 386. CAB International. Oxon.
Forsythe R.H. 1963. Chemical and physical prop-erties of eggs and egg products. Cereal Sci. To-day 8: 309.
Funk E.M. 1948. The relation of the yolk indexdetermined in natural position to the yolk in-dex as determined after separating the yolk fromalbumen. Poultry Sci. 27: 367.
Halle I. 1999. Untersuchungen zum Einfluß ein-und mehrfach ungesättigter Futterfettsäurenauf Legeleistungsmerkmale, Eizusammenset-zung und Dotterfettsäuremuster bei Zuchthen-nen des Masthuhntyps. Arch. Geflugelk. 63: 21.
Herber S.M. and Van Elswyk M.E. 1996. Dietarymarine algae promotes efficient deposition ofn-3 fatty acids for the production of enrichedshell eggs. Poultry Sci. 75: 1501.
ISO 8589 1988. “Sensory Analysis – General Guid-ance for the Design of Test Rooms. Internation-al Organization for Standardization”. Geneva,Switzerland.
Jiang Y.H., McGeachin R.B. and Bailey C.A. 1994.a-tocopherol, b-carotene and retinol enrichmentof chicken eggs. Poultry Sci. 73: 1137.
Jiang Z., Ahn D.U., Ladner L. and Sim J.S. 1992.Influence of feeding full-fat flax and sunflowerseeds on internal and sensory qualities of eggs.Poultry Sci. 71: 378.
Lawless H.T. and Heymann H. 1998. “SensoryEvaluation of Food”. Chapman and Hall (eds.)New York, NY.
Leeson S., Caston L. and MacLaurin T. 1998. Or-
ganoleptic evaluation of eggs produced by lay-ing hens fed diets containing graded levels offlaxseed and vitamin E. Poultry Sci. 77: 1436.
Meluzzi A., Tallarico N., Sirri F. and Franchini A.1997a. Using dietary fish oil to enrich yolks withomega-3 polyunsaturated fatty acids. P. 283.11th
Europ. Symp. on Poultry Nutrition. Faaborg(Denmark) August 24-28.
Meluzzi A., Tallarico N., Sirri F. and Franchini A.1997b. Influence of hen diets supplementedwith refined fish oils on the bird productive traitsand on the cholesterol level and sensory quali-ty of the eggs. P. 45.VII Europ. Symp. on thequality of eggs and egg products. Poznan (Po-land) September 21-26.
Meluzzi A., Tallarico N., Sirri F., Franchini A. andManfreda G. 2000. Effect of vitamin supplemen-tation on functional on the quality of table eggsenriched with omega-3 long chain fatty acid.Poultry Sci. 79: 539.
Meluzzi A., Sirri F., Tallarico N. and Franchini A.2001. Effect of different vegetable lipid sourceson the fatty acid composition of egg yolk and onhen performances. Archiv Geflügelk. 65 (3):1.
SAS 1985. “SAS User’s Guide: Statistics”. SAS In-stitute Inc. Cary, NC.
Scheideler S.E. and Froning G.W. 1996. The com-bined influence of dietary flax seed variety, lev-el, form, and storage conditions on egg produc-tion and composition among vitamin E- sup-plemented hens. Poultry Sci. 75: 1221.
Scholtyssek S. 1995. Egg quality – Criticism tosome conservative and suggestions for newmethods to measure egg quality traits. ArchivGeflügelk. 59: 274.
Scholtyssek S., Maier U. and Kutritz B. 1994. Un-tersuchungen zur Bewertung der Backqualitätvon Hühnereiern. Archiv Geflügelk. 58: 213.
Surai P., Ionov I., Buzhin A. and Buzhina N. 1997.Vitamin E and egg quality. P. 387.VII Europ.Symp. on the quality of eggs and egg products.Poznan (Poland) September 21-26.
Tallarico N., Meluzzi A., Sirri F., Parpinello G.P.and Franchini A. 2001. Are the sensory andfunctional properties of n-3 PUFA enriched eggsaffected by lipid sources? P. 261 IX Europ. Sympon the Quality of Eggs and Egg Products. Ku-sadasi (Turkey) September 9-12.
Van Elswyk M.E., Hargis B.M., Williams J.D. andHargis P.S. 1994. Dietary menhaden oil con-tributes to hepatic lipidosis in laying hens. Poul-try Sci. 73: 653.
Van Elswyk M.E., Dawson P.L. and Sams A.R.1995. Dietary menhaden oil influences sensorycharacteristics and head space volatiles of shelleggs. J. Food Sci. 60: 85.
Yang S. and Baldwin R.E. 1995. Functional prop-erties of eggs in foods. In “Egg Science and Tech-nology”. Stadelman W.J. and Cotterill O.J. (Eds).Fourth Edition. Binghamton, NY.
Paper received January 2, 2002 Accepted March 12, 2002

Ital. J. Food Sci. n. 2, vol. 14 - 2002 167
SHORT COMMUNICATION
- Key words: chilling, fennel, preservation, vegetables, vitamin C -
EFFECT OF CHILLING ON THE VITAMIN CCONTENT OF FENNEL DURING STORAGE
EFFETTO DELLA FRIGOCONSERVAZIONE SUL CONTENUTOIN VITAMINA C DEL FINOCCHIO
F. GALGANO *, F. FAVATI, L. LAPELOSA, D. ALBANESE 1
and L. MONTANARI 2
Dipartimento di Biologia, Difesa e Biotecnologie Agro-Forestali, Università degliStudi della Basilicata, Campus di Macchia Romana, 85100 Potenza, Italy
1 Dipartimento di Ingegneria Chimica e Alimentare,Università degli Studi di Salerno, Via Ponte don Melillo, 84084 Fisciano, SA, Italy
2 Dipartimento di Scienza degli Alimenti, Università degli Studi di Perugia,San Costanzo, 06126 Perugia, Italy
* Corresponding author: Tel. +39 0971 205570; Fax +39 0971 205503;e-mail: [email protected]
ABSTRACT
Vitamin C content was monitoredin fennel during a 32-day storage pe-riod at 6°C and 90% R.H. and a rap-id extraction method was developedto quickly analyse the samples. Theconcentration of the vitamin showeda 50% decrease during the first 4days of storage. In the following twoweeks the amount of vitamin C re-mained almost unchanged. Extend-ing the storage time up to 32 daysresulted in further substantial loss-es, with the final vitamin C concen-tration being 25% of the initial con-centration. This phenomenon was
RIASSUNTO
È stato monitorato l’andamento delcontenuto in vitamina C in finocchi con-servati per 32 giorni, in condizioni con-trollate di temperatura e umidità (6°Ce 90% UR), valutando anche l’influen-za delle dimensioni del prodotto. Per mi-nimizzare le perdite di vitamina duran-te l’analisi, è stata messa a punto unarapida metodologia di estrazione. I datianalitici hanno evidenziato come il con-tenuto in vitamina C si riduca di circail 50% dopo i primi 4 giorni di conser-vazione. Successivamente la concentra-zione della vitamina è rimasta presso-ché costante per due settimane, ma pro-

168 Ital. J. Food Sci. n. 2, vol. 14 - 2002
found to be independent of the sizeof the sample.
lungando la conservazione fino a 32giorni si è osservata una ulteriore ri-duzione del contenuto, che ha raggiuntoun valore finale pari a circa il 25% diquello del prodotto fresco. La variazio-ne della concentrazione di vitamina Cnon è risultata essere influenzata dalledimensioni del prodotto.
INTRODUCTION
The human diet should include majoramounts of fruits and vegetables becauseof their fibre, vitamin and antioxidantcontents. Vitamin C is considered one ofthe most important antioxidants becauseof its activity against free radicals, andthe important role it plays against car-cinogenesis and cardiovascular diseas-es, as well as in stimulating the immunesystem.
The vitamin C content can differ great-ly among the numerous species and va-rieties of vegetable and fruits and canbe affected by size, ripening stage, culti-vation practices, storage conditions andpackaging techniques (AGAR et al., 1997;CANO et al., 1989; GIL et al., 1998; MAT-THEIS and FELLMAN, 1999; MYSHKIN etal., 1996; VELTMAN et al., 2000).
The shelf-life of vegetables can rangefrom a few days to several weeks. Thephysiological changes that occur duringpostharvest storage include reduced res-piration rate, flavour changes, losses ofsoluble carbohydrates, proteins andamino acids, as well as reduction of thechlorophyll and vitamin C contents.Therefore, any effort to extend the shelf-life of vegetables should also take intoaccount maintaining the original vitaminC levels in the products (AGAR et al.,1997; NICOLI et al., 1999).
Vitamin C decreases under unfavour-able storage conditions because it is verysensitive to enzymatic or chemical deg-radation. The vitamin C level could there-fore be a quality marker for monitoring
appropriate handling procedures andstorage conditions (FAVELL, 1998). Thequantitative analysis of vitamin C couldtherefore be a simple but useful tool forevaluating the quality of vegetables dur-ing storage. Of the many analytical meth-ods that have been developed to assessthe vitamin C level in edible products,high-performance liquid chromato-graphic methods have been shown to beselective and sensitive (GRAHAM andANNETTE, 1992).
Fennel (Foeniculum vulgare) is a plantnative to Italy and is usually harvestedfrom November through June. It is widelyused in the Italian diet, especially in thesouthern regions. Italy is the number oneproducer of fennel in the world and theregion of Basilicata ranks seventh amongthe Italian fennel-producing regions.While fennel is scarcely used in the foodprocessing industry, it is marketed inlarge amounts as a fresh product, beingappreciated by consumers for its flavour,low caloric content and its nutritionaland digestive properties. The naturalshelf-life of fennel is limited to a few days,due to its very high respiratory activity,thus in order to extend the marketingtime, it must be refrigerated.
There are few scientific studies deal-ing with the evaluation of fennel qualityduring storage (SOZZI and ILARDI, 1992;MENCARELLI et al., 1997). The objectiveof this work was to evaluate the qualityloss of fresh fennel during refrigerationunder controlled humidity and temper-ature (90% R.H. and 6°C) conditions,over an extended period of time, using

Ital. J. Food Sci. n. 2, vol. 14 - 2002 169
vitamin C as a marker; the influence ofthe size of the sample was also consid-ered. Furthermore, in order to minimisevitamin losses during the analyses, arapid extraction methodology for thismoiety was developed.
MATERIALS AND METHODS
Sample preparationand vitamin C extraction
The study was conducted using fen-nel of the cultivar “Tardivo di Siracusa”harvested in the period from May to June2000 and provided by the “Ancona” farmin Policoro (Matera). The fennels wereimmediately washed, trimmed andcooled in potable water before beingpacked in wooden boxes. Within 2 hoursthe samples were transported to the lab-oratory and immediately stored in a con-trolled temperature (6±1°C) and humid-ity (90±5% R.H.) chamber.
In order to evaluate any possible in-fluence of the size of the sample on vi-tamin C degradation, the fennels weredivided into two classes of 24 fennelseach. Class A consisted of samples hav-ing an average weight of 285 g and classB of 486 g. Each class was then dividedinto 6 groups of 4 fennels each that wereused to assess the degradation of vita-min C after 0, 2, 4, 8, 16 and 32 days ofstorage under the experimental condi-tions.
For the extraction of ascorbic acid fromfruits and vegetables, DE SIO et al.(2000) proposed a simple methodology,in which the vegetable tissues are firstchopped in a blender. An aliquot of thesample (10 g) is then brought up to 100mL using a buffer solution (200 mMNaH2PO4, acidified to pH 2.14 with 1NHCl), which is then used as a mobilephase in the subsequent analytical step.Due to the high fibre content of fennel,the above procedure could not be usedas such, but was partially modified. The
homogenising procedure involved twosteps: each fennel was sliced and about20 g of material were chopped in a Ster-ilmixer homogeniser (PBI International,Milan, Italy) for 10 sec at 16,500 rpm;the chopped tissues were then homoge-nised using an Ultraturrax homogenis-er (Model T25 Janke & KunkelLabortechnick, Staufen, Germany) for 30sec at 24,000 rpm. In order to preventvitamin C degradation, and to reducedehydroascorbic acid to ascorbic acid,potassium metabisulphite (0.2% byweight) was first added to the fennels,which were kept in ice during homoge-nisation. The procedure was conductedunder dim light and all the glassware waswrapped in aluminium foil to shield theproduct from light.
About 1 g of the sample was thentransferred to a 10 mL amber volumet-ric flask and brought up to volume us-ing a solution of 20 mM NaH2PO4 acidi-fied to pH 2.14 with 1N HCl. The flaskwas then stirred five times for 5 sec eachusing a Vortex; the solution was allowedto rest for 1 min in the dark between eachstirring. The extract was then filteredthrough a 0.2 (µm cellulose acetate filter(Alltech, Milan, Italy) and stored in thedark at -20°C in an amber vial, undernitrogen, until analysed. Compared tothe method of DE SIO et al. (2000), thebuffer solution was used at a concen-tration of 20 mM instead of 200 mM,because at the higher concentration theascorbic acid peak eluted at progressive-ly longer retention times, which thenrequired a long reconditioning of the col-umn before each analysis. This problemwas solved by using the more dilute buff-er.
Reagents
All the chemicals were of suitable an-alytical grade and purchased from Car-lo Erba (Milan, Italy). The ascorbic acidstandard (>99% purity) was obtainedfrom Fluka (Milan, Italy).

170 Ital. J. Food Sci. n. 2, vol. 14 - 2002
Ascorbic acid analysis
The HPLC chromatographic systemconsisted of a Varian 9012 pump, a Var-ian 9050 UV/VIS detector and a per-sonal computer running the chromato-graphic software STAR 4.5 (Varian, Lei-ni, Italy). The analytical method was aslight modification of that proposed byDE SIO et al. (2000). An aliquot of theextracted sample (20 µL) was injectedonto a C18 Aqua column (5 µm, 250 x4.6 mm, Phenomenex, Torrance, CA)with an Aqua C18 guard column (4x3mm ID). The separation was carried outat 240 nm by isocratic elution with 20mM NaH2PO4 acidified to pH 2.14 with1N HCl (flow-rate 1 mL/min). The mo-bile phase acidification was required toreduce the rapid oxidation of the ascor-bic acid. Each sample was prepared andanalysed in duplicate. The chromato-graphic separation of the vitamin C ex-
tracted from a fennel sample is shownin Fig. 1. Quantitative determination ofthe total vitamin content in the sampleswas determined using the externalstandard method. From a stock solutionof ascorbic acid (about 40 µg/mL) in 20mM NaH2PO4, acidified to pH 2.14 with1N HCl, five different working solutionswere prepared (1/5, 1/10, 1/50, 1/100,1/200) and used to build the calibrationcurve. The linearity of the detector re-sponse was checked over a concentra-tion range from 0.2 to 40 µg/mL(r2>0.999); the lowest detectable amount(42 ng/mL) was determined as theamount of standard required to give asignal-to-noise ratio of 3, while the quan-tification limit was considered to be threetimes the detection limit. The ascorbicacid analysis time was 4.9 min while thetotal analysis time was 20 min to allowcomplete elution of the co-extracted com-pounds.
Fig. 1 - Chromatographic separation of vitamin C in a fennel sample.

Ital. J. Food Sci. n. 2, vol. 14 - 2002 171
Statistical analysis
The data were elaborated using thestatistical package Statistica for Win-dows (Statsoft Inc., USA).
RESULTS AND DISCUSSION
Refrigeration is the most commonlyused technique for slowing down deteri-oration and hence the loss of quality infresh vegetables. However, also with re-frigeration the vitamin and antioxidantcontents may undergo a significant re-duction (ESTEVE et al., 1995).
Different refrigeration temperatureshave been suggested for postharveststorage of fennel. MENCARELLI et al.(1997), indicated that 0°C was the mostsuitable temperature, while SOZZI andILARDI (1992) found that storage at 0°Cdid not give better results than storageat 6°C. In addition, it has been reportedthat slightly higher temperatures asso-ciated with high R.H. levels, have a pos-itive effect on vitamin C retention in sev-eral fruits and vegetables (NUNES et al.,1998). For this reason the tests wereconducted at 6°C.
The only available data concerningvitamin C content in fennel indicate thatit is present at very low concentrations(120 µg/g of fresh weight) (INN, 1997).Therefore, in order to measure any possi-ble loss of vitamin C during storage, arapid extraction procedure and a sensi-tive analytical method were needed.
In order to optimise the vitamin C ex-traction, several tests were carried out.Initially the extraction procedure pro-posed for fruits and vegetables by DE SIOet al. (2000) was tested, but the simpleuse of a blender to break up the sam-ples was not effective, due to their highfibre content. An adequate mechanicalrupturing of the tissues was achievedwith a two-step homogenising procedure,reported in the Materials and Methodssection. As proposed by DE SIO et al.
(2000), an aliquot of the homogenisedsample was then brought up to volumeimmediately prior to the analysis, usinga buffer solution, which was also usedas mobile phase in the following analyt-ical step. With this procedure, a mini-mal amount of vitamin C was recovered,with calculated concentrations in thesample of less than one third of that re-ported in the literature for fennel (120µg/g) (INN, 1997). Therefore the influenceof different times of contact between thevegetable tissues and the buffer solutionwas investigated.
Total contact times of 2, 5 and 10 minwere tested. In order to enhance the ex-traction process, the samples werestirred for 5 sec every minute. The addi-tion of a static extraction step increasedthe vitamin C recovery, which was max-imised for a total extraction time of 5 min.An additional 10 min of contact timebetween the broken up tissues and theextracting solution did not substantial-ly increase the vitamin C recovery.
Because of the longer exposure to theoxidising agents, due to the longer timeof manipulation of the vegetable matrix,the addition of metabisulphite, an anti-oxidant, at three different concentrationswas studied (0.2, 0.5 and 1.0% byweight). The results showed that a 0.2%concentration was sufficient to protectthe vitamin C; however, operating at lowtemperatures and in dim light were alsocritical in order to avoid any vitamin Cdegradation.
The reproducibility of the extractionprocedure was tested by making 10 ex-tractions on the same sample at 0 daysof storage. The results showed that theextraction method had a good reproduc-ibility, with a mean vitamin C content of76.86±2.60 µg/g, and a relative stand-ard deviation of 3.38%.
In order to assess the influence of thevarious extraction steps on vitamin Crecovery, a fresh fennel, at 0 days of stor-age, was sliced and divided into severalportions. Some were treated as such,

172 Ital. J. Food Sci. n. 2, vol. 14 - 2002
according to the proposed procedure,while others were spiked with knownamounts of ascorbic acid prior to thehomogenising step, or prior to the ex-traction step. Blank extraction tests werealso conducted by spiking pure waterwith the standard and simulating thewhole extraction procedure, includingthe homogenising step.
The amounts of ascorbic acid addedvaried according to the extraction step atwhich time the standard was added, butthe amounts were such that the finalstandard concentration in the extractsranged from 0.3 to 30 ng/mL. The natu-ral vitamin C content of the spiked sam-ple was 76 µg/g, and the statistical anal-ysis of the data indicated that the recov-eries were above 98% in all cases, andthat during the homogenising procedurethere was a negligible loss of vitamin C.
The vitamin C content of the fennelsamples was monitored over a 32-dayperiod of storage at 6°C and 90% R.H..In Table 1 the vitamin C contents arereported for class A and class B fennelsas a function of storage time. In all thesamples the vitamin C content decreasedsharply in just a few days; after only 4days of storage the vitamin C concen-tration was about 50% of the initial con-centration. Similar results have beenreported in the literature for other vege-tables, such as green beans and spin-
ach stored under refrigerated conditions(FAVELL, 1998). No significant changesin the vitamin C level were observed dur-ing the following 2-week period. Howev-er, when the storage time was extendedto 32 days, a further loss was recorded,with the final vitamin C content of fen-nel being 25% of the initial value.
Variations in the vitamin C content invegetables have been reported to be de-pendent on the size of the vegetables (LEEet al., 1976); however, statistical analy-sis (t-Student test) of the data showed thatthe size of the sample did not significant-ly affect the amount of vitamin C in thefennel, over the entire storage period.
CONCLUSIONS
This study has shown that the first 4days are the most critical for vitamin Closs in fennel stored at 6°C and 90% R.H.The vitamin C concentration was re-duced by about half the initial amountafter only 4 days, while the concentra-tion remained almost unchanged for thenext 12 days of storage. Because reduc-tion in vitamin C is strictly related to thepresence of oxygen, the use of systemsthat can reduce or modify the gaseousexchange between the product and theatmosphere could help to limit vitaminC losses.
Table 1 - Mean values of vitamin C content in class A and class B fennels at different storage times.
Storage time Vitamin C (mg/kg fennel) Level of significance(days) Class A Class B
0 78.07±5.64 74.65±8.74 n.s.2 54.98±3.39 55.26±4.73 n.s.4 35.80±7.09 38.33±9.11 n.s.8 41.62±6.95 37.48±4.23 n.s.
16 39.17±6.43 37.73±5.21 n.s.32 15.51±3.15 14.20±1.71 n.s.
Each value is the mean of 4 determinations + standard deviation.n.s. = not significant: p<0.01.

Ital. J. Food Sci. n. 2, vol. 14 - 2002 173
ACKNOWLEDGEMENTS
This study was financed by the Italian GovernmentMURST – “Progetto giovani ricercatori”. Theauthors would like to thank the Ancona farmfor supplying the samples.
REFERENCES
Agar I.T., Streif J. and Bangerth F. 1997. Effect ofhigh CO2 and controlled atmosphere (CA) on theascorbic and dehydrovitamin C content of someberry fruits. Postharvest Biol. Technol. 11: 47.
Cano M.P., De la Plaza J.L. and Muñoz-DelgradoL. 1989. Effects of several postharvest fungi-cide treatments on the quality and ripeness ofcold-stored apples. J. Agric. Food. Chem. 37:330.
De Sio F., Grimaldi M. and Loiudice R. 2000. In-troduzione all’HPLC e metodi analitici per ali-menti vegetali. Edizioni Centrostampa, Matera,Italy.
Esteve M.J., Farré R. and Frígola A. 1995. Chang-es in vitamin C content of green asparagus dur-ing the harvesting period and storage. J. Agric.Food. Chem. 43: 2058.
Favell D.J. 1998. A comparison of the vitamin Ccontent of fresh and frozen vegetables. FoodChem. 62: 59.
Gil M.I., Ferreres F. and Tomás-Barberán F.A.1998. Effect of modified atmosphere packagingon the flavonoids and vitamin C content of min-imally processed Swiss chard (Beta vulgaris sub-species cycla). J. Agric. Food. Chem. 46: 2007.
Graham W.D. and Annette D. 1992. Determina-tion of ascorbic and dehydrovitamin C in pota-toes (Solanum tuberosum) and strawberries us-
ing ion-exclusion chromatography. J. Chromat.594: 187.
INN – Istituto Nazionale della Nutrizione 1997.Tabelle di composizione degli alimenti. Roma:Istituto Nazionale della Nutrizione.
Lee C.Y., Dowing D.L., Iredale H.D. and ChapmanJ.A. 1976. The variations of vitamin C contentin vegetable processing. Food. Chem. 1: 15.
Mattheis J.P. and Fellman J.K. 1999. Preharvestfactors influencing flavour of fresh fruit andvegetables. Postharvest Biol. Technol. 15: 227.
Mencarelli F., Massantini R. and Garosi F. 1997.Aspetti fisiologici della post-raccolta del finoc-chio fresco. In “Atti delle Giornate di Studio sullaColtivazione del Finocchio” – Tarquinia 29-30Marzo 1996 (p. 131). Società Orticola Italiana.Comune di Tarquinia (Lazio, Italy).
Myshkin A.E., Konyaeva V.S., Gumargalieva K.Z.and Moiseev Y.V. 1996. Oxidation of vitamin Cin the presence of nitrites. J. Agric. Food Chem.44: 2948.
Nicoli M.C., Anese M. and Parpinel M. 1999. Influ-ence of processing on the antioxidant proper-ties of fruit and vegetables. Trends Food Sci.Technol. 10: 94.
Nunes M.C.N., Brecht G.K., Morais A.M.M.B. andSargent S.A. 1998. Controlling temperature andwater loss to maintain vitamin C levels in straw-berry during postharvest handling. J. Food Sci.63: 1033.
Sozzi A. and Ilardi V. 1992. Conservazione con filmmicroforato e prerefrigerazione con vacuum delfinocchio. Colture protette 4: 73.
Veltman R.H., Kho R.M., Van Schaik A.C.R., Sand-ers M.G. and Oosterhaven J. 2000. Vitamin Cand tissue browning in pears (Pyrus communisL. cvs Rocha and Conference) under controlledatmosphere conditions. Postharvest Biol. Tech-nol. 19: 129.
Revised paper received January 24, 2002 Accepted March 5, 2002

174 Ital. J. Food Sci. n. 2, vol. 14 - 2002

Ital. J. Food Sci. n. 2, vol. 14 - 2002 175
SHORT COMMUNICATION
- Key words: enantiomeric distribution, ethyl lactate, MLF, tannat wine -
AROMA VARIATION IN TANNAT WINES:EFFECT OF MALOLACTIC FERMENTATION
ON ETHYL LACTATE LEVELAND ITS ENANTIOMERIC DISTRIBUTION
VARIAZIONE NELL’AROMA DEI VINI TANNAT: EFFETTODELLA FERMENTAZIONE MALOLATTICA SUL TENORE IN LATTATO
DI ETILE E SULLA SUA DISTRIBUZIONE ENANTIOMERICA
A. LLORET, E. BOIDO, D. LORENZO, K. MEDINA, F. CARRAU,E. DELLACASSA* and G. VERSINI1
Facultad de Química, Cátedra de Farmacognosia y Productos Naturalesy Sección Enología, Universidad de la República, 11800 Montevideo, Uruguay
1 Dipartimento Laboratorio Analisi e Ricerche, Centro Sperimentale,Istituto Agrario di San Michele all’Adige, 38010 San Michele all’Adige, Italy
*Corresponding author: Tel. +598-2-9244068 - Fax +598-2-9241906 -e-mail: [email protected]
ABSTRACT
The chirality of ethyl lactate was eval-uated in an attempt to explain possiblescents present in Tannat wines. Wineswithout malolactic fermentation (MLF)(ethyl lactate values from 5 to 8 mg/L)had a 69% enantiomeric excess of (R)-ethyl lactate, while with MLF (ethyl lac-tate values from 90 to 150 mg/L), thisvalue decreased to 22-28%, dependingon the inoculant strain. The (S)-ethyllactate concentration increased signif-icantly after MLF (65-130 mg/L) com-
RIASSUNTO
Si è indagata la chiralità del lattatodi etile per rendere ragione della pre-senza di possibili particolari sentorinell’aroma dei vini tannat. I vini senzafermentazione malolattica (FML), aventivalori di lattato di etile da 5 a 8 mg/L,hanno mostrato un eccesso della for-ma enantiomerica (R)-lattato di etile del69%, mentre dopo FML – con valori dilattato di etile da 90 a 150 mg/L – que-sto valore era diminuito al 22-28% se-condo il ceppo. La concentrazione del
176 Ital. J. Food Sci. n. 2, vol. 14 - 2002
pared with the non-MLF control wine(1.5-2.5 mg/L). The aromatic impact ofthe (S)-enantiomer was confirmed bydetermining its aroma threshold in wine(110 mg/L).
(S)-lattato di etile dopo FML è aumen-tata in modo significativo (65-130 mg/L) in rapporto al vino di controllo, sen-za FML, che aveva concentrazioni di1,5-2,5 mg/L. L’impatto sull’aroma del-l’enantiomero (S) è stato confermatoindividuando in 110 mg/L la sua so-glia di percezione.
INTRODUCTION
During growth in wine, lactic acid bac-teria (LAB) metabolise L-(-)-malic acid,forming L-(+)-lactic acid [(S)-(+)-lactic acid]and CO2 (for a review, see HENNICK-KLING,1993). Both D- and L-lactic acid enanti-omers [(R)-(-)- and (S)-(+)-enantiomers] areproduced in small quantities – not morethan 0.2-0.3 g/L each – during a “cor-rect” alcoholic fermentation. the (R)-(-)isomer is produced as a metabolite ofsugar fermentation by yeast, while the (S)-(+) form is produced from sugar by somebacteria. A concentration of the (S)-(+)form higher than 0.5 g/L indicates ananomalous fermentation pathway (BAN-DION and VALENTA, 1977). This pathway,called malolactic fermentation (MLF), isan essential part of winemaking that usu-ally occurs after alcoholic fermentationand is used as a deacidification and acid-taste modifying technique. MLF is alsonecessary for developing body (mouth-feel), complex aromas and balanced fla-vours in red wines, some white wines andsome base wines for premium sparklingwine (BERTUCCIOLI and MONTEDORO,1981; BARTOWSKY and HENSCHKE, 1995;MCDANIEL et al., 1987).
Studies carried out with Pinot noir andChardonnay wines, with and withoutMLF, have shown flavor differences asdetermined by descriptive analysis tech-niques (SAUVAGEOT and VIVIER, 1997;LAURENT et al., 1994; RODRIGUEZ et al.,1990). These differences could be par-tially due to diacetyl formation and the
reduction of acetates with increased lev-els of short-chain aliphatic aldehydesand acids (DITTRICH, 1987).
Ethyl lactate, an important aromacompound produced during MLF, is of-ten found in concentrations exceedingits taste threshold of 60-110 mg/L (DIT-TRICH, 1987), which apparently gives a“broader”, “fuller” taste to the wine (HEN-NICK-KLING, 1993). The aroma descrip-tor defines ethyl lactate as sweet, fruity,resembling pineapple with candy brownnuance (MOSCIANO et al., 1993). Sinceethyl lactate is also a by-product of yeastfermentation, its presence can indicatesome yeast strain activity in the wine,e.g. Saccharomyces cerevisiae r.f. uvar-um, a high ethyl lactate producer (CIOLFIand DI STEFANO, 1983).
Whereas (R)-ethyl lactate has beencharacterized as a genuine chiral com-pound of wine, whose presence is due toyeast fermentation, the corresponding(S)-enantiomer is reported to be an indi-cator of MLF or LAB contamination(KAUNZINGER et al., 1996).
Tannat wine is a red wine made froma grape variety that originated in south-ern France, but is almost unknown to-day in Europe. Uruguay is the only coun-try in the Americas where this grape iscommonly found, and the Uruguayanwine industry has developed a strategyto produce Tannat wine using state-of-the-art viticultural technology (CARRAU,1997). GÁMBARO et al. (2001) reportedthat MLF strongly affects the aroma pro-file of red wines and that Tannat wine

Ital. J. Food Sci. n. 2, vol. 14 - 2002 177
had a greater aroma complexity afterMLF.
The aim of the present work was tostudy ethyl lactate chirality in order togain some insights about the scents thatare characteristic of Tannat wines andto better understand the effect that MLFhas on red wine sensory characteristicsin complement to the chemical aromacomposition of this wine (BOIDO et al.,1998, 1999; VERSINI et al., 1999).
MATERIALS AND METHODS
Sample preparation
Ten batches of 20 kg each of Vitisvinifera Tannat grapes from differentclones and vineyards were microvini-fied by traditional maceration duringthe 1999 vintage. All ten grape sampleswere destemmed and crushed; SO2 wasadded at 5 g/hL and then each batch wasinoculated with Saccharomyces cerevisiaestrain CIVC 8130 (Gist Brocades, San-tiago, Chile). The samples were allowedto ferment with the skins (vinification withmaceration). Fermentation was carriedout at 22°-25°C. At a density of 1,000 g/L, the wine was run off from the fermen-tor, pomace was pressed, and pressedwine was added to runoff wine. After thealcoholic fermentation was completed,each sample was divided into three equalportions. Two portions were taken for MLFby inoculation, in duplicate, with two dif-ferent pure cultures of Oenoccocus oenistrains, strain DSM 7008 (Viniflora, Chr.Hansen’s, Denmark), and strain D-11(Malolactine O, Groupe Oeno-France,France). The third portion was not inoc-ulated and served as the control. All thesamples were held at 18°C and MLF wasfollowed by determining the malic andlactic acid contents using TLC (BOIDO etal., 1999). When MLF was completed,wines were sulfited with 50 mg/L SO2,stabilized at 4°C for 20 days and sterile-filtered (0.45 µm membrane); the free SO2
content was then adjusted to 40 mg/L.After bottling, the wines were stored at10°C until analyzed.
Isolation of ethyl lactate
Ethyl lactate was isolated using anIsolute (IST Ltd, Mid Glamorgan, UK)ENV+ cartridge packed with 1 g of high-ly cross-linked SDVB (styrene divinylbenzene) polymer (40-140 µm, cod. n.915-0100-C) as previously reported(CARLIN, 1998). Ethyl lactate was elutedtogether with the free aroma compoundsfrom 50 mL of wine using dichlorometh-ane. The extract was then anhydrifiedwith Na2SO4, concentrated to 0.3 mL andused for GC and GC-MS analysis.
Sensory experiments
Pure (S)-ethyl lactate was from Aldrich(98%, Aldrich E3, 410-2, USA) and theracemate form was synthesized from lac-tic acid (85%, Aldrich W261106, USA)and ethanol in sulphuric media. Enan-tiomeric ratios were verified by multidi-mensional gas chromatography usingchiral stationary phases as describedbelow. The pure enantiomeric (S)-ethyllactate and the synthesized racematewere added to a water/ethanol mixture(90 + 10, v/v) at concentrations equal tothose determined in Tannat wine afterMLF (90-120 mg/L). After stirring for 30min, the model mixtures were comparedby assessors who evaluated the aromaattributes of each component by smell.Sensitivity odor threshold values for the(S)-ethyl lactate were determined by us-ing the triangle test (GUTH, 1997) inwhich a wine sample without MLF servedas a blank. The samples were presentedin the order of increasing (S)-ethyl lac-tate concentrations (50, 80, 110, 140,170 mg/L) to individual panel members(six trained judges) for assessment ofpossible odor differences. The wines werepresented in individual testing boothswith “normal daylight” illumination.

178 Ital. J. Food Sci. n. 2, vol. 14 - 2002
Samples (60 mL) were served at 20±1°Cin approximately 250 mL, clear, tulip-shaped wine glasses (ISO 3591, 1977)covered with a watch glass and identi-fied with two digit random codes.
Identification and quantification
HRGC-FID and HRGC-MS or SIM/MSinstrumental procedures, using an in-ternal standard (1-heptanol), were ap-plied as previously described (BOIDO etal., 1999; VERSINI et al., 1999). The aro-ma compounds were identified by com-paring their Linear Retention Indices,determined in relation to a homologousseries of n-alkanes, with those from purestandards or those reported in the liter-ature. Fragmentation patterns in themass spectra were also compared withthose stored on databases (ADAMS, 1995;MCLAFFERTY and STAUFFER, 1991).
Enantioselective analysis
Enantiomeric ratios of ethyl lactatewere obtained by multidimensional gaschromatography, using a developmentalmodel (MONDELLO et al., 1998) set up withtwo GC ovens. The first was equipped witha bonded fused-silica capillary column
coated with BP 20 (SGE, Australia) (25 mx 0.25 mm i.d.) and the second with achiral fused-silica capillary column (25m x 0.25 mm i.d., 0.25 µm phase thick-ness), coated with 2,3-di-O-ethyl 6-O-t-butyldimethylsilil-b-cyclodextrin in PS086 (13% phenylmethyl-polysiloxane)(Mega, Legnano, Italy), a hot interface, arotary switching valve and a system formaintaining a constant flow during thetransfer. With this system a heart-cut ofthe relevant fractions was made and thesewere fractions were transferred from thenon-chiral column to the chiral one un-der previously described experimentalconditions (LOAYZA et al., 1999).
RESULTS AND CONCLUSIONS
The results obtained in the analysisof ethyl lactate reported in Table 1 showthat the ethyl lactate values were fifteento twenty times higher after MLF in allthe Tannat wine samples analysed. Thewines that did not undergo MLF (5-8 mg/L for ethyl lactate and 3-4 g/L for malicacid) had a 69% enantiomeric excess of(R)-ethyl lactate, while the wines pro-duced with MLF (90-150 mg/L of ethyllactate) had an enantiomeric excess of
Table 1 - Changes in the chemical composition of Tannat wines in response to malolactic fermentation(MLF).
Samples without Samples with MLF Samples with MLFMLF a DMS 7008 strain a D-11 strain a
Malic acid (g/L) 3.73±0.29 ndb ndb
Lactic acid (g/L) 0.77±0.35 3.31± 0.43 3.16± 0.51Ethyl lactate (mg/L) 6.30±3.48 a 99.08±36.72 b 144.08±39.26 c(S)- (mg/L) 1.96±1.95 a 71.79±29.29 b 111.78±18.15 c(R)- (mg/L) 4.34±1.77 a 27.29±12.92 b 32.30±22.94 bEthyl esters c (mg/L) 0.73±0.15 b 0.51± 0.09 a 0.42± 0.09 aAcetates d (mg/L) 1.96±0.37 b 1.22± 0.37 a 2.22± 0.36 b
a each value is the mean concentration (± standard deviation) of ten samples; letters in italics indicate differencesaccording to Tuckey’s test (95%);b not detected;c sum of ethyl hexanoate, ethyl octanoate and ethyl decanoate;d sum of isobutyl acetate, isoamyl acetate, hexyl acetate and 2-phenyl ethyl acetate.

Ital. J. Food Sci. n. 2, vol. 14 - 2002 179
22-28% depending on the O. oeni strainused. In addition, the sensory contribu-tion of (S)-ethyl lactate after MLF (72%enantiomeric excess for the DMS 7008strain and 112% for the D-11 strain) wasreinforced by a significant increase in itsconcentration (65-130 mg/L, p ≤ 0.01)when compared with the control (1.5-2.5mg/L). The values increased further dur-ing ageing, which is in agreement withprevious results published in the litera-ture for other varieties (VERSINI and MAR-GHERI, 1981; PEREZ-COELLO et al.,1999).
In Tannat wine, a variety withoutstrong spicy or floral characteristics, thecontribution of MLF to the wine flavouris easily recognised. In a triangle tastetest, malolactic Tannat wines were dis-tinguished from non-malolactic Tannatwines at the p ≤ 0.001 level (GÁMBAROet al., 2001). GC-MS analysis of Tannatwine aroma showed that some fruity aro-ma-active substances, such as estersand acetates, were lost during MLF(BOIDO et al., 1999), while a more com-plete aroma was developed. In particu-lar, the sum of ethyl esters decreasedfrom 0.73 mg/L before MLF to 0.42-0.51mg/L after MLF, while the correspond-ing variation for the acetates was onlysignificant for the DMS 7008 strain, withvalues changing from 1.96 to 1.22 mg/L(Table 1). The sensory tests showed thatthe intensity of the fresh red fruit char-acteristics were reduced by MLF, whiledry fig and quince notes were enhanced(GAMBARO et al., 2001).
The results of the olfactory compari-son using alcoholic solutions of the pure(S)- enantiomer and the synthesizedracemate, indicated that the (S)-enanti-omer had a fruitier, more acidic andplum-like aroma. The impact of thisenantiomer on the aromatic quality andintensity of the Tannat wine, as a con-sequence of MLF, was confirmed by thearoma threshold value (110 mg/L, p ≤0.05). This value, which corresponds tothat reported in the literature for the
racemic form of ethyl lactate, was exceed-ed in many samples, particularly in thosefrom the D-11 strain.
In conclusion, the higher ethyl lactatelevel, particularly the (S)-enantiomer af-ter MLF, could explain, at least in part,the changes that occur in the fruity char-acter of Tannat wine aroma as demon-strated through sensory analysis (GÁM-BARO et al., 2001). These changes couldcontribute to the increase of some fruitcharacteristics, like plum and dry fruitnotes that develop during ageing of Tan-nat wine (BOIDO et al., 1999).
ACKNOWLEDGEMENTS
The authors wish to thank the Instituto Nacionalde Investigaciones Agropecuarias (INIA, grantn. 125) and the Consejo Nacional de Investi-gación Científica y Tecnlógica (CONICYT nº5058) for financial support which made theirwork possible. The assistance of Dr. M. Galli(Mega, Legnano, Italy) is also kindly thankedfor his assistance.
REFERENCES
Adams R.P. (Ed.). 1995. “Identification of essentialoils by gas chromatography/mass spectrosco-py”. Allured Publ. Corp., Carol Stream, IL.
Bandion F. and Valenta M. 1977. Zur Beurteilungdes D(-) und L(+)-Milchsäuregehaltes in Wein.Mitt Klosterneuburg 27: 4.
Bartowsky E.J. and Henschke P.A. 1995. Malolac-tic fermentation and wine flavour. Aust. Grape-grower and Winemaker (Tech. Issue) 378: 83.
Bertuccioli M. and Montedoro G.F. 1981. Impiegodel Trebbiano come vino base da spumante:esame di alcuni costituenti connessi con le ca-ratteristiche organolettiche. In “Simposio Inter-nazionale sui Vini Spumanti”. p. 64. Salice Ter-me (PV), Chiriotti (ed.), Torino.
Boido E., Carrau F., Dellacassa E., Lloret A., Me-dina K. and Versini G. 1998. Resultados pre-liminares del estudio del perfil aromático devinos Tannat, y su modificación por la ferment-ación maloláctica. Panorama vitivinicola 7: 42.
Boido E., Dellacassa E., Carrau F. and Moyna P.1999. An improved means of monitoring malol-actic fermentation in wines by TLC-densitome-try. J. Planar Chromatogr. 12: 269.
Boido E., Carrau F., Dellacassa E., Lloret A., Me-dina K. and Versini G. 1999. Modificaciones

180 Ital. J. Food Sci. n. 2, vol. 14 - 2002
producidas por la fermentación maloláctica enla composición aromática de las fracciones li-bre y ligada para la variedad Tannat. p. 119.VII Congreso Latinoamericano de Viticultura yEnología, Mendoza, Argentina.
Carlin S. 1998. Metodi di arricchimento di compo-sti dell’aroma per una possibile tipicizzazionedi vini Traminer. Thesis, Faculty of Agronomy,University of Udine, Udine.
Carrau F. 1997. The emergence of a new uruguay-an wine industry. J. Wine Res. 8: 179.
Ciolfi G. and Di Stefano R. 1983. I composti volati-li ceduti dai lieviti durante la fermentazione:confronto fra stipiti della stessa specie e di spe-cie diverse. Vignevini 10: 43.
Dittrich H.H. 1987. “Mikrobiologie des Weines”.Ulmer. Stuttgart.
Gámbaro A., Boido E., Zlotejablko A., Medina K.,Lloret A., Dellacassa E. and Carrau F. 2001.Effect of malolactic fermentation on the aromaproperties of Tannat wine. Austr. J. Grape WineRes. 7: 27.
Guth H. 1997. Quantitation and sensory studiesof character impact odorants of different whitewine varieties. J. Agric. Food Chem. 45: 3027.
Hennick-Kling T. 1993. Malolactic fermentation.In “Wine microbiology and biotechnology”. G.H. Fleet (ed.), p. 289. Harwood Academic Publ.,Switzerland.
ISO 3591. 1977. Sensory analysis. Apparatus.Wine-tasting glass. International Organizationfor Standardization, Geneve, Switzerland.
Kaunzinger A., Wüst M., Gröbmiller H., Burow S.,Hemmrich U., Dietrich A., Beck T., Hener U.,Mosandl A. and Rapp A. 1996. Enantiomericdistribution of ethyl lactate-a new criterion forquality assurance of wine. Z. Lebensm. Unters.Forsch. 203: 499.
Laurent M.H., Henick-Kling T. and Acree T.E. 1994.Changes in the aroma and odor of Chardonnaywine due to malolactic fermentation. Fermen-tation Vitic. Enol. Sci. 49: 3.
Loayza I., De Groot W., Lorenzo D., DellacassaE., Mondello L. and Dugo G. 1999. Composi-
tion of the Essential Oil of Porophyllum rude-rale (Jacq.) Cass. from Bolivia. Flavour Fragr.J. 14: 393.
McDaniel M., Henderson L.A., Barney T., WatsonJ.R. and Heatherbell D. 1987. Sensory paneltraining and screening for descriptive analysisof aroma of pinot noir wine fermented by sever-al strains of malolactic bacteria. J. Sens. Stud-ies 2: 149.
McLafferty F.W. and Stauffer D.B. (Eds.). 1991.“The Wiley/NBS registry of mass spectral data”.5th ed. Wiley and Sons, NY.
Mondello L., Catalfamo M., Dugo P. and Dugo G.1998. Multidimensional tandem capillary gaschromatography system for the analysis of realcomplex samples. Part I. Development of a fullyautomated tandem gas chromatography system.J. Chromatogr. Sci. 36: 201.
Mosciano G., Fasano M., Cassidy J., Connelly K.,Mazeiko P., Montenegro A., Michalski J. andSadural S. 1993. Organoleptic characteristicsof flavor materials. Perfumer-Flavorist 18: 51.
Pérez-Coello M.S., Matín-Alvarez P.J. and Cabez-udo M.D. 1999. Prediction of the storage timein bottles of Spanish white wines using multi-variate statistical analysis. Z. Lebensm. UntersForsch. 208: 408.
Rodriguez S.B., Amberg E. and Thornton R.J. 1990.Malolactic fermentation in Chardonnay: growthand sensory effects of commercial strains of Leu-conostoc oenos. J. App. Bacteriology 68: 139.
Sauvageot F. and Vivier P. 1997. Effects of malol-actic fermentation on sensory properties of fourBurgundy wines. Am. J. Enol. Vitic. 48: 187.
Versini G., Margheri G. 1981. Evoluzione di com-positi volatili nel corso della elaborazione delvino spumanti del Trentino. In “Simposio In-ternazionale sui Vini Spumanti”. p. 64. SaliceTerme (PV), Chiriotti (ed.), Torino.
Versini G., Carlin S., Nicolini G., Dellacassa E. andCarrau F. 1999. Updating of varietal aroma com-ponents in wines. p. 325. VII Congreso Latinoa-mericano de Viticultura y Enología, Mendoza,Argentina.
Paper received July 6, 2001 Accepted November 30, 2001

Ital. J. Food Sci. n. 2, vol. 14 - 2002 181
SHORT COMMUNICATION
- Key words: E. coli O157:H7, fermented sausage, verocytoxicity -
SURVIVAL OF ESCHERICHIA COLI O157:H7IN A SHORT RIPENED
FERMENTED SAUSAGE
SOPRAVVIVENZA DI ESCHERICHIA COLI O157:H7 IN UN INSACCATOA BREVE STAGIONATURA
G. NORMANNO*, A. DAMBROSIO, A. PARISI1, N.C. QUAGLIA,L. LAPORTA and G. CELANO
Dipartimento di Sanità e Benessere Animale, Settore Ispezione degli Alimenti,Università degli Studi di Bari, Str. Prov. per Casamassima km 3,
70010 Valenzano (BA), Italy1 Istituto Zooprofilattico Sperimentale della Puglia e Basilicata,
Sez. Putignano (BA), Italy*Corresponding author: Tel. +39 080 4679895 - Fax +39 080 4679854 -
e-mail: [email protected]
ABSTRACT
The survival and toxinogenic prop-erties of a strain of E. coli O157:H7 wereevaluated in a typical fermented sau-sage during ripening. It was found thatE. coli O157:H7 declined progressivelyover time even though it was still de-tected at the end of the ripening proc-ess. It maintained its ability to produceverocytotoxins until the end of the rip-ening process.
RIASSUNTO
In questo lavoro è stata valutata lasopravvivenza e la capacità di produr-re verocitotossine di un ceppo di E. coliO157:H7 in un tipico insaccato duran-te la stagionatura. Gli Autori hanno ri-levato una progressiva riduzione di E.coli O157:H7 che tuttavia era ancorapresente al termine della stagionatura.La capacità del ceppo di produrre vero-citotossine era presente anche al ter-mine della stagionatura.

182 Ital. J. Food Sci. n. 2, vol. 14 - 2002
INTRODUCTION
Escherichia coli O157:H7 is the causeof serious food borne illnesses. In NorthAmerica and Great Britain it was identi-fied as the etiologic agent responsible forepidemic outbreaks of hemorrhagic col-itis (HC) and hemolytic uremic syndrome(HUS) (RILEY et al., 1983; PATON andPATON, 1998). In the U.S. about 100,000cases of infection occur every year and2-7% of the infected subjects developHUS, with a mortality rate of 3 to 5%.Cases of infection due to E. coli O157:H7have also been reported in Italy. From1988 to 1999 the Enter-Net SupervisionSystem of the Istituto Superiore di San-ità (ISS) collected data on 218 cases ofinfection due to verocytotoxin producingEscherichia coli (VTEC).
Several cases of food borne infectionhave been associated with the consump-tion of meat and meat products, and oth-er foods of animal origin as well as vege-tables (BUCHANAN and DOYLE, 1997).Yoghurt, mayonnaise, and some fer-mented sausages are of particular inter-est since they are usually considered safefrom the microbiological point of view dueto their low pH, although several stud-ies have revealed that E. coli O157:H7may survive in low acid foods (GLASS etal., 1992; WEAGANT et al., 1994; RA-GHUBEER et al., 1995; CLAVERO andBEUCHAT, 1996; ELLAJOSYULA et al.,1998). In 1994 E. coli O157:H7 was re-sponsible for a food poisoning outbreaklinked to consumption of sausages,which affected 20 subjects in Washing-ton State and 3 in California (CDC,1995). E. coli O157:H7 has also beenfound in fresh sausages sold in Apulia(Italy) (NORMANNO et al., 2002).
During ripening, a complex fermenta-tion process takes place in the sausagedue to microbial activity. For instance,lactic bacteria may be present in theproduct causing considerable changes inthe chemical, physical and organolepticcharacteristics of the raw meat, modify-
ing the initial pH and aw values, thuscreating inhibitory conditions for thesurvival and growth of pathogenic andspoilage microorganisms (PALUMBO andSMITH, 1977). The aim of this study wasto evaluate the survival of E. coli O157:H7during the ripening of artificially contam-inated sausages.
MATERIALS AND METHODS
Sample preparation
One 990 g and seven 900 g portionsof pork paste were taken from a lot ofpork paste produced in a sausage facto-ry in Apulia. It had been inoculated withstarter strains of Staphylococcus carno-sus and Lactobacillus plantarum (Bri-ostart SL1, Kerry Pac; 20 g/100 kgpaste), according to the producer’s in-structions and was ready for stuffing.One of the 900 g portions was immedi-ately stuffed into natural gut, followingthe normal factory procedure to producea 70-80 g sausage called “sfizietto”. Thissausage was used as a control sample.
The 990 g portion was inoculated with10 mL of broth culture (Nutrient Broth –OXOID) of an E. coli O157:H7 strain,producing verocytotoxins (VT1 and VT2),courtesy of ISS. It was incubated at 37°Covernight to a level of 8x10⁸ CFU/mL.The paste was well mixed to obtain ho-mogenous inoculation and labelled assample A. 100 g of sample A were addedto and mixed with a 900 g portion of porkpaste, thus obtaining sample B. Thisprocedure was repeated on the other 900g portions, to obtain samples C, D, E, F,G with decreasing logarithmic contami-nation (microbial counts from 106 to 1CFU/g). All the samples thus inoculat-ed were separately stuffed into naturalgut, starting from the least contaminat-ed one (sample G), thus producing sau-sage samples with the same weight andvolume as the control sample. Each sau-sage sample was subdivided into 12 al-

Ital. J. Food Sci. n. 2, vol. 14 - 2002 183
iquots and placed individually on a steelgrate to dry for 24 h (20°C and 80-90%RH) and then ripened in a storage-roomat 12°C and 70-80% RH for 16 days.Starting from the time of stuffing (T0) andthen at 4-day intervals (T4, T8, T12, T16),an aliquot of sample was drawn asepti-cally from each sausage sample andtransported immediately under refriger-ation (+4°C) to the laboratory.
Microbiological analysis
Ten g of each sausage aliquot were firsthomogenised in 90 mL of a sodium chlo-ride solution (0.85%); decimally dilutedin the same media and then submittedto the following microbiological analysesusing the pour-plate method (1 mL ofeach dilution): Total Mesophilic Flora inPlate Count Agar (Difco); Total Entero-bacteria in Violet Red Bile Glucose Agar(OXOID); Total Coliforms in Violet RedBile Agar (OXOID). These inoculated cul-ture media were incubated at 32°C for48 h. For the detection of lactic acid bac-teria, 10 g of each sausage aliquot werehomogenised in 90 mL of Ringer’s Solu-tion; the decimal dilutions were preparedin MRS Broth (OXOID) and poured (1 mL)onto MRS Agar (OXOID) incubated at35°C for 48 h. Quantification of E. coliO157:H7 was carried out in Chromoge-nic E. coli O157 Agar (Biolife) incubatedat 37°C for 24 h. A 25 g sample wasplaced in selective broth (225 mL of Mod-ified Trypton Soya Broth -m-TSB – DID)with novobiocine (0.20 g/100 mL) andincubated at 41°C for 6 h (SCOTTER etal., 2000). Afterwards, 1 mL broth aliq-uots underwent “immunomagnetic sep-aration” (IMS), using Dynabeads anti E.coli O157 (Dynabeads M-280 anti E. coliO157, OXOID) and then, 50 µL bead/cell complex were recovered from eachaliquot, plated on Sorbitol Mac ConkeyAgar (SMAC-Difco), and incubated at37°C for 18 h. Colonies showing mor-phologic characters of E. coli O157:H7(sorbitol-negative, translucid, 1-3 mm in
diameter, opaque centre) were replatedonto Tryptone Soya Agar (TSA-OXOID)and subjected to indole testing in Pep-tone water (DIFCO). All the strains whichtested indole positive were examined bi-ochemically API 20E – bioMerieux) andthe strains identified as E. coli were ex-amined by the latex agglutination test(E. coli O157 Test kit – OXOID) and withanti H7 serum.
Verocytotoxicity tests
The ability to produce verocytotoxinsof the strains isolated and identified asE. coli O157:H7 was evaluated on mon-olayers of VERO cells aged 24 hours(KONOWALCHUCK et al., 1977).
Physical and chemical analysis
pH measurements on each samplewere carried out by means of a plungeelectrode pH-meter (Mod. 230A – Orion-Boston, U.S.A.), while aw was determinedby means of an ECO (Art. 17398 – PBIInternational, Milano Italy) water activi-ty apparatus.
RESULTS AND CONCLUSIONS
The verocytotoxicity tests carried outon the broth culture before contamina-tion of the sausage mixture were posi-tive. The microbial determinations on thecontrol sausage at time 0 showed thatthe microbiological condition of the pastewas optimal, with a total mesophilecount of 107 CFU/g, a lactic bacteriacount of 106 CFU/g, a limited number oftotal enterobacteria, and no total colif-orms and E. coli O157:H7. The micro-biological parameters determined on theinoculated sausage samples on differentdays during ripening showed that thetotal mesophile count and the lactoba-cilli gradually increased during ripeningwith various samples having similar val-ues; the total enterobacteria that had

184 Ital. J. Food Sci. n. 2, vol. 14 - 2002
been present in the paste were no long-er found in the control sample from dayfour onwards. Amongst the various sau-sage samples contaminated with E. coliO157:H7, at time 0, the counts showeda logarithmic decrease in samples A, B,C, D, E with values ranging from 106 to102 CFU/g. In samples F and G, E. coliO157:H7 could not be quantitatively de-termined on the plate, so only a qualita-tive evaluation was performed whichproved to be positive. E. coli O157:H7could be detected in samples A and Buntil day 16, samples C and D until day8 and only at time 0 in sample E (Table1). The samples which tested negativefor the quantitative determination werelater subjected to qualitative analyseswhere they tested positive, with the ex-ception of sample G, that was negativefrom day 8 (Table 1). Thus confirmingthe particular resistance/survival capac-ity of this microorganism as already de-scribed by others (CONNER and KOTRO-LA, 1995; LIN et al., 1996; COLOMBO etal., 1997; DUFFY et al., 2000). The pHand aw of the various sausage sampleshad values very similar to those of thecontrol sample; the means are shown inFig. 1. No macroscopic alterations werefound in the samples and the sensorycharacteristics (colour, flavour and con-sistency) of the various inoculated sam-ples were identical to those of the con-trol. A highly individual characteristic
was shown when the degree of contami-nation of the sample was below the sen-sitivity of the pour-plate method sincethe microorganism seemed to have agreater ability to survive in these sam-ples. Further research is required to con-firm and to explain this particular be-haviour. The production of verocytotox-ins, constantly observed, was independ-ent of the length of seasoning and thechemical and physical modifications ofthe sausage. The USDA-FSIS (1995) hasrequired processors to either validatetheir processes or include a step thatwould ensure a 5 log reduction of thepathogen at the end of the ripening peri-od. Since a heat conditioning phase inthe process is not part of the traditionalprocedures used to produce fermentedsausage in Italy, the competent authori-ties should consider the problem and rec-ommend proper measures to be taken in
Table 1 - E. coli O157:H7 counts (CFU/g) during ripening of an inoculated sausage sample.
SampleTime Control A B C D E F G
TO - 1.2x10⁶ 1.7x10⁵ 2.2x10⁴ 4x10³ 2.8x10² + +T4 - 2.8x10⁵ 4x10⁴ 1.6x10³ 1.5x10² + + +T8 - 1.2x10⁵ 4.6x10³ 8x10² 20 + + -T12 - 2.1x10³ 40 + + + + -T16 - 1.2x10² 10 + + + + -
+ = Qualitative presence of E. coli O157:H7.- = Absence of E. coli O157:H7.
Fig. 1 - Changes in pH and water activity duringripening: means of control and inoculated sam-ples.

Ital. J. Food Sci. n. 2, vol. 14 - 2002 185
processing technology to produce fer-mented sausages that are safe for hu-man consumption (especially for smalldiameter products in which pathogenreduction is difficult to obtain) (GOOD-FELLOW, 1999). Our suggestion is to in-clude systematic testing for E. coliO157:H7 among the microbiological pa-rameters of the control plans in order toguarantee greater safety in the produc-tion of meat.
ACKNOWLEDGEMENTS
The authors contributed equally to this work whichwas supported by MURST 40% funds. We aregrateful to Dr. A. Caprioli (ISS) for providing thestrain of E. coli O157:H7 used for the trials.
REFERENCES
Buchanan R. and Doyle M. P. 1997. Foodbornedisease significance of Escherichia coli O157:H7and other enterohemorrhagic E. coli. Foodtech-nology 51: 69.
CDC (Center for Disease Control) 1995. Escherichiacoli O157:H7 out-break linked to commerciallydistributed dry-cured salami- Washington andCalifornia, 1994. Morbid. and Mortal. WeeklyRep. 53: 941.
Clavero R. and Beuchat L.R. 1996. Survival of Es-cherichia coli O157:H7 in broth and processedsalami as influenced by pH, water activity andtemperature and suitability of media for its re-covery. Appl. Environ. Microbiol. 62: 2735.
Colombo S., Boni P. and Bonometti E. 1997. So-pravvivenza di E. coli O157:H7 (VTEC) insalame “Milano”. Atti della Soc. Italiana Sci.Vet. LI: 717.
Conner D.E. and Kotrola J.S. 1995. Growth andsurvival of Escherichia coli O157:H7 under acidicconditions. Appl. Environ. Microbiol. 61: 382.
Duffy G., Riordan D.C.R., Sheridan J.J., Call J.E.,Whiting R.C., Blair I.S. and McDowell D.A. 2000.Effect of pH on survival, thermotolerance, andverotoxin production of Escherichia coliO157:H7 during simulated fermentation andstorage. J. Food Prot. 63: 12.
Ellayosyula K., Doores S., Mills E.W., Wilson R.A.,
Anantheswaran R.C. and Knabel S.J. 1998.Destruction of Escherichia coli O157:H7 andSalmonella typhimurium in Lebanon Bologna byinteraction of fermentation pH, heating temper-ature and time. J. Food Prot. 61: 152.
Glass K., Loeffelholz J.M., Ford J.P. and Doyle M.P.1992. Fate of Escherichia coli O157:H7 as af-fected by pH or sodium-chloride and in ferment-ed, dry sausage. Appl. Environ. Microbiol. 58:2513.
Goodfellow S.J. 1999. E. coli O157:H7 and ferment-ed sausage- The saga continues. Symposium:Pathogen update: Improving the safety of mus-cle foods. Chicago, USA July 24-28.
Konowalchuck J., Speiers J.I. and Stavric S. 1977.VERO response to a cytotoxin of Escherichia coli.Infec. Immun. 775.
Lin J., Smith M.P., Chapin K.C., Baik H.S., Ben-nett G.N. and Foster J.W. 1996. Mechanismsof acid resistance in enterohemorrhagic Es-cherichia coli. Appl. Environ. Microbiol. 62:3094.
Normanno G., Dambrosio A., Parisi A., LassandroL., Germinario L. and Celano G. 2002. Ricercadi E. coli O157:H7 in insaccati freschi. Ind. Ali-mentari. Aprile: 406.
Palumbo S.A. and Smith J.L. 1977. Chemical andmicrobiological changes during sausage fermen-tation and ripening. In “Enzymes in Food andBeverage Processing”. R.L. Ory and A.J. St An-gelo (Ed) American Chemical Society, ACS Sym-posium Series, no. 47 Washington, D.C.
Paton J.C. and A.W. Paton. 1998. Pathogenesis anddiagnosis of Shiga-toxin producing Escherichiacoli infections. Clin. Microbiol. Rev. 11: 450.
Raghubeer EV., Ke JS., Campbell ML. and MeyerRS. 1995. Fate of Escherichia coli O157:H7 andother coliforms in commercial mayonnaise andrefrigerated salad dressing. J. Food. Prot. 58:13.
Riley L.W., Remis R.D., Helegerson S.D., McGeeH.B., Wells J.G., Davis B.R., Hebert R.J., Ole-ott E.S., Johnson L.M., Hargrett N.T., Blake P.A.and Cohen M.L. 1983. Hemorragic colitis asso-ciated with a rare Escherichia coli. New Engl. J.Med. 308: 681.
Scotter S., Aldridge M. and Capps K. 2000. Valida-tion of a method for the detection of Escherichiacoli O157:H7 in foods. Food Control 11: 85.
USDA/FSIS 1995. “Challenge Study – E. coliO157:H7 in Fermented Sausage”.
Weagant S.D., Bryant J.L. and Bark D.H. 1994.Survival of Escherichia coli O157:H7 in mayon-naise and mayonnaise-based sauces at roomand refrigerated temperatures. J. Food. Prot.57: 629.
Revised paper received February 26, 2002 Accepted April 11, 2002

186 Ital. J. Food Sci. n. 2, vol. 14 - 2002

Ital. J. Food Sci. n. 2, vol. 14 - 2002 187
FLAIR-FLOW EUROPE
ITALIAN NETWORK LEADERDipartimento di Scienze degli AlimentiUniversità di Udine, Via Marangoni 97, Udine, ITALYTel. +39 0432 590711 - Fax +39 0432 590719e-mail: [email protected] site: www.uniud.it/ffe/welcomeflair.htm
F-FE PROJECT LEADER
Dr. T.R. GORMLEYThe National Food CentreDunsinea, Dublin 15, IRELANDTel. +353 1 383222 - Fax +353 1 383684
PLANT FOOD ALLERGENSFFE 485/02/SME35
Food allergy is a consequence of inappropriate immune responses to some foodproteins resulting in generation of antibodies (immunoglobulin E, or IgE). The mainfoods responsible for the majority of food allergies are peanuts and tree nuts, wheat,soya, cow’s milk, egg, shellfish and fish. It has been estimated that 1-2% of adultsand 5-7% of children actually having confirmed allergies to foods.
Flair-Flow previously informed about PROTALL (see http://www.flair-flow.com/docs/ffe36800.htm), a FAIR project aimed at improving our understanding of fac-tors that may be important in predisposing certain plant food proteins to becomingallergens and reducing or removing allergenic determinants through processing.This is an update on the results from the project.
Plant proteins may be divided into 3 sub-classes: structural and metabolic pro-teins; protective proteins (which defend a plant against invasion by pathogens orfeeding by pests, storage proteins (which act as a nutrient store to support germi-nation in seeds). It is now clear that almost all plant food allergens are eitherprotective or storage proteins. It is also clear that those proteins that trigger thedevelopment of an allergic response through the gastrointestinal tract belong pri-marily to two large protein families: The cereal Prolamin Superfamily and the CupinSuperfamily. Proteins within each family are all similar in their molecular struc-ture.
Other important results are the development of technologies to reduce or toremove the allergens or the active sites (the epitopes) of the allergenic proteins. Thework has concentrated on 3 technologies: removal of the epitopes (e.g. peeling ofpeaches removes a considerable part of allergenicity); their destruction (e.g. throughheat treatments to unfold and deactivate them or through their hydrolysis by pro-teases); and their masking (e.g. by cross-linking the epitopes by transglutaminaseor by other enzymatic reactions).
Further information may be obtained from the project web-sitewww.ifr.bbsrc.ac.uk/protall or from a synthetic report that Flair-Flow will soon bepublishing.

188 Ital. J. Food Sci. n. 2, vol. 14 - 2002
Project No: FAIR-PL98-4356 (PROTALL)Project Co-ordinator: Dr Clare Mills, Institute of Food Research, Norwich Re-
search Park, Colney, Norwich, NR4 7UA, UK, Tel.: +44-1603-255000, Fax +44-1603-255000, e-mail: [email protected].
This one-pager was written by Mr. F. Holm, Food Group Denmark, in March 2002.
INVESTIGATING AMINES IN FOODFFE 489/02/HP36
It has been known for a long time that certain components of some foods calledamines possess biological activity. Amines are formed during normal metabolic proc-esses in living organisms and are, therefore, present in everyday food products. Thecharacteristics and biological functions of amines are very diverse; they may havebeneficial or harmful effects. In general, amines can be described as “biogenic amines”(such as serotonin, cadaverine and histamine) or “natural polyamines” (such as sper-midine and spermine). Both polyamines and biogenic amines are present in food,but, while polyamines appear to be essential (through their involvement in growthand cell proliferation), biogenic amines are mainly detrimental (having the potentialto lead to nausea, hot flushes, sweating, headaches and hyper- or hypotension). Thebiogenic amine content of food should therefore be kept at a very low level.
An interdisciplinary, joint European effort, which combined expertise in severalscientific fields was therefore established, as a COST action, to clarify the physio-logical functions of biogenically active amines. The action also included investiga-tion into medical applications, such as the formation of a low-polyamine, antican-cer diet to provide a better quality of life for patients with cancer, and the develop-ment of provision of nutritional advice to people on certain types of medications(such as monoamine oxidase inhibitors, MAOI, used in some depressive illnesses)which make them sensitive to biogenic amines (specifically tyramine) in foods suchas some mature cheeses, fermented foods, e.g. sauerkraut and fermented soyaproducts, yeast extracts, pickled fish and red wine.
The COST action had 5 working groups working on the following areas:- Physiology and metabolism of biologically active amines;- Polyamines and tumour growth;- Transgenic plants (with modified amine content);- Biologically active amines in food processing;- Production of biologically active amines by bacteria.The fifth volume of the proceedings of this COST project, dealing with polyamines
and tumour growth, and on biologically active amines in food processing and aminesproduced by bacteria, is now available from: http://online.eur-op.eu.int/servlet/page?_pageid=74&_dad=catdiff&_schema=PORTAL30&_mode=3.
Project No: COST 917 ActionProject contact: Dr. John Williams, European Commission; COST Scientific Of-
ficer, SDME 9/75; B-1049 Bruxelles, Belgium, Tel.: +32 (0)2 299 1599, Fax +32(0)2 296 4289, e-mail: [email protected].
This one-pager was written by Dr. F. Robinson, British Nutrition Foundation,UK, in March 2002.

Ital. J. Food Sci. n. 2, vol. 14 - 2002 189
IN FOCUS: HEALTH IMPLICATIONSOF POLYPHENOLS
FFE 490/02/CG34
Colon cancer kills approximately 75,000 Europeans per year. Even a modestreduction would significantly benefit the EU both socially and financially.
Many studies have shown a preventing effect of naturally occurring dietary plantpolyphenols on cancer formation. Polyphenols are useful compounds that protectus against harmful reactions in human cells. There are large differences in con-sumption of amount and type of polyphenols between North and South Europe,with lower risks associated with the Mediterranean diet rich in vegetables. Vegeta-bles, especially onions, fruits and green tea are good sources of polyphenols. Flow-ers are “Non-food sources”: these compounds are responsible for the colours ofmany of them, such as fuchsias, roses and petunias. But beware: it is eating veg-etables, not flowers that is recommended!
In the year 2000, a 3-year project named “Health implications of natural non-nutrient antioxidants (polyphenols); bioavailability and colon carcinogenesis” start-ed. For the project, a co-operative partnership was established between 13 institu-tions in six EU-member countries.
The expected achievements from the programme include the study of the diges-tion of polyphenols in human gut and their effect on gut microflora. The doses ofpolyphenols to optimise protection against colon cancer will also be determined.The information gained is expected to facilitate more appropriate and safe develop-ment of tasty novel foods with altered contents of polyphenols.
Project No: QLK1-1999-00505 (POLYBIND) http://www.ifrn.bbsrc.ac.uk/Poly-bind/default.html
Project Contact: Dr. Christine Hill, POLYBIND Dissemination Officer, Diet, Healthand Consumer Science Division, Institute of Food Research, Norwich ResearchPark, Colney, Norwich, Norfolk NR4 7UA, UK, Tel.: +44 (0)1603-255000, Fax +44(0)1603-507723, e-mail: [email protected].
This one-pager was written by Mr. T. Kiutamo, VTT Biotechnology, Finland, inMarch 2002.
EATING BRASSICA VEGETABLES IS GOODFOR OUR HEALTH
FFE 491/02/CG35
Cabbage, broccoli, cauliflower and Brussels sprouts are members of the large brassi-ca plant family. They are widely cultivated and eaten in Europe. Besides dietaryfibres and vitamins, which are common health promoting components in vegetables,they are known to contain glucosinolates, large sulphur-containing compounds spe-cific to brassicas. Glucosinolates are responsible for the pungent flavour of thesevegetables, most intense in species such as turnips, radishes and garden cress.

190 Ital. J. Food Sci. n. 2, vol. 14 - 2002
It has now been proven that a high consumption of common brassica vegetablesis associated with a decreased risk of cancer, and that this association is mostconsistent for carcinomas of the lung, stomach, colon and rectum. The effect ismost likely to arise from the breakdown products of the glucosinolates, amongthem the sulphur-containing isothiocyanates.
This conclusion is supported by the key results of a finalised 3-year FAIR projectentitled “Effects of food-borne glucosinolates on human health”. In the study, acombination of laboratory-based experiments and studies with human volunteerswas used.
The safety of isothiocyanates was also evaluated. It was concluded that adverseeffects caused by extremely high doses of some glucosinolates (i.e. in the form ofconcentrated supplements) could not be excluded. However, consumption of brassicavegetables does not pose any risks in humans.
The influence of food preparation (chopping, cooking in water, microwave cook-ing) on the level of glucosinolate breakdown products was also investigated. Find-ings showed that both raw and cooked brassica vegetables still contain biologicalactivity. Consumers should be encouraged to develop a taste for the strongly fla-voured brassica vegetables.
Project No: FAIR-CT97-3029 (EFGLU) http://www.ifrn.bbsrc.ac.uk/Diet/GItract_EFGLU.html
Project co-ordinator: Professor Ian T. Johnson, Institute of Food Research, Nor-wich Research Park, Colney, Norwich, NR4 7UA, UK, Tel.: +44 (0)1603 255330,Fax +44(0)1603 507723, e-mail: [email protected].
This one-pager was written by Mr. T. Kiutamo, VTT Biotechnology, Finland, inMarch 2002.
COLON CANCERAND NATURAL ANTIOXIDANTS
FFE 495/02/SME39
Colon cancer kills approximately 75,000 Europeans per year, and even a modestreduction would significantly benefit the EU both socially and financially.
Many studies show an effect of naturally-occurring dietary plant constituents oncarcinogenesis and it has been estimated that up to 75% of the cancers of the gas-trointestinal tract may be preventable by dietary modifications. There are large differ-ences in food consumption and of amount and type of plant constituents consumedbetween North and South with lower risks associated with the Mediterranean diet.
Polyphenols in plants have been among the most interesting constituents. Theseare antioxidants which may influence important markers of carcinogenesis andmay protect the DNA, cholesterol, fatty acids, nutrients, and many more againstoxidation. Chemically, they constitute a very large and complex group of com-pounds, e.g. carotenoids, simple polyphenolics, flavonoids (inclusive isoflavonoids,lignans and catechins) and tannins.
The objectives of a Quality of Life project in progress are to answer the followingkey questions:

Ital. J. Food Sci. n. 2, vol. 14 - 2002 191
- How are dietary polyphenols metabolised?- How do polyphenols alter the rates of carcinogen metabolism?- What are the mechanisms whereby polyphenols affect cell signalling involved
in apoptosis and proliferation?- How do polyphenols modulate early events of colon carcinogenesis?The scientists expect to obtain urgently-needed data to permit a risk-benefit
analysis of the significance of dietary polyphenols in the modulation of colon can-cer, and to know whether there might be a justification for dietary modification,the production of supplements, novel foods, etc. Dissemination of the results iscarried out through information to consumers (including website) and via the 4industrial partners (including one SME). The project website iswww.ifrn.bbsrc.ac.uk/Polybind/.
Project No: QLK1-1999-00505 (POLYBIND)Project Contact: Dr. Christine Hill, POLYBIND Dissemination Officer, Diet, Health
and Consumer Science Division, Institute of Food Research, Norwich ResearchPark, Colney, Norwich, Norfolk NR4 7UA, UK, Tel.: +44 (0)1603-255000, Fax +44(0)1603-507723, e-mail: [email protected].
This one-pager was written by Mr. F. Holm, Food Group Denmark, in April2002.
NO FAT OR LOW FAT FOODSFFE 496/02/HP37
Fat in foods enhances palatability by providing texture and enhancing flavour,but excessive consumption of fat is not good for health – potentially leading tooverweight and obesity, and increased risk of cardiovascular disease (CVD).
Current recommendations across Europe suggest that 25-35% of dietary energyfrom fat is considered consistent with good health, with an overall average lessthan 30% energy being suggested as optimal, although in physically inactive pop-ulations, a lower figure would be preferable.
As a result of the need to provide people with products which have reduced fat,or zero fat content which still taste as good as regular products, a project calledBIOMIX was set up.
The project aimed to improve understanding and optimise the quality of reducedand zero fat foods produced using biopolymers. Biopolymers (large molecules whichmay consist of building blocks of protein or carbohydrate) can be used to replaceliquid and solid oil in a product, thus reducing the amount of fat, and thereforepotentially enabling a lower calorie (energy) product to be made. Examples of foodswhich use biopolymers in this way include reduced fat spreads and reduced fatsalad dressings.
The projects investigated biopolymer mixture models and increased understand-ing of the nature of particles in biopolymer mixtures. As a result, these experi-ments may open up new possibilities for reduced fat foods.
Project No: FAIR-CT97-3022 (BIOMIX)Project Co-ordinator: Prof. Wim Agterof, Unilever Research, P.O. Box 114, 3130

192 Ital. J. Food Sci. n. 2, vol. 14 - 2002
AC Vlaardingen, The Netherlands, Tel.: +31 10-460.52.60, Fax +31 10-460.5025,e-mail: [email protected].
This one-pager was written by Dr F. Robinson, British Nutrition Foundation,UK, in April 2002.
IDENTIFYING ALLERGENS IN FOODFFE 498/02/HP39
Allergic reactions to food, although relatively rare, can be life-threatening. It istherefore essential for those with a food allergy to be well informed about whichfoods to avoid and also to have appropriate advice on how to deal with an allergicreaction when the problematic food is eaten inadvertently (e.g. as a “hidden” com-ponent in a food).
Measures to reduce the risk of allergic reactions to food allergens (the compo-nent of the food to which a person is sensitive) include:
- Having very detailed ingredients labels on foods (pre-packaged and sold loose);- Drawing up a list of “safe” foods;- Using food technology to develop hypoallergenic foods.The goal of this FAIR project was to develop methods to safeguard people who
are food-allergic and who risk serious reactions if trace amounts of the allergenare ingested. Double blind placebo controlled food challenges (DBPCFC), a deci-sive factor in diagnosing patients with food allergy, were set up to identify pa-tients with a true food allergic reaction. It was essential that the subsequentclinical studies were carried out in patients with real allergy so that reliable diag-nostic methods could be developed for identifying the presence of an allergen. Inthis study, the three model foods used were: the prunoidea (peach family) foodgroup (one of the most common causes of food allergy and anaphylactic reactions– juices and purees of these fruits are widely used in food products); hazelnuts(widely used in the production of confectionery products and ice cream); andceleriac (a very common cause of anaphylactic reactions in Central Europe whereit is used in many dishes).
Using the newly developed diagnostic methods, which used sera of the patientsto carry out immunological identification of major allergens in the selected foodgroups, allergenic molecules were isolated and characterized. As a consequence,this project has developed new methods which may be used by the food industry toproduce hypoallergenic foods. By producing foods with reduced allergenicity, therisk of anaphylactic shock from inadvertently eating an allergenic food could bedramatically reduced.
A synthesis report on food allergy will be available later in 2002.
Project No: FAIR-CT97-3224Project Co-ordinator: Prof. Claudio Ortolani, Divisione Medica Bizzozero, Centro
di Riferimento Regionale di Allergologia e Immunologia Clinica, Piazza OspedaleMaggiore 3, 20162 Milan, Italy, Tel.: +39-02-64442414; Fax +39-02-64442027, e-mail: [email protected].
This one-pager was written by Dr F. Robinson, British Nutrition Foundation,UK, in April 2002.

Ital. J. Food Sci. n. 2, vol. 14 - 2002 193
NEWS
First Announcement
NATIONAL SYMPOSIUM ONSHELF LIFE OF PACKAGED FOODS
June 11-13, 2003Milan, Italy
The Italian Scientific Group of FoodPackaging (GSICA) announces the sym-posium on “Shelf Life of Packaged Foods”which will be organised in Milan in co-operation with the Italian Packaging In-stitute. The aim of the Symposium is topresent a complete picture of all the dif-ferent topics related to the main themeof food quality preservation within thecommercial distribution system. Thetheme of the Shelf Life of Packaged Foodsis so wide and multi-disciplinary that itwill include analytical chemistry, micro-biology, food processing, food packaging,material science as well as physicalchemistry. The Symposium will consistof three sessions, each opened by a for-eign invited speaker, who will address:
- Shelf Life modelling: models to pre-dict the shelf life of packaged food as wellas quality decay modelling; predicting ofbarrier performance of packaging mate-rials; kinetics of food quality degrada-tion, risk assessment,...
- New technologies for Shelf Life ex-tension: new materials, new packagingdevices, new food processing technolo-gies, new techniques for risk reduction,...
- Shelf Life testing: non-invasive ana-lytical techniques, freshness indicators,evaluation of packaging materials per-formance; risk management,...
The three-day Symposium will includeoral presentations and posters; the desig-
nation of each contribution will be decid-ed by the Scientific Committee. All contri-butions should comply with the “Guide forAuthors” of the Italian Journal of FoodScience and will be reviewed according tothe Editorial Policy of the same Journal.
Deadlines: September 30, 2002 for submission ofan extended paper.
December 15, 2002 for final programme.March 31, 2003 for submission of final papers.For additional information see: http://
www.packlab-jessica.it/.For additional information contact: segreteria@packlab-
jessica.it.
First Announcement
QUALITY IN CHAINSAN INTEGRATED VIEW ON FRUIT
AND VEGETABLE QUALITYThird International and
Multidisciplinary ConferenceJuly 6-9, 2003
Wageningen, The Netherlands
Scope & AnnouncementFood quality and safety is becoming
an ever-increasing important feature forconsumers. To stay competitive in themarket of fruit and vegetables, the foodproviders need to create safe producewith an increased perceived quality. Tomeet the changing demands for quali-ty, availability, cost, appearance andservice the actors in the supply chainneed to cooperate. A retailer is not ca-pable of meeting the demand withoutco-operation with suppliers, wholesal-ers, growers, plant and seed suppliersand breeders. Servicing these consum-

194 Ital. J. Food Sci. n. 2, vol. 14 - 2002
er needs requires integration of qualityand of quality handling throughout theentire supply chain.
To enhance and to emphasise the im-portance of integration of quality and qual-ity aspects throughout the entire chain thisthird international conference will be struc-tured around key questions affecting theentire supply chain and will surpass thetraditional working areas. This will stimu-late and motivate the exchange of ideasand techniques between different areasand disciplines involved in supply chains.
Key questions structuring the integrat-ed view are:
- What is quality and what are qualityaspects throughout the supply chain?
- How can we model quality and qual-ity aspects relevant for consumer, pro-vider and producer?
- How do quality and quality aspectschange by the way we handle productsin the chain?
- What are the opportunities for ma-nipulating and monitoring quality andquality aspects in the supply chain?
- What are the “things” to look for toget a “measure” for quality and qualityaspects?
Conference Organisation Quality in Chains: P.O.Box 17, 6700 AA Wageningen, The Netherlands
Call for papers and posters:Contributed papers do not have to be limited to these
topics and may address specific subjects or casestudies, pertinent to the chain approach, to linkphilosophical views to technological possibilitiesand current practice. Authors are kindly invitedto submit an extended abstract (1 page tops) bye-mail to: [email protected]
by fax to: +31 0317 475347More detailed information can be found on our
website: www.ato.wageningen-ur.nl/quic.
AACC FORMS COMMITTEETO EVALUATE SWEDISH STUDY
ON ACRYLAMIDE IN FOODS
Researchers at Stockholm University’sDepartment of Environmental Chemistryin cooperation with Sweden’s NationalFood Administration, a government food
safety agency, released information yes-terday that acrylamide, a potential can-cer-causing agent, may be formed in highconcentrations when carbohydrate-richfoods such as rice, potatoes and cerealsare fried or baked. However, the foodswhen analyzed in their raw state or whenboiled showed no traces of acrylamide.The scientists who conducted the re-search deemed the findings so importantthat they released them prior to actualpublication in an academic journal.
The U.S. Environmental ProtectionAgency classifies acrylamide as a “medi-um hazard probable human carcinogen”.The American Association of Cereal Chem-ists (AACC) is taking this research veryseriously and is investigating the issuefurther as no previous work has shownacrylamide at these levels in these foods.
AACC’s Scientific Advisory Panel hasconvened a group of AACC experts whoare looking into the claims brought forthby Stockholm University and the Swed-ish National Food Administration. AACCis requesting a copy of the research pa-per that is based on a new analyticalprocedure developed by the SwedishNational Food Administration.
The American Association of CerealChemists (AACC) is an international or-ganization of nearly 3,500 grain scien-tists and other professionals who studythe chemistry of cereal grains and theirproducts or work in related fields.
Contact: Susan Kohn, Director of Membership andCommunication,
Phone: +1.651.454.7250,Cellular: +1.612.670.9693,E-mail: [email protected]: Hilde Keunen, AACC European Branch Office,Phone: +32 16.204035,E-mail: [email protected].
INTERNATIONAL ASSOCIATIONFOR FOOD PROTECTION
ANNOUNCES FOUR WORKSHOPS
The International Association for FoodProtection announces four workshops to

Ital. J. Food Sci. n. 2, vol. 14 - 2002 195
be held in conjunction with IAFP 2002at the Manchester Grand Hyatt in SanDiego, California. The workshops arescheduled for June 28-29, 2002.
Workshop I – Critical Steps in Labo-ratory Methods for the Detection of Lis-teria monocytogenes – June 28-29, 2002.This workshop is an update of the sci-ence in the isolation of Listeria monocy-togenes. Current information on the ad-vantages and disadvantages of technol-ogies used in recovery of this pathogenwill be presented along with laboratorydemonstrations at San Diego State Uni-versity.
Workshop II – Current Practices in Pro-duce Safety: GAPs and GMPs – June 28-29, 2002. The objective of this one and ahalf day workshop is to discuss the im-pact of growing practices on the foodsafety of produce. Experts share currentknowledge on the application of “GoodAgricultural Practices” for pre- and post-harvest produce. The workshop includesa field trip to local produce operations.
Workshop III – Control of Pathogensin the Dairy Processing Environment –June 29, 2002. This workshop is intend-ed to help dairy processing facilities de-sign and implement an effective patho-gen monitoring program. Participantswill learn how data from a monitoringprogram provides the foundation for set-ting up control measures. Emphasis willbe placed on determining corrective ac-tions and follow-up.
Workshop IV – Media Training for theScientific Community – June 29, 2002.The most common source of health andfood safety information is the media, themost trusted sources include scientists.This intensive, hands-on workshop willassist in developing practical media tech-niques, message development and mockmedia interviews.
Detail descriptions and registration informationregarding these workshops may be obtained byvisiting our Web site at www.foodprotection.org;calling 800.369.6337; 515.276.3344, or by faxat 515.276.8655.
INTERNATIONAL ASSOCIATIONFOR FOOD PROTECTION ELECTS
FARBER AS EXECUTIVEBOARD SECRETARY
The International Association for FoodProtection welcomes Dr. Jeffrey M. Far-ber to the Executive Board as Secretary.Dr. Farber will take office at the conclu-sion of the Awards Banquet at IAFP2002, the Association’s 89th AnnualMeeting in San Diego, California. By ac-cepting this position, he made a five-yearcommitment to the Association and willbegin his term as President in the sum-mer of 2005.
Dr. Farber is currently Director ofthe Bureau of Microbial Hazards, forthe Food Directorate of Health Cana-da, where he is responsible for themanagement of research and policy de-velopment in the area of microbiologi-cal food safety. His main areas of ex-pertise are Listeria monocytogenes,modified atmosphere packaging, fresh-cut produce, Enterobacter sakazakii,and molecular typing of foodbornepathogens. He currently holds Inter-national Life Sciences Institute (ILSI)and Biotechnology grants for work onthe virulence, molecular typing andbiochip detection of L. monocytogenesin foods.
Since joining the Association in1986, Dr. Farber served on the ProgramCommittee six years including Chair-person and has been involved with anumber of the Professional Develop-ment Groups (PDGs). He has also beena member of the Nominating Commit-tee, Chairperson of the Developing Sci-entist Award Committee, and startedthe Fruit and Vegetable Safety andQuality PDG.
Dr. Farber is currently the Editor of the Interna-tional Journal of Food Microbiology and serveson the Editorial Board of the Journal of FoodProtection and the Italian Journal of Food Sci-ence. He also serves on the Journal of FoodProtection Management Committee.

196 Ital. J. Food Sci. n. 2, vol. 14 - 2002
BOOKS
ASEPTIC PROCESSING OF FOODSCONTAINING SOLID
PARTICULATES
by Sudhir K. Sastry and Bill D. Cor-nelius, Ohio State University Columbus,USA
March 2002, 288 pp, ClothISBN: 047136359 6Hbk £95.00 - euro 142.50Publisher: John Wiley & Sons Ltd,
Customer Service, 1 Oldlands Way, Bog-nor Regis, West Sussex, PO22 9SA, UK,e-mail: [email protected], Pleaseinclude your postal delivery address.
How to order: UK Freefone 0800243407, Overseas +44 1243 779777, Faxyour order form to: +44 (0) 1243 843296.
This is the first in-depth book to con-tain state-of-the-art information on thistechnology, which is needed for proc-ess filing with the FDA.
- Provides comprehensive, detailedcoverage of three key aspects of the tech-nology: engineering, microbiology andstatistics.
- It is the only book to cover the con-sensus statements from 1995-96 work-shops on continuous multi-phase asep-tic processing of foods.
DAIRY MICROBIOLOGYHANDBOOK: THE
MICROBIOLOGY OF MILK ANDMILK PRODUCTS 3rd EDITION
by Richard Robinson, University ofReading, UK
May 2002, 592 pp, ClothISBN: 0471385964Hbk £95.00 - euro 142.50Publisher: John Wiley & Sons Ltd,
Customer Service, 1 Oldlands Way, Bog-nor Regis, West Sussex, PO22 9SA, UK,e-mail: [email protected], Pleaseinclude your postal delivery address.
How to order: UK Freefone 0800243407, Overseas +44 1243 779777, Faxyour order form to: +44 (0) 1243 843296.
Now in its third edition, this book con-tinues to be the standard reference in thefield on microbiology of milk and milkproducts. Focusing on microbial safetyissues, readers will find the latest infor-mation on public health risks, pathogens,and spoilage organisms, the factors affect-ing growth of these micro-organisms inplants, and good manufacturing practice.
- Provides thorough coverage of bothdairy microbiology principles and prac-tical applications.
- Emphasizes HACCP and other pre-ventive measures that can be taken bydairy processors and manufacturers.
- Includes the latest developments indairy starter cultures and genetic engi-neering techniques.
IDF Publications
NUTRITION WEEK 2000Dairy Nutrition for a Healthy Future:
Abstracts & Posters
The objective of the IDF Nutrition Week2000 was to share current nutrition in-

Ital. J. Food Sci. n. 2, vol. 14 - 2002 197
formation, while increasing the scientif-ic knowledge on the ways in which dairyproducts can enhance well-being at allstages of life and contribute to optimumnutrition. The three major themes cov-ered were:
- Role of Dairy Nutrition at DifferentLife Stages.
- Health Effects of Milk and Other FoodComponents.
- Dairy Products with Nutritional Ben-efits.
The available papers of the IDF Nutri-tion Week 2000 were published in the
Bulletin of IDF No. 363/2001. However,it was agreed to publish the abstracts ata later stage as more were available. Post-ers on related topics were presented dur-ing the meeting, the abstracts of whichare presented in this Bulletin.
17 pp – English onlyBulletin N. 370/2002 – 42 euro
41, Square Vergote - B-1030 Brussels,Belgium - Tel. +32 2 7339888 - Fax +322 7330413 - e-mail: [email protected] - WebSite: http://www.fil-idf.org

198 Ital. J. Food Sci. n. 2, vol. 14 - 2002

Ital. J. Food Sci. n. 2, vol. 14 - 2002 199
GUIDE FOR AUTHORSITALIAN JOURNAL OF FOOD SCIENCE - IJFS
1. Manuscript Preparation
(1) Manuscripts must be typed, double-spaced and four copies submitted along withthe computer disk. There should be liberal margins on top, bottom and sides (2.5 cm).English is the official language. Authors who are not fluent in written English shouldseek help from a fluent person before the final version is typed. The Assistant Editorreserves the right to make literary corrections and to make suggestions to improve brevity.
The paper must also be submitted on a Macintosh or Windows floppy disk. Indicatewhich word processor was used to generate the file and save the file also in format“Text only”, DCA-RTF or ASCII, if you do not have programs for Macintosh; graphics,pictures and diagrams must be saved in TIF, JPEG, EPS, CGM or PICT formats (notincluded in MsWord documents).
(2) Every paper should be divided under the following headings in this order:Title. Informative of the content of the article (<50 characters + spaces). Author(s).
Initials and Surname, omit professional and official titles. The Institute and addresswhere the research was carried out and the current address of each author should begiven as a footnote on the title page.
Abstract. Clearly state the objective of the study, give a concise description ofexperiment(s), observations, results and conclusions. No references should be cited.DO NOT EXCEED 100 WORDS. An abstract and title in Italian must also be included.DO NOT EXCEED 200 WORDS.
Keywords. Up to six words, in alphabetical order, which describe the documentmust be given to aid data retrieval and indexing.
Introduction. Review pertinent previous work and cite appropriate references. Statethe purpose of the investigation.
Materials and Methods. Indicate apparatus, instruments, reagents, etc., givingsufficient detail to allow the work to be repeated.
Results and Conclusions. Results and Conclusions may be presented together orseparately. Concisely present results using tables and figures to help justify conclusions(do not present the same information in both forms). Use statistical analysis whenappropriate. Unsupported hypotheses should be avoided. Conclusions should pointout the significance of the findings and, if possible, relate the new findings to someproblem in Food Science and Technology.
Acknowledgments. Acknowledgments of assistance are appropriate provided theyare not related to analyses, or other services performed for a fee. Financial support,thanks for assistance, article number or thesis fulfillment may be included.
Units. A list of units particular to the paper may be included.References. References should be arranged alphabetically, and for the same author
should be arranged consecutively by year, typed double-spaced. Each individual citationshould begin flush left (no indentation). Refer to attached examples taken from “StyleGuide for Research Papers” by the Institute of Food Technologists (Chicago - Illinois -USA). Literature citations in the text should be referred to by name and year inparentheses (only the initials in capital letters). If there are more than two authors,mention the first author and add et al.

200 Ital. J. Food Sci. n. 2, vol. 14 - 2002
(3) Lines on all pages, including those pages for “References” and figure legends, mustbe numbered (by pen) in the left margin, beginning with number one at the top of the page.
(4) Tables should be as few and as simple as possible and include only essentialdata. Each table must be on a separate sheet and saved on floppy disk, and have anArabic number, e.g. Table 4 NOT Tab. 4. Legends must be self-explanatory and on aseparate sheet. Use lower-case letters for footnotes in tables and explain below thetable in the order in which they appear in the table.
(5) Figures must be drawn on separate sheets of paper and saved on floppy disk inTIF, JPEG, EPS, CGM or PICT formats. They should be drawn so that on 50% reduction,lines, figures and symbols will be clearly legible and not overcrowded. A photocopy ofhow the figure should appear must be included. Photographs must be unmounted,glossy prints or slides. All figures must be given Arabic numbers, e.g. Fig. 3, in the textand in the final copy only on the back where the title of the paper, the senior author’ssurname and the top of the illustration must also be marked; for reviewing procedures,do not include this information in the first submitted copies. Legends for figures mustbe self-explanatory and should be typed on a separate sheet under “Legends to Figures”.
(6) Standard Usage, Abbreviations and Units. The Concise Oxford and Webster’sEnglish Dictionaries are the references for spelling and hyphenation. Statistics andmeasurements should always be given in figures, e.g. 10 min, except when the numberbegins a sentence. When the number does not refer to a unit of measurement it isspelled out unless it is 100 or greater. Abbreviations should be used sparingly, onlywhen long or unwieldy names occur frequently, and never in the title; they should begiven at the first mention of the name. International Standard abbreviations shouldgenerally be used except where they conflict with current practice or are confusing. Forexample, 3 mm rather than 3x10⁻³m. Abbreviations should be defined the first timethat they are used in the text and they should be used consistently thereafter.Temperatures should be expressed in the Celsius (centigrade) scale. Chemical formulaeand solutions must specify the form used, e.g. anhydrous or hydrated, and theconcentration must be in clearly defined units. Common species names should befollowed by the Latin binomial (italics) at the first mention. For subsequent use, thegeneric name should be contracted to a single letter if it is unambiguous.
2. Review Policy
Scientific contributions in one of the following forms may be submitted:Opinions and Reviews - Papers may be sent directly to the Editor-in-Chief who will
decide upon publication or articles will be requested directly from the authors by theEditor-in-Chief.
Short Communications and Surveys - They do not need to have the formal organizationof a research paper; they will receive priority in publication;
Papers - The paper must follow manuscript preparation.Short Communications, Surveys and Papers will be subjected to critical review by
the referees. Upon receiving papers from authors, the Advisory Board with the Editor-in-Chief will select papers in relationship to innovation and originality and send copiesto the referees. A letter stating that the paper has been accepted for refereeing will besent to the authors. Papers needing revision will be returned to the author, and theauthor must return the revised manuscript to the Editor-in-Chief within 1 month,otherwise the paper will be considered as withdrawn. Papers not suitable for publicationwill be returned to the author with a statement of reasons for rejection.

Ital. J. Food Sci. n. 2, vol. 14 - 2002 201
3. Editorial Policy
Referees may not be from the same institution as the author. Referees should maketheir comments and questions in detail and return the paper to the Editor-in-Chief assoon as possible, usually within 4 weeks. The identity and the report of the referees aremade known to the Editor-in-Chief, but only the anonymous report is routinely sent tothe author. If all referees recommend acceptance or rejection, the decision stands. Ifthe opinions of the referees tie, the Editor-in-Chief has the freedom to decide uponacceptance or rejection of the paper. Manuscripts will be edited in the order receivedand accepted papers will be published as closely as possible in this order. A letterannouncing the issue of publication will be sent to the author after the manuscript hasbeen accepted by the Editor-in-Chief. Each paper is accepted with the understandingthat it is the sole document under active consideration for publication covering thework reported (it has NOT been previously published, accepted or submitted for publi-cation elsewhere). Upon acceptance of the paper for publication, the author agrees topay the page charges as published on the first page of each issue. Authors take fullresponsibility for all opinions stated in their papers and published in this journal.
4. Mailing Instructions
Papers for publication and communications regarding editorial mattersshould be sent to:Prof. Paolo Fantozzi or Dr. Mary F. Traynor, F.S.E.Dipartimento di Scienza degli Alimenti, Università di Perugia, S. Costanzo,I - 06126 Perugia, ItalyE-mail: [email protected] or [email protected]
(Anonymous)Anonymous. 1982. Tomato product invention merits CTRI
Award. Food Technol. 36(9): 23.
(Book)AOAC. 1980. “Official Methods of Analysis” 13th ed. Associ-
ation of Official Analytical Chemists, Washington, DC.Weast, R.C. (Ed.). 1981 “Handbook of Chemistry and Phys-
ics” 62nd ed. The Chemical Ruber Co. Cleveland, OH.
(Bulletin, circular)Willets C.O. and Hill, C.H. 1976. Maple syrup producers
manual Agric. Handbook No. 134, U.S. Dept. of Agricul-ture, Washington, DC.
(Chapter of book)Hood L.F. 1982. Current concepts of starch structure. Ch.
13. In “Food Carbohydrates”. D.R. Lineback and G.E.Inglett (Ed.), p. 217. AVI Publishing Co., Westport, CT.
(Journal)Cardello A.V. and Maller O. 1982. Acceptability of water,
selected beverages and foods as a function of servingtemperature. J. Food Sci. 47: 1549.
IFT Sensory Evaluation Div. 1981a. Sensory evaluation guidefor testing food and beverage products. Food Technol.35 (11): 50.
IFT Sensory Evaluation Div. 1981b. Guidelines for the prep-aration and review of papers reporting sensory evalua-tion data. Food Technol. 35(4): 16.
(Non-English reference)Minguez-Mosquera M.I., Franquelo Camacho A, and Fern-
andez Diez M.J. 1981. Pastas de pimiento. I. Normaliza-cion de la medida del color. Grasas y Aceites 33 (1): 1.
(Paper accepted)Bhowmik S.R. and Hayakawa, K. 1983. Influence of select-
ed thermal processing conditions on steam consump-tion and on mass average sterilizing values. J. Food Sci.In press.
(Paper presented)Takeguchi C.A. 1982. Regulatory aspects of food irradia-
tion. Paper No. 8, presented at 42nd Annual Meeting ofInst. of Food Technologists, Las Vegas, NV, June 22-25.
(Patent)Nezbed R.I. 1974. Amorphous beta lactose for tableting U.S.
patent 3,802,911, April 9.
(Secondary source)Sakata R., Ohso M. and Nagata Y. 1981. Effect of porcine
muscle conditions on the color of cooked cured meat.Agric. & Biol. Chem. 45 (9): 2077. (In Food Sci. Technol.Abstr. (1982) 14 (5): 5S877).
Wehrmann K.H. 1961. Apple flavor. Ph. D. thesis. MichiganState Univ., East Lansing. Quoted in Wehrmann, K.H.(1966). “Newer Knowledge of Apple Constitution”, p. 141,Academic Press, New York.
(Thesis)Gejl-Hansen F. 1977. Microstructure and stability of freeze-
dried solute containing oil-in-water emulsions. Sc. D.Thesis, Massachusetts Inst. of Technology, Cambridge.
(Unpublished data/letter)Peleg M. 1982. Unpublished data. Dept. of Food Engineer -
ing., Univ. of Massachusetts, Amherst.Bills D.D. 1982. Private communication. USDA-ARS. East-
ern Regional Research Center, Philadelphia, PA.
REFERENCE EXAMPLESEXAMPLES of use in a Reference list are given below. The bold-faced parenthetical type of citation above the example isindicated ONLY for information and is NOT to be included in the reference list.

202 Ital. J. Food Sci. n. 2, vol. 14 - 2002
CONTRIBUTORS
Gratitude is expressed to the following entities for contributing to
the realization of the Journal by being supporting subscribers for 2002.
Si ringraziano i seguenti Enti, Ditte ed Istituti per aver voluto
contribuire fattivamente alla realizzazione della Rivista, sottoscrivendo
un abbonamento sostenitore per il 2002.
ASSOCIATIONS
Associazione Italiana di Tecnologia Alimentare (A.I.T.A.) - Milano Fax +39-02-2365015
INDUSTRIES
Besana spa - San Gennano Vesuviano (NA) Fax +39-081-8657651
Birra Peroni Industriale spa - Roma Fax +39-06-22544313
Cirio Ricerche scpa - Piana di Monteverna Fax +39-0823-861782
Corial scpa - Foggia Fax +39-0881-680077
Danone spa - Milano Fax +39-02-67071362
Kraft Foods Italia spa - Milano Fax +39-02-41337595
Tecnoalimenti - Milano Fax +39-02-67077405
Ital. J. Food Sci. n. 2, vol. 14 - 2002 203
RESEARCH INSTITUTES
Istituto di Tecnologie Alimentari, Facoltà di Agraria Dipartimento di Agrobiologia e Agrochimica (D.A.B.A.C.), Università della Tuscia, Viterbo Fax +39-0761-357498
Dipartimento di Ingegneria e Tecnologie Agro-Forestali Università di Palermo, Palermo Fax +39-091-484035
Dipartimento di Scienze Ambientali Agrarie e di Biotecnologie Agro-Alimentari (Di.S.A.A.B.A.), Università di Sassari, Sassari Fax +39-079-229276
Dipartimento di Scienze degli Alimenti, Università di Udine, Udine Fax +39-0432-501637
Dipartimento di Scienze e Tecnologie Agroalimentari e Microbiologiche (DI.S.T.A.A.M.), Università del Molise, Campobasso Fax +39-0874-404652
Dipartimento di Scienze e Tecnologie Alimentari e Microbiologiche (DI.S.T.A.M.), Università di Milano, Milano Fax +39-02-70638625
Dipartimento di Valorizzazione e Protezione delle Risorse Agroforestali (DI.VA.P.R.A.), Sezione Microbiologia ed Industrie Agrarie Università di Torino, Grugliasco Fax +39-011-6708549

204 Ital. J. Food Sci. n. 2, vol. 14 - 2002
ITALIAN JOURNAL OF FOOD SCIENCERivista Italiana di Scienza degli Alimenti
DIRETTORE RESPONSABILE: Giovanni ChiriottiAUTORIZZAZIONE: n. 3/89 in data 31/1/1989
del Tribunale di PerugiaProprietà dell’Università di PerugiaTIPOGRAFIA Giuseppini - Pinerolo
Una copia € 6.00
ISSN 1120-1770 © 2002
CHIRIOTTI EDITORI spa - 10064 Pinerolo - Italy
publishes the technical magazines:

VOLUME XIV No. 2, 2002
CONTENTS
PAPERSValidation of Analytical Methods for the Determination of Imidocarbin Tissues and Milk of Cattle, Sheep and Goats ..................................................................... 99G. Crescenzo, O.R. Lai, C. Belloli, G. Sasso and P. Ormas
Chemiluminescent Determination of Antioxidant Capacity of Beverages .....................113S. Girotti, L. Bolelli, F. Fini, R. Budini and G. Arfelli
Bread-Making Quality of Italian Durum Wheat (Triticum durum Desf.) Cultivars ....... 123M. Palumbo, A. Spina and G. Boggini
The Effect of Smoking, Packaging and Storage Temperature on the Bacterial Greeningof Frankfurters caused by Leuconostoc mesenteroides subsp. mesentreoides ............................. 135K. Anifantaki, J. Metaxopoulos, M. Kammenou, E.H. Drosinos and M. Vlassi
Release of Volatile Compounds from Emulsions: Influenceof β-Lactoglobulin and pH ..................................................................................................... 145S.M. Van Ruth, C. King, M. Delarue and P. Giannouli
Effect of Dietary Vegetable Lipids on Functional and Sensory Propertiesof Chicken Eggs ....................................................................................................................... 159N. Tallarico, F. Sirri, A. Meluzzi, P. Pittia, G.P. Parpinello and A. Franchini
SHORT COMMUNICATIONS
Effect of Chilling on the Vitamin C Content of Fennel During Storage .......................... 167F. Galgano, F. Favati, L. Lapelosa, D. Albanese and L. Montanari
Aroma Variation in Tannat Wines: Effect of Malolactic Fermentationon Ethyl Lactate Level and its Enantiomeric Distribution ................................................ 175A. Lloret, E. Boido, D. Lorenzo, K. Medina, F. Carrau, E. Dellacassa and G. Versini
Survival of Escherichia coli O157:H7 in a Short Ripened Fermented Sausage ................. 181G. Normanno, A. Dambrosio, A. Parisi, N.C. Quaglia, L. Laporta and G. Celano
FLAIR FLOW EUROPE .......................................................................................................... 187NEWS ........................................................................................................................................ 193BOOKS ...................................................................................................................................... 196GUIDE FOR AUTHORS ......................................................................................................... 199