Embed Size (px)
Citation preview

www.ubs.com/investmentresearch
This report has been prepared by UBS Securities Asia Limited. ANALYST CERTIFICATION AND REQUIRED DISCLOSURES BEGIN ON PAGE 44. UBS does and seeks to do business with companies covered in its research reports. As a result, investors should be aware that the firm may have a conflict of interest that could affect the objectivity of this report. Investors should consider this report as only a single factor in making their investment decision.
Global Research 10 April 2019
Chinese Wind Power Sector No winners in this rush installation era
No one benefits from rush installation; downgrade Goldwind from Buy to Sell We cut our earnings forecasts and price targets for both wind turbine generator (WTG) manufacturers and wind farm operators, taking an anti-consensus cautious view on Goldwind, and being neutral on the operators. We expect new wind farm additions will surge in 2019 and 2020 before subsidy cancellation, as major wind farm operators aggressively raised capacity addition guidance in their 2018 results briefings. Contrary to consensus, we think this can hardly benefit Goldwind, as margin pressure eroded the volume benefits, and may be negative to wind farm operators as curtailment, earnings, subsidy payments, balance sheets, and cash flow will be under substantial pressure for two years. We downgrade Goldwind to Sell as the current high valuation multiples reflect volume upside but not margin pressure. We are neutral on wind farm operators as we think the impact of rush installation is largely priced in.
Rush installation ahead, but Goldwind can hardly benefit We raise our 2019/20 wind power connection forecasts from 22/23GW to above 30GW, suggesting large growth from 21GW in 2018. We think rush installation is justified as, even allowing for delays in grid connection and subsidies, project internal rates of return (IRR) in southern China are still better at 7.4% if installed now, than 5% if installed after 2020. However, we expect Goldwind's gross margin erosion could be worse than we had expected, from 25% in 2017 to 15/17% in 2019/20E. This will lower its WTG EBIT margin to 2-4%.
Two dark years for wind farm operators; downgrade Longyuan and Huaneng We believe wind farm operators will suffer from 1) reduced earnings as curtailment will likely worsen; 2) deteriorating cash flow with larger subsidy deficits and increased capex; 3) increased gearing. We cut our 2019/20 earnings forecasts by cutting utilisation hours from 2,200 to 2,000. We expect they generate negative FCF for 2019/20E from positive FCF in 2018. We downgrade Longyuan and Huaneng Renewable from Buy to Neutral.
What's priced in? We see valuation downside for Goldwind as the implied 2020E PE for its WTG business has already exceeded that of the 2015 upper cycle. For wind farm operators, we estimate that the returns profiles for 2019/20 will be similar to that in 2015. We believe valuations could remain close to the 2015 trough for some time at 0.7x P/BV, close to current valuations. Figure 1: Valuation summary and rating changes
Rating Current Price target Upside 2019E EPS 2020E EPS 2021E EPS
New Old price New Old Chg
New Old Chg New Old Chg New Old Chg
Goldwind-A Sell Buy Rmb13.80 Rmb11.50 Rmb17.00 -32% -17% 0.51 0.66 -22% 0.67 0.82 -19% 0.61 0.88 -31%
Goldwind-H Sell Buy HK$10.28 HK$8.50 HK$12.00 -29% -17% 0.51 0.71 -28% 0.67 0.88 -25% 0.61 0.95 -35%
Longyuan Neutral Buy HK$5.47 HK$6.00 HK$8.70 -31% 10% 0.48 0.80 -40% 0.52 0.88 -41% 0.67 0.97 -30%
HNR Neutral Buy HK$2.24 HK$2.40 HK$3.00 -20% 7% 0.24 0.36 -31% 0.27 0.38 -28% 0.33 0.40 -16% Region Reuters Mkt cap PE P/BV ROE Dividend yield
code Rating Rmb m 19E 20E 19E 20E 19E 20E 19E 20E
Goldwind-A CN 002202.SZ Sell 58,306 26.9x 20.7x 1.9x 1.8x 8.1% 9.0% 1.8% 1.9%
Goldwind-H CN 2208.HK Sell 37,172 17.2x 13.2x 1.2x 1.1x 8.1% 9.0% 2.7% 2.9%
Longyuan CN 0916.HK Neutral 37,621 9.8x 8.9x 0.8x 0.7x 8.4% 8.6% 2.0% 2.2%
HNR CN 0958.HK Neutral 20,257 7.9x 7.1x 0.7x 0.6x 9.1% 9.3% 1.9% 2.1% Source: Company data, UBS estimates. Note: price as of 9 April 2019; Goldwind-A's EPS change contains changes in share outstanding.
Equities
China
Electric Utilities
Abigail Sun Analyst
S1460518040002 [email protected]
+86-213-866 8637
Ken Liu Analyst
[email protected] +852-2971 7516
Simon Powell Analyst
[email protected] +852-2971 7772

Chinese Wind Power Sector 10 April 2019
2
Contents
OUR THESIS IN PICTURES .................................................................... 4
PIVOTAL QUESTIONS ........................................................................... 5
Q: Will wind power installation volume surge in 2019/20? .......................... 5
Q: Will curtailment continue to ease or turn worse? .................................... 8
Q: Can wind farm operators speed up the collection of subsidy receivables?
.................................................................................................................. 10
WHAT'S PRICED IN? .......................................................................... 13
Company pages .............................................................................. 14
Xinjiang Goldwind Science & Technology .................................................. 15
Xinjiang Goldwind Science & Technology-A ............................................... 28
China Longyuan Power .............................................................................. 29
Huaneng Renewable Corporation .............................................................. 36
Abigail Sun Analyst
S1460518040002 [email protected]
+86-213-866 8637
Ken Liu Analyst
[email protected] +852-2971 7516
Simon Powell Analyst
[email protected] +852-2971 7772
Chinese Wind Power Sector 10 April 2019
3
Chinese Wind Power Sector
P2
UBS Research THESIS MAP a guide to our thinking and what's where in this report OUR THESIS IN PICTURES
MOST FAVOURED LEAST FAVOURED
Longyuan Goldwind A/H
PIVOTAL QUESTIONS Q: Will wind power installation volume surge in 2019/20? Yes. We think wind power installation could surge significantly in 2019/20 ahead of the subsidy cancellation at end-2020. We forecast 30/32GW wind power connection and 31GW/33GW wind power installation in 2019/20. more
Q: Will curtailment continue to ease or become worse? Worse. We believe the glut of new wind farm supply is likely to increase the pressure for the grid to absorb the renewable power. Utilization is likely to be suppressed in 2019/20, which would be bad for earnings. We think curtailment may go back to the 2016 level of around 15%. more
Q: Can wind farm operators speed up the collection of subsidy receivables? Unlikely. The rush installation for new wind farms in 2019/20 will likely exacerbate the subsidy deficits from the current one year or eighteen months to almost two years. We expect balance sheets and cash flows for wind farm operators to further deteriorate. more
UBS VIEW We believe the operating environment for wind farm operators will significantly worsen in 2019/20 as most companies rush ahead to install new wind projects. We believe they will suffer from 1) reduced earnings as curtailments will likely worsen; 2) deteriorating cash flows, with larger subsidy deficits and increased capex; and 3) increased gearing.
EVIDENCE 1) Most managements of wind farm operators have increased their guidance for expansion plans in 2019 and 2020; 2) our renewable subsidy funds calculation shows that deficits will escalate in the next two years as capacity expansion is accelerating.
WHAT'S PRICED IN? The implied 2020E PE for Goldwind's WTG business has already gone above the level in 2015 upper cycle; we think market has priced in volume upside but not margin contraction. Trading at 0.7x 12-month forward P/BV for wind farm operators, we believe the market has priced in most of the negatives potentially brought by rush installations. Our 2019/20 ROE forecasts are similar to the levels in 2015. The current valuation multiples are similar to those back in 2015. more
Installation and connection could surge to over 30GW in 2019/20E
Source: Reuters, Company data, UBS estimates
17 15 15
20
34
20
16
21
30 32
25 25 25 25 25
18
13 16
23
31
23
20 21
31 33
24 25 25 25 25
0
5
10
15
20
25
30
35
2011 2012 2013 2014 2015 2016 2017 2018E 2019E 2020E 2021E 2022E 2023E 2024E 2025E
GW
New connection New installation

Chinese Wind Power Sector 10 April 2019
4
Chinese Wind Power sector UBS Research
P3
OUR THESIS IN PICTURES return
China's wind power capacity addition should surge in 2019/20E
Rush installation could drive curtailment ratio to increase again
And subsidy receivable days will also increase, leading to deteriorated cash flows for wind farm operators
However, Goldwind can hardly benefit due to significant margin contraction
Sources for exhibits above: Company data, UBS Research
0
5
10
15
20
25
30
35
2011
2012
2013
2014
2015
2016
2017
2018
E
2019
E
2020
E
2021
E
2022
E
2023
E
2024
E
2025
E
GW Wind farm capacity addition
New connection New installation
0%
5%
10%
15%
20%
25%
30%
Q11
4
Q21
4
Q31
4
Q41
4
Q11
5
Q21
5
Q31
5
Q41
5
Q11
6
Q21
6
Q31
6
Q41
6
Q11
7
Q21
7
Q31
7
Q41
7
Q11
8
Q21
8
Q31
8
Q41
8
2019
E
2020
EWind power curtailment ratio
(10,000)
(5,000)
0
5,000
10,000
15,000
2017 2018 2019E 2020E 2021E 2022E
Free cash flow of wind farm operators (Rmb m)
Longyuan Huaneng Renewable China Resources Power
0
2,000
4,000
6,000
8,000
10,000
0%
5%
10%
15%
20%
25%
30%
35%
40%
2010
2011
2012
2013
2014
2015
2016
2017
2018
2019
E
2020
E
MW Goldwind's WTG sales volume and margin
WTG external sales volume EBIT margin Gross margin
Chinese Wind Power Sector 10 April 2019
5
Chinese Wind Power sector UBS Research
Sector Q1
PIVOTAL QUESTIONS return
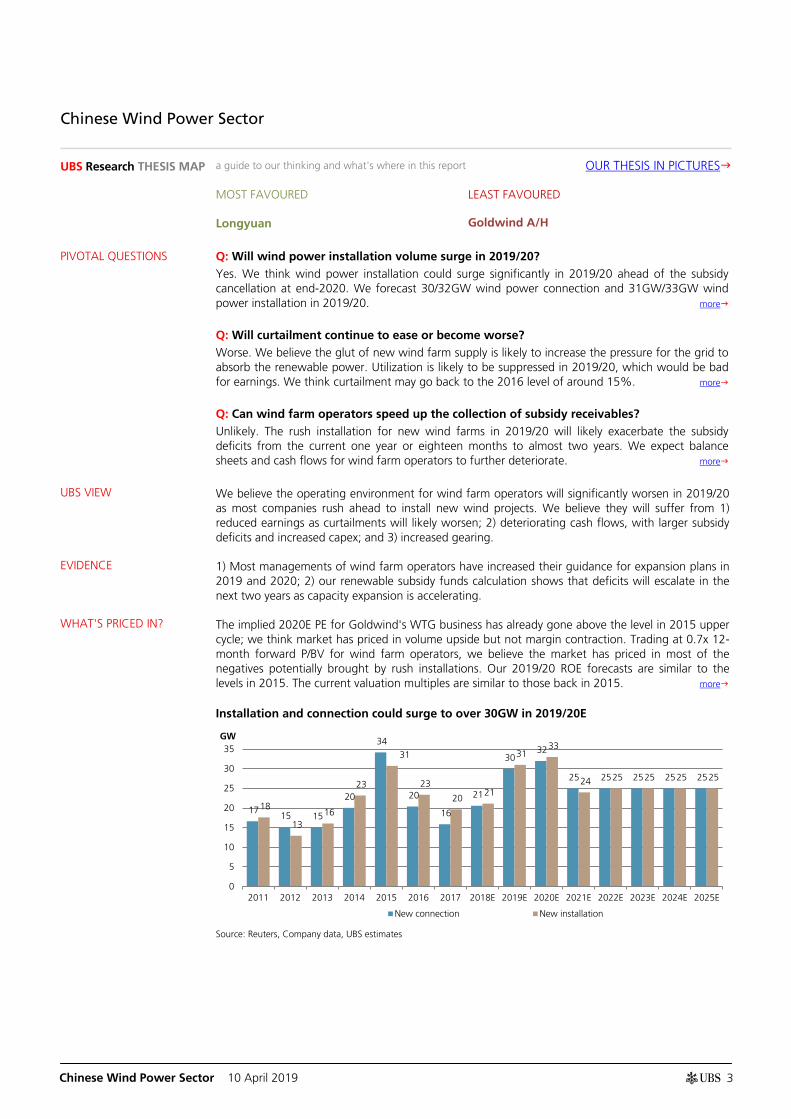
Q: Will wind power installation volume surge in 2019/20? UBS VIEW
Yes. We think wind power installation could surge significantly in 2019/20 ahead of the subsidy cancellation by end-2020. This is because downstream operators have large amounts of projects on hand that have been approved but that are not operated, and they are keen to install as much as possible before approved subsidies expire by end-2020. We forecast 30/32GW wind power connection and 31GW/33GW wind power installation in 2019/20.
EVIDENCE
Major wind farm operators all raised their capacity expansion guidance for 2019/20 during the 2018 result briefings.
Our IRR analysis suggests that projects with a Feed in Tariff (FiT) can generate higher IRR, even considering the impact of higher curtailment, delayed grid connection, and subsidy payments.
WHAT'S PRICED IN?
We think the market has largely priced in bullish installation volume for WTG manufacturers, but has not yet fully factored in the impact for downstream wind farm operators.
Wind power installation likely to surge in 2019/20
We think wind power installation could surge in 2019/20 ahead of the subsidy cancellation. This is because downstream operators have large amounts of projects on hand which that have been approved but that are not operated, and they are keen to install as much as possible before approved subsidies expire by end-2020. We forecast 30/32GW wind power connection and 31GW/33GW wind power installation in 2019/20
Figure 2: Wind power installation and connection in China
Source: National Energy Administration (NEA), Chinese Wind Energy Association (CWEA), UBS estimates
17 15 15
20
34
20
16
21
30 32
25 25 25 25 25
18
13 16
23
31
23
20 21
31 33
24 25 25 25 25
0
5
10
15
20
25
30
35
2011 2012 2013 2014 2015 2016 2017 2018E 2019E 2020E 2021E 2022E 2023E 2024E 2025E
GW
New connection New installation
Chinese Wind Power Sector 10 April 2019
6
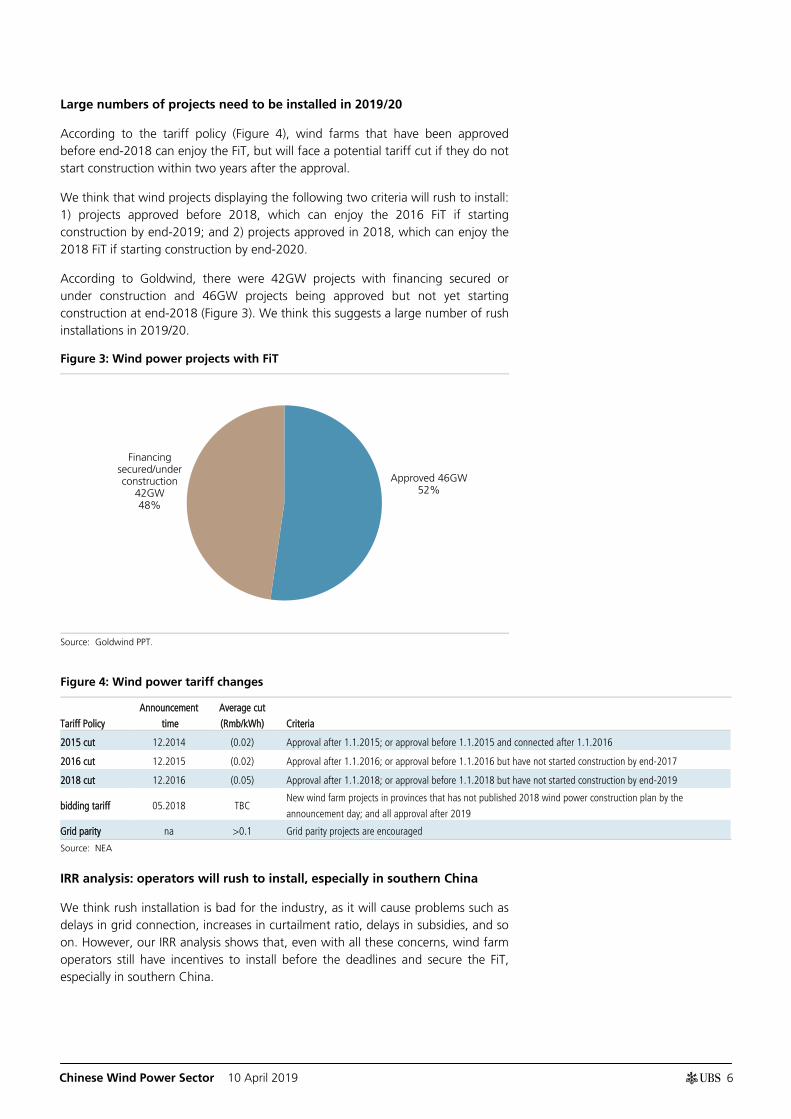
Large numbers of projects need to be installed in 2019/20
According to the tariff policy (Figure 4), wind farms that have been approved before end-2018 can enjoy the FiT, but will face a potential tariff cut if they do not start construction within two years after the approval.
We think that wind projects displaying the following two criteria will rush to install: 1) projects approved before 2018, which can enjoy the 2016 FiT if starting construction by end-2019; and 2) projects approved in 2018, which can enjoy the 2018 FiT if starting construction by end-2020.
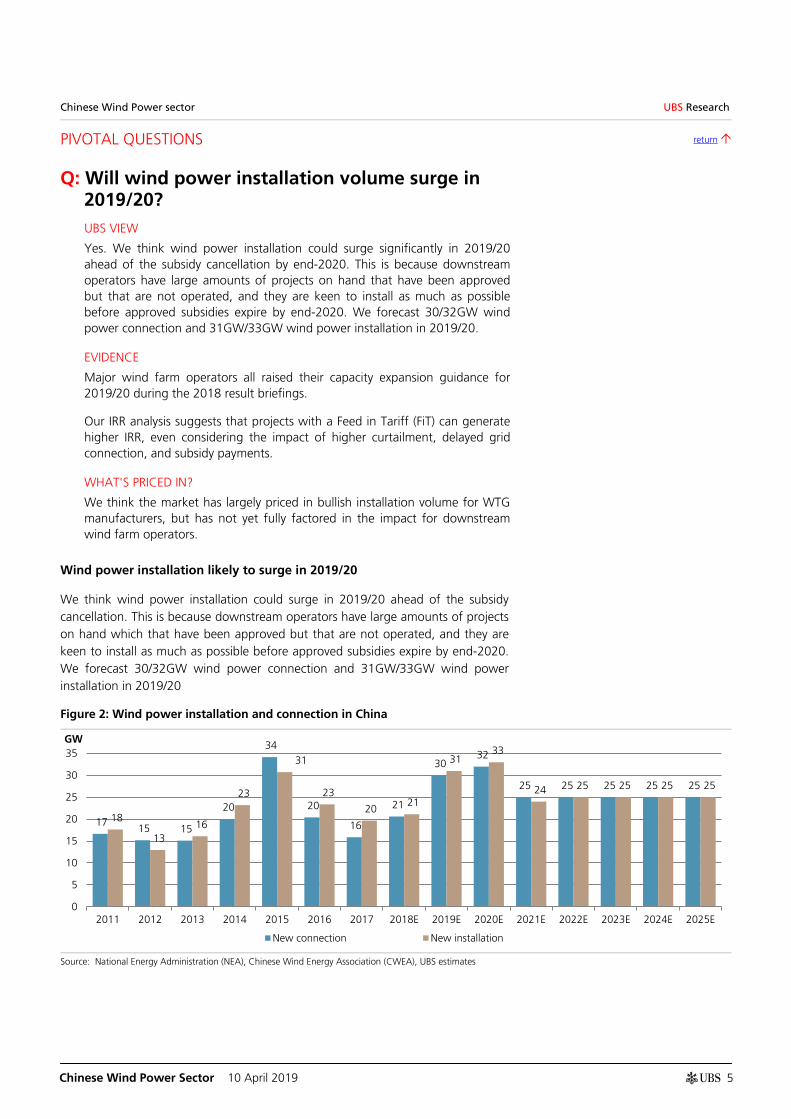
According to Goldwind, there were 42GW projects with financing secured or under construction and 46GW projects being approved but not yet starting construction at end-2018 (Figure 3). We think this suggests a large number of rush installations in 2019/20.
Figure 3: Wind power projects with FiT
Source: Goldwind PPT.
Figure 4: Wind power tariff changes
Tariff Policy
Announcement
time
Average cut
(Rmb/kWh) Criteria
2015 cut 12.2014 (0.02) Approval after 1.1.2015; or approval before 1.1.2015 and connected after 1.1.2016
2016 cut 12.2015 (0.02) Approval after 1.1.2016; or approval before 1.1.2016 but have not started construction by end-2017
2018 cut 12.2016 (0.05) Approval after 1.1.2018; or approval before 1.1.2018 but have not started construction by end-2019
bidding tariff 05.2018 TBC New wind farm projects in provinces that has not published 2018 wind power construction plan by the
announcement day; and all approval after 2019
Grid parity na >0.1 Grid parity projects are encouraged
Source: NEA
IRR analysis: operators will rush to install, especially in southern China
We think rush installation is bad for the industry, as it will cause problems such as delays in grid connection, increases in curtailment ratio, delays in subsidies, and so on. However, our IRR analysis shows that, even with all these concerns, wind farm operators still have incentives to install before the deadlines and secure the FiT, especially in southern China.
Approved 46GW 52%
Financing secured/under construction
42GW 48%

Chinese Wind Power Sector 10 April 2019
7
In Figure 5 and Figure 6, we analyse wind projects’ IRRs under different scenarios, for regions in southern and northern China (we use Inner Mongolia as an example), respectively.
We assume that 1) if the projects are constructed before a deadline, it could enjoy FiT but will face a one-year delay in grid connection and subsidy payment, and a higher curtailment ratio in northern China; 2) if the projects are constructed after 2020, it is applied to local coal-fired tariffs with no subsidy, but they will face no curtailment or delays in grid connection.
Our analysis shows that wind farms in southern China will have large incentives to install in a rush, as their project IRR may drop by 2.4ppts under grid parity. But in areas such as Inner Mongolia, where curtailment is a concern and current subsidies are low, wind farms will not be hurt much under grid parity.
Figure 5: Wind project IRR under different scenarios – South (Region IV)
Capex
(Rmb
m/MW)
Tariff
(Rmb/kWh)
Subsidy
(Rmb/kWh)
Utilization
hours Delay in connection? Delay in subsidy? IRR
Normal case 8.0 0.570 0.180 2,100 No 1 year 9.10%
Constructed by 2020 8.0 0.570 0.180 2,100 1 year 2 year 7.40%
Construct after 2020 7.5 0.390 - 2,100 No No 5.00%
Source: UBS estimates
Figure 6: Wind project IRR under different scenarios – Inner Mongolia (Region I)
Capex
(Rmb
m/MW)
Tariff
(Rmb/kWh)
Subsidy
(Rmb/kWh)
Utilization
hours Delay in connection? Delay in subsidy? IRR
Normal case 7.0 0.400 0.107 3,000 No 1 year 11.00%
Constructed by 2020 7.0 0.400 0.107 2,850 1 year 2 year 8.30%
Construct after 2020 6.5 0.293 - 3,150 No No 8.20%
Source: UBS estimates
Downstream operators have all raised installation targets for 2019/20
Major wind farm operators all raised their installation targets for 2019/20 during the 2018 result briefings (Figure 7), as they all have large number of projects on hand that have been approved but that are not operated yet. And over 50% of these projects are in southern China.
Figure 7: Major operators plan to accelerate installation in 2019/20
Company Projects – approved but not operated Guidance on capacity expansion
Longyuan 7GW 1.2-1.5GW in 2019, more in 2020
Huaneng Renewable 4.2GW 1.6GW in 2019, more in 2020
Huaneng Power Na >2GW in 2019
CR Power 9GW 1.7GW in 2019, 2.3GW in 2020
Source: Company guidance

Chinese Wind Power Sector 10 April 2019
8
Chinese Wind Power sector UBS Research
Sector Q2
PIVOTAL QUESTIONS return
Q: Will curtailment continue to ease or turn worse? UBS VIEW
Worse. We believe the glut of new wind farm supply is likely to increase the pressure for the grid to absorb the renewable power. Utilisation is likely to be suppressed in 2019/20, which would be bad for earnings. We expect the curtailment ratio to go back to the 2016 level of around 15%.
EVIDENCE
We looked at the level of curtailment relative to power demand and the new capacity additions for renewables, and believe that curtailment may turn to be as bad as the level of 2016.
WHAT'S PRICED IN?
We believe investors have priced in modest curtailment risks.
The curtailment ratio is usually a function of overall power demand growth and the speed of capacity additions. Weak power demand growth and high capacity additions usually could result in a high curtailment ratio, and vice versa.
Figure 8 and Figure 9 show the historical curtailment ratio for wind farms compared with power demand growth and wind farm additions. As we expect new additions in 2019/20 could reach levels similar to those in 2015 with weakening power demand to potentially 4-5%, we believe the curtailment ratio for 2019/20 could be similar to that in 2016 at around 15%. This is a substantial increase from the latest Q418 curtailment ratio of only 5%.
We therefore believe that utilisation hours for wind farms will be under pressure, at least for two consecutive years. We expect utilisation hours for 2019/20 to be similar to the levels in 2016 for listed companies, at around 2,000 hours.
Figure 8: Curtailment ratio for wind farms Figure 9: National capacity addition for wind farms versus national power demand growth
Source: NEA Source: CEIC, UBS estimates
0%
5%
10%
15%
20%
25%
30%
Q11
4
Q21
4
Q31
4
Q41
4
Q11
5
Q21
5
Q31
5
Q41
5
Q11
6
Q21
6
Q31
6
Q41
6
Q11
7
Q21
7
Q31
7
Q41
7
Q11
8
Q21
8
Q31
8
Q41
8
2019
E
2020
E
0.0%
1.0%
2.0%
3.0%
4.0%
5.0%
6.0%
7.0%
8.0%
0
5
10
15
20
25
30
35
40
2014 2015 2016 2017 2018 2019E 2020E
Capacity additions (MW) Power demand (YoY, RHS)
Chinese Wind Power Sector 10 April 2019
9
Zone IV means no curtailment?
Although most of the new projects added are in Zone IV, where curtailment was almost zero, we believe the inflow of new projects in Zone IV developed regions could likely crowd out the demand of renewable power imports in Zones I to III. This situation could be similar to those in 2015 and 2016, when most of the new projects added were at non-curtailment regions in Zone IV, and the overall wind power curtailment ratio still increased substantially.

Chinese Wind Power Sector 10 April 2019
10
Chinese Wind Power sector UBS Research
Sector Q3
PIVOTAL QUESTIONS return
Q: Can wind farm operators speed up the collection of subsidy receivables? UBS VIEW
Unlikely. The rush installation for new wind farms in 2019/20 is likely to exacerbate the subsidy deficits. We expect balance sheets and cash flows for wind farm operators to further deteriorate.
EVIDENCE
Our calculation shows that the annual subsidy deficit will continue to escalate to around Rmb108bn in 2020E, from Rmb66bn in 2018, with an increase of 63% in two years. It will be increasingly difficult for the wind farm operators to receive subsidies in a timely manner, and we expect receivable days to further increase from the current one year or eighteen months to close to two years.
WHAT'S PRICED IN?
We believe investors have largely priced in long receivable days, but may not have expected this to further exacerbate.
Annual subsidy deficit could increase by 48% from 2018 to 2020
As shown in Figure 2, the annual subsidy deficit grew from Rmb27bn in 2016 to Rmb66bn in 2018. We estimate that the annual deficit could rise to and peak out at Rmb105bn by the end of 2020, before it gradually grinds down to below Rmb100bn by 2025E.
This exercise shows that 1) in 2019/20E, the annual subsidy deficit will increase to Rmb88/98bn p.a., almost 33%/48% increases compared to that of 2018, This implies the subsidy receivable days will likely lengthen from currently around a year or eighteen months to almost two years; 2) cash flow will likely deteriorate substantially for wind farm operators because the capex they spent is unlikely to have cash coming back, at least for the subsidies, until two years later.
Our estimate assumes that the capacity addition will accelerate to 30/32GW p.a. for 2019/20 for wind farms, and that the subsidies for new projects in 2021 and after will be completely gone, such that the subsidy deficit will start to shrink in 2022 as the utilisation rate stabilises in the long term.

Chinese Wind Power Sector 10 April 2019
11
Figure 10: Renewable subsidy account calculation
(Rmb/kWh) 2016 2017 2018 2019E 2020E 2021E 2022E 2023E 2024E 2025E
Surcharge income (cash inflow)
Renewable energy surcharge (Rmb/kWh)
Non-residential/agricultural 0.019 0.019 0.019 0.019 0.019 0.019 0.019 0.019 0.019 0.019
Residential 0.001 0.001 0.001 0.001 0.001 0.001 0.001 0.001 0.001 0.001
Agricultural - - - - - - - - - -
Power consumption (kWh bn)
Non-residential/agricultural 5,007 5,323 5,750 6,066 6,339 6,592 6,856 7,130 7,415 7,712
Residential 805 870 969 1,022 1,068 1,110 1,155 1,201 1,249 1,299
Agricultural 108 116 127 134 140 145 151 157 164 170
Implied surcharge income (Rmb bn) 96 102 110 116 122 126 131 137 142 148
Subsidy paid (cash outflow)
Wind power generation (kWh bn) 241 305 366 384 443 523 602 655 708 760
Solar power generation (kWh bn) 68 119 155 244 307 379 456 537 621 708
Wind subsidy (Rmb/kWh) 0.22 0.22 0.21 0.21 0.20 0.18 0.17 0.15 0.14 0.13
Solar subsidy (Rmb/kWh) 0.57 0.51 0.46 0.40 0.33 0.27 0.23 0.19 0.17 0.15
Total subsidy required (91) (127) (148) (175) (189) (197) (204) (205) (206) (207)
Actual surcharge collected 65 71 83 87 91 95 99 103 107 111
Collection rate 68% 69% 75% 75% 75% 75% 75% 75% 75% 75%
Annual surplus / (deficit), based on actual collection rate (27) (56) (66) (88) (98) (102) (105) (103) (100) (96)
Accumulated (51) (107) (173) (261) (359) (462) (567) (670) (769) (865)
Wind capacity - year-end (GW) 151 167 188 218 250 275 300 325 350 375
New additions (GW) 20 16 21 30 32 25 25 25 25 25
Solar capacity - year end (GW) 77 127 172 217 272 332 395 461 529 599
New additions (GW) 35 50 44 45 55 60 63 66 68 70 Source: UBS estimates
A key challenge is the delay of subsidies to renewables in China. China renewable energy operators, wind and solar mostly, are entitled to tariff subsidies that have been in place since 2009 and 2011, respectively. The tariffs that renewable energy operators are entitled to are made of two parts—benchmark coal-fired tariffs (around Rmb0.4/kWh) and the tariff subsidies on top of this, which add up to the total tariffs. The benchmark coal-fired tariffs are settled by the grid company in a timely manner, but the tariff subsidies, which are roughly Rmb0.2/kWh for wind and Rmb0.6/kWh for solar, are settled by the Ministry of Finance via the renewable energy subsidies fund.
According its original plans, the Ministry of Finance was supposed to pass on the tariffs subsidy burden to end-users, as end-users have to pay a renewable energy surcharge whenever they consume a unit of electricity. This surcharge should form an inflow of funds to the renewable energy subsidies fund, while the tariffs subsidies are the outflow of funds from it.
However, over the past few years, the fund has been facing severe deficits. This is because the amount of fund inflow has been growing slowly at the pace of overall power demand growth in the mid-single digits, while the end-user surcharge per one unit of electricity has remained unchanged. On the other hand, the amount of fund outflow has grown significantly, in the double digits, given strong growth in solar and wind capacity. In addition, some end-users have avoided paying the surcharge to the renewable energy fund. These are mostly captive power plants that do not pay electricity bills to the grid companies—thus, they have been able to indirectly avoid the surcharge payments.

Chinese Wind Power Sector 10 April 2019
12
Cash flow for wind farm operators will deteriorate
We believe cash flow for wind farm operators will be under substantial pressure in 2019 and 2020. This is because operating cash flow could be suppressed, as wind farm utilisation hours were reduced and the current subsidies receivable days of around a year to eighteen months could surge to close to two years. In addition, investing cash outflow will increase as most wind farm operators under our coverage have increased their capacity expansion plans for 2019/20 to get their projects completed before the subsidies are cut.
Figure 11 shows the free cash flow projection for wind farm operators; most of them will turn negative in 2019 and 2020 before recovering in 2021 and 2022. Figure 12 shows the accelerated capacity addition plan in 2019/20 for most operators.
Figure 11: Free cash flows for major wind farm operators under UBS coverage (Rmb m)
Source: Company data, UBS estimates
Figure 12: Capacity addition (MW) for major listed wind farm operators
Source: Company data, UBS estimates
(10,000)
(5,000)
0
5,000
10,000
15,000
2017 2018 2019E 2020E 2021E 2022E
Longyuan Huaneng Renewable China Resources Power
0
500
1,000
1,500
2,000
2,500
2017 2018 2019E 2020E 2021E 2022E
Longyuan Huaneng Renewable China Resources Power

Chinese Wind Power Sector 10 April 2019
13
Chinese Wind Power sector UBS Research
Sector priced in
WHAT'S PRICED IN? return
For wind equipment makers, please refer to the link below for the separate What's Priced In? section given the A- and H-share valuation differences (link)
Wind farm operators are trading at around 0.7x forward P/BV at around 8-9% ROE; this is similar to the levels when curtailment was relatively a serious issue in 2015-16 and the companies delivered similar ROE. As we forecast ROE for wind farm operators to stay low at least for 2019 and 2020, we believe the current valuations multiples are justified and most of the concerns are largely priced in.
Figure 13: Longyuan 12-month forward P/BV vs ROE Figure 14: Huaneng Renewable 12-month forward P/BV vs ROE
Source: Company data, Bloomberg, UBS estimates Source: Company data, Bloomberg, UBS estimates
Figure 15: Earnings sensitivity of Chinese wind farm operators
Longyuan Huaneng Renewable
2019E 2020E 2019E 2020E
Wind segment
50 hours (0.5ppt) increase in wind utilisation rate 8.0% 7.7% 7.9% 8.1%
1% cut in wind tariffs for new wind farms -0.2% -0.7% -0.4% -0.4%
1% cut in wind tariffs for all wind farms -11.7% -22.9% -12% -12.5%
25bps increase in interest costs -2.7% -5.5% -3.6% -3.8%
Source: Company data, UBS estimates
Chinese Wind Power Sector 10 April 2019
14
Company pages

abc Global Research 10 April 2019
Chinese Wind Power Sector 10 April 2019
15
Xinjiang Goldwind Science & Technology No gold from this rush; downgrade to Sell
Downgrade to Sell on WTG margin concerns We downgrade Goldwind-H from Buy to Sell, as we think the market has priced in the wind turbine generator (WTG) volume surge in 2019 but ignored margin contractions. While Goldwind's external WTG sales volume could increase to over 8GW in 2019/20 due to rush installation, we think larger-than-expected margin contraction could fully offset the benefit. We forecast Goldwind's recurring earnings to decline 3% in 2019, and to peak in 2020E with 30% YoY growth. We also think its net gearing could reach 80% in 2020E, from 65% in 2015, due to lower cash inflow from WTG, higher downstream capex and longer subsidy delays. The current valuation of its WTG business has already exceeded that in the 2015 cycle, and we think that risk is skewed to the downside.
2019 WTG gross margin could be lower than expected Goldwind's 2018 WTG gross margin was down 6ppts, larger than our expectation, and we think this trend will continue in 2019. This is because industry average bidding prices for 2.0MW/2.5MW WTG dropped by 14/13% YoY in 2018, and most of these orders will be delivered in 2019. We estimate this will pressure down Goldwind's overall ASP by 6% in 2019E, driving its gross margin to go down by another 4ppts to 15% in 2019E. This suggests its WTG EBIT margin could drop to 2% in 2019E, making any impact from volume growth almost irrelevant.
Valuation for peak year does not look attractive Goldwind-H is now trading at 17x/13x 2019/20E PE. While this still looks reasonable, we think investors need to notice that about 40% of Goldwind's net profit will come from its wind farm business, which deserves a lower PE. Our analysis shows that implied PE for Goldwind's WTG business in 2019/20E is already 28x/18x, much higher than the 15.5x in 2015. That means, even for its peak earnings in 2020E, the PE has already exceeded the historical peak, not mentioning that 1) Goldwind's earnings will decline in 2021E, and 2) its WTG EBIT margin is 2-4% in 2019/20E versus 13% in 2015.
Valuation: downgrade to Sell; lower price target from HK$12.00 to HK$8.50 We base our price target on a sum-of-the-parts (SOTP) methodology, with valuation of each segment based on DCF. We cut our price target by about 30% due to 1) larger WTG margin contraction; 2) higher curtailment and longer subsidy delay in 2019-21. Our price target implies 14.5x 2020E PE for WTG sales, close to the 2015 peak, and 6x 2020E PE for wind farms, similar to other operators.
Equities
China
Electric Components & Equipment
12-month rating Sell Prior: Buy
12m price target HK$8.50
Prior: HK$12.00
Price HK$10.28
RIC: 2208.HK BBG: 2208 HK
Trading data and key metrics 52-wk range HK$13.98-5.30
Market cap. HK$43.4bn/US$5.54bn
Shares o/s 4,225m (ORD)
Free float 85%
Avg. daily volume ('000) 10,252
Avg. daily value (m) HK$93.9
Common s/h equity (12/19E) Rmb30.2bn
P/BV (12/19E) 1.2x
Net debt / EBITDA (12/19E) 4.1x
EPS (UBS, diluted) (Rmb) From To % ch Cons.
12/19E 0.71 0.51 -28 0.81 12/20E 0.88 0.67 -25 0.99 12/21E 0.95 0.61 -35 1.18
Abigail Sun Analyst
S1460518040002 [email protected]
+86-213-866 8637
Wenzhuo Du Analyst
S1460516050001 [email protected]
+86-213-866 8960
Alex Liu Analyst
S1460515080001 [email protected]
+86-213-866 8857
Highlights (Rmbm) 12/16 12/17 12/18 12/19E 12/20E 12/21E 12/22E 12/23E Revenues 26,174 24,971 28,590 36,857 40,161 33,060 34,957 35,756 EBIT (UBS) 3,685 3,310 3,360 3,423 4,381 4,388 4,784 5,103 Net earnings (UBS) 2,681 2,271 2,241 2,166 2,810 2,581 2,933 3,208 EPS (UBS, diluted) (Rmb) 0.70 0.60 0.59 0.51 0.67 0.61 0.69 0.76 DPS (Rmb) 0.15 0.20 0.30 0.24 0.26 0.39 0.43 0.46 Net (debt) / cash (11,320) (15,650) (18,779) (20,741) (30,230) (28,007) (26,727) (25,147)
Profitability/valuation 12/16 12/17 12/18 12/19E 12/20E 12/21E 12/22E 12/23E EBIT margin % 14.1 13.3 11.8 9.3 10.9 13.3 13.7 14.3 ROIC (EBIT) % 14.9 10.7 9.3 8.0 8.3 7.5 8.2 8.7 EV/EBITDA (core) x 7.5 8.8 9.9 10.6 9.3 9.4 8.4 7.7 P/E (UBS, diluted) x 9.9 13.1 13.9 17.2 13.2 14.4 12.7 11.6 Equity FCF (UBS) yield % (9.2) (6.6) (8.9) (14.7) (21.5) 10.6 9.3 10.4 Net dividend yield % 2.1 2.6 3.6 2.8 2.9 4.4 4.8 5.2 Source: Company accounts, Thomson Reuters, UBS estimates. Metrics marked as (UBS) have had analyst adjustments applied. Valuations: based on an average share price that year, (E): based on a share price of HK$10.28 on 09 Apr 2019 18:27 HKT

Chinese Wind Power Sector 10 April 2019
16
Goldwind - H Sell (Price target HK$8.50)
CO1 P2
UBS-S Research THESIS MAP
a guide to our thinking and what's where in this report
PIVOTAL QUESTIONS Q: Will wind power installation volume surge in 2019/20? Yes. We think wind power installation could surge significantly in 2019/20 ahead of the subsidy cancellation. We forecast 30/32GW wind power connection and 31GW/33GW wind power installation in 2019/20. We expect Goldwind's external WTG sales volume to reach 8.4GW and 8.9GW in 2019E and 2020E, respectively. more
Q: Will WTG margin contraction fully offset the impact from volume growth in 2019? Likely. We think Goldwind's 2019 WTG gross margin faces large pressure because the industry average WTG bidding price dropped by over 10% YoY in 2018, and most of these orders will be delivered in 2019. We estimate the price pressure will bring down its WTG gross margin to around 15% and EBIT margin to around 2% in 2019E. more
Q: Will curtailment continue to ease or worsen? Worsen. We believe the glut of new wind farm supply is likely to increase the pressure for the grid to absorb the renewable power. Utilisation is likely to be suppressed in 2019/20 which is bad for earnings. We expect receivable days to surge from a year or eighteen months to almost two years. more
UBS-S VIEW
We downgrade Goldwind-H to Sell on margin concerns. We expect its external WTG sales volume to increase to over 8GW in 2019/20E due to rush installation, but larger-than-expected margin contraction could fully offset the benefit. Its wind farm business should face strong growth in capacity, but higher curtailment ratios and subsidy delays. We forecast Goldwind's recurring earnings to decline 3% in 2019, and to peak in 2020E with 30% YoY growth.
EVIDENCE
Our IRR analysis shows that even with delays in subsidy and grid connection, the operators are still incentivized to rush install to secure the FiT. Our margin analysis shows that Goldwind's WTG sales volume growth in 2019E will be fully offset by a margin squeeze.
WHAT'S PRICED IN? Current share price-implied PE for WTG business is 18x for 2020E peak earnings, much higher than the 15x in 2015, suggesting the market has priced in the upside in volume but not downside in margin.
more
UPSIDE / DOWNSIDE SPECTRUM
Value drivers 2019
WTG external sales volume
WTG gross margin
Wind farm utilization hours
Wind farm attributable capacity addition
HK$12.50 upside 9.5GW 17% 2,300 1.5GW HK$8.50 base 8.4GW 15% 2,244 1.1GW HK$6.50 downside 7.5GW 13% 2,150 0.8GW Source: UBS estimates
more
COMPANY DESCRIPTION Xinjiang Goldwind Science & Technology (Goldwind) is a leading manufacturer of wind turbine generators (WTG) in China. Goldwind was established in 1998 and had the largest WTG market share in China over 2011-18. more
Abigail Sun, Analyst, S1460518040002, [email protected], +86-213-866 8637

Chinese Wind Power Sector 10 April 2019
17
Goldwind – H UBS-S Research CO1 Q1
PIVOTAL QUESTIONS return
Q: Will WTG margin contraction fully offset the impact from volume growth in 2019?
UBS-S VIEW
Likely. We think Goldwind's 2019 WTG gross margin faces large pressure because the industry average WTG bidding price dropped by over 10% YoY in 2018, and most of these orders will be delivered in 2019. We estimate the price pressure will bring down its WTG gross margin to around 15% and EBIT margin to around 2% in 2019E. We expect Goldwind's WTG EBIT to drop 11% YoY in 2019E, despite a 43% increase in WTG sales volume.
EVIDENCE
WTG industry average bidding price dropped over 10% in 2018, and our analysis shows that it is highly related to Goldwind's WTG ASP with a one-year lag.
Our sensitivity analysis shows that Goldwind's net profit is not sensitive to WTG sales volume with WTGs’ current low margin.
WHAT'S PRICED IN?
We think investors know that Goldwind's gross margin will drop in 2019E, but do not expect it to fully offset the impact of WTG volume growth.
WTG margin drop could be larger than expected.
Goldwind's 2018 WTG gross margin dropped 6ppts to 19% due to the ASP drop and cost increases. We expect ASP pressure to push down its gross margin by another 4ppts, to 15% in 2019E, and gradually recover afterwards.
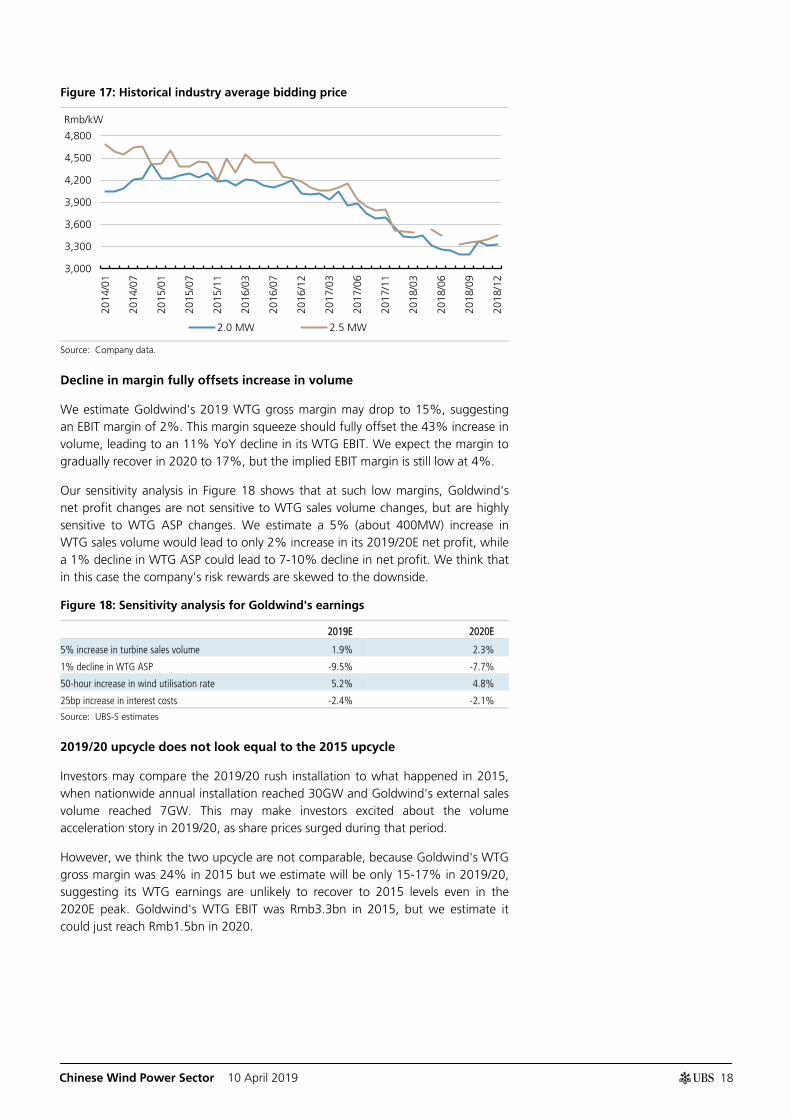
Figure 16 shows that historically Goldwind's WTG ASP is highly correlated to industry average bidding prices, with a one-year lag. The 2018 industry average bidding price for 2.0MW WTG dropped 14% YoY (Figure 17), and we estimate this could transfer to a 10% decline in its 2019 ASP, leading to a 6% decline in Goldwind's average WTG ASP.
Figure 16: Goldwind's WTG ASP vs. industry average bidding price (2.0MW, assuming a one-year lag)
Rmb/kw 2015 2016 2017 2018 2019E
Goldwind's WTG ASP – excl. VAT 3,709 3,568 3,476 3,302 2,972
YoY -4% -3% -5% -10%
Goldwind's WTG ASP – incl. VAT 4,340 4,174 4,067 3,830 3,358
Pre-year bidding average 4,170 4,244 4,144 3,847 3,323
Difference 4% -2% -2% 0% 1%
Note: We assume 17% VAT in 2015-17, 16% VAT in 2018 and 13% VAT in 2019. Source: Company data, UBS-S estimates
Chinese Wind Power Sector 10 April 2019
18
Figure 17: Historical industry average bidding price
Source: Company data.
Decline in margin fully offsets increase in volume
We estimate Goldwind's 2019 WTG gross margin may drop to 15%, suggesting an EBIT margin of 2%. This margin squeeze should fully offset the 43% increase in volume, leading to an 11% YoY decline in its WTG EBIT. We expect the margin to gradually recover in 2020 to 17%, but the implied EBIT margin is still low at 4%.
Our sensitivity analysis in Figure 18 shows that at such low margins, Goldwind's net profit changes are not sensitive to WTG sales volume changes, but are highly sensitive to WTG ASP changes. We estimate a 5% (about 400MW) increase in WTG sales volume would lead to only 2% increase in its 2019/20E net profit, while a 1% decline in WTG ASP could lead to 7-10% decline in net profit. We think that in this case the company's risk rewards are skewed to the downside.
Figure 18: Sensitivity analysis for Goldwind's earnings
2019E 2020E
5% increase in turbine sales volume 1.9% 2.3%
1% decline in WTG ASP -9.5% -7.7%
50-hour increase in wind utilisation rate 5.2% 4.8%
25bp increase in interest costs -2.4% -2.1%
Source: UBS-S estimates
2019/20 upcycle does not look equal to the 2015 upcycle
Investors may compare the 2019/20 rush installation to what happened in 2015, when nationwide annual installation reached 30GW and Goldwind's external sales volume reached 7GW. This may make investors excited about the volume acceleration story in 2019/20, as share prices surged during that period.
However, we think the two upcycle are not comparable, because Goldwind's WTG gross margin was 24% in 2015 but we estimate will be only 15-17% in 2019/20, suggesting its WTG earnings are unlikely to recover to 2015 levels even in the 2020E peak. Goldwind's WTG EBIT was Rmb3.3bn in 2015, but we estimate it could just reach Rmb1.5bn in 2020.
3,000
3,300
3,600
3,900
4,200
4,500
4,800
2014
/01
2014
/07
2015
/01
2015
/07
2015
/11
2016
/03
2016
/07
2016
/12
2017
/03
2017
/06
2017
/11
2018
/03
2018
/06
2018
/09
2018
/12
Rmb/kW
2.0 MW 2.5 MW

Chinese Wind Power Sector 10 April 2019
19
Figure 19: Goldwind’s WTG sales volume and margin changes
Note: Margin includes sales of spare parts. Source: Company data, UBS estimates
0
1,000
2,000
3,000
4,000
5,000
6,000
7,000
8,000
9,000
10,000
0%
5%
10%
15%
20%
25%
30%
35%
40%
2010 2011 2012 2013 2014 2015 2016 2017 2018 2019E 2020E
MW
WTG external sales volume EBIT margin Gross margin
Chinese Wind Power Sector 10 April 2019
20
Goldwind – H UBS-S Research CO1 WPI
WHAT'S PRICED IN? return
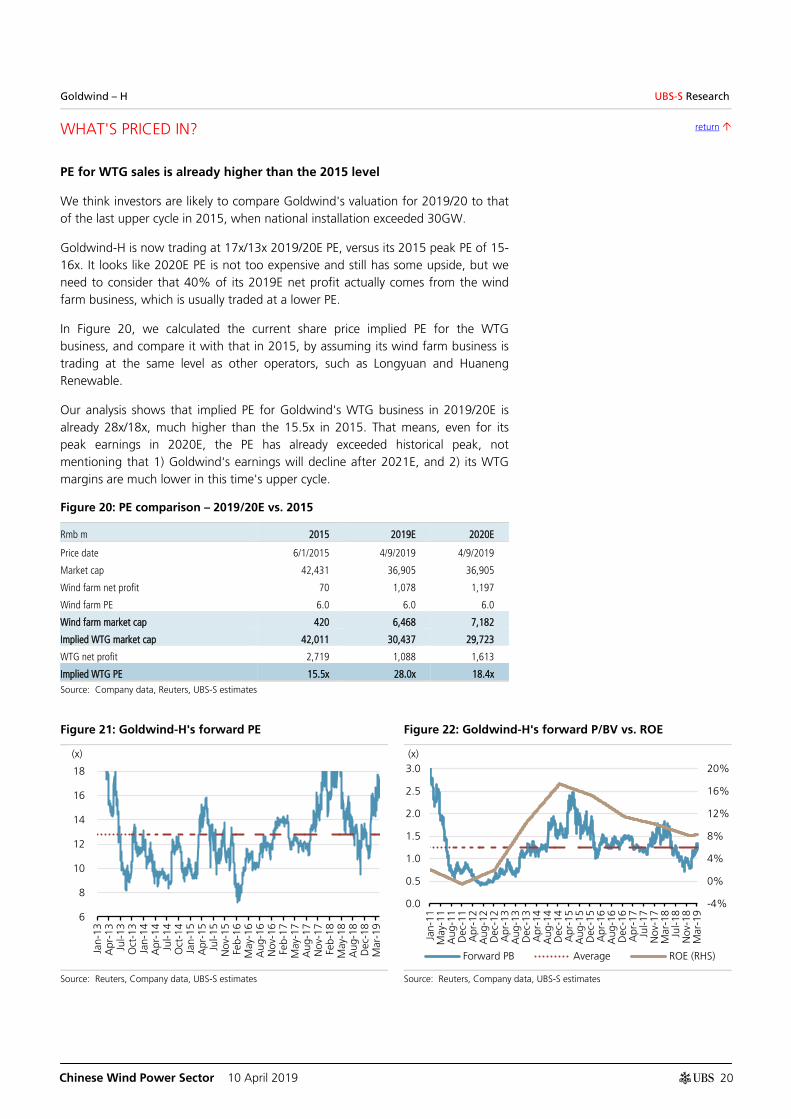
PE for WTG sales is already higher than the 2015 level
We think investors are likely to compare Goldwind's valuation for 2019/20 to that of the last upper cycle in 2015, when national installation exceeded 30GW.
Goldwind-H is now trading at 17x/13x 2019/20E PE, versus its 2015 peak PE of 15-16x. It looks like 2020E PE is not too expensive and still has some upside, but we need to consider that 40% of its 2019E net profit actually comes from the wind farm business, which is usually traded at a lower PE.
In Figure 20, we calculated the current share price implied PE for the WTG business, and compare it with that in 2015, by assuming its wind farm business is trading at the same level as other operators, such as Longyuan and Huaneng Renewable.
Our analysis shows that implied PE for Goldwind's WTG business in 2019/20E is already 28x/18x, much higher than the 15.5x in 2015. That means, even for its peak earnings in 2020E, the PE has already exceeded historical peak, not mentioning that 1) Goldwind's earnings will decline after 2021E, and 2) its WTG margins are much lower in this time's upper cycle.
Figure 20: PE comparison – 2019/20E vs. 2015
Rmb m 2015 2019E 2020E
Price date 6/1/2015 4/9/2019 4/9/2019
Market cap 42,431 36,905 36,905
Wind farm net profit 70 1,078 1,197
Wind farm PE 6.0 6.0 6.0
Wind farm market cap 420 6,468 7,182
Implied WTG market cap 42,011 30,437 29,723
WTG net profit 2,719 1,088 1,613
Implied WTG PE 15.5x 28.0x 18.4x
Source: Company data, Reuters, UBS-S estimates
Figure 21: Goldwind-H's forward PE Figure 22: Goldwind-H's forward P/BV vs. ROE
Source: Reuters, Company data, UBS-S estimates Source: Reuters, Company data, UBS-S estimates
6
8
10
12
14
16
18
Jan-
13A
pr-1
3Ju
l-13
Oct
-13
Jan-
14A
pr-1
4Ju
l-14
Oct
-14
Jan-
15A
pr-1
5Ju
l-15
Nov
-15
Feb-
16M
ay-1
6A
ug-1
6N
ov-1
6Fe
b-17
May
-17
Aug
-17
Nov
-17
Feb-
18M
ay-1
8A
ug-1
8D
ec-1
8M
ar-1
9
(x)
-4%
0%
4%
8%
12%
16%
20%
0.0
0.5
1.0
1.5
2.0
2.5
3.0
Jan-
11M
ay-1
1A
ug-1
1D
ec-1
1A
pr-1
2A
ug-1
2D
ec-1
2A
pr-1
3A
ug-1
3D
ec-1
3A
pr-1
4A
ug-1
4D
ec-1
4A
pr-1
5A
ug-1
5D
ec-1
5A
pr-1
6A
ug-1
6D
ec-1
6A
pr-1
7Ju
l-17
Nov
-17
Mar
-18
Jul-1
8N
ov-1
8M
ar-1
9
(x)
Forward PB Average ROE (RHS)

Chinese Wind Power Sector 10 April 2019
21
Figure 23 shows our revenue and earnings forecast versus consensus.
We are different from consensus in that: 1) our revenues are 23% below consensus in 2021E, because the market may expect rush installation to last to 2021, but we think it is unlikely that the grid/government can afford a three-year continuous rush installation; and 2) our earnings are much below consensus’s because we look at the recurring earnings, excluding disposal gains, while consensus may look at the reported earnings. Since about 30% of Goldwind's 2018 earnings are from disposal-related gains, we think this makes a big difference.
Figure 23: UBS versus consensus net profit (Rmb m)
Consensus UBS Difference
2019E 2020E 2021E 2019E 2020E 2021E 2019E 2020E 2021E
Revenue 37,696 43,141 43,899 36,857 40,161 33,060 -2% -7% -25%
Net profit 3,311 4,231 4,702 2,166 2,810 2,581 -35% -34% -45%
Source: Reuters, UBS-S estimates

Chinese Wind Power Sector 10 April 2019
22
Goldwind - H UBS-S Research CO1 UD
UPSIDE / DOWNSIDE SPECTRUM return
Value drivers 2019
WTG external sales volume
WTG gross margin
Wind farm utilization hours
Wind farm attributable capacity addition
HK$12.50 upside 9.5GW 17% 2,300 1.5GW HK$8.50 base 8.4GW 15% 2,244 1.1GW HK$6.50 downside 7.5GW 13% 2,150 0.8GW Source: UBS estimates
Goldwind is trading at HK$10.28 (as of 9 April 2019)
Risk to the current share price is skewed (1:1.7) to the downside
Goldwind-H is trading at HK$10.28 (as of 9 April 2019).
Upside (HK$12.50): In our upside scenario, we assume the total wind power installation in 2019 is higher than our expectation and reaches 38GW, suggesting about 9.5GW external sales for Goldwind given a 25% market share. The surge in volume may lead to some recovery in Goldwind's WTG gross margin, and we assume the margin contraction narrows to 2ppts YoY in 2019E. For wind farm operations, we factor in: 1) higher utilisation hours, assuming the curtailment issue in western China is solved; and 2) a higher capacity addition plan. In this scenario, we derive a valuation of HK$12.50 per share, implying 15x 2020E PE.
Base (HK$8.50): In our base case, we assume Goldwind's WTG volume could increase by 43%/7% to 8.4GW/8.9GW in 2019/20E, due to the rush installation of downstream operators. But we expect its WTG gross margin to contract by another 4ppts in 2019E and recover by 2ppts in 2020E, due to the delivery of 2018 cheap orders. For wind farms, we assume utilization hours can remain flattish in 2019E but drop to 2,200/2,100 in 2020/21E, as a result of rush installation in 2019/20E. We also assume Goldwind will accelerate its downstream investment, leading to 1.1/1.4GW net increases in its wind farm attributable capacity in 2019/20E.
Downside (HK$6.50): In our downside scenario, we assume wind power installation is lower than our expectation, at 30GW, as the power grid/government cannot support so much installation in one year. This will lead to 7.5GW external sales volume for Goldwind. We also assume Goldwind's WTG unit cost does not change in 2019, leading to a 5ppt drop in the WTG gross margin. For the wind farms, we assume higher curtailment ratio and smaller installations in 2019. In this case, we derive a downside valuation of HK$6.50 per share, implying 9x 2020E PE.
Chinese Wind Power Sector 10 April 2019
23
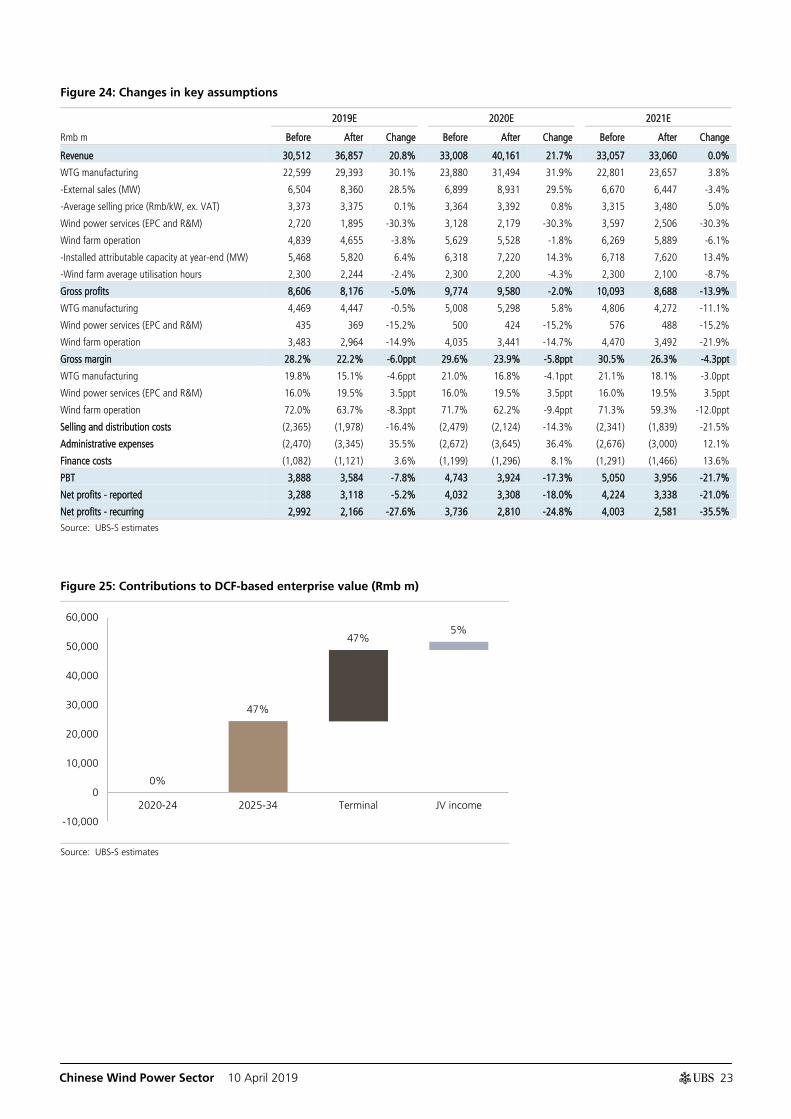
Figure 24: Changes in key assumptions
2019E 2020E 2021E
Rmb m Before After Change Before After Change Before After Change
Revenue 30,512 36,857 20.8% 33,008 40,161 21.7% 33,057 33,060 0.0%
WTG manufacturing 22,599 29,393 30.1% 23,880 31,494 31.9% 22,801 23,657 3.8%
-External sales (MW) 6,504 8,360 28.5% 6,899 8,931 29.5% 6,670 6,447 -3.4%
-Average selling price (Rmb/kW, ex. VAT) 3,373 3,375 0.1% 3,364 3,392 0.8% 3,315 3,480 5.0%
Wind power services (EPC and R&M) 2,720 1,895 -30.3% 3,128 2,179 -30.3% 3,597 2,506 -30.3%
Wind farm operation 4,839 4,655 -3.8% 5,629 5,528 -1.8% 6,269 5,889 -6.1%
-Installed attributable capacity at year-end (MW) 5,468 5,820 6.4% 6,318 7,220 14.3% 6,718 7,620 13.4%
-Wind farm average utilisation hours 2,300 2,244 -2.4% 2,300 2,200 -4.3% 2,300 2,100 -8.7%
Gross profits 8,606 8,176 -5.0% 9,774 9,580 -2.0% 10,093 8,688 -13.9%
WTG manufacturing 4,469 4,447 -0.5% 5,008 5,298 5.8% 4,806 4,272 -11.1%
Wind power services (EPC and R&M) 435 369 -15.2% 500 424 -15.2% 576 488 -15.2%
Wind farm operation 3,483 2,964 -14.9% 4,035 3,441 -14.7% 4,470 3,492 -21.9%
Gross margin 28.2% 22.2% -6.0ppt 29.6% 23.9% -5.8ppt 30.5% 26.3% -4.3ppt
WTG manufacturing 19.8% 15.1% -4.6ppt 21.0% 16.8% -4.1ppt 21.1% 18.1% -3.0ppt
Wind power services (EPC and R&M) 16.0% 19.5% 3.5ppt 16.0% 19.5% 3.5ppt 16.0% 19.5% 3.5ppt
Wind farm operation 72.0% 63.7% -8.3ppt 71.7% 62.2% -9.4ppt 71.3% 59.3% -12.0ppt
Selling and distribution costs (2,365) (1,978) -16.4% (2,479) (2,124) -14.3% (2,341) (1,839) -21.5%
Administrative expenses (2,470) (3,345) 35.5% (2,672) (3,645) 36.4% (2,676) (3,000) 12.1%
Finance costs (1,082) (1,121) 3.6% (1,199) (1,296) 8.1% (1,291) (1,466) 13.6%
PBT 3,888 3,584 -7.8% 4,743 3,924 -17.3% 5,050 3,956 -21.7%
Net profits - reported 3,288 3,118 -5.2% 4,032 3,308 -18.0% 4,224 3,338 -21.0%
Net profits - recurring 2,992 2,166 -27.6% 3,736 2,810 -24.8% 4,003 2,581 -35.5%
Source: UBS-S estimates
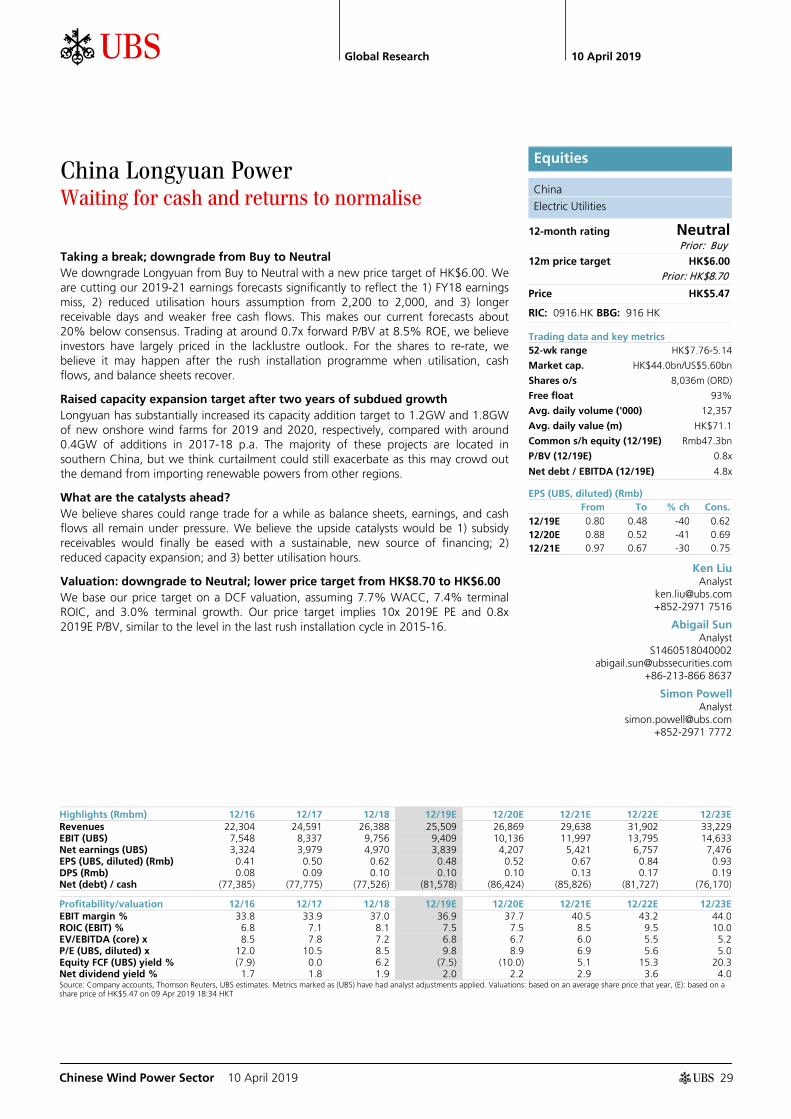
Figure 25: Contributions to DCF-based enterprise value (Rmb m)
Source: UBS-S estimates
0%
47%
47% 5%
-10,000
0
10,000
20,000
30,000
40,000
50,000
60,000
2020-24 2025-34 Terminal JV income

Chinese Wind Power Sector 10 April 2019
24
Figure 26: Valuation summary – Wind farm Figure 27: Valuation summary – WTG & others
Source: UBS-S estimates Source: UBS-S estimates

Chinese Wind Power Sector 10 April 2019
25
Goldwind - H UBS-S Research CO1 Co des
COMPANY DESCRIPTION return
Xinjiang Goldwind Science & Technology (Goldwind) is a leading manufacturer of wind turbine generators (WTG) in China. Goldwind was established in 1998 and had the largest WTG market share in China in 2011-18. It developed and began operating its own wind farm in 2012 and had 4.7GW of attributable connected wind farms as of end-2018. The company was listed on the Shenzhen Stock Exchange in December 2007 and on the Hong Kong Stock Exchange in October 2010.
Industry outlook
We think wind power installation will accelerate in 2019-20E to over 30GW p.a. because wind projects with fixed tariffs were all approved before end-2018 and need to start construction within two years. In the longer term, we think annual installation may maintain at an average of 24GW under bidding tariff/grid parity, as we expect development of large wind farms in north China together with UHV lines to drive future demand growth.
We expect WTG manufacturers' margins will trough in 2019E, and further downside under bidding tariff /grid parity is limited, as: 1) the already-published bidding tariff rule suggests regulators do not encourage fierce price competition; 2) downstream operators will focus more on LCOE instead of WTG price; and 3) WTG manufacturers' profitability under the current price environment is already thin, leaving them no incentive for another price war, in our view.
For downstream wind farm operators, we think they will suffer from reduced earnings as curtailment will likely worsen, deteriorating cash flow with larger subsidy deficit and increased capex as well as increasing gearing.
Revenues by segment (%)
Source: Company data, UBS-S estimates
EBIT by product segment
Rmb m 2016 2017 2018 2019E 2020E
WTG manufacturing 2,690 1,455 958 848 1,529
Wind farm operation 1,040 2,227 2,687 2,979 2,727
Others 239 341 620 477 552
Total EBIT 3,969 4,023 4,265 4,304 4,808
Non-recurring item (285) (713) (904) (882) (427)
Adjusted EBIT 3,685 3,310 3,360 3,423 4,381
Source: Company data, UBS-S estimates
WTG manufacturing
80%
Wind farm operation
13%
Others 7%

Chinese Wind Power Sector 10 April 2019
26
Xinjiang Goldwind Science & Technology (2208.HK)
Income statement (Rmbm) 12/16 12/17 12/18 12/19E % ch 12/20E % ch 12/21E 12/22E 12/23E Revenues 26,174 24,971 28,590 36,857 28.9 40,161 9.0 33,060 34,957 35,756 Gross profit 7,558 7,466 7,344 8,176 11.3 9,580 17.2 8,688 9,264 9,630 EBITDA (UBS) 4,609 4,434 4,741 5,086 7.3 6,407 26.0 6,707 7,246 7,707 Depreciation & amortisation (924) (1,124) (1,381) (1,663) 20.4 (2,026) 21.8 (2,319) (2,461) (2,604) EBIT (UBS) 3,685 3,310 3,360 3,423 1.9 4,381 28.0 4,388 4,784 5,103 Associates & investment income 192 210 266 314 18.0 354 12.5 323 334 344 Other non-operating income 0 0 0 0 - 0 - 0 0 0 Net interest (609) (743) (849) (1,035) -21.9 (1,238) -19.7 (1,441) (1,359) (1,283) Exceptionals (incl goodwill) 0 0 0 0 - 0 - 0 0 0 Profit before tax 3,267 2,778 2,778 2,703 -2.7 3,497 29.4 3,270 3,760 4,164 Tax (446) (342) (400) (387) 3.1 (522) -34.7 (519) (651) (777) Profit after tax 2,821 2,436 2,378 2,315 -2.6 2,975 28.5 2,751 3,108 3,387 Preference dividends and Minorities (140) (165) (137) (150) -8.9 (164) -9.9 (171) (175) (179) Extraordinary items 285 713 904 882 -2.5 427 -51.6 686 673 661 Net earnings (local GAAP) 2,966 2,984 3,145 3,047 -3.1 3,237 6.2 3,267 3,606 3,869 Net earnings (UBS) 2,681 2,271 2,241 2,166 -3.4 2,810 29.8 2,581 2,933 3,208 Tax rate (%) 13.7 12.3 14.4 14.3 -0.4 14.9 4.1 15.9 17.3 18.7
Per share (Rmb) 12/16 12/17 12/18 12/19E % ch 12/20E % ch 12/21E 12/22E 12/23E EPS (UBS, diluted) 0.70 0.60 0.59 0.51 -12.9 0.67 29.8 0.61 0.69 0.76 EPS (local GAAP, diluted) 0.78 0.78 0.83 0.72 -12.7 0.77 6.2 0.77 0.85 0.91 EPS (UBS, basic) 0.70 0.60 0.59 0.51 -12.9 0.67 29.8 0.61 0.69 0.76 Net DPS (Rmb) 0.15 0.20 0.30 0.24 -18.5 0.26 6.2 0.39 0.43 0.46 Book value per share 4.85 5.56 6.16 7.15 16.1 7.69 7.6 8.23 8.71 9.22 Average shares (diluted) 3,809.40 3,809.40 3,809.40 4,225.07 10.9 4,225.07 0.0 4,225.07 4,225.07 4,231.88
Balance sheet (Rmbm) 12/16 12/17 12/18 12/19E % ch 12/20E % ch 12/21E 12/22E 12/23E Cash and equivalents 8,267 7,730 5,050 6,560 29.9 1,179 -82.0 1,906 1,765 1,995 Other current assets 24,830 25,352 27,867 36,424 30.7 38,070 4.5 29,823 30,588 30,151 Total current assets 33,097 33,081 32,918 42,984 30.6 39,249 -8.7 31,729 32,353 32,146 Net tangible fixed assets 19,479 22,838 25,509 32,455 27.2 40,699 25.4 41,947 43,029 43,945 Net intangible fixed assets 1,250 2,752 3,965 3,830 -3.4 3,695 -3.5 3,561 3,426 3,291 Investments / other assets 10,612 14,116 18,973 19,287 1.7 19,641 1.8 19,964 20,298 20,642 Total assets 64,437 72,788 81,364 98,556 21.1 103,285 4.8 97,201 99,106 100,024 Trade payables & other ST liabilities 21,991 23,601 28,130 35,043 24.6 33,315 -4.9 26,413 27,629 27,691 Short term debt 2,672 5,999 3,470 3,470 0.00 3,470 0.00 3,470 3,470 3,470 Total current liabilities 24,663 29,600 31,601 38,513 21.9 36,786 -4.5 29,883 31,099 31,161 Long term debt 15,419 15,886 18,865 22,336 18.4 26,443 18.4 24,948 23,527 22,177 Other long term liabilities 3,656 3,827 4,424 4,424 0.0 4,424 0.0 4,424 4,424 4,424 Preferred shares 1,495 1,495 1,495 1,495 0.00 1,495 0.00 1,495 1,495 1,495 Total liabilities (incl pref shares) 45,233 50,808 56,384 66,768 18.4 69,148 3.6 60,749 60,545 59,257 Common s/h equity 18,481 21,192 23,466 30,221 28.8 32,506 7.6 34,756 36,800 38,937 Minority interests 723 788 1,514 1,567 3.5 1,631 4.1 1,695 1,761 1,830 Total liabilities & equity 64,437 72,788 81,364 98,556 21.1 103,285 4.8 97,201 99,106 100,024
Cash flow (Rmbm) 12/16 12/17 12/18 12/19E % ch 12/20E % ch 12/21E 12/22E 12/23E Net income (before pref divs) 3,003 3,055 3,217 3,118 -3.1 3,308 6.1 3,338 3,677 3,940 Depreciation & amortisation 924 1,124 1,381 1,663 20.4 2,026 21.8 2,319 2,461 2,604 Net change in working capital (807) (885) (856) (1,759) -105.5 (3,374) -91.8 1,345 451 499 Other operating (18) (270) (588) 708 - 858 21.2 1,065 984 908 Operating cash flow 3,103 3,023 3,153 3,730 18.3 2,818 -24.4 8,066 7,573 7,951 Tangible capital expenditure (5,501) (4,843) (5,943) (9,177) -54.4 (10,795) -17.6 (4,135) (4,105) (4,075) Intangible capital expenditure (152) (63) (83) 0 - 0 - 0 0 0 Net (acquisitions) / disposals (1,405) (2,313) (4) 864 - 714 -17.3 724 717 711 Other investing 47 120 (84) 178 - 178 - 178 178 178 Investing cash flow (7,011) (7,098) (6,114) (8,136) -33.1 (9,903) -21.7 (3,234) (3,210) (3,186) Equity dividends paid (1,313) (547) (711) (1,056) -48.5 (1,023) 3.1 (1,087) (1,633) (1,803) Share issues / (buybacks) 1,495 0 0 4,693 - 0 - 0 0 0 Other financing (699) (883) 304 (1,193) - (1,380) -15.72 (1,522) (1,450) (1,381) Change in debt & pref shares 5,763 4,812 1,609 3,472 115.81 4,107 18.30 (1,496) (1,421) (1,350) Financing cash flow 5,247 3,382 1,201 5,916 392.4 1,704 -71.2 (4,105) (4,504) (4,534) Cash flow inc/(dec) in cash 1,338 (693) (1,759) 1,510 - (5,381) - 727 (141) 230 FX / non cash items 628 156 (920) 0 100.0 0 - 0 0 0 Balance sheet inc/(dec) in cash 1,966 (537) (2,679) 1,510 - (5,381) - 727 (141) 230 Source: Company accounts, UBS estimates. (UBS) metrics use reported figures which have been adjusted by UBS analysts.

Chinese Wind Power Sector 10 April 2019
27
Xinjiang Goldwind Science & Technology (2208.HK)
Valuation (x) 12/16 12/17 12/18 12/19E 12/20E 12/21E 12/22E 12/23E P/E (local GAAP, diluted) 9.0 9.9 9.9 12.2 11.5 11.4 10.3 9.6 P/E (UBS, diluted) 9.9 13.1 13.9 17.2 13.2 14.4 12.7 11.6 P/CEPS 7.4 8.7 8.6 9.7 7.7 7.6 6.9 6.4 Equity FCF (UBS) yield % (9.2) (6.6) (8.9) (14.7) (21.5) 10.6 9.3 10.4 Net dividend yield (%) 2.1 2.6 3.6 2.8 2.9 4.4 4.8 5.2 P/BV x 1.4 1.4 1.3 1.2 1.1 1.1 1.0 1.0 EV/revenues (core) 1.3 1.6 1.6 1.5 1.5 1.9 1.7 1.7 EV/EBITDA (core) 7.5 8.8 9.9 10.6 9.3 9.4 8.4 7.7 EV/EBIT (core) 9.4 11.8 13.9 15.8 13.6 14.3 12.7 11.6 EV/OpFCF (core) 7.7 9.0 10.1 10.9 9.4 9.5 8.5 7.8 EV/op. invested capital 1.4 1.3 1.3 1.3 1.1 1.1 1.0 1.0
Enterprise value (Rmbm) 12/16 12/17 12/18 12/19E 12/20E 12/21E 12/22E 12/23E Market cap. 27,859 28,461 32,375 37,179 37,179 37,179 37,179 37,179 Net debt (cash) 8,757 13,485 17,215 19,760 25,486 29,118 27,367 25,937 Buy out of minorities 676 755 1,151 1,541 1,599 1,663 1,728 1,795 Pension provisions/other 0 0 0 0 0 0 0 0 Total enterprise value 37,291 42,701 50,741 58,480 64,264 67,960 66,274 64,912 Non core assets (2,622) (3,693) (3,974) (4,326) (4,748) (5,198) (5,674) (5,674) Core enterprise value 34,669 39,008 46,767 54,155 59,516 62,763 60,600 59,237
Growth (%) 12/16 12/17 12/18 12/19E 12/20E 12/21E 12/22E 12/23E Revenue -12.3 -4.6 14.5 28.9 9.0 -17.7 5.7 2.3 EBITDA (UBS) 17.4 -3.8 6.9 7.3 26.0 4.7 8.0 6.4 EBIT (UBS) 8.9 -10.2 1.5 1.9 28.0 0.2 9.0 6.7 EPS (UBS, diluted) -2.4 -15.3 -1.3 -12.9 29.8 -8.2 13.7 9.2 Net DPS -58.2 37.5 48.5 -18.5 6.2 50.2 10.4 7.3
Margins & Profitability (%) 12/16 12/17 12/18 12/19E 12/20E 12/21E 12/22E 12/23E Gross profit margin 28.9 29.9 25.7 22.2 23.9 26.3 26.5 26.9 EBITDA margin 17.6 17.8 16.6 13.8 16.0 20.3 20.7 21.6 EBIT margin 14.1 13.3 11.8 9.3 10.9 13.3 13.7 14.3 Net earnings (UBS) margin 10.2 9.1 7.8 5.9 7.0 7.8 8.4 9.0 ROIC (EBIT) 14.9 10.7 9.3 8.0 8.3 7.5 8.2 8.7 ROIC post tax 12.7 9.3 7.8 6.7 6.9 6.2 6.6 6.9 ROE (UBS) 15.2 11.4 10.0 8.1 9.0 7.7 8.2 8.5
Capital structure & Coverage (x) 12/16 12/17 12/18 12/19E 12/20E 12/21E 12/22E 12/23E Net debt / EBITDA 2.5 3.5 4.0 4.1 4.7 4.2 3.7 3.3 Net debt / total equity % 58.9 71.2 75.2 65.2 88.6 76.8 69.3 61.7 Net debt / (net debt + total equity) % 37.1 41.6 42.9 39.5 47.0 43.4 40.9 38.2 Net debt/EV % 32.7 40.1 40.2 38.3 50.8 44.6 44.1 42.5 Capex / depreciation % NM NM NM NM NM 189.4 176.5 165.1 Capex / revenue % 21.0 19.4 20.8 24.9 26.9 12.5 11.7 11.4 EBIT / net interest 6.0 4.5 4.0 3.3 3.5 3.0 3.5 4.0 Dividend cover (UBS) 4.8 3.0 2.0 2.1 2.6 1.6 1.6 1.7 Div. payout ratio (UBS) % 20.7 33.6 50.5 47.3 38.7 63.3 61.5 60.3
Revenues by division (Rmbm) 12/16 12/17 12/18 12/19E 12/20E 12/21E 12/22E 12/23E Wind turbine generator business and others
22,264 19,346 22,169 29,393 31,494 23,657 24,866 24,924
Wind farm development 2,414 3,247 3,904 4,655 5,528 5,889 6,152 6,408 Others 1,496 2,377 2,518 2,808 3,138 3,513 3,939 4,424 Total 26,174 24,971 28,590 36,857 40,161 33,060 34,957 35,756
EBIT (UBS) by division (Rmbm) 12/16 12/17 12/18 12/19E 12/20E 12/21E 12/22E 12/23E Wind farm development 562 1,191 1,590 1,852 2,076 2,066 2,140 2,211 Wind turbine generator business and others 2,802 1,450 845 660 1,319 1,282 1,476 1,598
Others 321 669 925 911 987 1,041 1,168 1,295 Total 3,685 3,310 3,360 3,423 4,381 4,388 4,784 5,103 Source: Company accounts, UBS estimates. (UBS) metrics use reported figures which have been adjusted by UBS analysts.

abc Global Research 10 April 2019
Chinese Wind Power Sector 10 April 2019 28
Xinjiang Goldwind Science & Technology-A No gold from this rush; downgrading to Sell
Downgrading to Sell on concern over wind turbine generator margins We downgrade Goldwind-A [Link] from Buy to Sell, as we think the market has priced in the wind turbine generator (WTG) volume surge in 2019E but ignored the margin contraction. While Goldwind's external WTG sales volume could increase to over 8GW pa in 2019/20E due to an installation rush, we think larger than expected margin contraction will fully offset the benefit. We forecast recurring earnings to decline 3% YoY in 2019 and reach peak growth of 30% YoY in 2020E. We expect net gearing to rise to 80% in 2020 from 65% in 2015 due to lower cash inflow from WTGs, higher downstream capex and longer subsidy delays. The valuation of its WTG business has exceeded that of the 2015 peak cycle, and we believe risk is skewed to the downside.
2019 WTG gross margin could be lower than expected Goldwind's 2018 WTG gross margin was down 6ppt, a stepper decline than we expected, and we think this trend will continue in 2019. The industry average bidding price for 2.0/2.5MW WTG dropped by 14/13% YoY in 2018, and most of these orders will be delivered in 2019. We estimate this will lower overall WTG ASP by 6% and GPM by 4ppt to 15% in 2019. This suggests Goldwind's WTG EBIT margin could decline to 2% in 2019E, making any impact from volume growth almost irrelevant.
Valuation for peak year does not look attractive Goldwind - A is trading at 27x/21x 2019/20E PE. While this valuation looks reasonable, we note that c.40% of Goldwind's net profit will come from its wind farm business, which deserves a lower PE. Our analysis shows the implied 2019/20E PE of Goldwind's WTG business is already 44x/29x, much higher than the 24x seen in 2015. This means that its PE even for peak earnings in 2020E has already exceeded the historical peak. On top of that, we estimate: 1) Goldwind's earnings will decline in 2021; and 2) its 2019/20E WTG EBIT margins will be 2-4% versus 13% in 2015.
Valuation: Downgrading to Sell with new price target of Rmb11.50 Our PT is based on sum-of-the-parts methodology, with the valuation of each segment based on DCF. We cut our 2019-21E earnings by 19-31% and PT by c.30% due to: 1) larger than expected WTG margin contraction; and 2) higher curtailment and a longer subsidy delay in 2019-21E. Our PT implies 24x 2020E PE for WTG, close to the 2015 peak, and 8x 2020E PE for wind farms, close to other operators.
Equities
China
Electric Components & Equipment
12-month rating Sell Prior: Buy
12m price target Rmb11.50
Prior: Rmb17.00
Price Rmb13.80
RIC: 002202.SZ BBG: 002202 CH
Trading data and key metrics 52-wk range Rmb17.05-8.05
Market cap. Rmb58.3bn/US$8.68bn
Shares o/s 4,225m (ORDA )
Free float 49%
Avg. daily volume ('000) 42,126
Avg. daily value (m) Rmb552.9
Common s/h equity (12/19E) Rmb30.2bn
P/BV (12/19E) 1.9x
Net debt / EBITDA (12/19E) 4.1x
EPS (UBS, diluted) (Rmb) From To % ch Cons.
12/19E 0.66 0.51 -22 0.86 12/20E 0.82 0.67 -19 1.07 12/21E 0.88 0.61 -31 1.31
Abigail Sun Analyst
S1460518040002 [email protected]
+86-213-866 8637
Wenzhuo Du Analyst
S1460516050001 [email protected]
+86-213-866 8960
Alex Liu Analyst
S1460515080001 [email protected]
+86-213-866 8857
Highlights (Rmbm) 12/16 12/17 12/18 12/19E 12/20E 12/21E 12/22E 12/23E Revenues 26,174 24,971 28,590 36,857 40,161 33,060 34,957 35,756 EBIT (UBS) 3,685 3,310 3,360 3,423 4,381 4,388 4,784 5,103 Net earnings (UBS) 2,681 2,271 2,241 2,166 2,810 2,581 2,933 3,208 EPS (UBS, diluted) (Rmb) 0.70 0.60 0.59 0.51 0.67 0.61 0.69 0.76 DPS (Rmb) 0.15 0.20 0.30 0.24 0.26 0.39 0.43 0.46 Net (debt) / cash (11,320) (15,650) (18,779) (20,741) (30,230) (28,007) (26,727) (25,147)
Profitability/valuation 12/16 12/17 12/18 12/19E 12/20E 12/21E 12/22E 12/23E EBIT margin % 14.1 13.3 11.8 9.3 10.9 13.3 13.7 14.3 ROIC (EBIT) % 14.9 10.7 9.3 8.0 8.3 7.5 8.2 8.7 EV/EBITDA (core) x 11.1 12.9 13.4 14.6 12.4 12.4 11.2 10.5 P/E (UBS, diluted) x 16.6 20.5 22.5 26.9 20.7 22.6 19.9 18.2 Equity FCF (UBS) yield % (5.7) (4.0) (5.7) (9.3) (13.7) 6.7 5.9 6.6 Net dividend yield % 1.2 1.6 2.2 1.8 1.9 2.8 3.1 3.3 Source: Company accounts, Thomson Reuters, UBS estimates. Metrics marked as (UBS) have had analyst adjustments applied. Valuations: based on an average share price that year, (E): based on a share price of Rmb13.80 on 09 Apr 2019 18:35 HKT
Global Research 10 April 2019
Chinese Wind Power Sector 10 April 2019
29
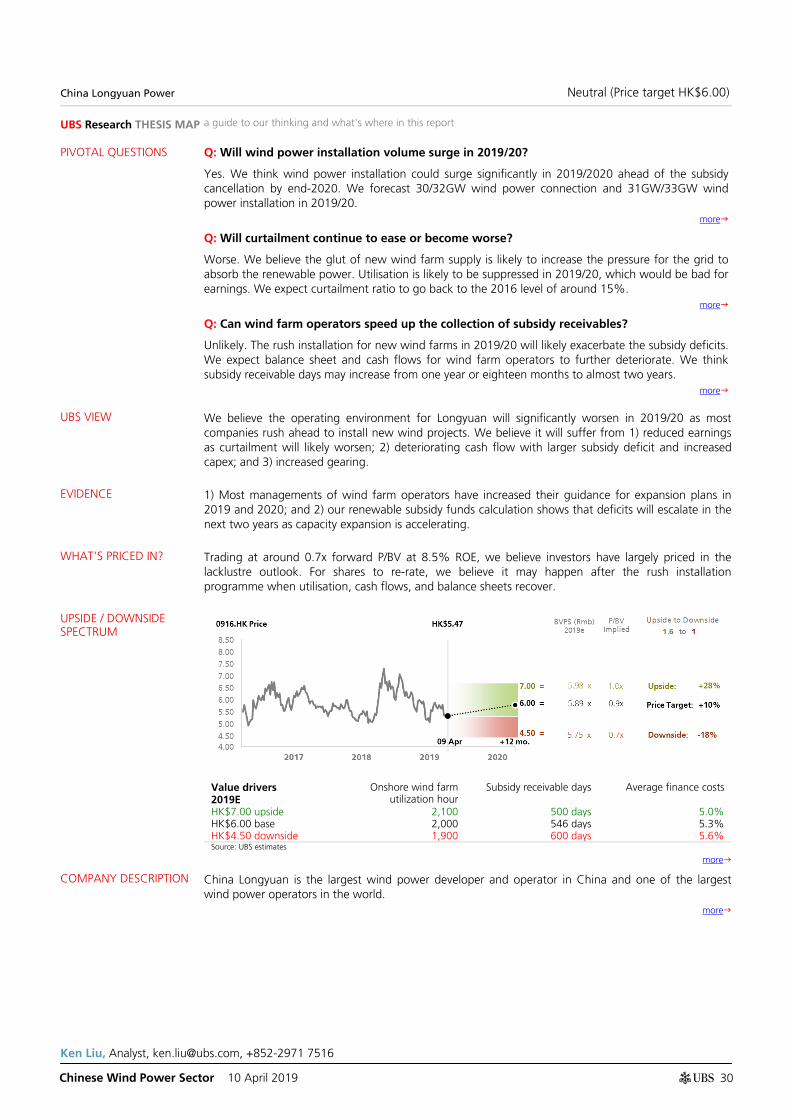
China Longyuan Power Waiting for cash and returns to normalise
Taking a break; downgrade from Buy to Neutral We downgrade Longyuan from Buy to Neutral with a new price target of HK$6.00. We are cutting our 2019-21 earnings forecasts significantly to reflect the 1) FY18 earnings miss, 2) reduced utilisation hours assumption from 2,200 to 2,000, and 3) longer receivable days and weaker free cash flows. This makes our current forecasts about 20% below consensus. Trading at around 0.7x forward P/BV at 8.5% ROE, we believe investors have largely priced in the lacklustre outlook. For the shares to re-rate, we believe it may happen after the rush installation programme when utilisation, cash flows, and balance sheets recover.
Raised capacity expansion target after two years of subdued growth Longyuan has substantially increased its capacity addition target to 1.2GW and 1.8GW of new onshore wind farms for 2019 and 2020, respectively, compared with around 0.4GW of additions in 2017-18 p.a. The majority of these projects are located in southern China, but we think curtailment could still exacerbate as this may crowd out the demand from importing renewable powers from other regions.
What are the catalysts ahead? We believe shares could range trade for a while as balance sheets, earnings, and cash flows all remain under pressure. We believe the upside catalysts would be 1) subsidy receivables would finally be eased with a sustainable, new source of financing; 2) reduced capacity expansion; and 3) better utilisation hours.
Valuation: downgrade to Neutral; lower price target from HK$8.70 to HK$6.00 We base our price target on a DCF valuation, assuming 7.7% WACC, 7.4% terminal ROIC, and 3.0% terminal growth. Our price target implies 10x 2019E PE and 0.8x 2019E P/BV, similar to the level in the last rush installation cycle in 2015-16.
Equities
China
Electric Utilities
12-month rating Neutral Prior: Buy
12m price target HK$6.00
Prior: HK$8.70
Price HK$5.47
RIC: 0916.HK BBG: 916 HK
Trading data and key metrics 52-wk range HK$7.76-5.14
Market cap. HK$44.0bn/US$5.60bn
Shares o/s 8,036m (ORD)
Free float 93%
Avg. daily volume ('000) 12,357
Avg. daily value (m) HK$71.1
Common s/h equity (12/19E) Rmb47.3bn
P/BV (12/19E) 0.8x
Net debt / EBITDA (12/19E) 4.8x
EPS (UBS, diluted) (Rmb) From To % ch Cons.
12/19E 0.80 0.48 -40 0.62 12/20E 0.88 0.52 -41 0.69 12/21E 0.97 0.67 -30 0.75
Ken Liu Analyst
[email protected] +852-2971 7516
Abigail Sun Analyst
S1460518040002 [email protected]
+86-213-866 8637
Simon Powell Analyst
[email protected] +852-2971 7772
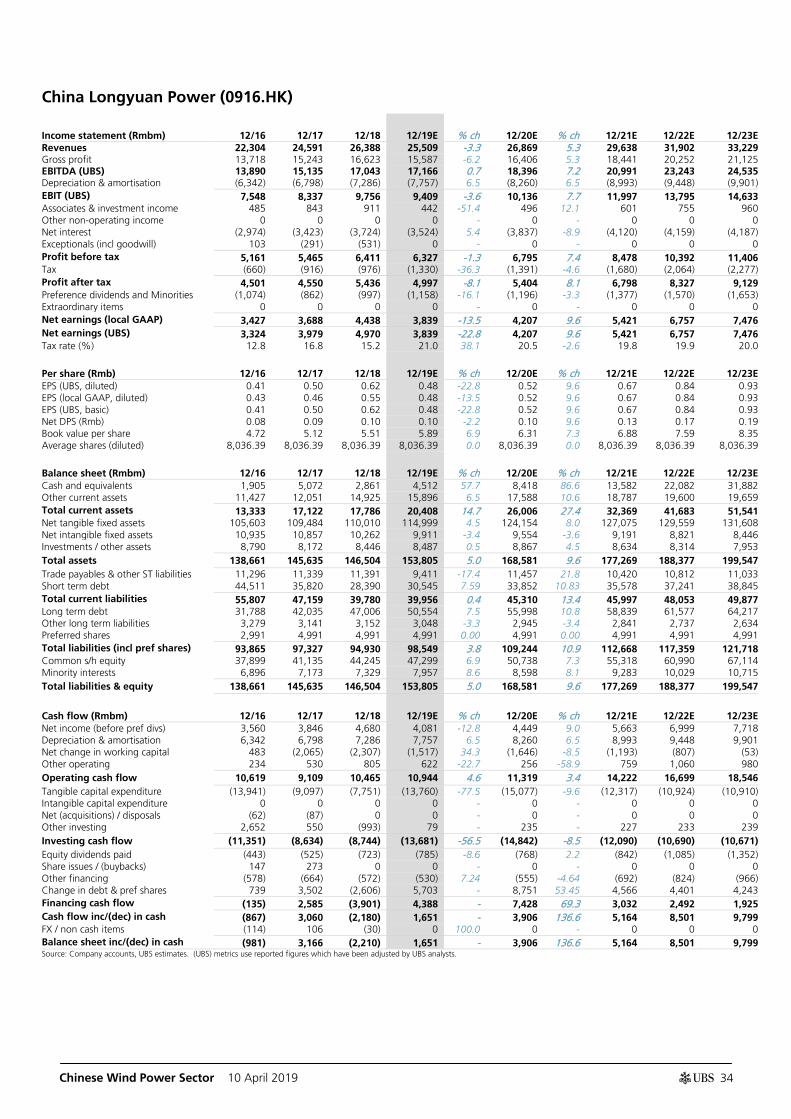
Highlights (Rmbm) 12/16 12/17 12/18 12/19E 12/20E 12/21E 12/22E 12/23E Revenues 22,304 24,591 26,388 25,509 26,869 29,638 31,902 33,229 EBIT (UBS) 7,548 8,337 9,756 9,409 10,136 11,997 13,795 14,633 Net earnings (UBS) 3,324 3,979 4,970 3,839 4,207 5,421 6,757 7,476 EPS (UBS, diluted) (Rmb) 0.41 0.50 0.62 0.48 0.52 0.67 0.84 0.93 DPS (Rmb) 0.08 0.09 0.10 0.10 0.10 0.13 0.17 0.19 Net (debt) / cash (77,385) (77,775) (77,526) (81,578) (86,424) (85,826) (81,727) (76,170)
Profitability/valuation 12/16 12/17 12/18 12/19E 12/20E 12/21E 12/22E 12/23E EBIT margin % 33.8 33.9 37.0 36.9 37.7 40.5 43.2 44.0 ROIC (EBIT) % 6.8 7.1 8.1 7.5 7.5 8.5 9.5 10.0 EV/EBITDA (core) x 8.5 7.8 7.2 6.8 6.7 6.0 5.5 5.2 P/E (UBS, diluted) x 12.0 10.5 8.5 9.8 8.9 6.9 5.6 5.0 Equity FCF (UBS) yield % (7.9) 0.0 6.2 (7.5) (10.0) 5.1 15.3 20.3 Net dividend yield % 1.7 1.8 1.9 2.0 2.2 2.9 3.6 4.0 Source: Company accounts, Thomson Reuters, UBS estimates. Metrics marked as (UBS) have had analyst adjustments applied. Valuations: based on an average share price that year, (E): based on a share price of HK$5.47 on 09 Apr 2019 18:34 HKT
Chinese Wind Power Sector 10 April 2019
30
China Longyuan Power Neutral (Price target HK$6.00)
CO1 P2
UBS Research THESIS MAP a guide to our thinking and what's where in this report
PIVOTAL QUESTIONS Q: Will wind power installation volume surge in 2019/20?
Yes. We think wind power installation could surge significantly in 2019/2020 ahead of the subsidy cancellation by end-2020. We forecast 30/32GW wind power connection and 31GW/33GW wind power installation in 2019/20.
more
Q: Will curtailment continue to ease or become worse?
Worse. We believe the glut of new wind farm supply is likely to increase the pressure for the grid to absorb the renewable power. Utilisation is likely to be suppressed in 2019/20, which would be bad for earnings. We expect curtailment ratio to go back to the 2016 level of around 15%.
more
Q: Can wind farm operators speed up the collection of subsidy receivables?
Unlikely. The rush installation for new wind farms in 2019/20 will likely exacerbate the subsidy deficits. We expect balance sheet and cash flows for wind farm operators to further deteriorate. We think subsidy receivable days may increase from one year or eighteen months to almost two years.
more
UBS VIEW We believe the operating environment for Longyuan will significantly worsen in 2019/20 as most companies rush ahead to install new wind projects. We believe it will suffer from 1) reduced earnings as curtailment will likely worsen; 2) deteriorating cash flow with larger subsidy deficit and increased capex; and 3) increased gearing.
EVIDENCE 1) Most managements of wind farm operators have increased their guidance for expansion plans in 2019 and 2020; and 2) our renewable subsidy funds calculation shows that deficits will escalate in the next two years as capacity expansion is accelerating.
WHAT'S PRICED IN? Trading at around 0.7x forward P/BV at 8.5% ROE, we believe investors have largely priced in the lacklustre outlook. For shares to re-rate, we believe it may happen after the rush installation programme when utilisation, cash flows, and balance sheets recover.
UPSIDE / DOWNSIDE SPECTRUM
Value drivers 2019E
Onshore wind farm utilization hour
Subsidy receivable days Average finance costs
HK$7.00 upside 2,100 500 days 5.0% HK$6.00 base 2,000 546 days 5.3% HK$4.50 downside 1,900 600 days 5.6% Source: UBS estimates
more
COMPANY DESCRIPTION China Longyuan is the largest wind power developer and operator in China and one of the largest wind power operators in the world. more
Ken Liu, Analyst, [email protected], +852-2971 7516

Chinese Wind Power Sector 10 April 2019
31
China Longyuan Power UBS Research CO1 UD
UPSIDE / DOWNSIDE SPECTRUM return
Value drivers 2019E
Onshore wind farm utilization hour
Subsidy receivable days Average finance costs
HK$7.00 upside 2,100 500 days 5.0% HK$6.00 base 2,000 546 days 5.3% HK$4.50 downside 1,900 600 days 5.6% Source: UBS estimates
Longyuan is trading at HK$5.47 (as of 9 April)
Risk to the current share price is skewed 1.6:1 to the upside
Longyuan is trading at HK$5.47 (as of 9 April).
Upside (HK$7.00): In our upside-case scenario, we assume better utilisation hours of 2,100 from 2019E onwards. In addition, we assume subsidy receivable days just increase from 476 days in 2018 to 500 days. We also factor in lower interest costs of 5.0%. In this case, we derive a valuation of HK$7.00 per share, implying 1.0x 2019E P/BV.
Base (HK$6.00): In our base case, we expect utilization hours to decline to 2,000 hours in 2019, with subsidy receivable days increasing by 80 days to 546 days. We assume interest rate will maintain flattish at 5.3%.
Our price target is based on a DCF methodology and implies 0.9x 2019E P/BV.
Downside (HK$4.50): In our downside-case scenario, we assume the rush installation could lead to a larger decline in utilization hours to 1,900. We also assume subsidy receivable days will surge to 600 days. In addition, we factor in higher interest costs given the company's worse financial situation. In this case, we derive a valuation of HK$4.50 per share, implying 0.7x 2019E P/BV.
Chinese Wind Power Sector 10 April 2019
32
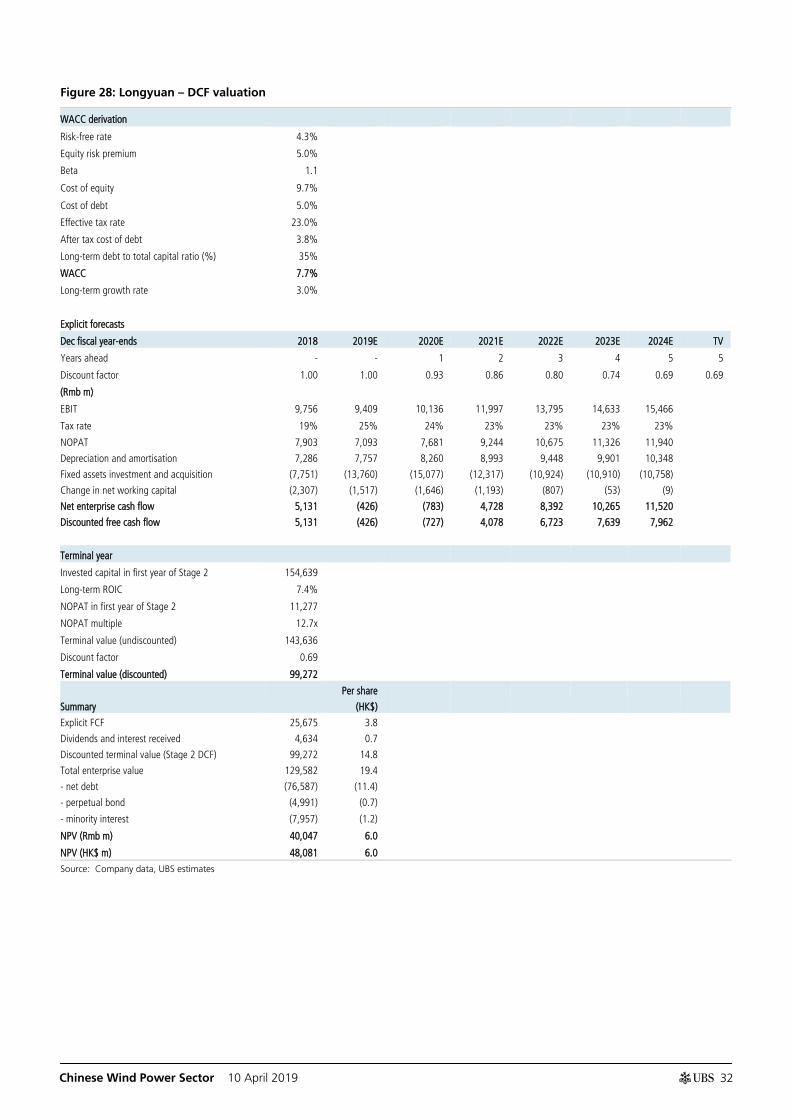
Figure 28: Longyuan – DCF valuation
WACC derivation
Risk-free rate 4.3%
Equity risk premium 5.0%
Beta 1.1
Cost of equity 9.7%
Cost of debt 5.0%
Effective tax rate 23.0%
After tax cost of debt 3.8%
Long-term debt to total capital ratio (%) 35%
WACC 7.7%
Long-term growth rate 3.0%
Explicit forecasts
Dec fiscal year-ends 2018 2019E 2020E 2021E 2022E 2023E 2024E TV
Years ahead - - 1 2 3 4 5 5
Discount factor 1.00 1.00 0.93 0.86 0.80 0.74 0.69 0.69
(Rmb m)
EBIT 9,756 9,409 10,136 11,997 13,795 14,633 15,466
Tax rate 19% 25% 24% 23% 23% 23% 23%
NOPAT 7,903 7,093 7,681 9,244 10,675 11,326 11,940
Depreciation and amortisation 7,286 7,757 8,260 8,993 9,448 9,901 10,348
Fixed assets investment and acquisition (7,751) (13,760) (15,077) (12,317) (10,924) (10,910) (10,758)
Change in net working capital (2,307) (1,517) (1,646) (1,193) (807) (53) (9)
Net enterprise cash flow 5,131 (426) (783) 4,728 8,392 10,265 11,520
Discounted free cash flow 5,131 (426) (727) 4,078 6,723 7,639 7,962
Terminal year
Invested capital in first year of Stage 2 154,639
Long-term ROIC 7.4%
NOPAT in first year of Stage 2 11,277
NOPAT multiple 12.7x
Terminal value (undiscounted) 143,636
Discount factor 0.69
Terminal value (discounted) 99,272
Summary
Per share
(HK$)
Explicit FCF 25,675 3.8
Dividends and interest received 4,634 0.7
Discounted terminal value (Stage 2 DCF) 99,272 14.8
Total enterprise value 129,582 19.4
- net debt (76,587) (11.4)
- perpetual bond (4,991) (0.7)
- minority interest (7,957) (1.2)
NPV (Rmb m) 40,047 6.0
NPV (HK$ m) 48,081 6.0
Source: Company data, UBS estimates

Chinese Wind Power Sector 10 April 2019
33
China Longyuan Power UBS Research CO1 Co des
COMPANY DESCRIPTION return
China Longyuan is the largest wind power developer and operator in China and one of the largest wind power operators in the world. In most provinces of China that have significant wind resources, Longyuan is the market leader. The company also owns minority stakes in two coal-fired power plants.
Industry outlook
The wind power industry in China may face another round of rush installations in 2019/20 ahead of the subsidy cancellation. We expect overall wind power capacity additions to surge to 30/32GW in 2019/20E. We believe that the operating environment for wind farm operators will significantly worsen in 2019/20 as most companies rush ahead to install new wind projects. We believe they will suffer from 1) reduced earnings as curtailment will likely worsen; 2) deteriorating cash flow with larger subsidy deficit and increased capex; and 3) increased gearing.
NPV by segment – 2019E (%)
Source: Company data, UBS estimates
Net profit by product segment
Rmb m 2016 2017 2018 2019E 2020E
Wind 3,067 3,877 4,413 3,746 4,117
Coal power and others 257 103 42 93 90
Total 3,324 3,979 4,455 3,839 4,207
Source: Company data, UBS estimates
Wind 89%
Coal 11%
Chinese Wind Power Sector 10 April 2019
34
China Longyuan Power (0916.HK)
Income statement (Rmbm) 12/16 12/17 12/18 12/19E % ch 12/20E % ch 12/21E 12/22E 12/23E Revenues 22,304 24,591 26,388 25,509 -3.3 26,869 5.3 29,638 31,902 33,229 Gross profit 13,718 15,243 16,623 15,587 -6.2 16,406 5.3 18,441 20,252 21,125 EBITDA (UBS) 13,890 15,135 17,043 17,166 0.7 18,396 7.2 20,991 23,243 24,535 Depreciation & amortisation (6,342) (6,798) (7,286) (7,757) 6.5 (8,260) 6.5 (8,993) (9,448) (9,901) EBIT (UBS) 7,548 8,337 9,756 9,409 -3.6 10,136 7.7 11,997 13,795 14,633 Associates & investment income 485 843 911 442 -51.4 496 12.1 601 755 960 Other non-operating income 0 0 0 0 - 0 - 0 0 0 Net interest (2,974) (3,423) (3,724) (3,524) 5.4 (3,837) -8.9 (4,120) (4,159) (4,187) Exceptionals (incl goodwill) 103 (291) (531) 0 - 0 - 0 0 0 Profit before tax 5,161 5,465 6,411 6,327 -1.3 6,795 7.4 8,478 10,392 11,406 Tax (660) (916) (976) (1,330) -36.3 (1,391) -4.6 (1,680) (2,064) (2,277) Profit after tax 4,501 4,550 5,436 4,997 -8.1 5,404 8.1 6,798 8,327 9,129 Preference dividends and Minorities (1,074) (862) (997) (1,158) -16.1 (1,196) -3.3 (1,377) (1,570) (1,653) Extraordinary items 0 0 0 0 - 0 - 0 0 0 Net earnings (local GAAP) 3,427 3,688 4,438 3,839 -13.5 4,207 9.6 5,421 6,757 7,476 Net earnings (UBS) 3,324 3,979 4,970 3,839 -22.8 4,207 9.6 5,421 6,757 7,476 Tax rate (%) 12.8 16.8 15.2 21.0 38.1 20.5 -2.6 19.8 19.9 20.0
Per share (Rmb) 12/16 12/17 12/18 12/19E % ch 12/20E % ch 12/21E 12/22E 12/23E EPS (UBS, diluted) 0.41 0.50 0.62 0.48 -22.8 0.52 9.6 0.67 0.84 0.93 EPS (local GAAP, diluted) 0.43 0.46 0.55 0.48 -13.5 0.52 9.6 0.67 0.84 0.93 EPS (UBS, basic) 0.41 0.50 0.62 0.48 -22.8 0.52 9.6 0.67 0.84 0.93 Net DPS (Rmb) 0.08 0.09 0.10 0.10 -2.2 0.10 9.6 0.13 0.17 0.19 Book value per share 4.72 5.12 5.51 5.89 6.9 6.31 7.3 6.88 7.59 8.35 Average shares (diluted) 8,036.39 8,036.39 8,036.39 8,036.39 0.0 8,036.39 0.0 8,036.39 8,036.39 8,036.39
Balance sheet (Rmbm) 12/16 12/17 12/18 12/19E % ch 12/20E % ch 12/21E 12/22E 12/23E Cash and equivalents 1,905 5,072 2,861 4,512 57.7 8,418 86.6 13,582 22,082 31,882 Other current assets 11,427 12,051 14,925 15,896 6.5 17,588 10.6 18,787 19,600 19,659 Total current assets 13,333 17,122 17,786 20,408 14.7 26,006 27.4 32,369 41,683 51,541 Net tangible fixed assets 105,603 109,484 110,010 114,999 4.5 124,154 8.0 127,075 129,559 131,608 Net intangible fixed assets 10,935 10,857 10,262 9,911 -3.4 9,554 -3.6 9,191 8,821 8,446 Investments / other assets 8,790 8,172 8,446 8,487 0.5 8,867 4.5 8,634 8,314 7,953 Total assets 138,661 145,635 146,504 153,805 5.0 168,581 9.6 177,269 188,377 199,547 Trade payables & other ST liabilities 11,296 11,339 11,391 9,411 -17.4 11,457 21.8 10,420 10,812 11,033 Short term debt 44,511 35,820 28,390 30,545 7.59 33,852 10.83 35,578 37,241 38,845 Total current liabilities 55,807 47,159 39,780 39,956 0.4 45,310 13.4 45,997 48,053 49,877 Long term debt 31,788 42,035 47,006 50,554 7.5 55,998 10.8 58,839 61,577 64,217 Other long term liabilities 3,279 3,141 3,152 3,048 -3.3 2,945 -3.4 2,841 2,737 2,634 Preferred shares 2,991 4,991 4,991 4,991 0.00 4,991 0.00 4,991 4,991 4,991 Total liabilities (incl pref shares) 93,865 97,327 94,930 98,549 3.8 109,244 10.9 112,668 117,359 121,718 Common s/h equity 37,899 41,135 44,245 47,299 6.9 50,738 7.3 55,318 60,990 67,114 Minority interests 6,896 7,173 7,329 7,957 8.6 8,598 8.1 9,283 10,029 10,715 Total liabilities & equity 138,661 145,635 146,504 153,805 5.0 168,581 9.6 177,269 188,377 199,547
Cash flow (Rmbm) 12/16 12/17 12/18 12/19E % ch 12/20E % ch 12/21E 12/22E 12/23E Net income (before pref divs) 3,560 3,846 4,680 4,081 -12.8 4,449 9.0 5,663 6,999 7,718 Depreciation & amortisation 6,342 6,798 7,286 7,757 6.5 8,260 6.5 8,993 9,448 9,901 Net change in working capital 483 (2,065) (2,307) (1,517) 34.3 (1,646) -8.5 (1,193) (807) (53) Other operating 234 530 805 622 -22.7 256 -58.9 759 1,060 980 Operating cash flow 10,619 9,109 10,465 10,944 4.6 11,319 3.4 14,222 16,699 18,546 Tangible capital expenditure (13,941) (9,097) (7,751) (13,760) -77.5 (15,077) -9.6 (12,317) (10,924) (10,910) Intangible capital expenditure 0 0 0 0 - 0 - 0 0 0 Net (acquisitions) / disposals (62) (87) 0 0 - 0 - 0 0 0 Other investing 2,652 550 (993) 79 - 235 - 227 233 239 Investing cash flow (11,351) (8,634) (8,744) (13,681) -56.5 (14,842) -8.5 (12,090) (10,690) (10,671) Equity dividends paid (443) (525) (723) (785) -8.6 (768) 2.2 (842) (1,085) (1,352) Share issues / (buybacks) 147 273 0 0 - 0 - 0 0 0 Other financing (578) (664) (572) (530) 7.24 (555) -4.64 (692) (824) (966) Change in debt & pref shares 739 3,502 (2,606) 5,703 - 8,751 53.45 4,566 4,401 4,243 Financing cash flow (135) 2,585 (3,901) 4,388 - 7,428 69.3 3,032 2,492 1,925 Cash flow inc/(dec) in cash (867) 3,060 (2,180) 1,651 - 3,906 136.6 5,164 8,501 9,799 FX / non cash items (114) 106 (30) 0 100.0 0 - 0 0 0 Balance sheet inc/(dec) in cash (981) 3,166 (2,210) 1,651 - 3,906 136.6 5,164 8,501 9,799 Source: Company accounts, UBS estimates. (UBS) metrics use reported figures which have been adjusted by UBS analysts.

Chinese Wind Power Sector 10 April 2019
35
China Longyuan Power (0916.HK)
Valuation (x) 12/16 12/17 12/18 12/19E 12/20E 12/21E 12/22E 12/23E P/E (local GAAP, diluted) 11.7 11.3 9.5 9.8 8.9 6.9 5.6 5.0 P/E (UBS, diluted) 12.0 10.5 8.5 9.8 8.9 6.9 5.6 5.0 P/CEPS 4.1 3.9 3.5 3.2 3.0 2.6 2.3 2.2 Equity FCF (UBS) yield % (7.9) 0.0 6.2 (7.5) (10.0) 5.1 15.3 20.3 Net dividend yield (%) 1.7 1.8 1.9 2.0 2.2 2.9 3.6 4.0 P/BV x 1.1 1.0 1.0 0.8 0.7 0.7 0.6 0.6 EV/revenues (core) 5.3 4.8 4.6 4.6 4.6 4.3 4.0 3.9 EV/EBITDA (core) 8.5 7.8 7.2 6.8 6.7 6.0 5.5 5.2 EV/EBIT (core) 15.6 14.2 12.5 12.4 12.1 10.5 9.2 8.8 EV/OpFCF (core) 8.7 7.9 7.3 6.9 6.8 6.1 5.5 5.3 EV/op. invested capital 1.1 1.0 1.0 0.9 0.9 0.9 0.9 0.9
Enterprise value (Rmbm) 12/16 12/17 12/18 12/19E 12/20E 12/21E 12/22E 12/23E Market cap. 41,875 40,039 44,049 37,629 37,629 37,629 37,629 37,629 Net debt (cash) 76,074 77,580 77,580 77,580 84,001 86,125 86,125 86,125 Buy out of minorities 6,896 7,173 7,329 7,957 8,598 9,283 10,029 10,715 Pension provisions/other 1,456 1,426 1,538 1,538 1,538 1,538 1,538 1,538 Total enterprise value 126,302 126,219 130,496 124,704 131,766 134,575 135,321 136,007 Non core assets (8,640) (8,002) (8,300) (8,341) (8,720) (8,488) (8,167) (7,807) Core enterprise value 117,662 118,217 122,197 116,363 123,046 126,087 127,153 128,200
Growth (%) 12/16 12/17 12/18 12/19E 12/20E 12/21E 12/22E 12/23E Revenue 13.5 10.3 7.3 -3.3 5.3 10.3 7.6 4.2 EBITDA (UBS) 9.5 9.0 12.6 0.7 7.2 14.1 10.7 5.6 EBIT (UBS) 5.9 10.5 17.0 -3.6 7.7 18.4 15.0 6.1 EPS (UBS, diluted) 2.0 19.7 24.9 -22.8 9.6 28.8 24.6 10.6 Net DPS 18.5 8.0 6.4 -2.2 9.6 28.8 24.6 10.6
Margins & Profitability (%) 12/16 12/17 12/18 12/19E 12/20E 12/21E 12/22E 12/23E Gross profit margin 61.5 62.0 63.0 61.1 61.1 62.2 63.5 63.6 EBITDA margin 62.3 61.5 64.6 67.3 68.5 70.8 72.9 73.8 EBIT margin 33.8 33.9 37.0 36.9 37.7 40.5 43.2 44.0 Net earnings (UBS) margin 14.9 16.2 18.8 15.0 15.7 18.3 21.2 22.5 ROIC (EBIT) 6.8 7.1 8.1 7.5 7.5 8.5 9.5 10.0 ROIC post tax 5.9 5.9 6.9 5.8 5.9 6.8 7.6 7.9 ROE (UBS) 9.1 10.1 11.6 8.4 8.6 10.2 11.6 11.7
Capital structure & Coverage (x) 12/16 12/17 12/18 12/19E 12/20E 12/21E 12/22E 12/23E Net debt / EBITDA 5.6 5.1 4.5 4.8 4.7 4.1 3.5 3.1 Net debt / total equity % 172.8 161.0 150.3 147.6 145.7 132.9 115.1 97.9 Net debt / (net debt + total equity) % 63.3 61.7 60.1 59.6 59.3 57.1 53.5 49.5 Net debt/EV % 65.8 65.8 63.4 70.1 70.2 68.1 64.3 59.4 Capex / depreciation % NM 143.8 115.0 190.9 195.7 146.1 123.0 117.0 Capex / revenue % NM NM 29.4 NM NM NM NM NM EBIT / net interest 2.5 2.4 2.6 2.7 2.6 2.9 3.3 3.5 Dividend cover (UBS) 4.9 5.4 6.3 5.0 5.0 5.0 5.0 5.0 Div. payout ratio (UBS) % 20.6 18.5 15.8 20.0 20.0 20.0 20.0 20.0
Revenues by division (Rmbm) 12/16 12/17 12/18 12/19E 12/20E 12/21E 12/22E 12/23E Wind 14,491 16,072 18,424 17,915 19,155 21,850 24,038 25,285 Coal 7,270 7,990 7,314 6,885 6,941 6,947 6,953 6,959 Others 543 530 650 709 774 841 911 985 Total 22,304 24,591 26,388 25,509 26,869 29,638 31,902 33,229
EBIT (UBS) by division (Rmbm) 12/16 12/17 12/18 12/19E 12/20E 12/21E 12/22E 12/23E Wind 6,609 7,963 9,549 8,827 9,586 11,460 13,272 14,123 Coal 896 508 392 721 685 687 689 692 Others 42 (134) (186) (140) (135) (150) (165) (182) Total 7,548 8,337 9,756 9,409 10,136 11,997 13,795 14,633 Source: Company accounts, UBS estimates. (UBS) metrics use reported figures which have been adjusted by UBS analysts.

Global Research 10 April 2019
Chinese Wind Power Sector 10 April 2019
36
Huaneng Renewable Corporation Deeply valued but lacking catalysts
Taking a break; downgrade from Buy to Neutral We downgrade Huaneng Renewable from Buy to Neutral with a new price target of HK$2.40. We are cutting our 2019-21 earnings forecasts significantly to reflect the 1) FY18 earnings miss, 2) reduced utilisation hours assumption from 2,200 to 2,000, and 3) longer receivable days and weaker free cash flows. This makes our current earnings estimates about 30% below consensus. Trading at around 0.7x forward P/BV at 9% ROE, we believe investors have largely priced in the lacklustre outlook. For shares to re-rate, we believe this may happen after the rush installation programme when utilisation, cash flows, and balance sheets recover.
Raised capacity expansion target after two years of subdued growth Huaneng Renewable has substantially increased its capacity additions target to 1.6GW and 2.0GW of new onshore wind farms for 2019 and 2020, respectively, compared with around 0.4GW of additions in 2017-18 p.a. The majority of these projects are located in southern China, but we think curtailment could still exacerbate as this may crowd out the demand from importing renewable powers from other regions.
What are the catalysts ahead? We believe shares could range trade for a while as balance sheets, earnings, and cash flows all remain under pressure. We believe the upside catalysts would be 1) subsidy receivables would finally be eased with a sustainable, new source of financing; 2) reduced capacity expansion; and 3) better utilisation hours.
Valuation: downgrade to Neutral; lower price target from HK$3.00 to HK$2.40 We base our price target on a DCF methodology, assuming 7.5% WACC, 7.0% ROIC, and 3% terminal growth. Our price target implies 8x 2019E PE and 0.7x 2019E P/BV, close to the level in the last rush installation cycle in 2015-16.
Equities
China
Electric Utilities
12-month rating Neutral Prior: Buy
12m price target HK$2.40
Prior: HK$3.00
Price HK$2.24
RIC: 0958.HK BBG: 958 HK
Trading data and key metrics 52-wk range HK$3.52-1.90
Market cap. HK$23.7bn/US$3.02bn
Shares o/s 10,567m (ORD)
Free float 90%
Avg. daily volume ('000) 21,419
Avg. daily value (m) HK$49.4
Common s/h equity (12/19E) Rmb29.5bn
P/BV (12/19E) 0.7x
Net debt / EBITDA (12/19E) 5.6x
EPS (UBS, diluted) (Rmb) From To % ch Cons.
12/19E 0.36 0.24 -31 0.35 12/20E 0.38 0.27 -28 0.39 12/21E 0.40 0.33 -16 0.42
Ken Liu Analyst
[email protected] +852-2971 7516
Simon Powell Analyst
[email protected] +852-2971 7772
Abigail Sun Analyst
S1460518040002 [email protected]
+86-213-866 8637
Highlights (Rmbm) 12/16 12/17 12/18 12/19E 12/20E 12/21E 12/22E 12/23E Revenues 9,239 10,554 11,650 10,856 12,201 14,400 15,557 16,102 EBIT (UBS) 4,908 5,855 6,317 5,255 5,807 6,894 7,968 8,223 Net earnings (UBS) 2,564 3,360 3,815 2,581 2,861 3,534 4,302 4,458 EPS (UBS, diluted) (Rmb) 0.26 0.33 0.36 0.24 0.27 0.33 0.41 0.42 DPS (Rmb) 0.04 0.04 0.04 0.04 0.04 0.05 0.06 0.06 Net (debt) / cash (50,383) (48,885) (48,013) (52,814) (61,662) (65,451) (63,878) (58,902)
Profitability/valuation 12/16 12/17 12/18 12/19E 12/20E 12/21E 12/22E 12/23E EBIT margin % 53.1 55.5 54.2 48.4 47.6 47.9 51.2 51.1 ROIC (EBIT) % 7.2 8.1 8.4 6.6 6.6 7.1 7.8 8.0 EV/EBITDA (core) x 8.4 7.3 7.2 7.4 7.4 6.8 6.3 6.1 P/E (UBS, diluted) x 7.8 6.8 6.2 7.8 7.1 5.7 4.7 4.5 Equity FCF (UBS) yield % (2.6) 13.4 20.0 (23.4) (31.4) 2.0 38.3 42.4 Net dividend yield % 2.0 1.9 2.0 1.9 2.1 2.6 3.2 3.3 Source: Company accounts, Thomson Reuters, UBS estimates. Metrics marked as (UBS) have had analyst adjustments applied. Valuations: based on an average share price that year, (E): based on a share price of HK$2.24 on 09 Apr 2019 18:25 HKT

Chinese Wind Power Sector 10 April 2019
37
Huaneng Renewable Corporation Neutral (Price target HK$2.40)
CO1 P2
UBS Research THESIS MAP a guide to our thinking and what's where in this report
PIVOTAL QUESTIONS Q: Will wind power installation volume surge in 2019/20?
Yes. We think wind power installation could surge significantly in 2019/20 ahead of the subsidy cancellation at end-2020. We forecast 30/32GW wind power connection and 31GW/33GW wind power installation in 2019/20.
more
Q: Will curtailment continue to ease or become worse?
Worse. We believe the glut of new wind farm supply is likely to increase the pressure for the grid to absorb the renewable power. Utilisation is likely to be suppressed in 2019/20, which would be bad for earnings. We expect curtailment to go back to the 2016 level of around 15%.
more
Q: Can wind farm operators speed up the collection of subsidy receivables?
Unlikely. The rush installation for new wind farms in 2019/20 will likely to exacerbate the subsidy deficits. We expect balance sheets and cash flows for wind farm operators to further deteriorate. We think receivable days may increase from one year or eighteen months to almost two years.
more
UBS VIEW We believe the operating environment for Huaneng Renewable will significantly worsen in 2019/20 as most companies rush ahead to install new wind projects. We believe it will suffer from 1) reduced earnings as curtailment will likely worsen; 2) deteriorating cash flow with larger subsidy deficit and increased capex; and 3) increased gearing.
EVIDENCE 1) Most managements of wind farm operators have increased their guidance for expansion plans in 2019 and 2020; and 2) our renewable subsidy funds calculation shows that deficit will escalate in the next two years as capacity expansion is accelerating.
WHAT'S PRICED IN? Trading at around 0.7x forward P/BV at 9% ROE, we believe investors have largely priced in the lacklustre outlook. For shares to re-rate, we believe this may happen after the rush installation programme when utilisation, cash flows, and balance sheets recover.
UPSIDE / DOWNSIDE SPECTRUM
Value drivers 2019E Wind farm utilization hour
Subsidy receivable days Average finance costs
HK$3.10 upside 2,100 365 days 4.0% HK$2.40 base 2,000 414 days 4.5% HK$1.60 downside 1,900 465 days 5.0% Source: UBS estimates
more
COMPANY DESCRIPTION Huaneng Renewable Power is an independent power producer in China that focuses on generating power from wind farms, supplemented by power from solar resources. more
Ken Liu, Analyst, [email protected], +852-2971 7516
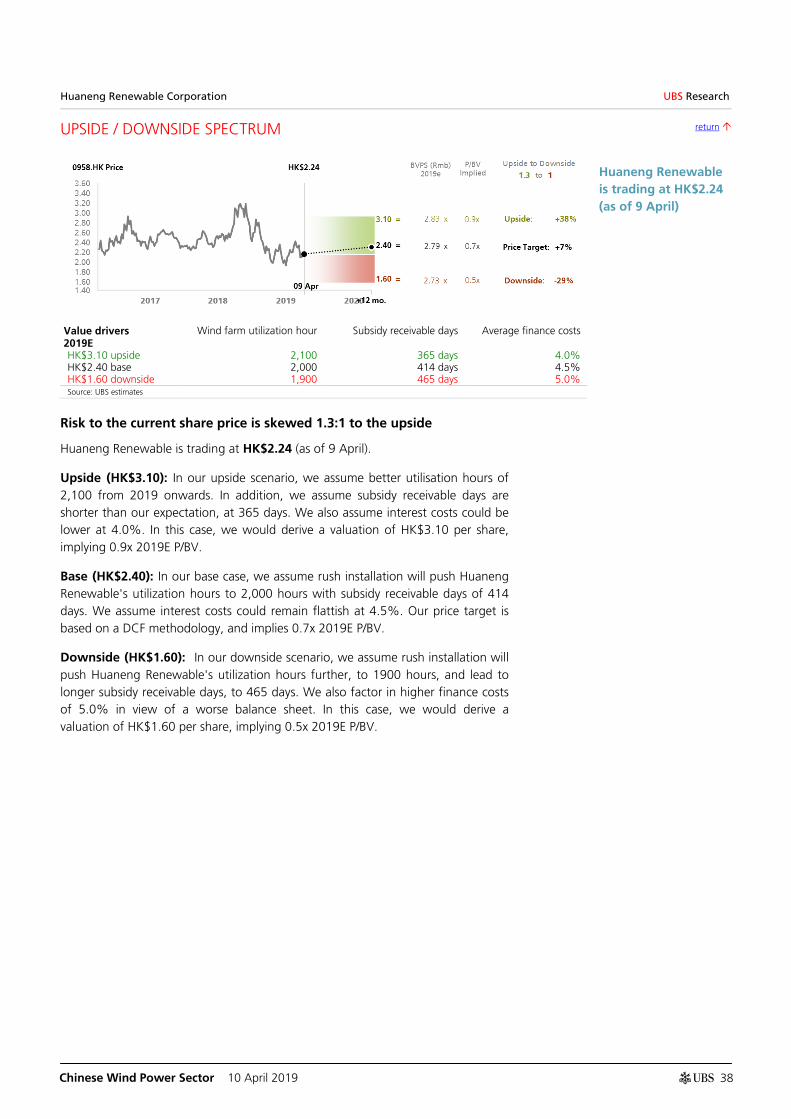
Chinese Wind Power Sector 10 April 2019
38
Huaneng Renewable Corporation UBS Research CO1 UD
UPSIDE / DOWNSIDE SPECTRUM return
Value drivers 2019E
Wind farm utilization hour Subsidy receivable days Average finance costs
HK$3.10 upside 2,100 365 days 4.0% HK$2.40 base 2,000 414 days 4.5% HK$1.60 downside 1,900 465 days 5.0% Source: UBS estimates
Huaneng Renewable is trading at HK$2.24 (as of 9 April)
Risk to the current share price is skewed 1.3:1 to the upside
Huaneng Renewable is trading at HK$2.24 (as of 9 April).
Upside (HK$3.10): In our upside scenario, we assume better utilisation hours of 2,100 from 2019 onwards. In addition, we assume subsidy receivable days are shorter than our expectation, at 365 days. We also assume interest costs could be lower at 4.0%. In this case, we would derive a valuation of HK$3.10 per share, implying 0.9x 2019E P/BV.
Base (HK$2.40): In our base case, we assume rush installation will push Huaneng Renewable's utilization hours to 2,000 hours with subsidy receivable days of 414 days. We assume interest costs could remain flattish at 4.5%. Our price target is based on a DCF methodology, and implies 0.7x 2019E P/BV.
Downside (HK$1.60): In our downside scenario, we assume rush installation will push Huaneng Renewable's utilization hours further, to 1900 hours, and lead to longer subsidy receivable days, to 465 days. We also factor in higher finance costs of 5.0% in view of a worse balance sheet. In this case, we would derive a valuation of HK$1.60 per share, implying 0.5x 2019E P/BV.

Chinese Wind Power Sector 10 April 2019
39
Figure 29: DCF valuation
WACC derivation
Risk-free rate 4.3%
Equity risk premium 5.0%
Beta 1.0
Cost of equity 9.4%
Cost of debt 5.6%
Effective tax rate 17.4%
After tax cost of debt 4.6%
Long-term debt to total capital ratio (%) 40%
WACC 7.5%
Long-term growth rate 3.0%
Explicit forecasts
Dec fiscal year-ends 2017 2018E 2019E 2020E 2021E 2022E 2023E 2024E TV
Years ahead - - - 1 2 3 4 5 5
Discount factor 1.00 1.00 1.00 0.93 0.86 0.80 0.75 0.69 0.69
(Rmb m)
EBIT 5,651 5,896 5,255 5,807 6,894 7,968 8,223 8,527
Tax rate 10% 15% 17% 16% 15% 17% 18% 20%
NOPAT 5,071 5,041 4,361 4,854 5,828 6,611 6,710 6,849
Depreciation and amortisation 3,798 3,973 4,163 4,747 5,469 5,676 5,882 6,089
Fixed assets investment and acquisition (5,117) (3,125) (12,807) (14,199) (11,525) (4,307) (4,308) (4,482)
Change in net working capital (1,643) (1,841) (766) (2,214) 79 (980) (386) (385)
Net enterprise cash flow 2,109 4,048 (5,048) (6,811) (149) 7,000 7,898 8,072
Discounted free cash flow 2,109 4,048 (5,048) (6,336) (129) 5,636 5,916 5,625
Terminal year
Invested capital in first year of Stage 2 104,190
Long-term ROIC 7.0%
NOPAT in first year of Stage 2 7,187
NOPAT multiple 12.7x
Terminal value (undiscounted) 91,461
Discount factor 0.70
Terminal value (discounted) 63,736
Summary of DCF (Rmb m)
Per share
(HK$)
Explicit FCF 10,712 1.2
Dividends and interest received - -
Discounted terminal value (Stage 2 DCF) 63,736 7.4
Total enterprise value 74,448 8.7
- net debt (52,814) (6.1)
- minority interest (853) (0.1)
NPV (Rmb m) 20,780 2.40
NPV (HK$ m) 23,513 2.40
Source: Company data, UBS estimates
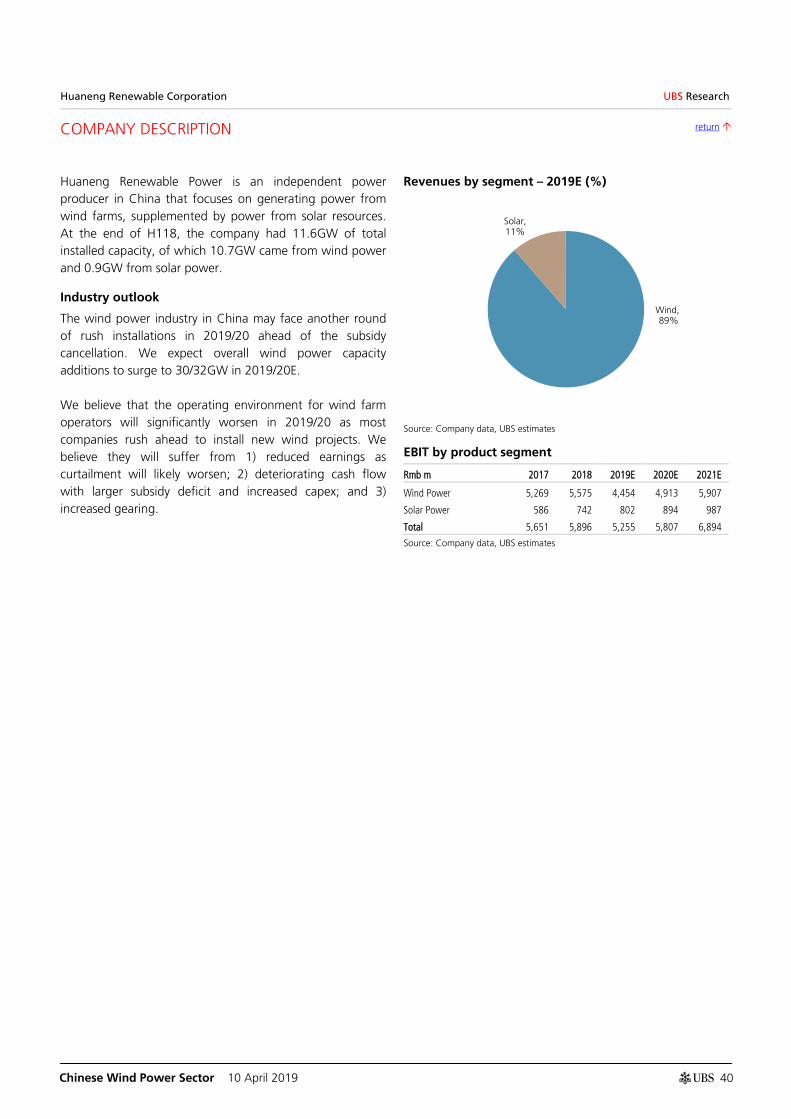
Chinese Wind Power Sector 10 April 2019
40
Huaneng Renewable Corporation UBS Research CO1 Co des
COMPANY DESCRIPTION return
Huaneng Renewable Power is an independent power producer in China that focuses on generating power from wind farms, supplemented by power from solar resources. At the end of H118, the company had 11.6GW of total installed capacity, of which 10.7GW came from wind power and 0.9GW from solar power.
Industry outlook
The wind power industry in China may face another round of rush installations in 2019/20 ahead of the subsidy cancellation. We expect overall wind power capacity additions to surge to 30/32GW in 2019/20E. We believe that the operating environment for wind farm operators will significantly worsen in 2019/20 as most companies rush ahead to install new wind projects. We believe they will suffer from 1) reduced earnings as curtailment will likely worsen; 2) deteriorating cash flow with larger subsidy deficit and increased capex; and 3) increased gearing.
Revenues by segment – 2019E (%)
Source: Company data, UBS estimates
EBIT by product segment
Rmb m 2017 2018 2019E 2020E 2021E
Wind Power 5,269 5,575 4,454 4,913 5,907
Solar Power 586 742 802 894 987
Total 5,651 5,896 5,255 5,807 6,894
Source: Company data, UBS estimates
Wind, 89%
Solar, 11%
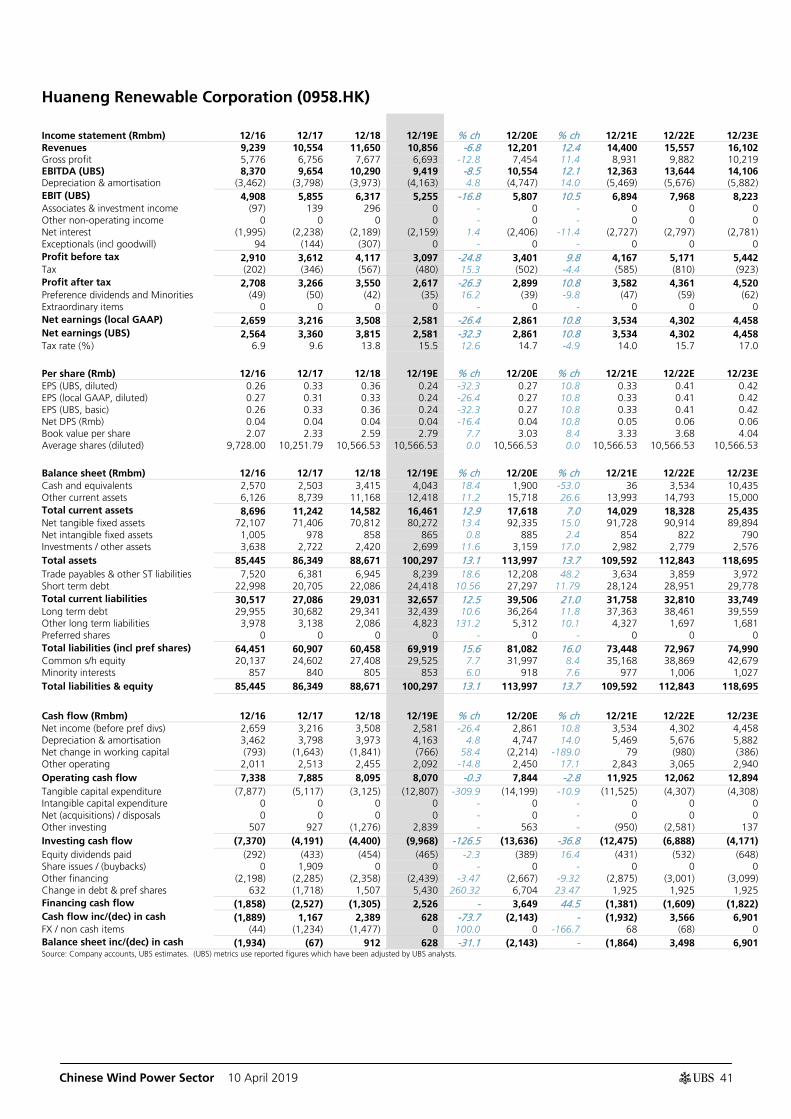
Chinese Wind Power Sector 10 April 2019
41
Huaneng Renewable Corporation (0958.HK)
Income statement (Rmbm) 12/16 12/17 12/18 12/19E % ch 12/20E % ch 12/21E 12/22E 12/23E Revenues 9,239 10,554 11,650 10,856 -6.8 12,201 12.4 14,400 15,557 16,102 Gross profit 5,776 6,756 7,677 6,693 -12.8 7,454 11.4 8,931 9,882 10,219 EBITDA (UBS) 8,370 9,654 10,290 9,419 -8.5 10,554 12.1 12,363 13,644 14,106 Depreciation & amortisation (3,462) (3,798) (3,973) (4,163) 4.8 (4,747) 14.0 (5,469) (5,676) (5,882) EBIT (UBS) 4,908 5,855 6,317 5,255 -16.8 5,807 10.5 6,894 7,968 8,223 Associates & investment income (97) 139 296 0 - 0 - 0 0 0 Other non-operating income 0 0 0 0 - 0 - 0 0 0 Net interest (1,995) (2,238) (2,189) (2,159) 1.4 (2,406) -11.4 (2,727) (2,797) (2,781) Exceptionals (incl goodwill) 94 (144) (307) 0 - 0 - 0 0 0 Profit before tax 2,910 3,612 4,117 3,097 -24.8 3,401 9.8 4,167 5,171 5,442 Tax (202) (346) (567) (480) 15.3 (502) -4.4 (585) (810) (923) Profit after tax 2,708 3,266 3,550 2,617 -26.3 2,899 10.8 3,582 4,361 4,520 Preference dividends and Minorities (49) (50) (42) (35) 16.2 (39) -9.8 (47) (59) (62) Extraordinary items 0 0 0 0 - 0 - 0 0 0 Net earnings (local GAAP) 2,659 3,216 3,508 2,581 -26.4 2,861 10.8 3,534 4,302 4,458 Net earnings (UBS) 2,564 3,360 3,815 2,581 -32.3 2,861 10.8 3,534 4,302 4,458 Tax rate (%) 6.9 9.6 13.8 15.5 12.6 14.7 -4.9 14.0 15.7 17.0
Per share (Rmb) 12/16 12/17 12/18 12/19E % ch 12/20E % ch 12/21E 12/22E 12/23E EPS (UBS, diluted) 0.26 0.33 0.36 0.24 -32.3 0.27 10.8 0.33 0.41 0.42 EPS (local GAAP, diluted) 0.27 0.31 0.33 0.24 -26.4 0.27 10.8 0.33 0.41 0.42 EPS (UBS, basic) 0.26 0.33 0.36 0.24 -32.3 0.27 10.8 0.33 0.41 0.42 Net DPS (Rmb) 0.04 0.04 0.04 0.04 -16.4 0.04 10.8 0.05 0.06 0.06 Book value per share 2.07 2.33 2.59 2.79 7.7 3.03 8.4 3.33 3.68 4.04 Average shares (diluted) 9,728.00 10,251.79 10,566.53 10,566.53 0.0 10,566.53 0.0 10,566.53 10,566.53 10,566.53
Balance sheet (Rmbm) 12/16 12/17 12/18 12/19E % ch 12/20E % ch 12/21E 12/22E 12/23E Cash and equivalents 2,570 2,503 3,415 4,043 18.4 1,900 -53.0 36 3,534 10,435 Other current assets 6,126 8,739 11,168 12,418 11.2 15,718 26.6 13,993 14,793 15,000 Total current assets 8,696 11,242 14,582 16,461 12.9 17,618 7.0 14,029 18,328 25,435 Net tangible fixed assets 72,107 71,406 70,812 80,272 13.4 92,335 15.0 91,728 90,914 89,894 Net intangible fixed assets 1,005 978 858 865 0.8 885 2.4 854 822 790 Investments / other assets 3,638 2,722 2,420 2,699 11.6 3,159 17.0 2,982 2,779 2,576 Total assets 85,445 86,349 88,671 100,297 13.1 113,997 13.7 109,592 112,843 118,695 Trade payables & other ST liabilities 7,520 6,381 6,945 8,239 18.6 12,208 48.2 3,634 3,859 3,972 Short term debt 22,998 20,705 22,086 24,418 10.56 27,297 11.79 28,124 28,951 29,778 Total current liabilities 30,517 27,086 29,031 32,657 12.5 39,506 21.0 31,758 32,810 33,749 Long term debt 29,955 30,682 29,341 32,439 10.6 36,264 11.8 37,363 38,461 39,559 Other long term liabilities 3,978 3,138 2,086 4,823 131.2 5,312 10.1 4,327 1,697 1,681 Preferred shares 0 0 0 0 - 0 - 0 0 0 Total liabilities (incl pref shares) 64,451 60,907 60,458 69,919 15.6 81,082 16.0 73,448 72,967 74,990 Common s/h equity 20,137 24,602 27,408 29,525 7.7 31,997 8.4 35,168 38,869 42,679 Minority interests 857 840 805 853 6.0 918 7.6 977 1,006 1,027 Total liabilities & equity 85,445 86,349 88,671 100,297 13.1 113,997 13.7 109,592 112,843 118,695
Cash flow (Rmbm) 12/16 12/17 12/18 12/19E % ch 12/20E % ch 12/21E 12/22E 12/23E Net income (before pref divs) 2,659 3,216 3,508 2,581 -26.4 2,861 10.8 3,534 4,302 4,458 Depreciation & amortisation 3,462 3,798 3,973 4,163 4.8 4,747 14.0 5,469 5,676 5,882 Net change in working capital (793) (1,643) (1,841) (766) 58.4 (2,214) -189.0 79 (980) (386) Other operating 2,011 2,513 2,455 2,092 -14.8 2,450 17.1 2,843 3,065 2,940 Operating cash flow 7,338 7,885 8,095 8,070 -0.3 7,844 -2.8 11,925 12,062 12,894 Tangible capital expenditure (7,877) (5,117) (3,125) (12,807) -309.9 (14,199) -10.9 (11,525) (4,307) (4,308) Intangible capital expenditure 0 0 0 0 - 0 - 0 0 0 Net (acquisitions) / disposals 0 0 0 0 - 0 - 0 0 0 Other investing 507 927 (1,276) 2,839 - 563 - (950) (2,581) 137 Investing cash flow (7,370) (4,191) (4,400) (9,968) -126.5 (13,636) -36.8 (12,475) (6,888) (4,171) Equity dividends paid (292) (433) (454) (465) -2.3 (389) 16.4 (431) (532) (648) Share issues / (buybacks) 0 1,909 0 0 - 0 - 0 0 0 Other financing (2,198) (2,285) (2,358) (2,439) -3.47 (2,667) -9.32 (2,875) (3,001) (3,099) Change in debt & pref shares 632 (1,718) 1,507 5,430 260.32 6,704 23.47 1,925 1,925 1,925 Financing cash flow (1,858) (2,527) (1,305) 2,526 - 3,649 44.5 (1,381) (1,609) (1,822) Cash flow inc/(dec) in cash (1,889) 1,167 2,389 628 -73.7 (2,143) - (1,932) 3,566 6,901 FX / non cash items (44) (1,234) (1,477) 0 100.0 0 -166.7 68 (68) 0 Balance sheet inc/(dec) in cash (1,934) (67) 912 628 -31.1 (2,143) - (1,864) 3,498 6,901 Source: Company accounts, UBS estimates. (UBS) metrics use reported figures which have been adjusted by UBS analysts.

Chinese Wind Power Sector 10 April 2019
42
Huaneng Renewable Corporation (0958.HK)
Valuation (x) 12/16 12/17 12/18 12/19E 12/20E 12/21E 12/22E 12/23E P/E (local GAAP, diluted) 7.5 7.1 6.8 7.8 7.1 5.7 4.7 4.5 P/E (UBS, diluted) 7.8 6.8 6.2 7.8 7.1 5.7 4.7 4.5 P/CEPS 3.3 3.2 3.1 3.0 2.7 2.3 2.0 2.0 Equity FCF (UBS) yield % (2.6) 13.4 20.0 (23.4) (31.4) 2.0 38.3 42.4 Net dividend yield (%) 2.0 1.9 2.0 1.9 2.1 2.6 3.2 3.3 P/BV x 1.0 1.0 0.9 0.7 0.6 0.6 0.5 0.5 EV/revenues (core) 7.6 6.7 6.3 6.4 6.4 5.9 5.5 5.3 EV/EBITDA (core) 8.4 7.3 7.2 7.4 7.4 6.8 6.3 6.1 EV/EBIT (core) 14.4 12.1 11.7 13.2 13.5 12.3 10.7 10.4 EV/OpFCF (core) 8.5 7.4 7.2 7.4 7.5 6.9 6.3 6.1 EV/op. invested capital 1.0 1.0 1.0 0.9 0.9 0.9 0.8 0.8
Enterprise value (Rmbm) 12/16 12/17 12/18 12/19E 12/20E 12/21E 12/22E 12/23E Market cap. 21,001 20,710 24,805 20,261 20,261 20,261 20,261 20,261 Net debt (cash) 48,899 49,634 48,449 48,449 57,238 63,556 64,664 64,664 Buy out of minorities 857 840 805 853 918 977 1,006 1,027 Pension provisions/other 0 0 0 0 0 0 0 0 Total enterprise value 70,756 71,184 74,058 69,563 78,417 84,794 85,931 85,952 Non core assets (206) (354) (301) (301) (301) (301) (301) (301) Core enterprise value 70,550 70,830 73,757 69,262 78,116 84,492 85,629 85,650
Growth (%) 12/16 12/17 12/18 12/19E 12/20E 12/21E 12/22E 12/23E Revenue 25.6 14.2 10.4 -6.8 12.4 18.0 8.0 3.5 EBITDA (UBS) 22.1 15.3 6.6 -8.5 12.1 17.1 10.4 3.4 EBIT (UBS) 19.2 19.3 7.9 -16.8 10.5 18.7 15.6 3.2 EPS (UBS, diluted) 60.8 24.3 10.2 -32.3 10.8 23.5 21.7 3.6 Net DPS 36.7 4.9 2.3 -16.4 10.8 23.5 21.7 3.6
Margins & Profitability (%) 12/16 12/17 12/18 12/19E 12/20E 12/21E 12/22E 12/23E Gross profit margin 62.5 64.0 65.9 61.7 61.1 62.0 63.5 63.5 EBITDA margin NM NM NM NM NM NM NM NM EBIT margin 53.1 55.5 54.2 48.4 47.6 47.9 51.2 51.1 Net earnings (UBS) margin 27.8 31.8 32.7 23.8 23.4 24.5 27.7 27.7 ROIC (EBIT) 7.2 8.1 8.4 6.6 6.6 7.1 7.8 8.0 ROIC post tax 6.7 7.3 7.4 5.6 5.6 6.1 6.6 6.6 ROE (UBS) 13.5 15.0 14.7 9.1 9.3 10.5 11.6 10.9
Capital structure & Coverage (x) 12/16 12/17 12/18 12/19E 12/20E 12/21E 12/22E 12/23E Net debt / EBITDA 6.0 5.1 4.7 5.6 5.8 5.3 4.7 4.2 Net debt / total equity % 240.0 192.1 170.2 173.9 187.3 181.1 160.2 134.8 Net debt / (net debt + total equity) % 70.6 65.8 63.0 63.5 65.2 64.4 61.6 57.4 Net debt/EV % 71.4 69.0 65.1 76.3 78.9 77.5 74.6 68.8 Capex / depreciation % NM 134.7 78.6 NM NM NM 75.9 73.2 Capex / revenue % NM NM 26.8 NM NM NM 27.7 26.8 EBIT / net interest 2.5 2.6 2.9 2.4 2.4 2.5 2.8 3.0 Dividend cover (UBS) 6.4 7.6 8.2 6.6 6.6 6.6 6.6 6.6 Div. payout ratio (UBS) % 15.6 13.1 12.2 15.1 15.1 15.1 15.1 15.1
Revenues by division (Rmbm) 12/16 12/17 12/18 12/19E 12/20E 12/21E 12/22E 12/23E Wind power 8,430 9,587 10,557 9,667 10,872 12,928 13,940 14,336 Solar power 802 962 1,089 1,184 1,324 1,467 1,612 1,760 Others 6 6 5 5 5 5 5 5 Others 0 0 0 0 0 0 0 0 Total 9,239 10,554 11,650 10,856 12,201 14,400 15,557 16,102
EBIT (UBS) by division (Rmbm) 12/16 12/17 12/18 12/19E 12/20E 12/21E 12/22E 12/23E Wind power 4,421 5,269 5,575 4,454 4,913 5,907 6,887 7,047 Solar power 487 586 742 802 894 987 1,081 1,176 Others 0 0 0 0 0 0 0 0 Others 0 0 0 0 0 0 0 0 Total 4,908 5,855 6,317 5,255 5,807 6,894 7,968 8,223 Source: Company accounts, UBS estimates. (UBS) metrics use reported figures which have been adjusted by UBS analysts.

Chinese Wind Power Sector 10 April 2019
43
Valuation Method and Risk Statement
We base our Goldwind A & H price targets on a sum-of-the-parts (SOTP) methodology, with valuation of each segment based on DCF. We base our Longyuan price target on a DCF valuation, assuming 7.7% WACC, 7.4% terminal ROIC, and 3.0% terminal growth. We base our Huaneng Renewable price target on a DCF methodology, assuming 7.5% WACC, 7.0% ROIC, and 3% terminal growth. The main risks for wind power equipment manufacturers include: better-than-expected WTG sales margin; higher WTG sales volume; and larger-than-expected increase in operating efficiency, i.e., lower SG&A costs. The main downside risks for China’s wind farm operators include: lower-than-expected utilisation rates; reduced levels of policy support for wind power (including VAT privileges, concessionary income tax treatments and special feed-in tariffs); and lower-than-expected prices for the sale of carbon-certified emission reduction credits.

Chinese Wind Power Sector 10 April 2019
44
Required Disclosures
This report has been prepared by UBS Securities Asia Limited, an affiliate of UBS AG. UBS AG, its subsidiaries, branches and affiliates are referred to herein as UBS.
For information on the ways in which UBS manages conflicts and maintains independence of its research product; historical performance information; and certain additional disclosures concerning UBS research recommendations, please visit www.ubs.com/disclosures. The figures contained in performance charts refer to the past; past performance is not a reliable indicator of future results. Additional information will be made available upon request. UBS Securities Co. Limited is licensed to conduct securities investment consultancy businesses by the China Securities Regulatory Commission. UBS acts or may act as principal in the debt securities (or in related derivatives) that may be the subject of this report. This recommendation was finalized on: 10 April 2019 09:05 AM GMT. UBS has designated certain Research department members as Derivatives Research Analysts where those department members publish research principally on the analysis of the price or market for a derivative, and provide information reasonably sufficient upon which to base a decision to enter into a derivatives transaction. Where Derivatives Research Analysts co-author research reports with Equity Research Analysts or Economists, the Derivatives Research Analyst is responsible for the derivatives investment views, forecasts, and/or recommendations.
Analyst Certification:Each research analyst primarily responsible for the content of this research report, in whole or in part, certifies that with respect to each security or issuer that the analyst covered in this report: (1) all of the views expressed accurately reflect his or her personal views about those securities or issuers and were prepared in an independent manner, including with respect to UBS, and (2) no part of his or her compensation was, is, or will be, directly or indirectly, related to the specific recommendations or views expressed by that research analyst in the research report.
UBS Investment Research: Global Equity Rating Definitions
12-Month Rating Definition Coverage1 IB Services2
Buy FSR is > 6% above the MRA. 47% 25%
Neutral FSR is between -6% and 6% of the MRA. 39% 22%
Sell FSR is > 6% below the MRA. 14% 19%
Short-Term Rating Definition Coverage3 IB Services4
Buy Stock price expected to rise within three months from the time the rating was assigned because of a specific catalyst or event. <1% <1%
Sell Stock price expected to fall within three months from the time the rating was assigned because of a specific catalyst or event. <1% <1%
Source: UBS. Rating allocations are as of 31 March 2019. 1:Percentage of companies under coverage globally within the 12-month rating category. 2:Percentage of companies within the 12-month rating category for which investment banking (IB) services were provided within the past 12 months. 3:Percentage of companies under coverage globally within the Short-Term rating category. 4:Percentage of companies within the Short-Term rating category for which investment banking (IB) services were provided within the past 12 months.
KEY DEFINITIONS:Forecast Stock Return (FSR) is defined as expected percentage price appreciation plus gross dividend yield over the next 12 months. In some cases, this yield may be based on accrued dividends. Market Return Assumption (MRA) is defined as the one-year local market interest rate plus 5% (a proxy for, and not a forecast of, the equity risk premium). Under Review (UR) Stocks may be flagged as UR by the analyst, indicating that the stock's price target and/or rating are subject to possible change in the near term, usually in response to an event that may affect the investment case or valuation. Short-Term Ratings reflect the expected near-term (up to three months) performance of the stock and do not reflect any change in the fundamental view or investment case. Equity Price Targets have an investment horizon of 12 months.

Chinese Wind Power Sector 10 April 2019
45
EXCEPTIONS AND SPECIAL CASES:UK and European Investment Fund ratings and definitions are: Buy: Positive on factors such as structure, management, performance record, discount; Neutral: Neutral on factors such as structure, management, performance record, discount; Sell: Negative on factors such as structure, management, performance record, discount. Core Banding Exceptions (CBE): Exceptions to the standard +/-6% bands may be granted by the Investment Review Committee (IRC). Factors considered by the IRC include the stock's volatility and the credit spread of the respective company's debt. As a result, stocks deemed to be very high or low risk may be subject to higher or lower bands as they relate to the rating. When such exceptions apply, they will be identified in the Company Disclosures table in the relevant research piece.
Research analysts contributing to this report who are employed by any non-US affiliate of UBS Securities LLC are not registered/qualified as research analysts with FINRA. Such analysts may not be associated persons of UBS Securities LLC and therefore are not subject to the FINRA restrictions on communications with a subject company, public appearances, and trading securities held by a research analyst account. The name of each affiliate and analyst employed by that affiliate contributing to this report, if any, follows.
UBS Securities Co. Limited: Abigail Sun. UBS AG Hong Kong Branch: Ken Liu; Simon Powell.
Company Disclosures
Company Name Reuters 12-month rating Short-term rating Price Price date
China Longyuan Power16 0916.HK Buy N/A HK$5.47 09 Apr 2019
Huaneng Renewable Corporation13 0958.HK Buy N/A HK$2.24 09 Apr 2019
Xinjiang Goldwind Science & Technology13, 18 2208.HK Buy N/A HK$10.28 09 Apr 2019
Xinjiang Goldwind Science & Technology-A13, 18 002202.SZ Buy N/A Rmb13.80 09 Apr 2019
Source: UBS. All prices as of local market close. Ratings in this table are the most current published ratings prior to this report. They may be more recent than the stock pricing date 13. UBS AG, its affiliates or subsidiaries beneficially owned 1% or more of a class of this company`s common equity
securities as of last month`s end (or the prior month`s end if this report is dated less than 10 days after the most recent month`s end).
16. UBS Securities Hong Kong Limited is a market maker in the Hong Kong-listed securities of this company. 18. Market capitalisation is calculated by multiplying the current share price by the sum of A and H shares.
Unless otherwise indicated, please refer to the Valuation and Risk sections within the body of this report. For a complete set of disclosure statements associated with the companies discussed in this report, including information on valuation and risk, please contact UBS Securities LLC, 1285 Avenue of Americas, New York, NY 10019, USA, Attention: Investment Research.
China Longyuan Power (HK$)
01-F
eb-1
6
01-A
pr-1
6
01-Ju
n-16
01-A
ug-1
6
01-O
ct-1
6
01-D
ec-1
6
01-F
eb-1
7
01-A
pr-1
7
01-Ju
n-17
01-A
ug-1
7
0 1- O
ct- 1
7
01-D
ec-1
7
01-F
eb-1
8
01-A
pr-1
8
01-Ju
n-1 8
0 1- A
ug-1
8
01-O
ct-1
8
01-D
ec-1
8
01-F
eb-1
9
01-A
pr-1
9
0.0
2.0
4.0
6.0
8.0
10.0
Price Target (HK$) Stock Price (HK$)
BuyNo Rating

Chinese Wind Power Sector 10 April 2019
46
Date Stock Price (HK$) Price Target (HK$) Rating
2016-01-08 5.25 - No Rating 2016-02-06 4.01 9.5 Buy 2016-07-21 6.4 8.5 Buy 2016-11-08 6.2 8.4 Buy 2017-01-13 6.33 8.3 Buy 2017-04-12 6.04 7.7 Buy 2017-08-17 6.0 7.6 Buy 2017-10-26 6.23 7.5 Buy 2018-03-26 5.8 8.0 Buy 2018-04-11 6.8 8.5 Buy 2018-04-26 6.96 9.0 Buy 2018-11-02 6.16 8.7 Buy
Source: UBS; as of 09 Apr 2019
Huaneng Renewable Corporation (HK$)
01-F
eb-1
6
01-A
pr-1
6
01-Ju
n-16
01-A
ug-1
6
01-O
ct-1
6
01-D
ec-1
6
01-F
eb-1
7
01-A
pr-1
7
01-Ju
n-17
01-A
ug-1
7
01-O
ct-1
7
01- D
ec-1
7
01-F
eb-1
8
01-A
pr-1
8
01- Ju
n-1 8
01-A
ug-1
8
01-O
ct-1
8
0 1-D
ec- 1
8
01- F
eb-1
9
01-A
pr-1
9
0.00
1.00
2.00
3.00
4.00
5.00
Price Target (HK$) Stock Price (HK$)
Buy
Date Stock Price (HK$) Price Target (HK$) Rating
2016-01-08 2.08 3.8 Buy 2016-07-21 2.47 3.4 Buy 2016-09-07 3.1 3.5 Buy 2017-06-12 2.47 3.3 Buy 2017-08-17 2.39 3.2 Buy 2018-03-26 2.94 3.5 Buy 2018-04-11 3.17 4.1 Buy 2018-11-02 2.19 3.0 Buy
Source: UBS; as of 09 Apr 2019

Chinese Wind Power Sector 10 April 2019
47
Xinjiang Goldwind Science & Technology (HK$)
01-F
eb-1
6
01-A
p r-1
6
01-Ju
n-16
01-A
ug-1
6
01- O
ct-1
6
01-D
ec-1
6
01-F
eb-1
7
01-A
pr-1
7
01-J u
n-17
01-A
ug-1
7
01-O
ct- 1
7
0 1-D
ec- 1
7
01- F
eb-1
8
01-A
pr-1
8
01- Ju
n -18
01- A
ug- 1
8
01-O
c t- 1
8
01-D
ec-1
8
01-F
eb-1
9
01-A
pr-1
9
0.0
5.0
10.0
15.0
20.0
Price Target (HK$) Stock Price (HK$)
BuySell
No Rating
Date Stock Price (HK$) Price Target (HK$) Rating
2016-01-08 9.25 - No Rating 2016-02-19 6.87 6.89 Sell 2017-01-27 9.36 - No Rating 2017-04-20 7.89 10.49 Buy 2017-07-17 7.85 10.28 Buy 2017-10-31 9.22 10.97 Buy 2018-01-05 12.7 15.3 Buy 2018-04-03 11.65 15.35 Buy 2018-08-14 8.24 12.14 Buy 2018-11-13 7.56 9.98 Buy 2019-01-22 6.75 9.99 Buy 2019-02-18 8.94 12.0 Buy
Source: UBS; as of 09 Apr 2019
Xinjiang Goldwind Science & Technology-A (Rmb)
01-F
eb-1
6
01-A
pr-1
6
01-Ju
n-16
01-A
ug-1
6
01-O
ct-1
6
01-D
ec-1
6
01-F
eb-1
7
01-A
pr-1
7
01-Ju
n-17
01-A
ug-1
7
0 1- O
ct- 1
7
01-D
ec-1
7
01-F
eb-1
8
01-A
pr-1
8
01- Ju
n -18
01- A
u g- 1
8
01-O
ct-1
8
01-D
ec-1
8
01-F
eb-1
9
01-A
pr-1
9
0.0
5.0
10.0
15.0
20.0
Price Target (Rmb) Stock Price (Rmb)
BuyNeutral
No Rating

Chinese Wind Power Sector 10 April 2019
48
Date Stock Price (Rmb) Price Target (Rmb) Rating
2016-01-08 14.51 - No Rating 2017-04-20 11.37 12.84 Buy 2017-07-17 10.38 12.5 Buy 2017-10-31 13.44 14.23 Neutral 2018-01-05 17.48 19.41 Neutral 2018-04-03 15.82 17.89 Neutral 2018-08-14 12.03 13.13 Neutral 2018-10-17 8.58 12.06 Buy 2018-11-13 10.61 11.96 Buy 2019-01-22 10.24 12.81 Buy 2019-02-18 13.07 17.0 Buy
Source: UBS; as of 09 Apr 2019

Chinese Wind Power Sector 10 April 2019
49
Global Disclaimer This document has been prepared by UBS Securities Asia Limited, an affiliate of UBS AG. UBS AG, its subsidiaries, branches and affiliates are referred to herein as UBS.
This Document is provided solely to recipients who are expressly authorized by UBS to receive it. If you are not so authorized you must immediately destroy the Document.
Global Research is provided to our clients through UBS Neo, and in certain instances, UBS.com and any other system or distribution method specifically identified in one or more communications distributed through UBS Neo or UBS.com (each a system) as an approved means for distributing Global Research. It may also be made available through third party vendors and distributed by UBS and/or third parties via e-mail or alternative electronic means. The level and types of services provided by Global Research to a client may vary depending upon various factors such as a client's individual preferences as to the frequency and manner of receiving communications, a client's risk profile and investment focus and perspective (e.g., market wide, sector specific, long-term, short-term, etc.), the size and scope of the overall client relationship with UBS and legal and regulatory constraints.
All Global Research is available on UBS Neo. Please contact your UBS sales representative if you wish to discuss your access to UBS Neo.
When you receive Global Research through a System, your access and/or use of such Global Research is subject to this Global Research Disclaimer and to the UBS Neo Platform Use Agreement (the "Neo Terms") together with any other relevant terms of use governing the applicable System.
When you receive Global Research via a third party vendor, e-mail or other electronic means, you agree that use shall be subject to this Global Research Disclaimer, the Neo Terms and where applicable the UBS Investment Bank terms of business (https://www.ubs.com/global/en/investment-bank/regulatory.html) and to UBS's Terms of Use/Disclaimer (http://www.ubs.com/global/en/legalinfo2/disclaimer.html). In addition, you consent to UBS processing your personal data and using cookies in accordance with our Privacy Statement (http://www.ubs.com/global/en/legalinfo2/privacy.html) and cookie notice (http://www.ubs.com/global/en/homepage/cookies/cookie-management.html).
If you receive Global Research, whether through a System or by any other means, you agree that you shall not copy, revise, amend, create a derivative work, provide to any third party, or in any way commercially exploit any UBS research provided via Global Research or otherwise, and that you shall not extract data from any research or estimates provided to you via Global Research or otherwise, without the prior written consent of UBS.
This document is for distribution only as may be permitted by law. It is not directed to, or intended for distribution to or use by, any person or entity who is a citizen or resident of or located in any locality, state, country or other jurisdiction where such distribution, publication, availability or use would be contrary to law or regulation or would subject UBS to any registration or licensing requirement within such jurisdiction.
This document is a general communication and is educational in nature; it is not an advertisement nor is it a solicitation or an offer to buy or sell any financial instruments or to participate in any particular trading strategy. Nothing in this document constitutes a representation that any investment strategy or recommendation is suitable or appropriate to an investor’s individual circumstances or otherwise constitutes a personal recommendation. By providing this document, none of UBS or its representatives has any responsibility or authority to provide or have provided investment advice in a fiduciary capacity or otherwise. Investments involve risks, and investors should exercise prudence and their own judgment in making their investment decisions. None of UBS or its representatives is suggesting that the recipient or any other person take a specific course of action or any action at all. By receiving this document, the recipient acknowledges and agrees with the intended purpose described above and further disclaims any expectation or belief that the information constitutes investment advice to the recipient or otherwise purports to meet the investment objectives of the recipient. The financial instruments described in the document may not be eligible for sale in all jurisdictions or to certain categories of investors.
Options, structured derivative products and futures (including OTC derivatives) are not suitable for all investors. Trading in these instruments is considered risky and may be appropriate only for sophisticated investors. Prior to buying or selling an option, and for the complete risks relating to options, you must receive a copy of "The Characteristics and Risks of Standardized Options." You may read the document at http://www.theocc.com/publications/risks/riskchap1.jsp or ask your salesperson for a copy. Various theoretical explanations of the risks associated with these instruments have been published. Supporting documentation for any claims, comparisons, recommendations, statistics or other technical data will be supplied upon request. Past performance is not necessarily indicative of future results. Transaction costs may be significant in option strategies calling for multiple purchases and sales of options, such as spreads and straddles. Because of the importance of tax considerations to many options transactions, the investor considering options should consult with his/her tax advisor as to how taxes affect the outcome of contemplated options transactions.
Mortgage and asset-backed securities may involve a high degree of risk and may be highly volatile in response to fluctuations in interest rates or other market conditions. Foreign currency rates of exchange may adversely affect the value, price or income of any security or related instrument referred to in the document. For investment advice, trade execution or other enquiries, clients should contact their local sales representative.
The value of any investment or income may go down as well as up, and investors may not get back the full (or any) amount invested. Past performance is not necessarily a guide to future performance. Neither UBS nor any of its directors, employees or agents accepts any liability for any loss (including investment loss) or damage arising out of the use of all or any of the Information.
Prior to making any investment or financial decisions, any recipient of this document or the information should take steps to understand the risk and return of the investment and seek individualized advice from his or her personal financial, legal, tax and other professional advisors that takes into account all the particular facts and circumstances of his or her investment objectives.
Any prices stated in this document are for information purposes only and do not represent valuations for individual securities or other financial instruments. There is no representation that any transaction can or could have been effected at those prices, and any prices do not necessarily reflect UBS's internal books and records or theoretical model-based valuations and may be based on certain assumptions. Different assumptions by UBS or any other source may yield substantially different results.
No representation or warranty, either expressed or implied, is provided in relation to the accuracy, completeness or reliability of the information contained in any materials to which this document relates (the "Information"), except with respect to Information concerning UBS. The Information is not intended to be a complete statement or summary of the securities, markets or developments referred to in the document. UBS does not undertake to update or keep current the Information. Any opinions expressed in this document may change without notice and may differ or be contrary to opinions expressed by other business areas or groups, personnel or other representative of UBS. Any statements contained in this report attributed to a third party represent UBS's interpretation of the data, information and/or opinions provided by that third party either publicly or through a subscription service, and such use and interpretation have not been reviewed by the third party. In no circumstances may this document or any of the Information (including any forecast, value, index or other calculated amount ("Values")) be used for any of the following purposes:
(i) valuation or accounting purposes;
(ii) to determine the amounts due or payable, the price or the value of any financial instrument or financial contract; or
(iii) to measure the performance of any financial instrument including, without limitation, for the purpose of tracking the return or performance of any Value or of defining the asset allocation of portfolio or of computing performance fees.
By receiving this document and the Information you will be deemed to represent and warrant to UBS that you will not use this document or any of the Information for any of the above purposes or otherwise rely upon this document or any of the Information.
UBS has policies and procedures, which include, without limitation, independence policies and permanent information barriers, that are intended, and upon which UBS relies, to manage potential conflicts of interest and control the flow of information within divisions of UBS and among its subsidiaries, branches and affiliates. For further information on the ways in which UBS manages conflicts and maintains independence of its research products, historical performance information and certain additional disclosures concerning UBS research recommendations, please visit www.ubs.com/disclosures.
Research will initiate, update and cease coverage solely at the discretion of UBS Research Management, which will also have sole discretion on the timing and frequency of any published research product. The analysis contained in this document is based on numerous assumptions. All material information in relation to published research reports, such as valuation methodology, risk statements, underlying assumptions (including sensitivity analysis of those assumptions), ratings history etc. as required by the Market Abuse Regulation, can be found on UBS Neo. Different assumptions could result in materially different results.
The analyst(s) responsible for the preparation of this document may interact with trading desk personnel, sales personnel and other parties for the purpose of gathering, applying and interpreting market information. UBS relies on information barriers to control the flow of information contained in one or more areas within UBS into other

Chinese Wind Power Sector 10 April 2019
50
areas, units, groups or affiliates of UBS. The compensation of the analyst who prepared this document is determined exclusively by research management and senior management (not including investment banking). Analyst compensation is not based on investment banking revenues; however, compensation may relate to the revenues of UBS and/or its divisions as a whole, of which investment banking, sales and trading are a part, and UBS's subsidiaries, branches and affiliates as a whole.
For financial instruments admitted to trading on an EU regulated market: UBS AG, its affiliates or subsidiaries (excluding UBS Securities LLC) acts as a market maker or liquidity provider (in accordance with the interpretation of these terms under English law or, if not carried out by UBS in the UK the law of the relevant jurisdiction in which UBS determines it carries out the activity) in the financial instruments of the issuer save that where the activity of liquidity provider is carried out in accordance with the definition given to it by the laws and regulations of any other EU jurisdictions, such information is separately disclosed in this document. For financial instruments admitted to trading on a non-EU regulated market: UBS may act as a market maker save that where this activity is carried out in the US in accordance with the definition given to it by the relevant laws and regulations, such activity will be specifically disclosed in this document. UBS may have issued a warrant the value of which is based on one or more of the financial instruments referred to in the document. UBS and its affiliates and employees may have long or short positions, trade as principal and buy and sell in instruments or derivatives identified herein; such transactions or positions may be inconsistent with the opinions expressed in this document.
Within the past 12 months UBS AG, its affiliates or subsidiaries may have received or provided investment services and activities or ancillary services as per MiFID II which may have given rise to a payment or promise of a payment in relation to these services from or to this company.
Where Global Research refers to "UBS Evidence Lab Inside" or has made use of data provided by UBS Evidence Lab you understand that UBS Evidence Lab is a separate department to Global Research and that UBS Evidence Lab does not provide research, investment recommendations or advice.
United Kingdom: This material is distributed by UBS AG, London Branch to persons who are eligible counterparties or professional clients. UBS AG, London Branch is authorised by the Prudential Regulation Authority and subject to regulation by the Financial Conduct Authority and limited regulation by the Prudential Regulation Authority. Europe: Except as otherwise specified herein, these materials are distributed by UBS Europe SE, a subsidiary of UBS AG, to persons who are eligible counterparties or professional clients (as detailed in the Bundesanstalt fur Finanzdienstleistungsaufsicht (BaFin)Rules and according to MIFID) and are only available to such persons. The information does not apply to, and should not be relied upon by, retail clients. UBS Europe SE is authorised by the [European Central Bank (ECB)] and regulated by the BaFin and the ECB. France: Prepared by UBS Europe SE and distributed by UBS Europe SE and UBS Securities France S.A. UBS Securities France S.A. is regulated by the ACPR (Autorité de Contrôle Prudentiel et de Résolution) and the Autorité des Marchés Financiers (AMF). Where an analyst of UBS Securities France S.A. has contributed to this document, the document is also deemed to have been prepared by UBS Securities France S.A. Germany, Luxembourg, the Netherlands, Belgium and Ireland: Prepared by UBS AG, London Branch and distributed by UBS AG, London Branch and UBS Europe SE. Spain: Prepared by UBS Europe SE and distributed by UBS Europe SE and UBS Securities España SV, SA. UBS Securities España SV, SA is regulated by the Comisión Nacional del Mercado de Valores (CNMV). Turkey: Distributed by UBS AG, London Branch. No information in this document is provided for the purpose of offering, marketing and sale by any means of any capital market instruments and services in the Republic of Turkey. Therefore, this document may not be considered as an offer made or to be made to residents of the Republic of Turkey. UBS AG, London Branch is not licensed by the Turkish Capital Market Board under the provisions of the Capital Market Law (Law No. 6362). Accordingly, neither this document nor any other offering material related to the instruments/services may be utilized in connection with providing any capital market services to persons within the Republic of Turkey without the prior approval of the Capital Market Board. However, according to article 15 (d) (ii) of the Decree No. 32, there is no restriction on the purchase or sale of the securities abroad by residents of the Republic of Turkey. Poland: Distributed by UBS Europe SE (spolka z ograniczona odpowiedzialnoscia) Oddzial w Polsce regulated by the Polish Financial Supervision Authority. Where an analyst of UBS Europe SE (spolka z ograniczona odpowiedzialnoscia) Oddzial w Polsce has contributed to this document, the document is also deemed to have been prepared by UBS Europe SE (spolka z ograniczona odpowiedzialnoscia) Oddzial w Polsce. Russia: Prepared and distributed by UBS Bank (OOO). Switzerland: Distributed by UBS AG to persons who are institutional investors only. UBS AG is regulated by the Swiss Financial Market Supervisory Authority (FINMA). Italy: Prepared by UBS Europe SE and distributed by UBS Europe SE and UBS Europe SE, Italy Branch. Where an analyst of UBS Europe SE, Italy Branch has contributed to this document, the document is also deemed to have been prepared by UBS Europe SE, Italy Branch.South Africa: Distributed by UBS South Africa (Pty) Limited (Registration No. 1995/011140/07), an authorised user of the JSE and an authorised Financial Services Provider (FSP 7328). Israel: This material is distributed by UBS AG, London Branch. UBS Securities Israel Ltd is a licensed Investment Marketer that is supervised by the Israel Securities Authority (ISA). UBS AG, London Branch and its affiliates incorporated outside Israel are not licensed under the Israeli Advisory Law. UBS AG, London Branch is not covered by insurance as required from a licensee under the Israeli Advisory Law. UBS may engage among others in issuance of Financial Assets or in distribution of Financial Assets of other issuers for fees or other benefits. UBS AG, London Branch and its affiliates may prefer various Financial Assets to which they have or may have Affiliation (as such term is defined under the Israeli Advisory Law). Nothing in this Material should be considered as investment advice under the Israeli Advisory Law. This Material is being issued only to and/or is directed only at persons who are Eligible Clients within the meaning of the Israeli Advisory Law, and this material must not be relied on or acted upon by any other persons. Saudi Arabia: This document has been issued by UBS AG (and/or any of its subsidiaries, branches or affiliates), a public company limited by shares, incorporated in Switzerland with its registered offices at Aeschenvorstadt 1, CH-4051 Basel and Bahnhofstrasse 45, CH-8001 Zurich. This publication has been approved by UBS Saudi Arabia (a subsidiary of UBS AG), a Saudi closed joint stock company incorporated in the Kingdom of Saudi Arabia under commercial register number 1010257812 having its registered office at Tatweer Towers, P.O. Box 75724, Riyadh 11588, Kingdom of Saudi Arabia. UBS Saudi Arabia is authorized and regulated by the Capital Market Authority to conduct securities business under license number 08113-37. UAE / Dubai: The information distributed by UBS AG Dubai Branch is only intended for Professional Clients and/or Market Counterparties, as classified under the DFSA rulebook. No other person should act upon this material/communication. The information is not for further distribution within the United Arab Emirates. UBS AG Dubai Branch is regulated by the DFSA in the DIFC. UBS is not licensed to provide banking services in the UAE by the Central Bank of the UAE, nor is it licensed by the UAE Securities and Commodities Authority. United States: Distributed to US persons by either UBS Securities LLC or by UBS Financial Services Inc., subsidiaries of UBS AG; or by a group, subsidiary or affiliate of UBS AG that is not registered as a US broker-dealer (a ‘non-US affiliate’) to major US institutional investors only. UBS Securities LLC or UBS Financial Services Inc. accepts responsibility for the content of a document prepared by another non-US affiliate when distributed to US persons by UBS Securities LLC or UBS Financial Services Inc. All transactions by a US person in the securities mentioned in this document must be effected through UBS Securities LLC or UBS Financial Services Inc., and not through a non-US affiliate. UBS Securities LLC is not acting as a municipal advisor to any municipal entity or obligated person within the meaning of Section 15B of the Securities Exchange Act (the "Municipal Advisor Rule"), and the opinions or views contained herein are not intended to be, and do not constitute, advice within the meaning of the Municipal Advisor Rule. Canada: Distributed by UBS Securities Canada Inc., a registered investment dealer in Canada and a Member-Canadian Investor Protection Fund, or by another affiliate of UBS AG that is registered to conduct business in Canada or is otherwise exempt from registration. Mexico: This report has been distributed and prepared by UBS Casa de Bolsa, S.A. de C.V., UBS Grupo Financiero, an entity that is part of UBS Grupo Financiero, S.A. de C.V. and is a subsidiary of UBS AG. This document is intended for distribution to institutional or sophisticated investors only. Research reports only reflect the views of the analysts responsible for the reports. Analysts do not receive any compensation from persons or entities different from UBS Casa de Bolsa, S.A. de C.V., UBS Grupo Financiero, or different from entities belonging to the same financial group or business group of such. For Spanish translations of applicable disclosures, please go to www.ubs.com/disclosures. Brazil: Except as otherwise specified herein, this material is prepared by UBS Brasil CCTVM S.A. to persons who are eligible investors residing in Brazil, which are considered to be Investidores Profissionais, as designated by the applicable regulation, mainly the CVM Instruction No. 539 from the 13th of November 2013 (determines the duty to verify the suitability of products, services and transactions with regards to the client´s profile). Hong Kong: Distributed by UBS Securities Asia Limited and/or UBS AG, Hong Kong Branch. Please contact local licensed/registered representatives of UBS Securities Asia Limited and/or UBS AG, Hong Kong Branch in respect of any matters arising from, or in connection with, the analysis or document. Singapore: Distributed by UBS Securities Pte. Ltd. [MCI (P) 009/09/2018 and Co. Reg. No.: 198500648C] or UBS AG, Singapore Branch. Please contact UBS Securities Pte. Ltd., an exempt financial adviser under the Singapore Financial Advisers Act (Cap. 110); or UBS AG, Singapore Branch, an exempt financial adviser under the Singapore Financial Advisers Act (Cap. 110) and a wholesale bank licensed under the Singapore Banking Act (Cap. 19) regulated by the Monetary Authority of Singapore, in respect of any matters arising from, or in connection with, the analysis or document. The recipients of this document represent and warrant that they are accredited and institutional investors as defined in the Securities and Futures Act (Cap. 289). Japan: Distributed by UBS Securities Japan Co., Ltd. to professional investors (except as otherwise permitted). Where this document has been prepared by UBS Securities Japan Co., Ltd., UBS Securities Japan Co., Ltd. is the author, publisher and distributor of the document. Distributed by UBS AG, Tokyo Branch to Professional Investors (except as otherwise permitted) in relation to foreign exchange and other banking businesses when relevant. Australia: Clients of UBS AG: Distributed by UBS AG (ABN 47 088 129 613 and holder of Australian Financial Services License No. 231087). Clients of UBS Securities Australia Ltd: Distributed by UBS Securities Australia Ltd (ABN 62 008 586 481 and holder of Australian Financial Services License No. 231098). This Document contains general information and/or general advice only and does not constitute personal financial product advice. As such, the Information in this document has been prepared without taking into account any investor’s objectives, financial situation or needs, and investors should, before acting on the Information, consider the appropriateness of the Information, having regard to their objectives, financial situation and needs. If the Information contained in this document relates to the acquisition, or potential acquisition of a particular financial product by a ‘Retail’ client as defined by section 761G of the Corporations Act 2001 where a Product Disclosure Statement would be required, the retail client should obtain and consider the Product Disclosure Statement relating to the product before making any decision about whether to acquire the product. The UBS Securities Australia Limited Financial Services Guide is available at: www.ubs.com/ecs-research-fsg. New Zealand: Distributed by UBS New Zealand Ltd. UBS New Zealand Ltd is not a registered bank in New Zealand. You are being provided with this UBS publication or material because you have indicated to UBS that you are a “wholesale client” within the meaning of section 5C of the Financial Advisers Act 2008 of New Zealand (Permitted Client). This publication or material is not intended for clients who are not Permitted Clients (non-permitted Clients). If you are a non-permitted Client you must not rely on this publication or material. If despite this

Chinese Wind Power Sector 10 April 2019
51
warning you nevertheless rely on this publication or material, you hereby (i) acknowledge that you may not rely on the content of this publication or material and that any recommendations or opinions in such this publication or material are not made or provided to you, and (ii) to the maximum extent permitted by law (a) indemnify UBS and its associates or related entities (and their respective Directors, officers, agents and Advisors) (each a ‘Relevant Person’) for any loss, damage, liability or claim any of them may incur or suffer as a result of, or in connection with, your unauthorised reliance on this publication or material and (b) waive any rights or remedies you may have against any Relevant Person for (or in respect of) any loss, damage, liability or claim you may incur or suffer as a result of, or in connection with, your unauthorised reliance on this publication or material. Korea: Distributed in Korea by UBS Securities Pte. Ltd., Seoul Branch. This document may have been edited or contributed to from time to time by affiliates of UBS Securities Pte. Ltd., Seoul Branch. This material is intended for professional/institutional clients only and not for distribution to any retail clients. Malaysia: This material is authorized to be distributed in Malaysia by UBS Securities Malaysia Sdn. Bhd (Capital Markets Services License No.: CMSL/A0063/2007). This material is intended for professional/institutional clients only and not for distribution to any retail clients. India: Distributed by UBS Securities India Private Ltd. (Corporate Identity Number U67120MH1996PTC097299) 2/F, 2 North Avenue, Maker Maxity, Bandra Kurla Complex, Bandra (East), Mumbai (India) 400051. Phone: +912261556000. It provides brokerage services bearing SEBI Registration Numbers: NSE (Capital Market Segment): INB230951431, NSE (F&O Segment) INF230951431, NSE (Currency Derivatives Segment) INE230951431, BSE (Capital Market Segment) INB010951437; merchant banking services bearing SEBI Registration Number: INM000010809 and Research Analyst services bearing SEBI Registration Number: INH000001204. UBS AG, its affiliates or subsidiaries may have debt holdings or positions in the subject Indian company/companies. Within the past 12 months, UBS AG, its affiliates or subsidiaries may have received compensation for non-investment banking securities-related services and/or non-securities services from the subject Indian company/companies. The subject company/companies may have been a client/clients of UBS AG, its affiliates or subsidiaries during the 12 months preceding the date of distribution of the research report with respect to investment banking and/or non-investment banking securities-related services and/or non-securities services. With regard to information on associates, please refer to the Annual Report at: http://www.ubs.com/global/en/about_ubs/investor_relations/annualreporting.htmlTaiwan: Distributed by UBS Securities Pte. Ltd., Taipei Branch which is regulated by the Taiwan Securities and Futures Bureau. Indonesia: This report is being distributed by PT UBS Sekuritas Indonesia and is delivered by its licensed employee(s), including marketing/sales person, to its client. PT UBS Sekuritas Indonesia, having its registered office at Wisma GKBI, 22nd floor, JL. Jend. Sudirman, kav.28, Jakarta 10210, Indonesia, is a subsidiary company of UBS AG and licensed under Capital Market Law no. 8 year 1995, a holder of broker-dealer and underwriter licenses issued by the Capital Market and Financial Institution Supervisory Agency (now Otoritas Jasa Keuangan/OJK). PT UBS Sekuritas Indonesia is also a member of Indonesia Stock Exchange and supervised by Otoritas Jasa Keuangan (OJK). Neither this report nor any copy hereof may be distributed in Indonesia or to any Indonesian citizens except in compliance with applicable Indonesian capital market laws and regulations. This report is not an offer of securities in Indonesia and may not be distributed within the territory of the Republic of Indonesia or to Indonesian citizens in circumstance which constitutes an offering within the meaning of Indonesian capital market laws and regulations.
The disclosures contained in research documents produced by UBS AG, London Branch or UBS Europe SE shall be governed by and construed in accordance with English law.
UBS specifically prohibits the redistribution of this document in whole or in part without the written permission of UBS and in any event UBS accepts no liability whatsoever for any redistribution of this document or its contents or the actions of third parties in this respect. Images may depict objects or elements that are protected by third party copyright, trademarks and other intellectual property rights. © UBS 2019. The key symbol and UBS are among the registered and unregistered trademarks of UBS. All rights reserved.


![[D1] RE in Chinese Taipei - egnret.ewg.apec.org · Tai-Power Co. (30 MW, 2007) 1,500 kW x 20 Taichung Wind Farm Tai-Power Co. ... Microsoft PowerPoint - [D1] RE in Chinese Taipei](https://img.dokumen.tips/doc/110x75/5b85bd9e7f8b9a317e8ebcaa/d1-re-in-chinese-taipei-tai-power-co-30-mw-2007-1500-kw-x-20-taichung.jpg)