Embed Size (px)
Citation preview

Chinese Second National Communication (SNC)GHG Inventory of Waste Sector
Gao Qingxian
Chinese Research Academy of Environmental Science (CRAES)
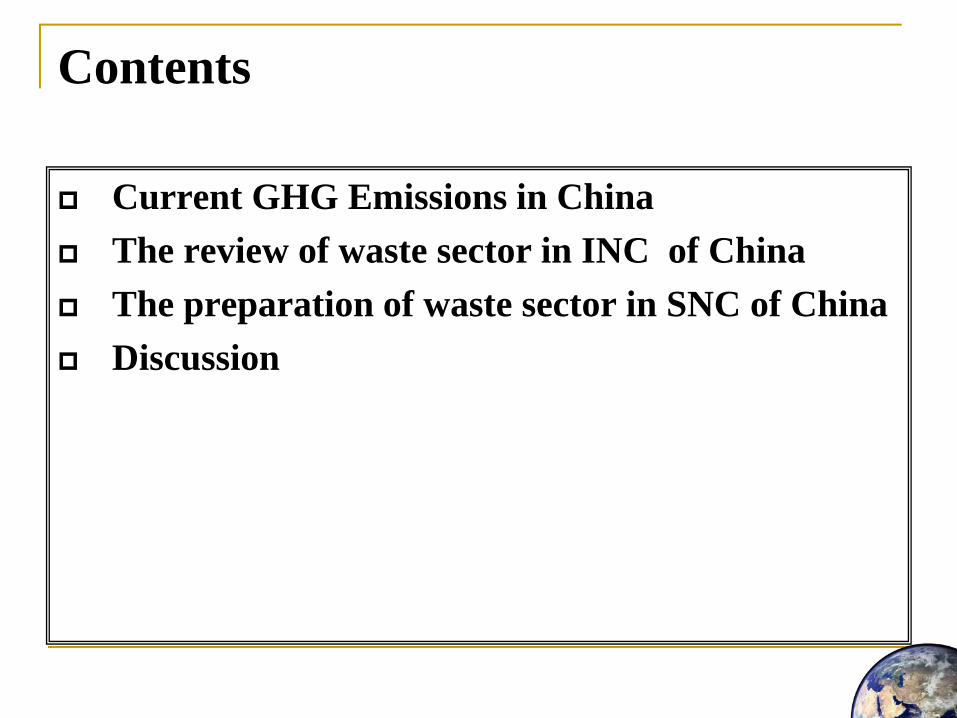
Contents
Current GHG Emissions in ChinaThe review of waste sector in INC of ChinaThe preparation of waste sector in SNC of ChinaDiscussion

Current GHG Emissions in China
According to the Initial NationalCommunication on Climate Change of thePeople’s Republic of China, The nationaltotal amount of carbon dioxide emission in1994 was 3,073 million tons, and carbonsink from land-use change and forestry wasabout 407 million tons. The net carbondioxide was 2,666 million tons, and the percapita emission was about 0.6 ton carbonper year.

The total GHG in China in 1994 was3650 million tons of carbon dioxideequivalent, of which carbon dioxide,methane and nitrous oxide account for73.05%, 19.73%, and 7.22% respectively.
Current GHG Emissions in China

2795489
277980
0
-407479
0
-500000 0 500000 10000001500000200000025000003000000
Energy
Industry Process
Agricultural
Land Use and Forestry
Waste Management
The GHG Emission in different sectors of China (1994)
Unit:Gg(1000t)
Current GHG Emissions in China

The CO2 emission fromenergy sector was 2795million tons in 1994.
The CO2 emission fromindustrial process was 278million tons in 1994
56.76%33.66%
8.16% 1.43%
Cement Lime Iron & steel Calcium carbide
43.74%
34.41%
5.94%
2.72% 9.73% 3.47%
Industry Energy Transport Commercial Resident Others
Current GHG Emissions in China

The methane emission was about 34.29 million tons in 1994
The nitrous oxide emission was about 850,000 tons in 1994.
6.26% 0.36%20.71%
17.93%2.53%
29.70%
22.52%
Biomass burning Oil and Gas Coal mining Rice cultivation
Manure mangement Enteric fermentation Waste treatment
5.88%
92.36%
1.76%
Energy Industrial Process Agriculture
Current GHG Emissions in China

According to tentative estimates byexperts from China, China’s total GHGemission in 2004 is about 6,100 tCO2e(5,600 million tons of net emissions), ofwhich 5,050 million tons of CO2, 720million tCO2e of CH4 and 330 milliontCO2e of N2O.
Current GHG Emissions in China
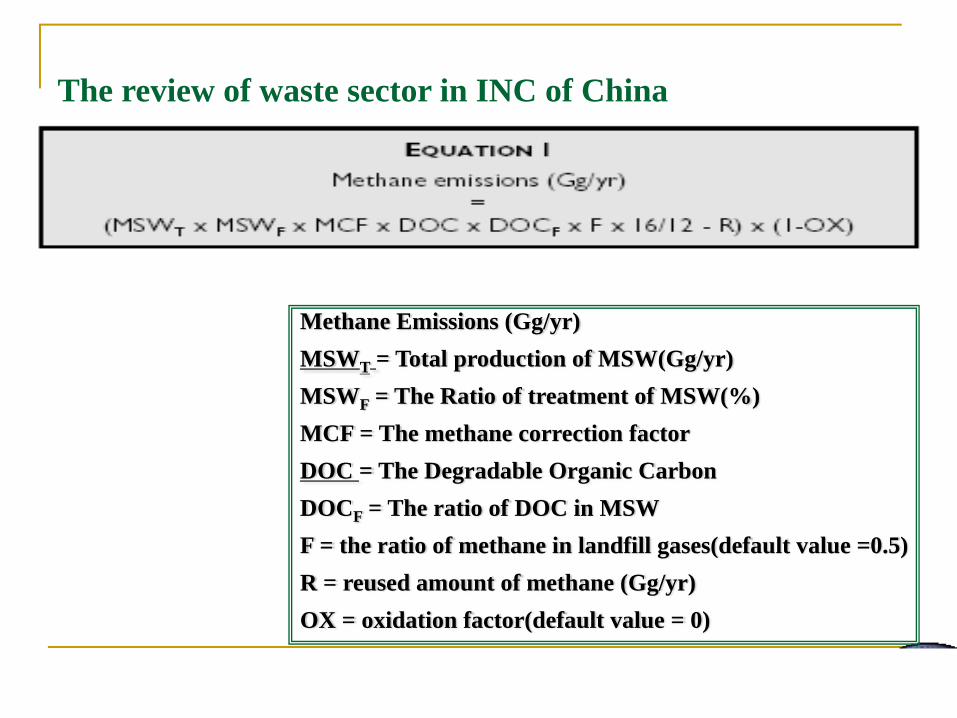
Methane Emissions (Gg/yr) MSWT = Total production of MSW(Gg/yr)MSWF = The Ratio of treatment of MSW(%)MCF = The methane correction factorDOC = The Degradable Organic Carbon DOCF = The ratio of DOC in MSW F = the ratio of methane in landfill gases(default value =0.5)R = reused amount of methane (Gg/yr)OX = oxidation factor(default value = 0)
The review of waste sector in INC of China

The default method will give a reasonable annual estimate ofactual emissions if the amount and composition of deposited wastehave been constant or slowly varying over a period of severaldecades. If the amount or composition of waste disposed of atSWDS is changing more rapidly over time, however, the IPCCdefault method will not provide an accurate trend. For example, ifthere is a reduction in the amount of carbon deposited at SWDS,the default method will underestimate emissions and overestimatereductions.
IPCC Good Practice Guidance
The review of waste sector in INC of China

• Population Statistics Data• Data of MSW Generation Rates • The Disposed Rate of MSW to SWDSs • The analysis Composition of MSW • The Degradable Organic Carbon (DOC) Content of
Waste• Categories of Waste Disposal Sites• Other Default Values Recommended by IPCC
The review of waste sector in INC of China

Total generation of MSW (Gg/yr)
Chinese Municipal Construction Statistics Year Books
MSWT
PT: Total population
PC: Population in the City
PR: Population in rural area
PE: immigrated people in the City
Waste Generation (kg/capita/day)
For developing countries and countries with economies in transition, thepopulation data may be the total urban population only, because the ruralpopulation is assumed to dispose of waste in such a way that CH4emissions are extremely low. (revised 1996 IPCC Guidelines )
The survey shows that there areabout 70 million people fromrural areas who worked in urbanareas in recent 10 years

MSWT
Weigh( metage) Visual
Revised 1996 IPCC Guidelines:Total MSW can be calculated from Population (thousand persons) x Annual MSW generation rate (Gg/thousand persons/yr).
But In China, we have The Municipal Construction Statistics Yearbook, in which have carrying amount and disposal percentage of municipal waste.
Carrying Amount

1. Northeast
2. Northwest
3. North of China
4. East of China
5. South of China
6. Southwest
7. Middle of China
The Carrying Amount of Waste in 7 Regions of 1994
Categories of Waste Disposal Sites:
Geographical status of China
16%
24%
23%
13%
10%
8% 6%
NC NE EC MC SC SW NW

In different region, according the scope of the city, we classified the cities ofChina into 5 types:
Super City 〔 > 2 Million 〕, there 14 super cities in China and we survey10 cities of them and got the real data of them;
Large City 〔 1~2 Million 〕, there 23 lager cities in China and we survey15 cities of them and go to site investigation for 6 larger cities;
Big City 〔 0.5~1 Million 〕, there 47 big cities in China and we survey 21cities of them and go to site investigation for 6 big cities;
Medium City 〔 0.2~0.5 Million 〕, there 159 big cities in China and wesurvey 39 cities of them and go to site investigation for 11 big cities;
Small City 〔 < 0.2 Million 〕, there 425 small cities in China and wesurvey 52 cities of them and go to site investigation for 2 big cities;
For Region, To get investigation information of waste and its treatment from 47cities in East region of China, 42 cities in North of China, 48 cities in West andMiddle region of China; To carry out site survey in 15 cities in east region, 10cities in north region and 10 cities in west and middle region.
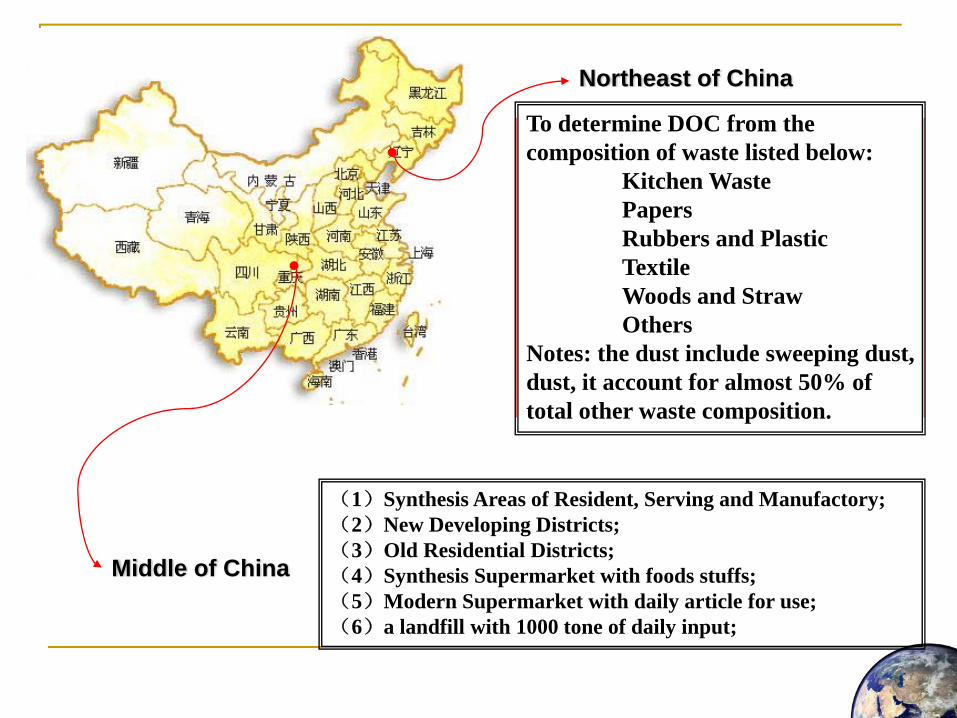
Northeast of China
Middle of China
(1)Synthesis Areas of Resident, Serving and Manufactory;(2)New Developing Districts;(3)Old Residential Districts;(4)Synthesis Supermarket with foods stuffs;(5)Modern Supermarket with daily article for use;(6)a landfill with 1000 tone of daily input;
The Composition of Waste in China: Kitchen WastePapersRubbers and Plastictextilewoods and strawmetalGlassBrick and StoneOthers
To determine DOC from the composition of waste listed below:
Kitchen WastePapersRubbers and PlasticTextileWoods and StrawOthers
Notes: the dust include sweeping dust, dust, it account for almost 50% of total other waste composition.

MSW Generation amount and population from 1970 to 2004
Non-agricultural population
MSW Generation(million tones)

MSW Generation amount distribution (2000,2002,2004)

The methane emission of 1994
The methane emission of 2004

Newly progress of SNC
To submit lately National Greenhouse gases inventory of China
INC:1994SNC:2005
To add new gases sources INC:CO2、N2O、CH4
SNC: CO2、N2O、CH4、HFCs、 PFCs、SF6

Newly progress of SNCGeographic Region extending
INC: Mainland of ChinaSNC:Mainland of China, Hong Kong SpecialAdministrative Region (SAR) of China andMacao SAR of China
To Set up a Target Research of Impact, vulnerability and adaptation of climate change
INC:Initial status with huge uncertainties in some sectors. SNC:To reduce uncertainties with the support of TRIVACC.

Newly progress of SNC : Institutional arrangement for SNC
Steering Committee
Executive unit: CC Office of NDRC
Office Director
Manage Office of Project
Mainland Hong Kong and Macao SAR Other Activities
TSU TSU
Basic situation related to CC
Mitigation Policies and measures
Impacts and Adaptation
GHG Inventory
R&O、A&O
Needs for capacity building
与气候变化相关的基本情况
减缓的政策措施
影响与适应
温室气体清单
R&O、A&O
能力建设需求
Correspond and manage of Program
Meeting / seminar
compiling, translation and printing etc.
Submitting
Issuing and publicizing
Reviews of domestic experts
UNDPCICETE

Greenhouse Gases inventories preparation for waste treatment (SNC)
Purpose:
To Complete China's Greenhouse Gases emissioninventories from the waste, including :
China's landfill Methane emission inventory;
China's waste incineration Carbon Dioxide emissioninventory;
China's industrial wastewater Methane emission inventoryand living sewage water Methane emission inventory;
China's wastewater / sewage treatment Nitrous Oxideemission inventory.

Greenhouse Gases inventories preparation for waste treatment (SNC)
Output:China’s Methane emission inventory from waste landfill treatmentChina’s Carbon Dioxide emission inventory from waste
incineration treatmentChina’s Methane emission inventory from industrial wastewater
treatmentChina’s Methane emission inventory from living sewage water
treatment.China’s Nitrous Oxide emission inventory from wastewater /
sewage water treatment.Comprehensive study on China's waste inventories and
Greenhouse Gases inventories preparation

Greenhouse Gases inventories preparation for waste treatment (SNC)
Output 1: China’s Methane emission inventory from waste landfill treatment method
Methodology: Tier 2 from IPCC guideline
Activity Data: Data from statistics yearbook(1980-2007) and
Calculated data (1950 – 1979) based on the driving factors
Emission Factor: Country specific data and IPCC default value
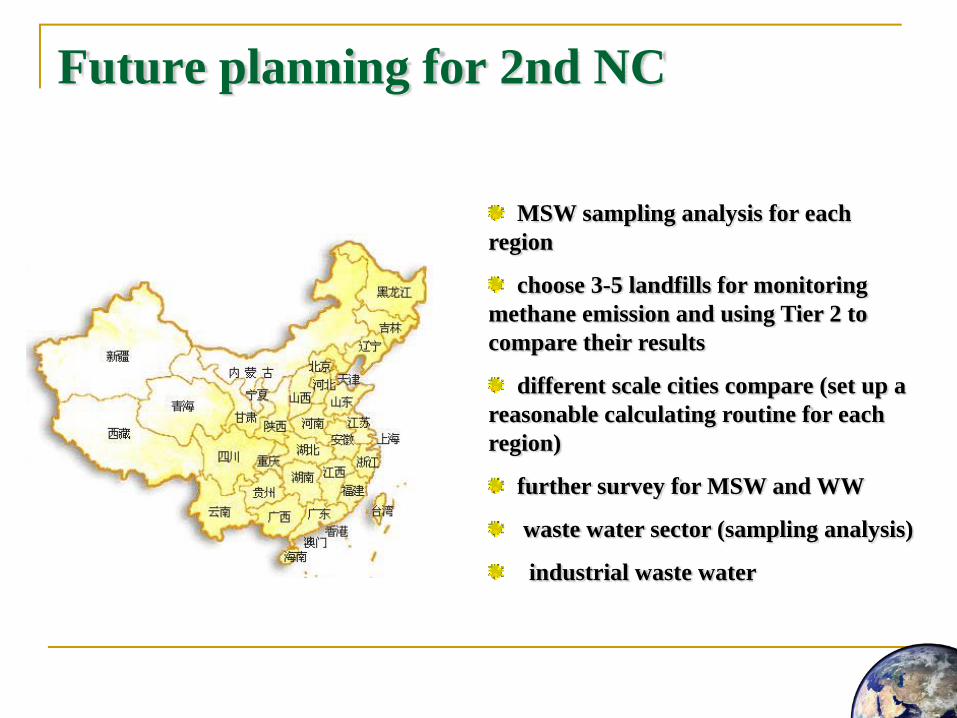
Future planning for 2nd NC
MSW sampling analysis for each region
choose 3-5 landfills for monitoring methane emission and using Tier 2 to compare their results
different scale cities compare (set up a reasonable calculating routine for each region)
further survey for MSW and WW
waste water sector (sampling analysis)
industrial waste water
Greenhouse Gases inventories preparation for waste treatment (SNC)
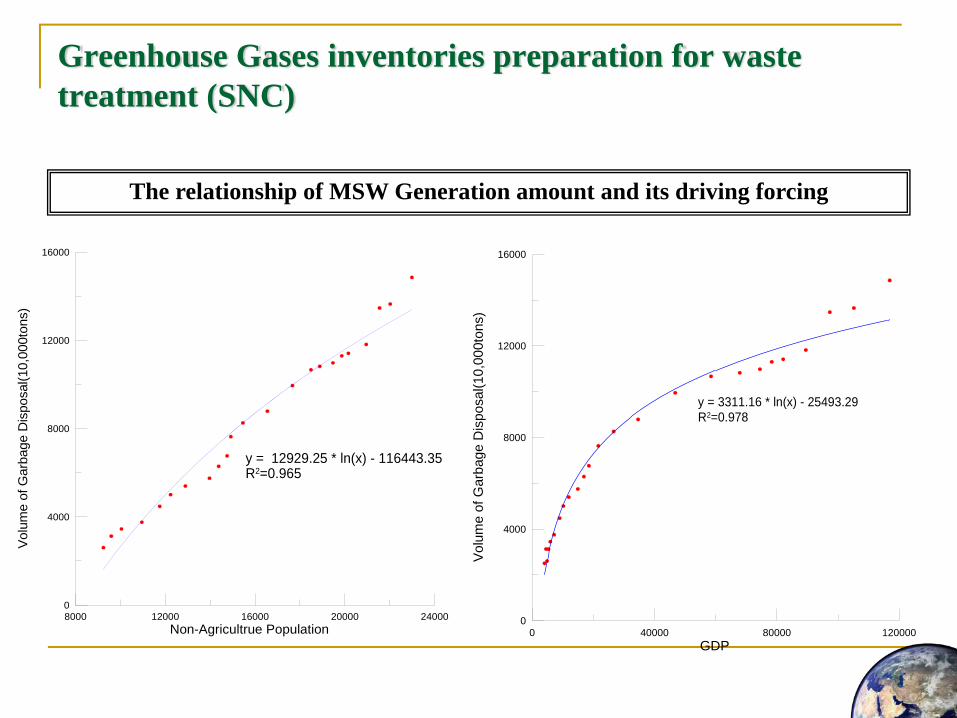
The relationship of MSW Generation amount and its driving forcing
8000 12000 16000 20000 24000Non-Agricultrue Population
0
4000
8000
12000
16000
Vol
ume
of G
arba
ge D
ispo
sal(1
0,00
0ton
s)
y = 12929.25 * ln(x) - 116443.35R2=0.965
0 40000 80000 120000GDP
0
4000
8000
12000
16000
Vol
ume
of G
arba
ge D
ispo
sal(1
0,00
0ton
s)
y = 3311.16 * ln(x) - 25493.29R2=0.978

Estimate model for MSW
Non-agricultural population: MSW = 12929.25ln(x) -116443.35
Where, x resprent non-agricultural population (ten thousand person)GDP:
MSW = 3311.16 ln(x) -25493.29Where, x resprent GDP ( 100 million Yuan RMB)
GDP per capita MSW = 3608.13 ln(x) -19706.85
Where, x resprent GDP per capita (Yuan RMB)
Greenhouse Gases inventories preparation for waste treatment (SNC)
The relationship of MSW Generation amount and its driving forcing

Greenhouse Gases inventories preparation for waste treatment (SNC)
Output 2: China’s Carbon Dioxide emission inventory from waste incineration treatment
Methodology: Default methodology of IPCC guidelineActivity Data: Data from survey in recent 5 years, and
Based on the expert judgment for AD Emission Factor: Country specific data (expert judgment) and IPCC default value
Greenhouse Gases inventories preparation for waste treatment (SNC)
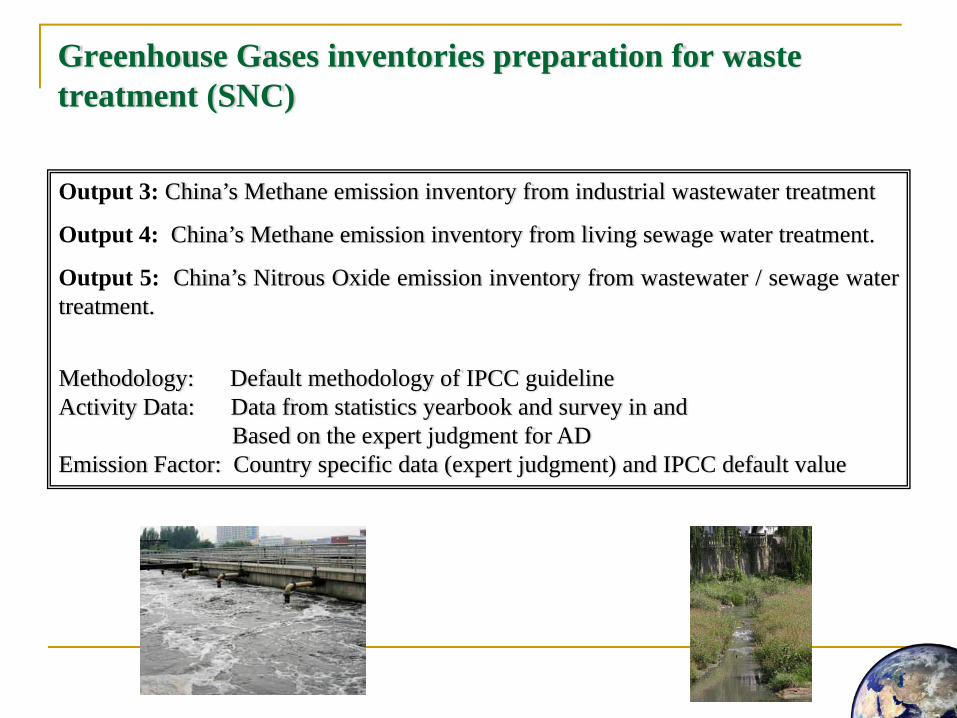
Output 3: China’s Methane emission inventory from industrial wastewater treatment
Output 4: China’s Methane emission inventory from living sewage water treatment.
Output 5: China’s Nitrous Oxide emission inventory from wastewater / sewage watertreatment.
Methodology: Default methodology of IPCC guidelineActivity Data: Data from statistics yearbook and survey in and
Based on the expert judgment for ADEmission Factor: Country specific data (expert judgment) and IPCC default value

Greenhouse Gases inventories preparation for waste treatment (SNC)
Output 6: Comprehensive study on China's waste inventories and Greenhouse Gasesinventories preparation

Comment and discussion
Any good practices form other Asia countries?EF data sharing?New & High technology for waste treatment?
……