Embed Size (px)
Citation preview

Chinese People’s Beliefs about the Relationship between Economic Development
and Social Inequality*
Yu Xie University of Michigan
Guangzhou Wang
Chinese Academy of Social Science _____________ Paper presented at the International Conference on “Cultural Identity: Interdisciplinary Perspectives,” October 19-22, Nanjing, China. Direct all correspondence to Yu Xie, P. O. Box 1248, 426 Thompson Street, Population Studies Center, University of Michigan, Ann Arbor (Email: [email protected]), Ann Arbor, MI 48106-1248. The research is also supported by an NIH Fogarty International Center, Grant Number 2 D43 TW000657. The author has benefited from suggestions and assistance from Sasha Achen, Miranda Brown, Cindy Glovinsky, Katherine King, Yang Jiang, Arland Thornton, and Linda Young-DeMarco.

Development and Perceived Inequality, Page 2
Chinese People’s Beliefs about the Relationship between Economic Development
and Social Inequality
Abstract
A causal relationship between economic development and social inequality has long been
hypothesized in both economics and sociology. Given the rapid economic growth in contemporary
China, how do ordinary Chinese view this relationship? We hypothesize that because the Chinese
have recently experienced rapid increases in both economic growth and social inequality, they tend
to view economic development as a driving force of social inequality. As a result, individual
Chinese, with this causal model in mind, will simply project high levels of inequality onto
countries they view as more developed and low levels of inequality onto countries they see as less
developed. Using data from a 2006 survey conducted in six Chinese provinces (n = 4,898), we
found that a large fraction of Chinese people rated inequality in a country in correspondence to
their rating of economic development in the same country. However, while their ratings of
economic development resemble those published by the United Nations based on social science
data, their ratings of inequality do not match those of the United Nations.

Development and Perceived Inequality, Page 3
Chinese People’s Beliefs about the Relationship between Economic Development
and Social Inequality
By all indicators, the Chinese economy has been growing rapidly in the last thirty years. Between
1978 and 2006, for example, China’s GDP increased at an average rate of 9.8% per year after
adjusting for inflation (calculated from State Statistical Bureau 2006, Table 3.3). This is a very
high level of economic development for a sustained period of time. Factoring in the huge
population size of China (currently at 1.3 billion), the scale and the pace of economic development
still underway in China is staggering.
Accompanying the rapid economic growth in China since 1978 has been a sharp rise in
economic inequality (Hauser and Xie 2005; Khan and Riskin 1998). It has been estimated that the
Gini index, a standard measure of income inequality, jumped steadily from 0.310 in 1985 to 0.415
in 2001 in China (Wu and Perloff 2005). Much of the existing literature in sociology on temporary
China has focused on social inequality in the past fifteen years (for a review, see Bian 2002),
attempting to address the distributional question of “who wins and who loses” during the transition
(Wu and Xie 2003, p.427). More recently, research effort has been made to understand Chinese
attitudes toward inequality (Whyte 2005). Earlier work suggests that while ordinary Chinese are
alarmed by the rising levels of inequality, they are concerned more with the perceived unfairness of
inequality than with the high levels of inequality (Whyte 2005; Xie and Hannum 1996; Xie and Wu
forthcoming; Zeng and Yue 2006; Zhao 1994).
In this paper, we are interested in whether Chinese people’s attitudes towards social
inequality are shaped by China’s recent history of experiencing rapid increases in both economic
development and social inequality. A working hypothesis is that many Chinese people may
consider social inequality as an inevitable byproduct of economic development based on China’s

Development and Perceived Inequality, Page 4
recent history. To address this research question, we measure and examine how ordinary Chinese
view the relationship between economic development and social inequality through a 2006 social
survey asking respondents to rate economic development and inequality levels in five countries.
Theoretical Issues
Social Inequality and Economic Development
Social scientists have long been interested in the causal relationship between economic
development and social inequality. In both sociological and economics literature, the prevailing
view is that in the long term as a society undergoes economic development, we expect to observe
an inverted-U trajectory in social inequality: inequality first increases with economic development
but will eventually level off and even decline as the society is sufficiently developed. This
prediction was essentially the same as Karl Marx’s grand view of human history, with equality
under communism at its end. Lenski’s (1984) widely used text on social stratification reached the
same conclusion, as it hypothesized that advanced societies can afford to pay for the welfare of all
citizens through redistribution.
Economics literature on development has reached the same prediction but for different
reasons. One dominant view is Kuznets's (1955) thesis that inequality follows an inverted-U shape:
inequality initially rises in the early and intermediate stages of development and then eventually
declines with continued development. Kuznets conjectures that the development of an industrial
sector with higher wages than the rural sector draws workers away from the agricultural sector.
Initially, workers in the industrial sector are scarce and enjoy a large wage premium, increasing
income inequality. As increasing numbers of workers switch from the agricultural to the industrial
sector, the industrial wage falls, while the agricultural wage increases as agricultural workers
become increasingly scarce. As a result, income inequality falls. Besides the development of an

Development and Perceived Inequality, Page 5
industrial sector (and accompanying urbanization), there are two other major economic reasons
why economic development (especially rapid economic development) can initially lead to high
levels of inequality. First, educated members of the labor force are always in short supply in times
of economic development, because it takes time and societal investment to educate the next
generation of workers. Second, “Individuals who are more efficient resource allocators (in other
words, educated individuals) will be better able to take advantage of the changed opportunity sets”
(Chiswick 1971, p.28). For these two reasons, returns to education increase during times of rapid
economic development, and these increases in turn raise the overall level of inequality. For
example, earlier work on Brazil, which has one of the highest levels of inequality in the world
(shown later in Table 1), reveals that most of the very high level of inequality there is attributable to
very high returns to education (Fishlow 1972; Lam and Levison 1992). An increase in returns to
human capital has also been tied to rising income inequality during the British Industrial
Revolution (Williamson 1991). In fact, it has been suggested that empirical evidence for the
Kuznets curve is more often due to inter-occupational wage differences resulting from increases in
the returns to education or skills, than to the inter-sectoral wage differences originally described by
Kuznets. The skill premium gradually diminishes as the labor force becomes more skilled,
resulting in a reduction of income inequality (Barro 2000).
It is unclear whether empirical data support the conjecture that economic development in
developing countries always leads to an increase in inequality. While this conjecture is consistent
with the experiences of some countries such as Brazil (Fishlow 1972), Taiwan's recent history has
clearly proven the opposite: Gini coefficients dropped gradually from 0.321 to 0.277 between 1964
and 1980, a period of rapid economic development in Taiwan, and it then climbed steadily to 0.312
in 1990 (Executive Yuan 1990, p.15). More generally, there has been a debate within the

Development and Perceived Inequality, Page 6
economics of development literature as to the validity of the Kuznets curve as a model to explain
within-country temporal differences in growth rates, rather than differences between countries at a
given time. Studies that use longitudinal datasets to test Kuznets’s hypothesis have not
consistently found evidence to support it. Even when the Kuznets inverted-U is observed, it
explains little of the variation in income inequality across countries or over time (Deininger and
Squire 1998; Barro 2000).
However generalizable the inverted-U conjecture may or may not be, it does fit the recent
trends in contemporary China. While China has experienced very rapid economic growth since
1978, ample evidence also suggests that social inequality has increased significantly in China (see
Hauser and Xie 2005). One study estimates that the Gini Inequality index in China jumped steadily
from 0.310 in 1985 to 0.415 in 2001 (Wu and Perloff 2005). Indeed, social inequality has become
one of the most frequently discussed topics that concern the public in China in recent years (Whyte
2005; Wong and Lee 2000). Chinese media, particularly print and internet media, are also fond of
discussions on social inequality, although the public concern is much more with perceived
unfairness and its institutional mechanisms, such as corruption, rather than with high levels of
inequality (Sun 2008; Zeng and Yue 2006; Zhao 1994).
We hypothesize that because of recent rapid increases in both economic growth and social
inequality in China, individual Chinese will tend to experience these two factors as causally linked,
with economic development driving inequality. It is conjectured that individual Chinese, with this
causal model in mind, will simply project high levels of inequality onto countries they view as
more developed and project low levels of inequality onto countries perceived as less developed. If
this is true, their ratings on inequality would correspond to ratings on development.

Development and Perceived Inequality, Page 7
Developmental Idealism
In essence, we are interested in the extent to which Chinese people’s perception of a country’s level
of social inequality corresponds to their perceived level of the country’s economic development.
An underlying assumption is that Chinese people understand economic development as an
essential feature of a society and its social consequences and are knowledgeable about the levels of
development in many countries in the world. This assumption is rooted in an ideology, or
intellectual paradigm that has been widely accepted since the 1600s, which Thornton (2001, 2005)
calls “developmental idealism.”
The developmental idealism paradigm suggests that all societies progress through the same
natural, universal, and necessary stages of development (for detailed discussions, see Burrow 1981;
Harris 1968; Mandelbaum 1971; Nisbet 1969; Sanderson 1990; Smith 1973; Stocking 1968, 1987).
The speed of advancement was believed to vary so that at any one point in time societies at
different developmental levels could be observed. Thus, cross-sectional variation across societies
is used to infer the nature of developmental trajectories across time.
Previous research has shown that developmental thinking is both widespread and
influential among ordinary people. Survey research in Africa, India, Argentina, Nepal, and New
Guinea reveals that ordinary people use the developmental idealism framework in evaluating
various attributes and behaviors (Ahearn 2001; Amin 1989; Blaut 1993; Caldwell et al. 1988; Dahl
and Rabo 1992; Pigg 1992; Thornton, Binstock, and Ghimire 2004;). In these disparate countries,
respondents all have a basic understanding of the term “development” and are able to rank a given
set of countries on a development scale. At least on average and in terms of rank-ordering, their
rankings closely resemble those reported by international agencies such as the United Nations. As
will be shown later, Chinese are no exception, as they are also knowledgeable about development

Development and Perceived Inequality, Page 8
and are able to rank countries on a development scale. This is true because development has
become a key feature of a society under the influence of the prevailing developmental idealism
paradigm. However, inequality is not a widely known feature of a society. Instead, we argue that
ordinary people may derive their understanding of inequality as a secondary feature from their
understanding of the relationship between development and inequality.
The “Societal Projection” Hypothesis
In general, how do individuals form opinions about other societies with which they have no direct
contact? They necessarily learn through indirect means. We note two special characteristics of all
indirect means of knowledge transmission. First, information must initially be processed by other
persons and then communicated through such channels as formal education, popular media, and
experiential accounts. Second, indirect knowledge about other countries is necessarily fragmented
and vague, often requiring cognitive simplifications to be made meaningful to the knowledge
acquirer.
By enabling simplification, categorization plays an essential role for indirect learning about
other societies. Categorization is necessary for any cognitive process because the human mind
needs it to generalize from limited information to unknown situations and to cope with a real world
that is too complicated and uncertain to be fully comprehended. Thus, categorization leads to what
March and Simon (1958) call “programming” solutions, those which are satisfactory but not
necessarily optimal. Needless to say, categorization means overlooking within-category
differences and thus naive simplifications. In psychologist Allport’s (1954, p.9) words,
“Overcategorization is perhaps the commonest trick of the human mind.” Indeed, Allport argued
that the root cause of prejudice is the cognitive need for categorization, which he accepted as
unavoidable (p.19).

Development and Perceived Inequality, Page 9
Although Allport studied prejudice based on social categories such as race and gender, his
work on the cognitive process is useful for this study on subjective beliefs about inequality in
China. In this study, we not only draw parallels between opinion formation about unknown
characteristics of other social groups and opinion formation about unknown characteristics of other
countries; we also directly borrow two of Allport’s concrete ideas. First, Allport suggested that
humans tend to focus on salient features, “visible” differences across social groups, and make
associations between the visible features and other attributes for which there is a lack of reliable
information. He called this the “condensation of attitudes around visible cues” (p.133). Second,
under the heading of “direct projection” (p.364), he argued that humans tend to project to others
their own attributes and feelings. We emphasize that both “condensation of attitudes” and “direct
projection” occur because the cognitive process deals with limited information and thus needs
simplification to render meaning.
Let us now apply these ideas to understanding how ordinary Chinese persons estimate the
level of inequality and other features of alien societies. We know that ordinary Chinese have little
or no direct contact with other societies and thus have no direct knowledge about them. Thus, they
need to simplify their understanding of other societies by means of categorization based on
available visible cues. In forming opinions about alien societies, individual Chinese rely heavily
on their presumed knowledge about a particular society’s level of economic development and draw
inferences about other features from this knowledge, making projections from their own
understanding of the relationship between economic development and other aspects of a society.
For the sake of brevity, we call this hypothesis “Societal Projection.”
Some clarifications are in order. First, as already stated, many Chinese may have little or
no accurate knowledge about the levels of economic development in many societies. Their

Development and Perceived Inequality, Page 10
knowledge may be accurate for some societies but wrong for others. This is a testable proposition,
since objective ratings of development exit. We can compare respondents’ ratings of development
to those constructed by experts at international organizations, such as the United Nations. The
question is how closely the subjective rankings of development for a set of countries approximate
those published by international organizations. Second, individual Chinese may not understand all
features of other societies equally well. Because of the prevalence of the developmental paradigm
both within China and elsewhere, when Chinese are questioned on some of the less salient features
of a society, they may tend to base their ideas about these features, concerning which they lack any
real knowledge, on their understanding of that society’s level of development. Further, because
Chinese society has recently experienced rapid increases in both economic development and social
inequality, Chinese individuals tend to project their own unique experience onto the rest of the
world, ranking inequality levels as high for highly developed countries and low for less developed
countries.
Data and Methods
We conducted a social survey in 2006 with key items designed to address our research question. A
probability sample was drawn using a multi-stage, stratified, systematic sampling method. From a
total of 31 provinces, autonomous regions, and directly governed municipalities, six were chosen:
Beijing, Hebei, Qinghai, Hubei, Sichuan, and Guangdong, representing China’s diversity in
geography, level of development, and the urban/rural divide. Within each province (or its
equivalent), 3 counties (or equivalent units in urban areas) were randomly selected. With each
selected county (or its equivalent), 6 villages (or neighborhood communities in urban areas) were
randomly selected. Within each village (or neighborhood community), 30-50 households were
randomly selected. The study then randomly selected a married respondent of reproductive age

Development and Perceived Inequality, Page 11
(15-49), as the survey was also designed to gather information about family planning policies. Out
of a total of 5,400 attempted interviews, 4,898 interviews were successfully conducted, yielding a
response rate of 90.7%. Of the 4,898 interviews, 1,845 were urban and 3,053 were rural
respondents. The survey was conducted through face-to-face interviews in May 2006. For brevity,
we refer to this survey as the “2006 Six Chinese Province Survey.” Key survey items for this study
are given in English in the Appendix.
A key survey item is the Development Scale (item 7.7 in Appendix). The interviewer
asked the respondent to rate the level of development in five countries using a scale from zero to
ten: China, Japan, Brazil, United States, and Pakistan, with 10 representing the most developed
and 0 representing the least developed country. We compared the respondents’ responses to
ratings given by the United Nations (2006). To study the respondent’s attitudes towards inequality,
we also designed and implemented an Economic Inequality Scale (item 7.6, Appendix). It asked
the respondents to rate their level of inequality for the same five countries on a 0-10 scale. We then
compare their responses to Gini coefficients that measure the actual level of income inequality in
the five countries. While some respondents had difficulty performing the task due to their
unfamiliarity with all the countries about which they were asked, the number of cases missing on
the items is remarkably small. Across the ten ratings (two scales for five countries), 71 did not
provide all ratings, with more than half of them (42) not even rating China. Thus, most respondents
had no difficulty complying with this request. Some respondents actually reported that they
enjoyed the exercise. The results reported in Tables 1 through 3 are based on the 4,814 interviews
that provided valid answers to the two scales.
Our third key item asked the respondents to compare the income levels for “typical workers
in three occupations across three countries” (item 7.8 in Appendix). The three occupations were

Development and Perceived Inequality, Page 12
the following: medical doctor, defined as “a well-trained surgeon working in a county’s major
hospital; carpenter, defined as “a worker who makes custom-made home furniture; and peasant,
defined as “an ordinary agricultural worker who produces grain for subsistence.” The three
countries compared were the United States, China, and Pakistan, a subset of the five countries rated
in the first two items. We fixed the income for a typical carpenter in China to 10,000 yuan RMB
per year and asked the respondents to guess the income for the other eight occupation-country
combinations (1 yuan was worth roughly 1/8 U.S. dollar in 2006). The rationale behind this item was
to test whether and how respondents would project their understanding of income inequality by
occupation in China relative to that in other countries.
Results
Our analyses of the six-province survey have yielded interesting findings that bear on the question
of how ordinary Chinese today perceive the relationship between development and inequality.
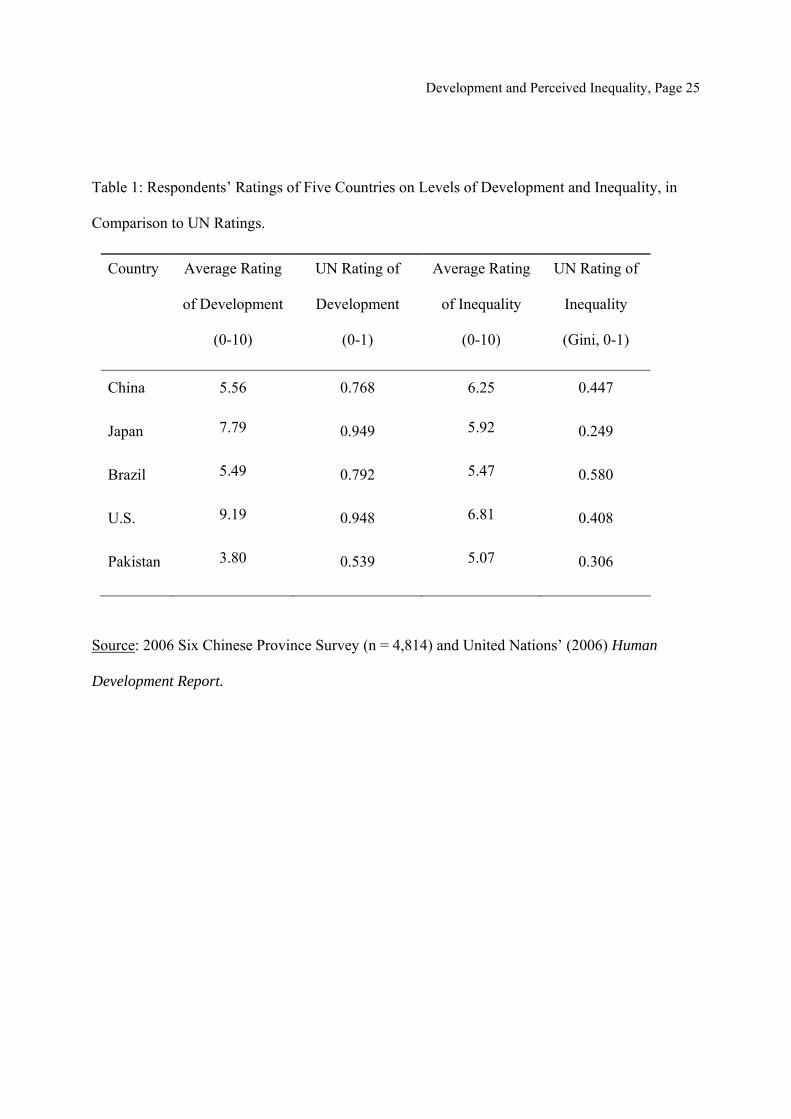
First of all, Chinese respondents’ ratings of levels of economic development for the five different
countries closely resemble the ratings given by the United Nations (2006), shown in the first two
columns of Table 1. For example, the U.S. was rated 9.19 on a 0-10 scale by the respondents, a
number very close to 0.948 rated by the United Nations (UN) on a 0-1 scale. The other three
countries received lower scores relative to the UN ratings, but the relative pattern holds true: the
U.S. and Japan are the highest, followed by China and Brazil in the middle, with Pakistan at the
bottom. Two instances of discrepancy between the two sets of ratings are present. First, Chinese
tend to underrate Japan (or overrate the U.S.): While the U.S. and Japan are rated very similarly by
the UN, the Chinese respondents gave a much higher score to the U.S. (9.19) than to Japan (7.79).
Second, Chinese seem also to underrate Brazil slightly: Brazil is rated slightly higher than China by

Development and Perceived Inequality, Page 13
the UN (0.792 versus 0.768) but slightly lower by the respondents in our survey (5.49 versus
5.56).1
Table 1 about here
Second, ordinary Chinese’s average ratings of inequality levels in the five countries (third
column) resemble more closely their average ratings of development than actual inequality
measures, Gini coefficients, reported by the United Nations (2006) (fourth column). Specifically,
they rated the U.S. at the top, Japan, China, and Brazil in the middle, and Pakistan at the bottom.
Comparing their subjective rankings on inequality contrast with objective measures of the United
Nations (2006), we observe that Chinese respondents generally believe, incorrectly, that social
inequality is higher in the United States and lower in Brazil than in China. This result suggests that
ordinary persons in China do not have a good knowledge of inequality levels in an international
context. When asked about inequality levels in unfamiliar countries, they try their best to
formulate guesses based on salient cues – development levels in this case. As we will show later,
this guesswork, to a significant extent, involves projection from their own ideas about the
relationship between development and inequality. Thus, their perceptions of inequality in other
countries reflect their own local experiences more than their actual knowledge about inequality in
these countries.
Given the likely individual differences in numerical responses to the two scales, we now
focus on the information in response patterns revealed through the rank-ordering of the numerical
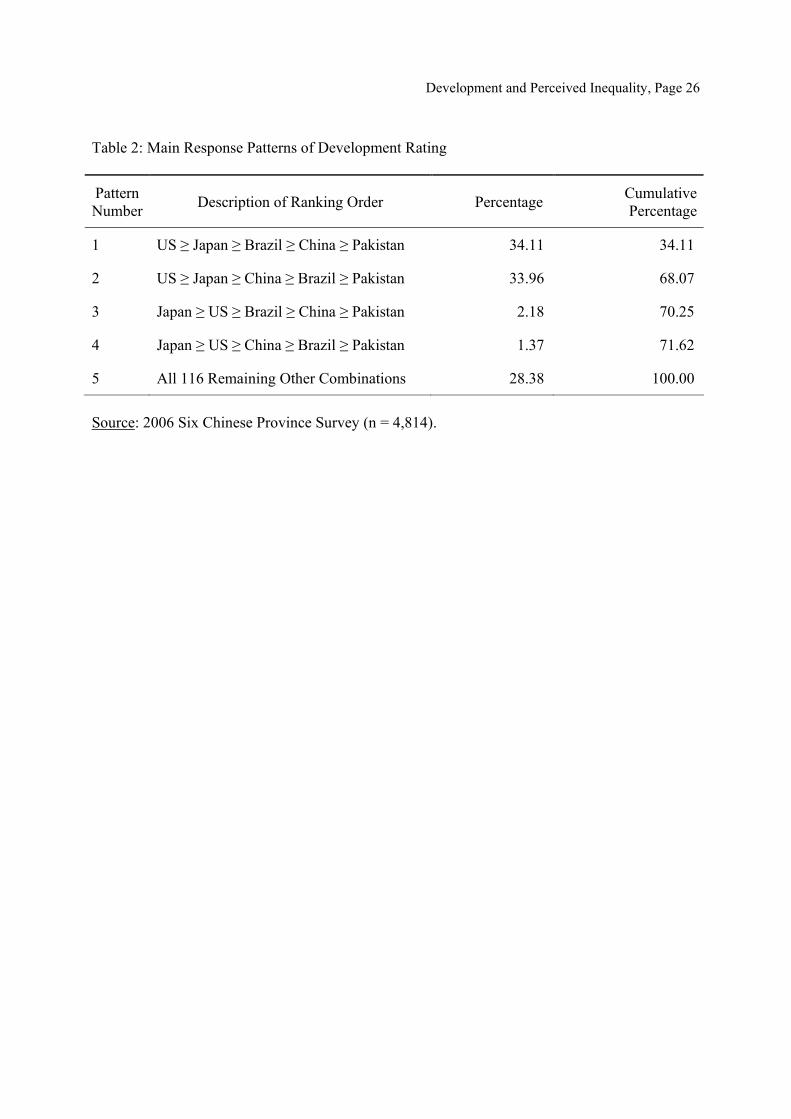
responses. For five countries, there can be a total of 120 (5!) possible rank-ordered combinations.
In Table 2, we list the four prevalent patterns: (1) U.S. ≥ Japan ≥ Brazil ≥ China ≥ Pakistan, (2) U.S.
≥ Japan ≥ China ≥ Brazil ≥ Pakistan, (3) Japan ≥ U.S. ≥ Brazil ≥ China ≥ Pakistan, and (4) Japan ≥ 1 These two discrepancies can simply be attributable to sampling error, as the differences in ratings in our survey between the U.S. and Japan and between China and Brazil are not statistically significant.
Development and Perceived Inequality, Page 14
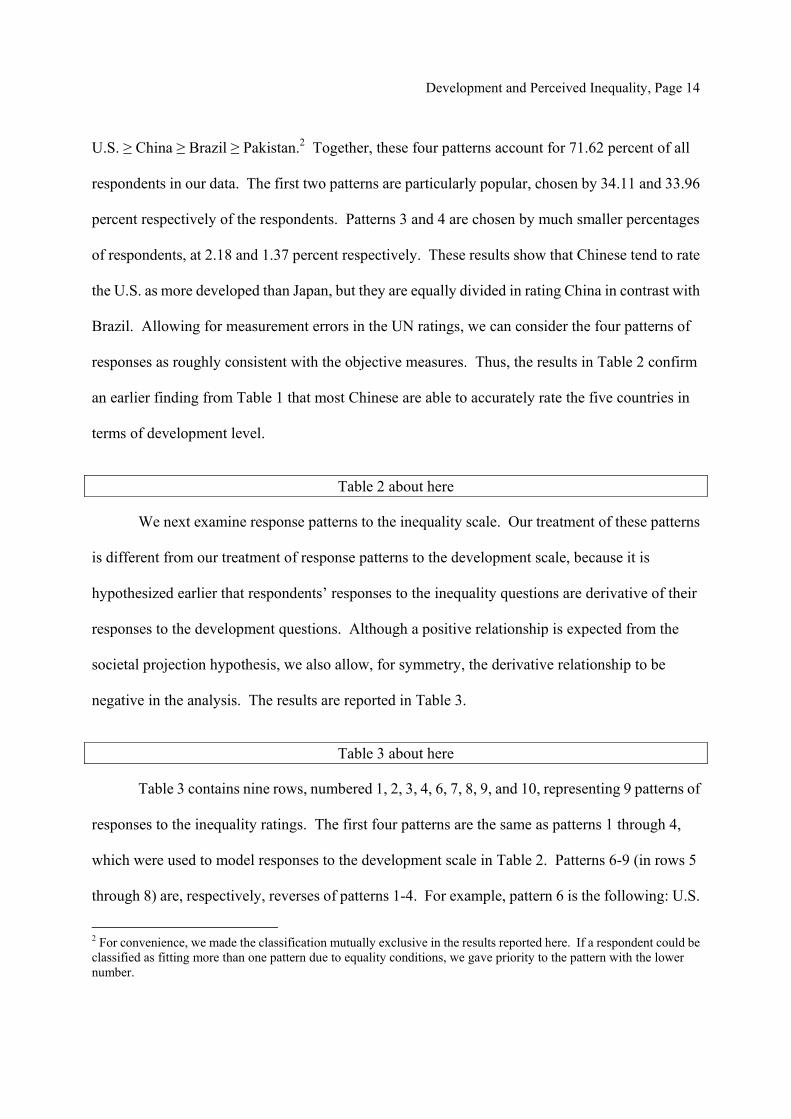
U.S. ≥ China ≥ Brazil ≥ Pakistan.2 Together, these four patterns account for 71.62 percent of all
respondents in our data. The first two patterns are particularly popular, chosen by 34.11 and 33.96
percent respectively of the respondents. Patterns 3 and 4 are chosen by much smaller percentages
of respondents, at 2.18 and 1.37 percent respectively. These results show that Chinese tend to rate
the U.S. as more developed than Japan, but they are equally divided in rating China in contrast with
Brazil. Allowing for measurement errors in the UN ratings, we can consider the four patterns of
responses as roughly consistent with the objective measures. Thus, the results in Table 2 confirm
an earlier finding from Table 1 that most Chinese are able to accurately rate the five countries in
terms of development level.
Table 2 about here
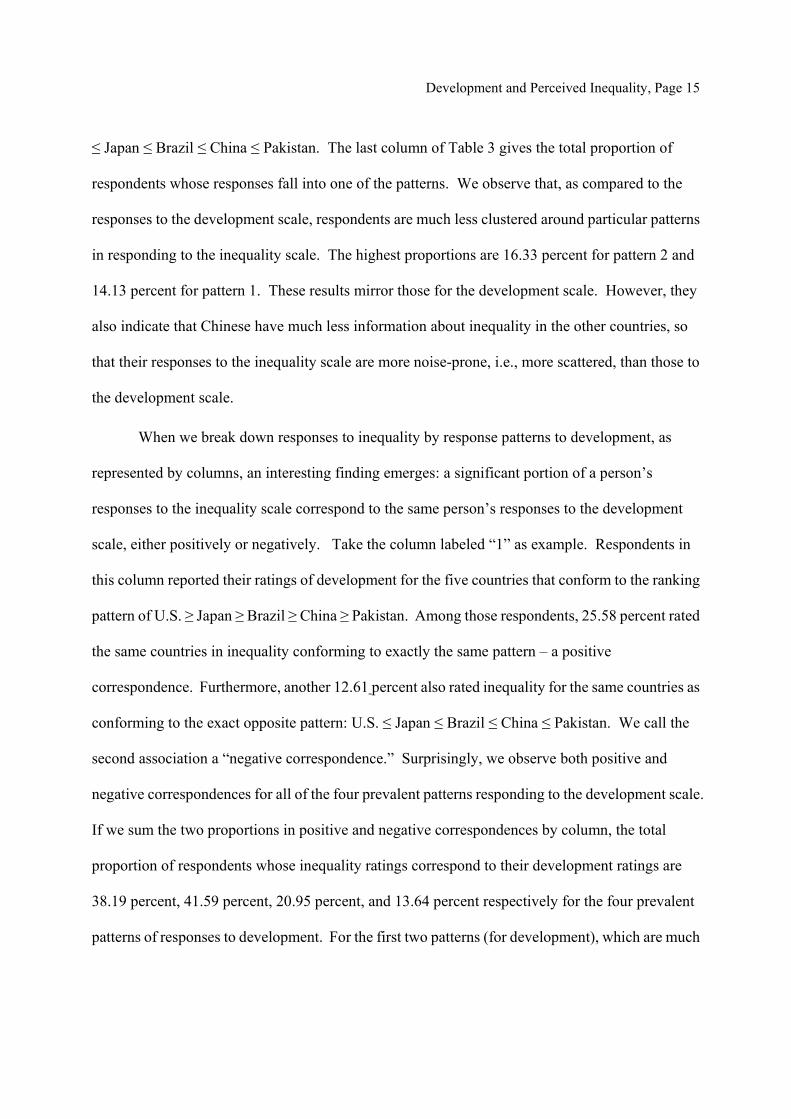
We next examine response patterns to the inequality scale. Our treatment of these patterns
is different from our treatment of response patterns to the development scale, because it is
hypothesized earlier that respondents’ responses to the inequality questions are derivative of their
responses to the development questions. Although a positive relationship is expected from the
societal projection hypothesis, we also allow, for symmetry, the derivative relationship to be
negative in the analysis. The results are reported in Table 3.
Table 3 about here
Table 3 contains nine rows, numbered 1, 2, 3, 4, 6, 7, 8, 9, and 10, representing 9 patterns of
responses to the inequality ratings. The first four patterns are the same as patterns 1 through 4,
which were used to model responses to the development scale in Table 2. Patterns 6-9 (in rows 5
through 8) are, respectively, reverses of patterns 1-4. For example, pattern 6 is the following: U.S.
2 For convenience, we made the classification mutually exclusive in the results reported here. If a respondent could be classified as fitting more than one pattern due to equality conditions, we gave priority to the pattern with the lower number.
Development and Perceived Inequality, Page 15
≤ Japan ≤ Brazil ≤ China ≤ Pakistan. The last column of Table 3 gives the total proportion of
respondents whose responses fall into one of the patterns. We observe that, as compared to the
responses to the development scale, respondents are much less clustered around particular patterns
in responding to the inequality scale. The highest proportions are 16.33 percent for pattern 2 and
14.13 percent for pattern 1. These results mirror those for the development scale. However, they
also indicate that Chinese have much less information about inequality in the other countries, so
that their responses to the inequality scale are more noise-prone, i.e., more scattered, than those to
the development scale.
When we break down responses to inequality by response patterns to development, as
represented by columns, an interesting finding emerges: a significant portion of a person’s
responses to the inequality scale correspond to the same person’s responses to the development
scale, either positively or negatively. Take the column labeled “1” as example. Respondents in
this column reported their ratings of development for the five countries that conform to the ranking
pattern of U.S. ≥ Japan ≥ Brazil ≥ China ≥ Pakistan. Among those respondents, 25.58 percent rated
the same countries in inequality conforming to exactly the same pattern – a positive
correspondence. Furthermore, another 12.61 percent also rated inequality for the same countries as
conforming to the exact opposite pattern: U.S. ≤ Japan ≤ Brazil ≤ China ≤ Pakistan. We call the
second association a “negative correspondence.” Surprisingly, we observe both positive and
negative correspondences for all of the four prevalent patterns responding to the development scale.
If we sum the two proportions in positive and negative correspondences by column, the total
proportion of respondents whose inequality ratings correspond to their development ratings are
38.19 percent, 41.59 percent, 20.95 percent, and 13.64 percent respectively for the four prevalent
patterns of responses to development. For the first two patterns (for development), which are much

Development and Perceived Inequality, Page 16
more prevalent than the other two, the positive correspondence is very large and indeed dominates
the negative correspondence. For the next two patterns (for development), the negative
correspondence seems to be more prevalent than the positive correspondence. From these results,
we conclude that a significant proportion of the respondents derived their inequality ratings from
their development ratings, based on their own understanding concerning either a positive or a
negative association between the two. Because China has recently experienced increases in both
development and inequality, many Chinese project this experience onto other countries, making
the positive association dominant over the negative association.
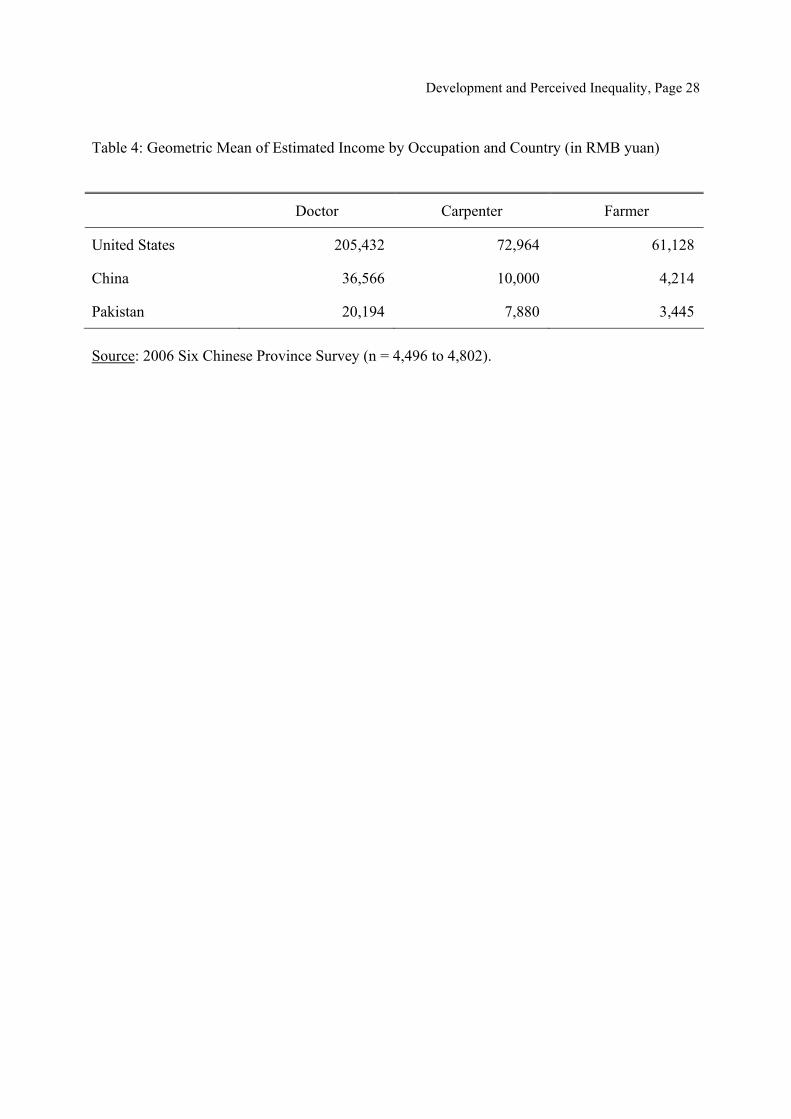
We finally discuss results pertaining to the third key survey item, an experiment in which
respondents were asked to estimate the income of typical workers in three occupations (doctor,
carpenter, and farmer), in three countries (U.S., China, and Pakistan), with the income level in the
middle category for both dimensions (carpenter in China) fixed at 10,000 RMB yuan. Of course, it
is very difficult for ordinary Chinese to know actual income levels in different occupations in
different countries with which they have no direct contact. However, based on our reasoning about
the developmental paradigm and societal projection, we expect the respondents to be able to
provide educated guesses based on their knowledge about both the level of development of the
different countries and the income differences across occupations in China. Indeed, an
overwhelming majority of the respondents (between 4,496 and 4,802) provided their estimates of
the earnings. The results are summarized, in geometric means by country and occupation, in Table
4.
Table 4 about here
One pattern in the data is that the average occupation premium of being a doctor over a
carpenter, and of being a carpenter over a farmer, seems relatively stable in three countries: it

Development and Perceived Inequality, Page 17
hovers between 2.2 and 3.6 with one exception -- the comparison of a carpenter and a farmer in the
U.S. For some reason, the respondents think that farmers do almost as well as carpenters in the U.S.
On the whole, the societal projection hypothesis receives some support from these results: the
Chinese respondents in our survey were able to estimate sensible figures for income in different
occupations based on their knowledge about country differences in levels of development and
occupation differences within a country – presumably within China.
Conclusion
Although extensive social science research has been focused on the causes and consequences of
actual economic development, very little attention has been directed toward attitudes and beliefs
concerning the effect of economic development on social inequality. Yet, such attitudes and
beliefs can have important implications. For example, they can also influence people’s
expectations and satisfactions with inequalities that may increase or decline as societies develop
economically. Furthermore, these attitudes and beliefs can influence whether or not economic
development is associated with political dissatisfaction.
China has been experiencing rapid economic growth over an extended period and on a large
scale. At the same time, inequality has also increased dramatically. This paper began with the
question of how ordinary Chinese view the causal relationship between economic development and
social inequality. This is not an easy task, as the association between growth in economic
development and an increase in social inequality observed in China’s recent history cannot be
simply taken as causal in general. Indeed, there is some evidence in our study that a small
proportion of Chinese reject the association as causal.
Based on prior literatures, we developed three propositions. First, ordinary Chinese are
able to rate, somewhat accurately, different countries on a development scale. Second, their ratings

Development and Perceived Inequality, Page 18
of inequality are much less accurate, and derivative of their development ratings based on their
understanding of the relationship between development and inequality. Third, given both rapid
development and a sharp rise of inequality in China’s recent history, many Chinese project this
experience of a positive association onto other countries.
For our empirical work, we designed three key items to test these ideas and implemented
them in a social survey in six Chinese provinces. Two items asked the respondents to rate the
levels of development as well as inequality in five countries: the United States, Japan, Brazil,
China, and Pakistan. The third item asked the respondents to guess income levels by three
occupations (doctor, carpenter, and farmer) in three countries (U.S., China, and Pakistan). Despite
the apparent difficulty of the items, the overwhelming majority of respondents were able to
complete them with sensible answers. In this paper, we report empirical evidence in support of the
three propositions, with minor qualifications.
Five main findings emerge from the study. First, the respondents’ average ratings of
development resemble those released by the United Nations, with those in Japan and Brazil
underrated. Second, the respondents’ ratings of inequality in the five countries are much less
informed and accurate when compared to the United Nations’ measures. Third, a significant
portion of the respondents seem to have derived their ratings of inequality from their ratings of
development, on the basis of their understanding of either a positive or a negative relationship
between the two. Fourth, when the respondents associate inequality with development, they tend
to form a positive association, presumably reflecting China’s recent experience. Finally, the
respondents were able to provide sensible guesses concerning the variation of income by
occupation and country from their knowledge about country-level differences in development and
occupational differences in income within a country.

Development and Perceived Inequality, Page 19
In this paper, we propose that the developmental paradigm also serves the important
cognitive need of simplifying societal differences (historical or cross-national), so that
development level becomes a salient cue characterizing a society. When a person does not know
much about other aspects of an unfamiliar society, he/she may draw inferences about them from its
development level. While this cognitive device would serve most people well, as it frees them
from the impossible task of fully understanding all societies in detail, there is also an obvious risk:
as in Allport’s study of prejudice (1954), misunderstanding and mistrust of people across different
societies could arise from the cognitive need to rely on salient cues and the usual tendency to
project from one’s own understanding and experience.
Development and Perceived Inequality, Page 20
References
Allport, Gordon W. 1954. The Nature of Prejudice. Cambridge, MA: Addison-Wesley.
Ahearn, Laura M. 2001. Invitations to Love: Literacy, Love Letters, and Social Change in Nepal. Ann Arbor, MI: The University of Michigan Press.
Amin, Samir. 1989. Eurocentrism. New York: Monthly Review Press.
Barro, Robert. 2000. “Inequality and Growth in a Panel of Countries.” Journal of Economic Growth 5:5-32.
Bian, Yanjie, 2002. “Chinese Social Stratification and Social Mobility.” Annual Review of Sociology 28: 91-116.
Blaut, James M. 1993. The Colonizer's Model of the World: Geographical Diffusionism and Eurocentric History. New York: The Guilford Press.
Burrow, John W. 1981. Evolution and Society. Cambridge: Cambridge University Press.
Caldwell, John C., Palli Hanumantha Reddy, and Pat Caldwell. 1988. The Causes of Demographic Change: Experimental Research in South India. Madison, WI: The University of Wisconsin Press.
Chiswick, Barry. 1971. “Earnings Inequality and Economic Development.” Quarterly Journal of Economics 85:21-39.
Dahl, Gudrun and Annika Rabo, eds. 1992. Kam-Ap or Take-Off: Local Notions of Development. Stockholm: Stockholm Studies in Social Anthropology.
Deininger, Klaus and Lyn Squire. 1998. “New Ways of Looking at Old Issues: Inequality and Growth.” Journal of Development Economics 57:259-287.
Executive Yuan. 1990. Report on the Survey of Personal Income Distribution in Taiwan Area of the Republic of China. Taipei: Directorate-General of Budget, Accounting, and Statistics.
Fishlow, Albert. 1972. “On the Emerging Problems of Development Policy: Brazilian Size Distribution of Income.” American Economic Review 62:391-410.
Ghimire, Dirgha J., William G. Axinn, Scott T. Yabiku, and Arland Thornton. 2004. “Social Change, Premarital Non-family Experience and Spouse Choice in an Arranged Marriage Society.” Revise and resubmit to American Journal of Sociology.
Harris, Marvin. 1968. The Rise of Anthropological Theory. New York: Thomas Y. Crowell Company.
Hauser, Seth and Yu Xie. 2005. “Temporal and Regional Variation in Earnings Inequality: Urban China in Transition between 1988 and 1995.” Social Science Research: 34:44-79.
Khan, Azizur R. and Carl Riskin. 1998. “Income and Inequality in China: Composition, Distribution and Growth of Household Income, 1988 to 1995.” The China Quarterly 154: 221-253.

Development and Perceived Inequality, Page 21
Kuznets, Simon. 1955. “Economic Grown and Income Inequality.” American Economic Review 45:1-28.
Lam, David and Deborah Levison. 1992. “Age, Experience, and Schooling: Decomposing Earnings Inequality in the United States and Brazil.” Sociological Inquiry 62:220-45.
Lenski, Gerhard. 1984. Power and Privilege: A Theory of Social Stratification. Chapel Hill, NC: University of N. Carolina Press.
Mandelbaum, Maurice. 1971. History, Man, and Reason: A Study in Nineteenth-Century Thought. Baltimore: The John Hopkins Press.
March, James G. and Herbert A. Simon. 1958. Organizations. New York: John Wiley.
Nisbet, Robert A. 1969. Social Change and History. New York: Oxford University Press.
Pigg, Stacy L. 1992. “Inventing Social Categories through Place: Social Representations and Development in Nepal.” Comparative Studies in Society and History 34(3):491-513.
Sanderson, Stephen K. 1990. Social Evolutionism. A Critical History. Oxford: Basil Blackwell.
Smith, Anthony D. 1973. The Concept of Social Change. London: Routledge & Kegan Paul.
State Statistical Bureau. 2006. China Statistical Yearbook 2006. Beijing, China: Statistics Press.
Stocking, George W. Jr. 1968. Race, Culture, and Evolution. New York: The Free Press.
Stocking, George W. Jr. 1987. Victorian Anthropology. New York: The Free Press.
Sun, Liping 孙立平. 2008. “Characters and Reasons for Continuing Increases in China’s Economic Inequality.” (In Chinese) http://vip.bokee.com/20070228244162.html (accessed March 22, 2008).
Thornton, Arland. 2001. “The Developmental Paradigm, Reading History Sideways, and Family Change.” Demography 38(4):449-465.
Thornton, Arland. 2005. Reading History Sideways: The Fallacy and Enduring Impact of the Developmental Paradigm on Family Life. Chicago: University of Chicago Press.
Thornton, Arland, Georgina Binstock, and Dirgha Ghimire. 2004. “International Networks, Ideas, and Family Change.” Presented at the Conference on Ideational Factors in International Family Change, June 3-5, University of Michigan, Ann Arbor, MI and the National Conference on Family Relations in Orlando, FL, November 17-20, 2004.
United Nations. 2006. Human Development Report of the UN (based on 2004 data) (http://hdr.undp.org/hdr2006/statistics/indicators/indicators_table.cfm).
Whyte, Martin. 2005. “Popular Attitudes toward Income Inequality in China.” Unpublished. Harvard University.
Williamson, Jeffrey. 1991. “British Inequality during the Industrial Revolution: Accounting for the Kuznets Curve.” Pp. 57-75 in Income Distribution in Historical Perspective, edited by Y. Brenner, H. Kaelble, and M. Thomas. Cambridge: Cambridge University Press.

Development and Perceived Inequality, Page 22
Wong, Chack Kie, and Nan Shong Peter Lee. 2000. “Popular Belief in State Intervention for Social Protection in China.” Journal of Social Policy 29:109–116.
Wu, Ximing and Jeffrey Perloff. 2005. “China’s Income Distribution, 1985-2001.” CUDARE Working Papers, University of California, Berkeley (http://www.uoguelph.ca/~xiwu/china_wu&perloff.pdf).
Xie, Yu and Emily Hannum. 1996. “Regional Variation in Earnings’ Inequality in Reform-Era Urban China.” American Journal of Sociology 102:950-92.
Xie, Yu, and Xiaogang Wu. Forthcoming. “Danwei Profitability and Earnings Inequality in Urban China.” The China Quarterly.
Zeng, Xiangquan 曾湘泉, and Ying Yue 岳颖. 2006. “Establishing an Income Distribution System in a Society that is Scientifically Fair and Just.” (Chinese) “建立科学合理公正公平
的社会收入分配体系”. Xinhua Net 新华网 2006-07-14. http://news.xinhuanet.com/theory/2006-07/14/content_4831556.htm. Accessed November 24, 2007.
Zhao, Zhenyu 赵振宇.1994. “On Several Issues of Inequality in Social Distribution .” (Chinese) “关于社会分配不公的几个问题” Shehui Kexue Zhanxian (Changchun) 社会科学战线
(长春)》1:112-121.

Development and Perceived Inequality, Page 23
Appendix: Key Question Items on Developmental Idealism in the 2006 Six Chinese Province
Survey
7.6 Economic Inequality Scale From the best you can gather, please choose a number on the scale to indicate how you would rate the extent of economic inequality in the following five countries On the scale below, “0” represents the smallest inequality, and “10” represents the largest inequality.
0 1 2 3 4 5 6 7 8 9 10
SMALLEST LARGEST 7.61 China _______(0-10) 7.62. Japan _______(0-10) 7.63. Brazil _______(0-10) 7.64. United States _______(0-10) 7.65. Pakistan _______(0-10)
7.7 Development Scale Now we would like you to consider how developed the different places on this map
are—China, Japan, Brazil, United States, and Pakistan. We would like you to rate each of these countries on this scale of development—with the least developed places in the world marked zero at the left and the most developed places in the world marked ten at the right. Where would you place each country?
0 1 2 3 4 5 6 7 8 9 10
LEAST MOST China _______(0-10) 7.71. Japan _______(0-10) 7.72. Brazil _______(0-10) 7.73 United States _______(0-10) 7.74. Pakistan _______(0-10)

Development and Perceived Inequality, Page 24
7.8 In a society, some workers are paid more and some are paid less. Let us compare the incomes of typical workers in three occupations across three countries. Here, doctor refers to a well-trained surgeon working in a county’s major hospital. Carpenter refers to a worker who makes custom-made home furniture. Peasant refers to an ordinary agricultural worker who produces grain for subsistence. Suppose that we already now that a typical carpenter in China makes 10,000 RMB Yuan per year. Please estimate, to the best of your knowledge, the income level (equivalent to RMB Yuan) for other eight groups of workers in the following table.
Doctor Carpenter Agricultural
worker United States
China 10000 RMB
Pakistan
Development and Perceived Inequality, Page 25
Table 1: Respondents’ Ratings of Five Countries on Levels of Development and Inequality, in
Comparison to UN Ratings.
Country Average Rating
of Development
(0-10)
UN Rating of
Development
(0-1)
Average Rating
of Inequality
(0-10)
UN Rating of
Inequality
(Gini, 0-1)
China 5.56 0.768 6.25 0.447
Japan 7.79 0.949 5.92 0.249
Brazil 5.49 0.792 5.47 0.580
U.S. 9.19 0.948 6.81 0.408
Pakistan 3.80 0.539 5.07 0.306
Source: 2006 Six Chinese Province Survey (n = 4,814) and United Nations’ (2006) Human
Development Report.
Development and Perceived Inequality, Page 26
Table 2: Main Response Patterns of Development Rating
Pattern Number Description of Ranking Order Percentage Cumulative
Percentage
1 US ≥ Japan ≥ Brazil ≥ China ≥ Pakistan 34.11 34.11
2 US ≥ Japan ≥ China ≥ Brazil ≥ Pakistan 33.96 68.07
3 Japan ≥ US ≥ Brazil ≥ China ≥ Pakistan 2.18 70.25
4 Japan ≥ US ≥ China ≥ Brazil ≥ Pakistan 1.37 71.62
5 All 116 Remaining Other Combinations 28.38 100.00
Source: 2006 Six Chinese Province Survey (n = 4,814).

Development and Perceived Inequality, Page 27
Table 3: Main Response Patterns of Inequality Rating by Response Patterns to Development Rating
Inequality Response Pattern Response Pattern to Development Rating
Number Description 1 2 3 4 5 Total
1 US ≥ Japan ≥ Brazil ≥ China ≥ Pakistan 25.58 8.32 6.67 3.03 8.42 14.13
2 US ≥ Japan ≥ China ≥ Brazil ≥ Pakistan 7.43 31.31 4.76 16.67 9.96 16.33
3 Japan ≥ US ≥ Brazil ≥ China ≥ Pakistan 0.43 0.67 8.57 3.03 0.29 0.69
4 Japan ≥ US ≥ Brazil ≥ China ≥ Pakistan 0.30 0.61 11.43 4.55 0.44 0.50
6 Reverse of Pattern 1 12.61 3.55 0.00 0.00 3.51 6.757 Reverse of Pattern 2 3.59 10.28 5.71 4.55 2.20 5.538 Reverse of Pattern 3 1.64 0.49 12.38 3.03 0.44 1.169 Reverse of Pattern 4 0.61 0.61 0.00 9.09 0.37 0.64
10 All 112 Remaining Combinations 47.81 44.16 50.48 56.06 74.38 54.28
Source: 2006 Six Chinese Province Survey (n = 4,814).
Note: Highlighted cells represent a direct positive correspondence in ranking order between development and inequality; underlined cells represent a direct negative correspondence in ranking order between development and inequality.
Development and Perceived Inequality, Page 28
Table 4: Geometric Mean of Estimated Income by Occupation and Country (in RMB yuan)
Doctor Carpenter Farmer
United States 205,432 72,964 61,128
China 36,566 10,000 4,214
Pakistan 20,194 7,880 3,445
Source: 2006 Six Chinese Province Survey (n = 4,496 to 4,802).