Embed Size (px)
Citation preview

Vol. 18, No. 4, December 2012
251
Chinese government as a determinant of corporate environmental reporting: a study of large Chinese listed companies
Hui SITU Flinders Business School Flinders University GPO Box 2100 Adelaide SA 5001 Australia Tel: +61 8 8201 5177 Fax: +61 8 8201 2644 Email: [email protected] Carol A TILT Flinders Business School Flinders University
Abstract
This study explores the extent and nature of environmental information disclosed in the annual reports of large Chinese listed companies, and the extent to which large Chinese listed companies adopt the use of corporate environmental reporting.
The results show that environmental reporting in China is increasing but the average amount of disclosure is still low. Environmental content disclosed in annual reports tends to be general, declarative and positive in nature. Company characteristics including company size, profitability, industry and ownership are the determinants of environmental disclosure in China.
Through examining environmental reporting in China, this study provides a better picture of environmental disclosure in China. The major contribution of this study is to reveal that, in a centralised economy, government plays an important role in influencing corporate environmental reporting practices.
Keywords
China, environmental reporting, social and environmental disclosure, Chinese government
1. Introduction
Along with growing concern about global environmental problems, environmental reporting has become an increasingly popular topic among both the business and academic communities. There is a vast amount of literature on environmental reporting by western countries, but fewer on developing countries (Sahay 2004; Yusoff et al. 2006; Hossain et al.

Vol. 18, No. 4, December 2012
252
2006). Of particular interest is the state of reporting by companies in the countries with a rapid economic growth (Gao 2009; 2011).
In China, the economy has grown rapidly over the last two decades. Since 2008, the Chinese economy has been ranked second in the world by GDP (World Bank 2008, 2009; International Monetary Fund 2010)3. This booming economy has come alongside an ecological environmental crisis (Zissis & Bajoria 2008). As a result, it is expected that Chinese companies will start to take their social and environmental responsibilities more seriously. Despite growing expectations for companies to participate in reducing environmental damage, it seems few Chinese companies attempt to realise their accountability in the ecological environments in which they operate. Therefore, this study aims to explore the extent and nature of environmental reporting (ER) in the annual reports of Chinese companies, and to what extent large Chinese listed companies adopt ER. Three research questions are investigated.
1. What is the extent and nature of ER in large Chinese listed companies’ annual reports?
2. What are the determinants of ER by large Chinese listed companies in their annual reports?
3. Can the ER activities be explained by the same theories that are used in studies of developed countries?
As in other studies, ‘extent’ refers to the level or volume of ER, and ‘nature’ refers to the content and whether it provides positive or negative information. The results show that ER in China is increasing but the average amount of disclosure is still low. ER in annual reports tends to be general, declarative and positive in nature. Company characteristics including company size, profitability, industry and ownership are the determinants of ER identified
This study provides a preliminary understanding of the adoption of ER by large Chinese listed companies. However, only top 20 listed companies in China are examined, therefore, the results should not be generalised to the wider group of Chinese companies. The major contribution of this study is to reveal that, in the sample examined, there is significant government influence on ER.
2. Background
China is one of the largest transition economies in the world. Also, China has a totally different legal system from other countries, particularly those in western countries. As such, to understand corporate ER in China, it is essential to consider the background.
3 www.imf.org and www.worldbank.org

Vol. 18, No. 4, December 2012
253
Before China opened its doors to the outside world in 1978, it maintained a centrally planned economy. Most of the country’s industrial production was by state-owned enterprises based on centrally planned output targets (Hu & Khan 1997). During this period, state-owned enterprises followed commands from the Chinese government, and had an obligation to operate social programs (Gaoguan Information 2009). However, although state-owned enterprises took some social responsibilities, including employee welfare, they ignored others, such as environmental protection (Gaoguan Information 2009). Consequently, there was no ER during this period.
In 1978, China started a major program of economic reform. The reform encouraged the foundation of rural enterprises and private business. However, the non-state-owned businesses did not have the same resources and market share with the state-owned enterprises, so in order to survive and pursue more profit they were reluctant to take on social responsibilities. At the same time, the government gave state-owned enterprises relief from the obligation of operating social programs and allowed them to focus on profit making. This policy boosted the Chinese economy, but it was detrimental to making companies consider their social responsibilities (Gaoguan Information 2009). As a result, ERs were still absent during the period 1978 to 2000.
In the 21st century, after China joined the World Trade Organisation (WTO), the Chinese economy grew even faster. However, as mentioned in section 1, rapid economic development was accompanied by a series of environmental problems, thus environmental protection became essential for China. Since ER is seen as ‘an alternative means of reducing environmental damage’ (Mathews 1997, p. 491), Chinese companies are facing more and more pressure to improve their ER. The pressures are as follows.
First, the Chinese government plays a very important role in environmental protection and promoting companies to accept their environmental responsibilities (Guo 2005). A series of guidelines, such as Guidelines of state-owned enterprises perform social responsibilities and Guidelines about enhancing supervision of listed companies’ social responsibilities, have been issued since 2006. Although guidelines are not like regulations that require mandatory ER, in a centralized country, they are meaningful in promoting companies to accept their social responsibilities (Guo 2005).
Moreover, in May 2008, Provision of Environmental information disclosure was enacted. According to this Provision, enterprises are encouraged to provide voluntary ER to the public. Although ER is voluntary, this is the first general provision about ER; thus it is expected there will be an increase in ER after this Provision was introduced.
Also, China now has national policies to encourage environmental protection. The Chinese government in 2005 first proposed the ‘Harmonious Society’, which is the idea of changing China’s focus from

Vol. 18, No. 4, December 2012
254
economic growth to overall societal balance and harmony. Environment is one of the key factors required to develop a harmonious society (Xinhua News 2005) and therefore energy saving and emission reduction had been set as one of the targets of the eleventh five-year-plan4 (2006-2010).
Second, along with globalization, inevitably Chinese companies face higher and higher environmental standards from foreign investors, business partners and their supply chains. For instance, during the period 1997 to 2004, over eight thousand Chinese companies have undergone an investigation audit about their social responsibilities from their foreign investors and business partners (Gaoguan Information 2009).
Third, the emergence of social responsibilities investment is likely to push Chinese companies to disclose more ER of higher quality. In 2008, AEGON-Industrial Fund Management Co., Ltd issued the first Chinese social responsibility investment product. In the same year, the Shanghai Stock Exchange (SSE) and China Securities Index Co., Ltd. issued the SSE Social Responsibility index.
In the face of these pressures, it is expected that there will be an increasing trend of ER in China during the period 2005 to 2009.
3. Literature review
3.1 Trends of social and environmental reporting
A number of surveys (Ernst & Ernst 1979; Trotman & Bradley1981; Parker 1986; Roberts 1992; Gibson & O’Donovan 2007) found that it was in the early 1990s that large companies in many countries began to realise the impact of their environmental performance, and voluntarily provided environmental information via their annual reports. More recently, many large multinationals have more advanced reporting practices, and they release a separate stand-alone report to provide information to the public about their social and environmental performance. KPMG (2008) reported that, in the last two decades, corporate responsibility reporting has risen steadily and it has increased substantially in the past three years. In particular, reporting on corporate responsibility has become common practice in developed countries like the USA, UK, Japan and Australia.
However, ER in China is in the early stages of development. In 2002, corporate responsibility reporting was almost non-existent in Mainland China. In 2005, while almost 80% of the G2505 reported on their social responsibility, less than 10 Chinese companies published social responsibility information. It is clear that ER in China lags that in
4 The five-year-plan maps strategies for Chinese economic development, and plays an important role in guiding Chinese companies’ behaviour, thereby may drive Chinese companies to disclose more environmental information. 5 The top 250 companies of the Fortune 500.

Vol. 18, No. 4, December 2012
255
developed countries (University of Amsterdam & KPMG Global Sustainability ServicesTM 2005). However, as discussed in section 2, Chinese companies are now facing increasing pressure to improve their ER. Therefore, one goal of this study is to examine ER by large listed Chinese companies, to show trends over time.
3.2 Content of social and environmental reporting
Many studies have been conducted to determine the content of social and environmental reporting that companies are producing (Guthrie and Parker 1989; Tilt 2001; Gray et al. 1995; Nurhayati et al. 2006; Damak-Ayadi 2010). In developed countries, Human Resources disclosure is the most common theme, followed by community and environment (Guthrie & Parker 1989, Gray et al. 1995). A more recent study completed in the French context shows that voluntary disclosures are related to four topics: corporate social responsibility, common values, social rating and information verification (Damak-Ayadi 2010). While some studies investigated corporate social and environmental responsibility as a whole, Tilt (2001) studied environmental reporting in the annual reports of Australian companies, and found that of the mean number of sentences Rehabilitation ranks the highest (2.38), then Waste and recycling (0.97), Environmental management programs (0.83) and Environmental Policy has only 0.4 sentences on average. As for the study in developing countries, Nurhayati et al. (2006) examined 100 companies listed on the Jakarta Stock Exchange for the year ending 2003. They found that Environmental Policy and Sustainability was the category with the most disclosures, while General Environmental Conditions, Environmental Product and Process, Environmentally Financial and Environmental Aesthetics were seldom disclosed.
The content of social and environmental reporting in China has also been studied by several scholars, and results showed that environment is one of the most common categories of social disclosure (Gao 2009; Lu 2008); however, these studies considered ‘environment’ as a stand-alone category rather than a series of more detailed categories.
3.3 Determinants of social and environmental reporting A number of empirical studies have explored the determinants of ER, such as Cowen et al.’s (1987) study of USA companies, Trotman and Bradley’s (1981) study of Australian companies and Hackston and Milne’s (1996) study of New Zealand companies. These and more recent papers found that size, profitability and industry are major determinants of ER (Patten 2005; Al-Tuwaijri et al. 2004; Freedman & Jaggi 2005). First, larger companies provide more social and environmental information to the public. This may due to the fact that larger companies’ activities have greater impact on the environment and society, so they attract more concern from the public and government (Hackston & Milne 1996). Profitability is another important determinant, as the relationship between
Vol. 18, No. 4, December 2012
256
corporate profitability and ER has been found to be positive. Possible reasons are that the more profitable the companies are, the stronger the social pressure they face, and in order to address the social pressure and respond to societal needs, the more profitable companies are willing to disclose greater volumes of social and environmental information to the public (Cowen et al. 1987). The nature of a company’s industry affects social and environmental reporting as well, especially for ER. Companies in environmentally sensitive industries are more likely to be targeted by the public and government, in order to lower political costs; they tend to disclose additional environmental information (Cowen et al. 1987). Hackston and Milne (1996, pp. 25–6) also found that there is an interaction relationship between company size and industry; the size-disclosure relationship is much stronger for high-profile industry companies than for low-profile industry companies.
In China, researchers have also found that some ER features are similar to those in developed countries. For example, studies by Xiao and Hu (2005), Guo (2005) and Zhang et al. (2009) indicate that environmentally sensitive industries are likely to perform better than non-environmentally sensitive. Zhang et al. (2009) studied Chinese chemical industrial companies, and found over 50% of companies sampled provided ER in their annual report.
Another finding mirrored in developed countries is that company size and profitability are determinants of environmental disclosures. Zhang et al. (2009) found that larger firms, and firms with stronger profitability, are more likely to have ER, in order to build a positive image and avoid political costs such as higher tax.
While some of the studies showed ER in China has some similar features to those in developed countries, others found differences. Overall, they show that the government acts as a very important stakeholder in China (Guo 2005; Gao 2009). Guo (2005) also points out that the Chinese government is the primary ER user and does not tend to share information with the public (however, as mentioned earlier, this situation is changing after the Provision of Environmental information disclosure (Trial) was issued), thus constraining the use of the information. Consequently, state ownership is tested in this study to show whether it is a determinant of Environmental disclosure.
In summary, compared with ER studies in developed countries, ER study in China is still in its infancy (Xiao & Mi 2004; Gao 2011), althogh it is growing rapidly (Moon & Shen 2010). Studies mainly focused on introducing the importance of ER, and discussing the feasibility and necessity of ER (Song & Li 1992; Zhang 1993). Since the middle of the 1990s, while increasingly studies started examining Chinese companies’ ERs (Zhu & Xue 2007), they mainly examined corporate social responsibilities as a whole (Gao 2009; Xiao & Hu 2005), or they examined ERs only in specific industries (Zhang et al. 2009). Moreover, previous studies on China use mainly descriptive analysis. Some studies conducted

Vol. 18, No. 4, December 2012
257
a survey (Li & Xiao 2002), and some undertook case studies (Li 2004). However, content analysis (the most popular method used in analysing ER) is seldom used to study ER in China. Therefore, this study addresses these issues.
4. Theoretical foundation The most commonly utilised theories to explain social and environmental reporting, particularly in developed countries, are legitimacy theory and stakeholder theory (Campbell et al. 2003). However, these theories have not been tested or considered to any extent in studies of reporting in China. Some authors suggest that these theories may not be as relevant to developing countries. Legitimacy theory has been discussed and critiqued extensively in the literature (Bansal & Roth 2000; Deegan 2002; Hybels 1995; Milne & Patten 2002; Deegan et al. 2002). It is important to investigate whether any of the reporting characteristics of Chinese companies reflect legitimacy of stakeholder effects.
Legitimacy and stakeholder theories are seen as overlapping as they both involve attempts to legitimise the firm's behaviour through disclosure, but legitimacy theory has a societal focus, while stakeholder theory focuses on satisfying particular stakeholders, some of whom are in competition with each other (Tilling & Tilt 2010). ‘Underlying organizational legitimacy is a process, legitimation, by which an organization seeks approval (or avoidance of sanction) from groups in society. Legitimation may be necessary to ensure an organization’s continued existence’ (Kaplan & Ruland 1991, p. 370) and the theory argues that ER is ‘a part of the social contract or part of a firms’ licence to operate (Deegan 2006, p. 399). Dowling and Pfeffer (1975, p. 122) provide a definition of legitimacy:
Organisations seek to establish congruence between the social values associated with or implied by their activities and the norms of acceptable behaviour in the larger social system in which they are a part.
In order to be perceived by outside parties as legitimate, companies provide ER voluntarily. Lindblom (1994) outlines reporting strategies firms are likely to adopt in order to defend or maintain their legitimacy in the eyes of the public, including attempts to: educate their readers abut actual changes, change perceptions without changing their activities, deflect attention from the issue, or change external expectations. Deegan et al’s (2000) case study in Australia provides an example of how firms responded to a threat to their legitimacy. They found that companies changed their ER polices following a major incident or industry related social event.
This study investigates whether there is any evidence of legitimation strategies in the ER reporting of Chinese firms. Specific threats are not considered but rather, legitimacy theory is used in conjunction with stakeholder theory to determine whether there is evidence of voluntary

Vol. 18, No. 4, December 2012
258
reporting above that required by legislation, and whether there is any apparent influence of the State.
Gray et al. (1996) state that Managerial Stakeholder Theory considers different stakeholder groups have different levels of impact on company survival, and powerful stakeholders are ‘those who control resources that are both scarce and essential to achievement of the organisation’s objectives’ (Deegan 2006, p. 340), and, hence, are attended to first. Some research results, such as Gao (2009), and Neu, Warsame and Pedwell (1998), found that corporate social disclosures are more likely to fulfil the needs of powerful stakeholders first, because those stakeholders are deemed to be more important to the survival of the corporation. As Deegan and Blomquist (2006, p. 349) note:
…the disclosure of particular types of information can be used to gain or maintain the support of particular groups. For example, if a potentially powerful group is concerned about the social or environmental performance of an organisation then that organization might perceive a need to publicly disclose information about particular social or environmental initiatives that it has, or is about to, implement so as to alleviate some of the concerns held by the powerful stakeholders.
In this study, Managerial Stakeholder Theory will used to examine whether the Chinese government significantly influences ER, given the recent emphasis they have put on environmental issues, including the issue of policies and guidelines.
5. Research method
5.1 Sample selection The sample comprises the annual reports of the top 20 Chinese listed companies for the years 2005 to 2009, selected from the Fortune China 100, which ranks companies by operating revenue. To avoid the ambiguity of translation, only those companies which have an annual report in English were included. Some companies were removed from the sample in the process of collection, due to insufficient or unavailable data. Also, because of time constraints, the number of companies sampled is small, therefore, it may be inappropriate to generalise the results of this study to the ER population of Chinese listed companies. However, this study is an early attempt to examine environmental disclosure in China, so the selection of the top 20 is an appropriate place to start.
Annual reports are used as the data source for conducting content analysis, since they are common documents used by companies to provide environmental information to the public (Guthrie & Parker 1989, 1990; Hackston & Milne 1996; Brown & Deegan 1998; Tilt 2001; Adams & Zutshi 2004; Rao et al. 2012). The five-year time period was used to determine whether the change of regulations, guidelines and policies

Vol. 18, No. 4, December 2012
259
affected the adoption and nature of environmental reporting and disclosures. Other separate social responsibility reports are not reviewed, as these are rarely available in English. However, the number of companies that issued a separate social responsibility report is investigated. Readers should be aware of the limitations arising from the sole use of annual reports, as the findings reveal that more Chinese companies are starting to use stand-alone social responsibility reports as the media to report environmental information. This provides scope for future research.
5.2 Content analysis Content analysis is defined as ‘an approach to the analysis of documents and texts that seeks to quantify content in terms of predetermined categories and in a systematic and replicable manner’ (Bryman & Bell 2007, p. 304). When studying ER, content analysis is widely applied, because it has been seen as a systematic and objective method of analysing the texts and documents produced by organisations, such as annual reports (Bryman & Bell, 2007). As a result, content analysis is used in this study, to examine ER in annual reports.
The unit of analysis adopted is words. Krippendorff (1980) argues recording units and context units should be separated. Recording units refer to the units that are to be counted in specific categories, while context units refer to those that are of concern to the process of describing the recording units. Therefore, in this study, sentences are used as context units to capture the environmental disclosure information, and numbers of words are chosen as the recording units to count the amount of environmental disclosures in given categories.
The basic categories used were obtained from Hackston and Milne (1996), and these were based on prior studies by Ernst and Ernst (1979), Guthrie and Parker (1989) and Gray et al. (1995). The categories used by Tilt (2001) were also considered, in particular for deciding the sub-categories of the themes. The set of categories includes three dimensions: theme, evidence and type of news. Theme is sub-categorised into environmental protection, general statement, compliance, environmental financial information, environmental risk, corporate governance and other environmental activities. Evidence includes quantitative monetary data, quantitative non-monetary data and qualitative or declarative data. News type refers to good news, bad news or neutral news. The definitions of each sub-category are presented in Appendix A.
Coding rules were developed primarily based on prior studies, such as Tilt (2001), Hackston and Milne (1996) and Hossain et al. (2006). Pre-testing is used to test the reliability and validity of the coding instrument (Bryman & Bell, 2007). The pre-test sample was selected from annual reports in 2009, which are not in the final sample. Two rounds of pretesting were performed by two coders. A test of simple coefficients was applied to

Vol. 18, No. 4, December 2012
260
determine the agreement level between the two coders. The pretesting produced a high level of coding reliability, with simple reliability coefficient tests well above the acceptable level of 80 percent by the end of the second round. The final coding rules are presented in Appendix B.
5.3 Dependant variable Previous studies on ER have used a score or index to measure disclosure, however, Nurhayati et al. (2006) state that ‘volume’ is more appropriate in developing countries as the extent of disclosure is low. Therefore, the number of words related to the environment found in the annual report provides the dependent variable.
To analyse the extent of ER, the annual reports of each sample company were reviewed. An electronic search function is used to obtain the information related to ER. In this process, ‘environment’, ‘energy’, ‘resource’, ‘rehabilitation’ and ‘pollution’ were used as keywords. When each keyword was identified, the entire sentence or paragraph was read for context and the entire sentence or paragraph was included in the word count if relevant.
5.4 Independent variables Independent variables included the following:
Company size: Studies have consistently found that company size is highly positively correlated with environmental disclosure (Cowen et al. 1987; Trotman & Bradley 1981; Guthrie & Parker 1990; Gray et al. 1995; Hackston & Milne 1996; Tilt 2001; Al-Tuwaijri et al. 2004; Freedman & Jaggi 2005; Patten 2005; Cox & Douthett 2009). Since larger companies are more likely to be targeted by the public, they face more pressures and thereby provide more information to avoid public concern (Gray et al. 1995). Further, Hackston and Milne (1996) argue that there are no theoretical reasons for a particular measure of size. Therefore, income has been used as a measure of size and is directly obtained from Fortune China 100.
Profitability: Deegan (2006) argues that the higher the profit earned by the firm, the greater the political cost faced by the firm. In order to reduce criticism that a company has excessive profit and does not pay a ‘fair share’ to other parties, companies are more likely to disclose more information to legitimate themselves (Deegan 2006). Therefore, reported profit is used as an independent variable.
Industry: Previous studies report that firms in high-profile industries do provide more ER (Hackston & Milne 1996; Tilt 2001). Hackston and Milne (1996) defined a high-profile industry as one that ‘with consumer visibility, a high level of political risk, or concentrated intense competition, as those may have captured a systematic relationship between such characteristics and social responsibility activities’ (Hackston & Milne

Vol. 18, No. 4, December 2012
261
1996). Sample companies are grouped into high-profile and low-profile industries. The high-profile industry group includes mining, chemicals, manufacturing, automobiles and airlines. The remaining, including banking, insurance, telecommunication, household, trade, and services, are classified as low-profile.
Stated-owned: As discussed earlier, China has a very different economic system from other countries, particularly developed countries. State-owned companies play a very important role in the Chinese economy and act as a major stakeholder; therefore, this characteristic was included as a dummy independent variable.
6. Results and discussion Descriptive statistics are presented in Table 1. There is an increasing trend over the period, the average amount of environmental words increasing from 302.3 in 2005 to 552.8 in 2009. However, the mean value of total environmental words is low. In this study, the mean value of environmental words in 2008 is 453.16, compared to Rao et al.’s (2012) study of 100 Australian listed companies’ annual reports in 2008, in which the mean value of environmental words was 1545.5. This suggests that ER in China is far behind that in developed countries. In addition, as can be seen from Table 1, the amount of environmental words in each report varied from 0 to almost 2500, and the standard deviations are large, which indicates that the variability between companies is very wide.
Table 1 reports the general descriptive statistics about total words relating to the environment, total income and net profit over the five-year period. The descriptive statistics are extended to theme, evidence and news type in Tables 2 and 3.

Vol. 18, No. 4, December 2012
262
Table 1: Descriptive statistics - income, net profit and total environmental words
From Tables 2 and 3, some interesting results can be gleaned. First, consistent with the general descriptive statistics, almost all of the standard deviations are larger than the mean values indicating wide variability. Second, the number of companies disclosing and the number of words disclosed provide very different pictures. For example, the number of disclosing companies that have quantitative monetary disclosure for each year is around 20%, but the amount of words for each year is generally less than 5% with the average number of words being under 20. Third, with regard to the themes used to categorise the data, environmental protection and general statement are the two themes the annual reports disclosed most about.
Minimum Maximum MeanStd.
DeviationIncome 22363.85 590632.00 111900.42 154251.01Net profit 208.00 102927.00 15254.05 25806.28Total words .00 1346.00 302.35 476.40Income 40247.78 799115.00 124498.28 176577.05Net profit 178.97 53549.00 13224.04 17031.31Total words .00 2446.00 451.44 660.02Income 56037.53 1044579.00 217684.48 248226.60Net profit 1185.05 142224.00 27358.41 34619.27Total words .00 2080.00 489.66 619.87Income 78395.00 1204843.00 249019.37 288413.37Net profit 2991.00 134574.00 31504.68 35971.64Total words .00 1495.00 453.16 497.87Income 101864.00 1452101.00 303569.05 353529.08Net profit 50.00 113798.00 29436.00 38618.01Total words .00 1510.00 552.84 480.34
2009
Year2005
2006
2007
2008

Vol. 18, No. 4, December 2012
263
Table 2: Descriptive statistics - total environmental words by theme
N % N %Environment Protection 8 47.1% 1224 23.8% 72.0 0 265 93.76General Statement 8 47.1% 1114 21.7% 65.5 0 339 102.86Financial Statement 5 29.4% 1556 30.3% 91.5 0 857 226.71Compliance 2 11.8% 340 6.6% 20.0 0 273 67.18Risk 2 11.8% 498 9.7% 29.3 0 401 98.62Corparate Governance 2 11.8% 225 4.4% 13.2 0 173 43.05Others 1 5.9% 183 3.6% 10.8 0 183 44.38Environment Protection 10 55.6% 2518 31.0% 139.9 0 848 216.40General Statement 11 61.1% 2238 27.5% 124.3 0 587 184.24Financial Statement 5 27.8% 1166 14.3% 64.8 0 662 166.28Compliance 8 44.4% 942 11.6% 52.3 0 328 93.60Risk 2 11.1% 198 2.4% 11.0 0 115 32.48Corparate Governance 3 16.7% 439 5.4% 24.4 0 343 81.01Others 7 38.9% 625 7.7% 34.7 0 366 86.25Environment Protection 8 42.1% 2679 28.8% 141.0 0 575 201.34General Statement 12 63.2% 2190 23.5% 115.3 0 478 146.37Financial Statement 5 26.3% 1829 19.7% 96.2 0 640.5 204.69Compliance 5 26.3% 341 3.7% 17.9 0 117 37.09Risk 6 31.6% 856 9.2% 45.1 0 394 105.29Corparate Governance 6 31.6% 517 5.6% 27.2 0 177 53.29Others 5 26.3% 892 9.6% 46.9 0 565 132.47Environment Protection 11 57.9% 2714 31.5% 142.8 0 490 176.90General Statement 11 57.9% 1341 15.6% 70.6 0 261 82.27Financial Statement 4 21.1% 1184 13.8% 62.3 0 684 165.18Compliance 8 42.1% 805 9.3% 42.4 0 321 87.44Risk 5 26.3% 716 8.3% 37.7 0 328 92.15Corparate Governance 7 36.8% 870 10.1% 45.8 0 457 112.59Others 5 26.3% 980 11.4% 51.6 0 611 145.83Environment Protection 14 73.7% 3134 29.8% 164.9 0 471 175.99General Statement 14 73.7% 2569 24.5% 135.2 0 529 144.63Financial Statement 7 36.8% 1457 13.9% 76.7 0 672 167.21Compliance 7 36.8% 771 7.3% 40.6 0 237 67.10Risk 5 26.3% 757 7.2% 39.8 0 301 86.94Corparate Governance 7 36.8% 1218 11.6% 64.1 0 429 118.06Others 7 36.8% 598 5.7% 31.5 0 190 59.46
2009
Year Theme Frequency Disclosing wordsSTD
2005
2006
2007
2008
Mean Min Max

Vol. 18, No. 4, December 2012
264
Table 3: Descriptive Statistics – total environmental words by evidence and news type
6.1 Analysis by theme
Environmental protection is one of the principal themes that appear in the annual reports, with the average environmental words ranging from 72.0 to 164.9, and every year it contributed almost 30% to the total environmental words disclosed. This category includes all specific company activities around energy, pollution, rehabilitation, conservation etc., so it contains a wide range of environmental information, which may result in coding a large amount of environmental words. When reading the annual reports, it is evident that efforts of companies on energy saving and emission reduction are the dominant issues in the discussion of environmental protection. For example, a large company (China Petroleum & Chemical Corporation 2009, p. 17) reported the following:
The Company implemented the HSE management system across the entire Company, promoted energy saving and emission reduction, developed low-carbon economy, cut carbon dioxide emission by various means and ensured clean production and production of clean products. Compared with previous year, energy

Vol. 18, No. 4, December 2012
265
intensity per RMB 10,000 output value was 0.72 tce, fulfilling in advance the energy-saving target of the Eleventh Five-Year Plan; industrial water consumption decreased by 3.3%; COD in waste water declined by 3.6%; sulphur dioxide discharge fell by 14%; and the recycling rate of industrial water stood around 95%.
General statement is a second significant theme found in the sample. This theme identifies the companies’ commitment to the environment. Most of these general statements are ‘motherhood’ statements and are stated in very broad terms. A typical comment is illustrated below (China Shenhua Energy Company Limited 2009, p. 1): We
We endeavour to provide more clean, green and low carbon energy to our society by means of our wisdom and power, and make continuous contribution to reduce greenhouse gas emission, slow down the pace of global warming and protect our natural environment.
Environmental financial statement surprisingly ranks as the third highest theme. Each year, companies sampled, on average over 10% were environmental words disclosed in the financial statement section of their annual reports. Moreover, over 25% of companies sampled disclosed environmental financial information during the period examined. This percentage reached 36.8% in 2009. The analysis indicates that most of the companies that disclose environmental financial statements are listed on the New York Stock Exchange (NYSE), so this finding may be due to the United States Securities and Exchange Committee’s (SEC) mandatory requirement that listed companies separately disclose environmental contingencies and environmental expenditures. In compliance with this requirement, most of the companies disclosed relevant information in the notes to the financial statements and these are classified into the Environmental financial statement theme. The following excerpt from the annual report of China Petroleum & Chemical Corporation (2009, p. 130) typifies the kind of environmental financial statements made by sampled companies, in particular high-profile industrial companies.
Under existing legislation, management believes that there are no probable liabilities that will have a material adverse effect on the financial position or operating results of the Group. The PRC government, however, has moved, and may move further towards more rigorous enforcement of applicable laws, and towards the adoption of more stringent environmental standards. Environmental liabilities are subject to considerable uncertainties which affect the Group’s ability to estimate the ultimate cost of re-mediation efforts. These uncertainties include i) the exact nature and extent of the contamination at various sites including, but not limited to refineries, oil fields, service stations, terminals and land development areas, whether operating, closed or sold, ii) the extent of required clean-up efforts, iii) varying costs of alternative re-mediation strategies, iv) changes in environmental re-mediation requirements, and v) the identification of new re-mediation sites. The amount of such future cost is indeterminable due to such

Vol. 18, No. 4, December 2012
266
factors as the unknown magnitude of possible contamination and the unknown timing and extent of the corrective actions that may be required. Accordingly, the outcome of environmental liabilities under proposed or future environmental legislation cannot reasonably be estimated at present, and could be material. The Group paid normal routine pollutant discharge fees of approximately RMB 3,196 million for the year ended 31 December 2009 (2008: RMB 2,284 million).
Compliance: Volume of words disclosed in the compliance category is low, which is not consistent with the study undertaken on Chinese mineral extraction corporations by Lu (2008). Lu found in her study that compliance with regulations and requirements has the highest average score. However, in this study, the percentage of words grouped in compliance is only 6.61%, 11.59%, 3.67%, 9.35% and 7.34% in 2005, 2006, 2007, 2008 and 2009 respectively. One possible reason is that the two studies used different samples. Lu’s study used all the Chinese mining companies listed on the Shanghai and Shenzhen Stock exchange from 2005 to 2007. In contrast, in this study the top 20 Chinese listed companies from 2005 to 2009 were selected for the sample. The use of only mining companies by Lu (2008) is likely to influence the level of compliance information included as a result of regulations in this industry. While words disclosed in this category are low, the number of companies disclosing is relatively high. This may due to the fact that most sampled companies only used a short sentence to present their compliance information. The statement below (China Railway Group Limited 2009, p. 49) provides a typical example:
During the reporting period, the Company complied with the laws and regulations of the places where it operates its business as well as the regulations and guidelines stipulated by regulatory authorities such as the China Securities Regulatory Commission, the Hong Kong Securities and Futures Commission, the Shanghai Stock Exchange and The Stock Exchange of Hong Kong Limited (the ‘Hong Kong Stock Exchange’).
Risk: ER on Risk increased over the years investigated. In 2009, five (26.32%) companies mention environmental risk in their annual reports. As discussed earlier, the emergence of social responsibility investment funds may draw the attention of more Chinese listed companies to environmental risk. Moreover, the United States SEC also mandatorily requires listed companies to disclose any information that may have impacts on the company’s financial position. Therefore, it might be expected that companies that are listed on NYSE would be likely to disclose this kind of information. An example statement that has been drawn from the annual report of China Shenhua Energy Company Limited (2009, p. 56) illustrates this:
The Group has been operating in China for many years. Environmental protection laws and regulations are fully enforced in China, which has impact on the coal and power businesses. At
Vol. 18, No. 4, December 2012
267
present, it is not possible to predict the future legislation on environmental protection, which may have significant impact on the Group. However, according to the existing regulations, the management of the Group is of the view that currently there is not any environmental protection responsibility that may have material adverse effect on the Group’s financial position save as the amounts accounted in the financial statements.
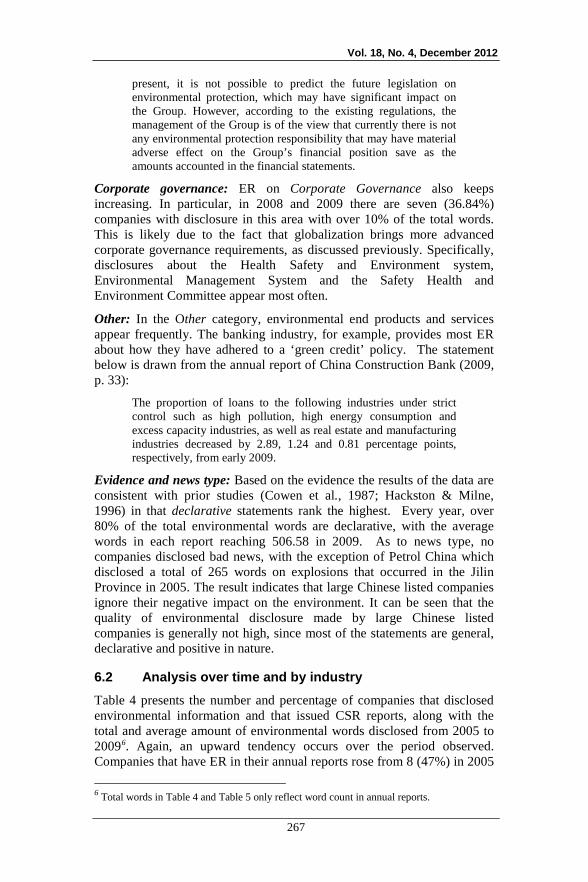
Corporate governance: ER on Corporate Governance also keeps increasing. In particular, in 2008 and 2009 there are seven (36.84%) companies with disclosure in this area with over 10% of the total words. This is likely due to the fact that globalization brings more advanced corporate governance requirements, as discussed previously. Specifically, disclosures about the Health Safety and Environment system, Environmental Management System and the Safety Health and Environment Committee appear most often.
Other: In the Other category, environmental end products and services appear frequently. The banking industry, for example, provides most ER about how they have adhered to a ‘green credit’ policy. The statement below is drawn from the annual report of China Construction Bank (2009, p. 33):
The proportion of loans to the following industries under strict control such as high pollution, high energy consumption and excess capacity industries, as well as real estate and manufacturing industries decreased by 2.89, 1.24 and 0.81 percentage points, respectively, from early 2009.
Evidence and news type: Based on the evidence the results of the data are consistent with prior studies (Cowen et al., 1987; Hackston & Milne, 1996) in that declarative statements rank the highest. Every year, over 80% of the total environmental words are declarative, with the average words in each report reaching 506.58 in 2009. As to news type, no companies disclosed bad news, with the exception of Petrol China which disclosed a total of 265 words on explosions that occurred in the Jilin Province in 2005. The result indicates that large Chinese listed companies ignore their negative impact on the environment. It can be seen that the quality of environmental disclosure made by large Chinese listed companies is generally not high, since most of the statements are general, declarative and positive in nature.
6.2 Analysis over time and by industry Table 4 presents the number and percentage of companies that disclosed environmental information and that issued CSR reports, along with the total and average amount of environmental words disclosed from 2005 to 20096. Again, an upward tendency occurs over the period observed. Companies that have ER in their annual reports rose from 8 (47%) in 2005 6 Total words in Table 4 and Table 5 only reflect word count in annual reports.

Vol. 18, No. 4, December 2012
268
to 16 (84%) in 2009, double that of 2005. A large increase of over 65% occurred between 2005 and 2006. As mention in section 2, 2006 is the first year for implementation of China’s eleventh five-year-plan, in which one of its major targets is to reduce energy consumption and pollutant emissions. The large increase indicates the influence of government on ER in China. The occurrence of CSR reports increased even more dramatically; the percentage of CSR reports being 17.6% in 2005 and almost four times higher at 78.9% in 2009. As to the average amount of environmental words, this also shows an upward trend, increasing over 83%, during the five-year period. Compared to the extent of increase in the number of companies disclosing and the number of CSR reports however, the increase in environmental words is much lower. This confirms that even though there is a general upward trend of environmental disclosure in the companies sampled, it is still in the emergent stage as previously discussed.
Table 4: Longitudinal analysis (general diagnostics)
2005 2006 2007 2008 2009
Numbers of sample companies 17 18 19 19 19
Companies disclosing (n) 8 14 15 15 15
Companies disclosing (%) 47% 78% 79% 79% 79%
Companies have CSR report (n) 3 4 11 15 15
Companies have CSR report (%) 18 22% 58% 79% 79%
Total words 5140 8126 9303 8610 10504
Average words 302.4 451.4 489.7 453.2 553.8 Table 4 shows that in 2008, the average number of environmental words dropped slightly. As different industries may have a significant impact on environmental disclosure, the data presented in Table 5 is grouped into high-profile and low-profile industries. This shows that while the average disclosure of environmental words increased steadily in low-profile industries, the number in high-profile industries dropped slightly from 2007, which is not consistent with the upward trend shown in the number of companies that have ER and CSR reports. On further investigation of the results, there are only 22.2% of high-profile industry companies that have a CSR report in 2006, but in 2007, this increased to 77.8% and in 2009 all of the high-profile industry companies issued a CSR report. So it is possible that most of the environmental information was disclosed in CSR reports rather than in the annual reports. This suggests that large Chinese companies, in particular high-profile companies, consider CSR reports to be a more appropriate medium for ER (a detailed analysis of which is beyond the scope of this study).

Vol. 18, No. 4, December 2012
269
Table 5: Longitudinal analysis (by industry type)
6.3 Pearson’s correlation Pearson correlations are used to investigate the association between each of the variables. As can be seen in Table 6, Income is significantly and positively correlated to total environmental words, which indicates that larger companies are likely to provide more ER in their annual reports. The p-value for the association between net profit and total environmental words is 0.055, significant at the 6% level.
Table 6: Pearson’s correlation (in general)
Income Net profit Income Pearson Correlation 1.00
Sig. (2-tailed)
Net profit Pearson Correlation .594** 1.00
Sig. (2-tailed) .000
Total words Pearson Correlation .411** .200
Sig. (2-tailed) .000 .055
** Correlation is significant at the 0.01 level (2-tailed).
The same test was repeated by dividing the data into high-profile and low-profile industry groups. Interestingly, the results in Table 7 show that the correlations between each pair of variables in the low-profile industry are positive and statistically significant at the 0.01 level. However, in the high-profile industry, total words is significantly correlated with income,
2005 2006 2007 2008 2009
9 9 10 8 83 6 7 5 4
33% 67% 70% 63% 50%2 2 4 5 4
22% 22% 40% 63% 50%589 813 2177 2071 2095
65 90 218 259 262
Numbers of sampled companies 8 9 9 11 11Disclosing companies (n) 5 7 8 10 11Disclosing companies (%) 63% 78% 89% 91% 100%Companies have CSR report (n) 1 2 7 10 11Companies have CSR report (%) 13% 22% 78% 91% 100%
4551.00 7313.00 7127.00 6539.00 8409.00Average words 568.88 812.56 791.89 594.45 764.45
Average words
Total words
Low-profile:
High-profile:
Total words
Numbers of sampled companiesDisclosing companies (n)Disclosing companies (%)Companies have CSR report (n)Companies have CSR report (%)

Vol. 18, No. 4, December 2012
270
but not with net profit. This result confirms the finding of the descriptive statistics that indicates that industry type may have an impact on the ER level of large Chinese listed companies. The lack of correlation with net profit is likely caused by the volatility of profit in high-profile industries.
Table 7: Pearson’s correlation (by industry type)
Income Net profit High- profile Income Pearson Correlation 1.00
Sig. (2-tailed)
Net profit Pearson Correlation .645** 1.00
Sig. (2-tailed) .000
Total words Pearson Correlation .361* .202
Sig. (2-tailed) .012 .168
Low-profile Income Pearson Correlation 1.00
Sig. (2-tailed)
Netprofit Pearson Correlation .809** 1.00
Sig. (2-tailed) .000
Total words Pearson Correlation .570** .559**
Sig. (2-tailed) .000 .000
6.4 Independent-sample T tests and Mann-Whitney U tests For a more robust test of whether a significant difference appears in the extent of ER between high-profile industry and low-profile industry companies, parametric independent-sample T tests and non-parametric Mann-Whitney U tests are applied to the data.
It can be seen from Table 8, that the difference in the total number of environmental words between the high-profile and low-profile industries is statistically significant according to the independent-sample T tests (p=0.000).
To alleviate any concern over the non-normality of the distribution of the variables for total income, net profit and total words, Mann-Whitney U tests were also performed, the results being reported in Table 9. The results confirm that the distribution of total environmental words is significantly different between industry types. In other words, industry type has a significant impact on the extent of ER by large Chinese listed companies. However, in order to test these relationships more rigorously, it is necessary to undertake statistical modelling.

Vol. 18, No. 4, December 2012
271
Table 8: Independent-sample T test
Table 9: Results of Mann-Whitney U tests
6.5 Regression results The ARCH regression model is employed with the total amount of environmental words disclosed by sampled companies (Total) being regressed on four independent variables. As outlined in section 3.4, total income is used as measurement of company size, while reported profit is used as a measurement of the company’s profitability. All companies sampled are classified into either high-profile industries or low-profile industries, where in the regression model, 0 refers to a high-profile industry and 1 refers to a low-profile industry. As for the characteristic state-owned or not, 0 represents not-state-owned companies while 1 represents state-owned companies. The following model- is estimated and the results presented in Table 10 below:
Total = β0 + β1 income + β2 netprofit + β3 indtypeno + β4 stateownno (1) Where:
income7 = total income in RMB
netprofit = reported profit in RMB
indtypeno = low profile companies (dummy)
stateownno = state-owned companies (dummy)
The ARCH process (for a single lag model) can be represented as:
7 For representational purposes two explanatory variables, total income and reported profit, which were originally collected in million RMB were rescaled. Both income and netprofit were divided by 10,000.
Income 1.778 54.96 .081 92711.82 52152.35Net profit -.534 89.66 .595 -3543.11 6637.78Total words 5.491 59.38 .000 531.03 96.71
Std. Error Differencet df
g (2-
tailed)Mean
Difference
Income Net profit Total wordsMann-Whitney U 974.00 970.00 547.50Asymp. Sig. (2-tailed) .52 .50 .00Grouping Variable: Industry type
Vol. 18, No. 4, December 2012
272
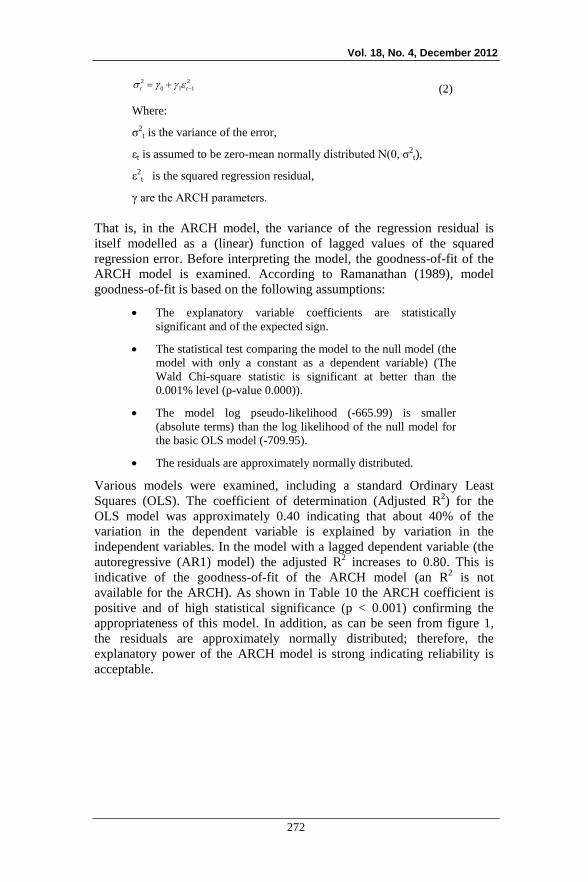
(2)
Where:
σ2t is the variance of the error,
εt is assumed to be zero-mean normally distributed N(0, σ2t),
ε2t is the squared regression residual,
γ are the ARCH parameters.
That is, in the ARCH model, the variance of the regression residual is itself modelled as a (linear) function of lagged values of the squared regression error. Before interpreting the model, the goodness-of-fit of the ARCH model is examined. According to Ramanathan (1989), model goodness-of-fit is based on the following assumptions:
• The explanatory variable coefficients are statistically significant and of the expected sign.
• The statistical test comparing the model to the null model (the model with only a constant as a dependent variable) (The Wald Chi-square statistic is significant at better than the 0.001% level (p-value 0.000)).
• The model log pseudo-likelihood (-665.99) is smaller (absolute terms) than the log likelihood of the null model for the basic OLS model (-709.95).
• The residuals are approximately normally distributed.
Various models were examined, including a standard Ordinary Least Squares (OLS). The coefficient of determination (Adjusted R2) for the OLS model was approximately 0.40 indicating that about 40% of the variation in the dependent variable is explained by variation in the independent variables. In the model with a lagged dependent variable (the autoregressive (AR1) model) the adjusted R2 increases to 0.80. This is indicative of the goodness-of-fit of the ARCH model (an R2 is not available for the ARCH). As shown in Table 10 the ARCH coefficient is positive and of high statistical significance (p < 0.001) confirming the appropriateness of this model. In addition, as can be seen from figure 1, the residuals are approximately normally distributed; therefore, the explanatory power of the ARCH model is strong indicating reliability is acceptable.
2 20 1 1t tσ γ γ ε −= +

Vol. 18, No. 4, December 2012
273
Figure 1: Distribution of residuals – autoregressive (AR1)
heteroskedastic adjustments
As can be seen from Table 10, all regressors included are statistically significant at better than the 1% level, which indicates that all the explanatory variables are highly correlated to the total amount of environmental words. Moreover, all regressors included have the expected sign. Positive coefficients appear for income and netprofit, that is, the larger or the more profitable the companies are, the more ER companies provide. The negative coefficient for indtype indicates that low-profile industrial companies tend to disclose less ER compared to high-profile industry companies. The positive coefficient in stateown indicates that stated-owned companies are likely to provide more ER than non-state-owned. The regression equation can be re-represented by using the results from Table 10 as shown below:
Total = 371.994 + 6.382 income + 19.458 netprofit - 435.321 indtypeno + 178.562 stateownno (3)
Table 10: Regression model – autoregressive (AR1) with heteroskedasticity
Coef. Std. Err. z P>z
income 6.382 0.687 9.29 0.000
netprofit 19.458 7.371 2.64 0.008
indtypeno -435.321 66.455 -6.55 0.000
stateownno 178.562 61.744 2.89 0.004
constant 371.994 49.894 7.46 0.000
ARCH Lag 1.295 0.466 2.78 0.005
Comparing the coefficients, it is evident that industry type makes the strongest unit contribution to total environmental words, followed by

Vol. 18, No. 4, December 2012
274
being a state-owned company. Moreover, it is noted that the explanatory effect of income and netprofit is small, but still significant as the average environmental words provides a low base. Finally, although the correlation between total income and total environmental words is higher than that between reported profit and total environmental words, total income makes less unit contribution to the total environmental words.
In summary, the modelling shows that company size, profitability and industry are significant determinants of environmental disclosure in the sample of reports of Chinese companies. However, industry tends to have greater influence on the extent of ER. In addition, state ownership is revealed to be a very important characteristic in determining the extent of environmental disclosure.
7. Discussion and conclusions By examining the annual reports of the 20 largest Chinese listed companies from 2005 to 2009, this study reveals the following:
First, the study finds that ER by large Chinese listed companies generally increased over the five-year period, which is consistent with previous studies and surveys, and worldwide trends (Guo 2005; KPMG 2008; Gao 2009; Gaoguan Information 2009).
Second, while both the number of companies that disclose ER and the average number of environmental words increased, the number of companies that disclose was found to increase at a much faster rate than the average amount of environmental words. The statistical results show that the average number of environmental words disclosed by large Chinese listed companies ranged from 302 to 553which compares with the top 100 Australia listed companies’ annual reports that have an average number of environmental words of 1545 in 2008 (Rao et al. 2012); ER in large Chinese companies is considerably lower. This finding is similar to previous studies (Sahay 2004; Hossain et al. 2006; Yusoff et al. 2006; Gunawan et al. 2009; Mohammad et al. 2009), which found that ER in developing countries lags that in developed countries, and indicates ER in China is still emerging.
Third, this study found general statements were most often included in annual reports, with declarative statements ranking the highest, and ‘bad news’ being generally omitted. These findings confirm a low quality of ER by Chinese listed companies.
Fourth, various statistical analyses showed that company size and profitability are the determinants of ER made by these large Chinese companies. A larger or more profitable company provides greater quantities of ER. Moreover, ER of high-profile industrial companies surpasses that of low-profile industrial companies. This result mirrors those of previous studies that found larger, more profitable and

Vol. 18, No. 4, December 2012
275
environmentally sensitive companies are likely to provide higher volumes of environmental information (Hackston & Milne 1996).
Most importantly, results show state-ownership is a major determinant of disclosures. The regression model indicates that being a state-owned company increases the amount of environmental disclosure by about 180 words on average. While company size, profitability, state-ownership and industry are all significantly related to the level of ER, state ownership has a very strong impact on ER, with the coefficient for state ownership, 178.56, being considerably larger than the coefficients for income (6.38) and net profit (19.45).
In addition to these findings, this study also shows that more Chinese listed companies have started to issue CSR reports, which is a sign that the companies are beginning to perform in more advanced ways in ER. This finding recognises the long held view that the annual report may no longer capture all ER (Unerman 2000). Also, this finding suggests future research is needed to establish whether ER across the two disclosure media (and possibly other media such as newspapers) differs.
7.1 Implications
The Chinese Government’s emphasis on environmental issues appears to be having the desired effect as ER is increasing, even though there is still some way to go for Chinese companies to reach the reporting standards of Western countries such as Australia.
Legitimacy theory has frequently been used to explain ER practices in developed countries (Guthrie & Parker 1989; O’Donovan 2002), arguing that there is a legitimacy gap between companies’ actual behaviour and the public’s expectations, and in order to maintain continuous survival, companies will keep adjusting their behaviour to minimise the gap (Deegan 2006). The results showed that ER in China is general is declarative in nature with bad news being ignored, which indicates that ER made by Chinese listed companies is not comprehensive or reliable and portrays a partial image. Therefore, reports may mislead the impression of the real environmental reporting and impacts of companies and so it appears Chinese companies’ ER appears to be a device to maintain their legitimacy. Larger, more profitable or high-profile industrial companies have greater impact on the environment, and are easier to target. The study found that sampled larger, more profitable or high-profile industrial companies have greater volumes of ER. This finding further supports the implication that ER can be seen as a legitimacy device rather than an accountability mechanism. Facing pressure from stakeholders, companies may increase volume of disclosure in ERs to legitimate their environmental activities, to deflect attention away from environmental concerns, or to influence perception of their performance, particularly in the eyes of government. This may however, be mitigated by the fact that

Vol. 18, No. 4, December 2012
276
high profile industrial companies may face more regulatory requirements, although the study showed very little compliance-related disclosures.
In addition, stakeholder theory may also explain aspects of the findings. managerial stakeholder theory suggests that powerful stakeholders’ needs are fulfilled first, since they have greater impacts on companies’ survival (Deegan 2006). In China, the most powerful stakeholder in promoting companies to disclose environmental information seems to be the government. The result of the ARCH model shows that being a state-owned company increases total ER by about 180 words, indicating more ER was produced by state-owned companies. As discussed earlier, although there are no comprehensive laws and regulations that mandate Chinese companies to disclose environmental information, there is a nationwide policy that promotes a green economy. For a state-owned company, the national policy may exert stronger stakeholder pressure than laws and regulations.
The results of the study also show that there was an increase from 8 to 14 between 2005 and 2006, in the number of companies that disclosed environmental information, and the average environmental words went from 302 to 451. The year 2006 was the first in which the eleventh five-year-plan was implemented, and building a green economy is the plan’s major theme, with a target to reduce energy consumption per unit of gross domestic product (GDP) by 20%, and to reduce SO2 and COD emissions by 10% from 2005 levels by 2010 (Chinese Central Government 2006). Therefore, it is not surprising that an increase in volume of words reported occurred in the period. The results are consistent with the view that the government plays a role in motivating Chinese companies to adopt and build environmental disclosure.
Finally, during the analysis of the content of environmental disclosure in the sample of Chinese companies, it was found that energy saving and emissions reduction are the predominant issues. Energy saving and emissions reduction are also major elements of the eleventh five-year-plan, therefore, companies are likely to try to impress the government and show how they strive to reach these targets. Again, this provides confirmatory evidence that the government significantly influences Chinese ER.
7.2 Conclusions and further research This study provides an early attempt to reveal the extent of adoption of ER among a set of large Chinese listed companies. The study found that overall ER has developed very quickly, but is still at an emergent stage. The determinants of disclosure, including company size, profitability and industry, which have been found to be significant in the ER literature on developed countries, are also evident in China. In addition, state ownership is found to be a very important determinant supporting stakeholder influence.

Vol. 18, No. 4, December 2012
277
The major contribution of this study to the literature on ER is the evidence of the role of the state in influencing company practices. In a centralised, command economy, the state has a great deal of influence without needing to mandate or regulate firm practices. The impact of state government control is shown to be strong, and is an important area for further research.
References
Adams, C & Zutshi, A 2004, ‘Corporate social responsibility: why business should act responsibly and be accountable’, Australian Accounting Review, vol. 14, pp. 31–40.
Al-Tuwaijri, AS, Christensen, ET, & Hughes, EK 2004, ‘The relations among environmental disclosure, environmental performance and economic performance: a simultaneous equations approach’, Accounting, Organizations and Society, vol. 29, no. 5/6, pp. 447–471.
Bansal, P & Roth, K 2000, 'Why companies go green: a model of ecological responsiveness.' Academy of Management Journal, vol. 43, no. 4, pp. 717–736.
Brown, N & Deegan, C 1998, ‘The public disclosure of environmental performance information – a dual test of media agenda setting theory and legitimacy theory’, Accounting and Business Reseach, vol. 29, pp. 21–42
Bryman, A & Bell, E 2007, In Business Research Methods, Oxford University Press Inc., New York.
Campbell, D, Craven, B & Shrives, P 2003, ‘Voluntary social reporting in three FTSE sectors: a comment on perception and legitimacy’, Accounting, Auditing and Accountability Journal, vol. 16, no. 4, pp. 558– 581.
China Construction Bank Corporation 2009 Annual Report, CCBC, China.
China Petroleum & Chemical Corporation 2009 Annual Report, CPCC, China.
China Railway Group Limited 2009 Annual Report, CRGL, China.
China Shenhua Energy Company Limited 2009 Annual Report, CSECL, China
Chinese Central Government 2006, The 11th Five-year Plans of People's Republic of China (Translation), Beijing, viewed 20 August 2009, <http://news.xinhuanet.com/misc/2006-03/16/content_4309517_1.htm>.
Cowen, SS, Ferreri, LB & Parker, LD 1987, ‘The impact of corportate characteristics on social responsibility disclosure: a typology and frequency-based analysis’, Accounting, Organizations and Society, vol. 12, no. 2, pp. 111–122.

Vol. 18, No. 4, December 2012
278
Cox, CA & Douthett, EB, Jr. 2009, ‘Further evidence on the factors and valuation associated with the level of environmental liability, Academy of Accounting and Financial Studies Journal, vol. 13, no. 3, p. 1–26.
Damak-Ayadi, S 2010, ‘Social and environmental reporting in the annual reports of large companies in Frances’, Accounting and Management Information System, vol. 9, no. 1, pp. 22-44.
Deegan, C 2006a, Financial Accounting Theory, McGraw-Hill, Sydney.
Deegan, C, Rankin, M & Tobin, J 2002, ‘An examination of the corporate social and environmental disclosures of BHP from 1983-1997: a test of legitimacy theory’, Accounting, Auditing and Accountability Journal, vol. 15, no. 3, pp. 312–343.
Deegan, C 2002, ‘The legitimising effect of social and environmental disclosures - a theoretical foundation’, Accounting, Auditing and Accountability Journal, vol. 15, no. 3, pp. 282–311.
Deegan, C, Rankin, M & Voght, P 2000, ‘Firms’ disclosure reactions to major social incidents: Australia evidence’, Accounting Forum, vol. 24, no. 1, pp. 101–130.
Dowling, J & Pfeffer, J 1975, ‘Organizational legitimacy: social values and organizational behaviour’, Pacific Sociological Review, vol. 18, no. 1, pp. 122–136.
Ernst & Ernst 1979, Social responsibility disclosure 1978 Survey, Ernst and Ernst, Cleveland, Ohio.
Freedman, M, & Jaggi, B 2005, ‘Global warning, commitment to the Kyoto protocol, and accounting disclosures by the largest global public firms from polluting industries’, The International Journal of Accounting, vol. 40, pp. 215–232.
Gao, Y 2009, ‘Corporate social performance in China: evidence from large companies’, Journal of Business Ethics, vol. 89, pp. 23–35.
Gao, Y 2011, ‘CSR in an emerging country: a content analysis of CSR reports of listed companies’, Baltic Journal of Management, vol. 6, no. 2, pp. 263–291.
Gaoguan Information 2009, The sixty years of corporate social responsibility in China (Translation), report edited by Gaoguan Information, published by Xinhua News, Beijing.
Gibson, K & O’Donovan, G 2007, ‘Corportate governance and environmental reporting: an Australian study’, Corportate governance, vol. 15, no. 5, pp. 944–956.
Gray, R, Kouhy, R & Lavers, S 1995, ‘Corporate social and environmental reporting: a review of the literature and a longitudinal study of Uk

Vol. 18, No. 4, December 2012
279
disclosure’, Accounting, Auditing and Accountability Journal, vol. 8, pp. 47–77.
Gray, R, Owen, D & Adams, CA 1996, Accounting and Accountability: Changes and Challenges in Corporate Social and Environmental Reporting, Prentice Hall, London.
Gunawan, J, Djajadikerta, H & Smith, M 2009, ‘An examination of corporate social disclosures in the annual reports of Indonesian listed companies’, Journal of The Asia-Pacific Centre for Environmental Accountability, vol. 15, no. 2, pp. 13–34.
Guo, P 2005, Corporate Environmental Reporting and Disclosure in China, CSR Asia, Tsinghua University, viewed 5 March 2009, <http://www.csr-asia.com/upload/environmentalreporting.pdf>.
Guthrie, J & Parker, LD 1990, ‘Corporate social disclosure practice: a comparative international analysis’, Advances in Public Interest Accounting, vol. 3, pp. 159–175.
Guthrie, J & Parker, LD 1989, ‘Corporate social reporting: a rebuttal of legitimacy theory’, Accounting and Business Research, vol. 19, no. 76, pp. 343–352.
Hackston, D & Milne, MJ 1996, ‘Some determinants of social an environmental disclosures in New Zealand companies’, Accounting, Auditing and Accountability Journal, vol. 9, no. 1, pp. 77–108.
Hossain, M, Islam, K & Andrew, J 2006, ‘Corporate social and environmental disclosure in developing countries: evidence from Bangladesh’, The Asian Pacic Conference on International Accounting Issues, pp. 1–22.
Hu, Z & Khan, MS 1997, Why is China growing so fast?, IMF, Washington DC, (Economic issues, no. 8).
Hybels, RC 1995, ‘On legitimacy, legitimation, and organizations: a critical review and integrative theoretical model’, Best Paper Proceedings of the Academy of Management, pp. 241–245.
Kaplan, SE & Ruland, RG 1991, ‘Positive theory, rationality and accounting regulation’, Critical Perspectives on Accounting, vol. 2, pp. 361–374.
KPMG 2008, Sustainable Reporting: A Guide in China, KPMG International, Australia.
Krippendorff, K 1980, Content Analysis: An Introduction to Its Methodology, Sage Publications Ltd, London.
Li, J 2004, ‘Research on social responsibility information disclosures of Chinese enterprises’ (Translation), Journal of Wuhan University of Science and Technology, vol. 3, pp. 8–13.

Vol. 18, No. 4, December 2012
280
Li, JF & Xiao, H 2002, ‘The status quo, demand and future of enviromental reporting in Chinese enterprises’ (Translation), Accounting Research, no. 4, pp. 42–51.
Lindblom, CK 1994,. ‘The implications of organizational legitimacy for corporate social performance and disclosure’, Critical Perspectives on Accounting Conference, New York.
Lu, YJ 2008, ‘A study of environmental disclosures made by Chinese mineral extraction corporations’, Master thesis, University of Wollongong, Wollongong.
Mathews, MR 1997, ‘Twenty-five years of social and environmental accounting research - is there a silver jubilee to celebrate?’, Accounting, Auditing and Accountability Journal, vol. 10, no. 4, pp. 481–531.
Milne, MJ, & Patten, DM 2002, ‘Securing organizational legitimacy: an experimental decision case examining the impact of environmental disclosures’, Accounting, Auditing and Accountability Journal, vol. 15, no. 3, pp. 372–405.
Mohammad, A, Shaila, A & Shahidul, I 2009, ‘Corporate social responsibility reporting: illustrations from a less-developed country’, Journal of the Asia- Pacific Centre for Environmental Accountability, vol. 15, no. 2, pp. 2–12.
Moon, J & Shen, X 2010, ‘CSR in China research: salience, focus and nature’, Journal of Business Ethics, vol. 94, no. 4, pp. 613–629.
Neu, D, Warsame, H & Pedwell, K 1998, ‘Managing public impressions: environmental disclosures in annual reports’, Accounting, Organizations and Society, vol. 25, no. 3, pp. 265–282.
Nurhayati, R, Brown, A & Tower, G 2006, ‘Understanding the level of nutural environment disclosures by Indonesian listed companies’, Journal of the Asia Pacific Centre for environmental accountability, vol. 12, no. 8, pp. 4–11.
O’Donovan, G 2002, ‘Environmental disclosures in the annual report: extending the applicability and predictive power of legitimacy theory’, Accounting, Auditing and Accountability Journal, vol. 15, no. 3, pp. 344–371.
Parker, LD 1986, ‘Polemical themes in social accounting: scenario for standards setting’, Advances in Public Interest Accounting, vol. 1, pp. 67–93.
Patten, D. 2005, ‘The relation between environmental performance and environmental disclosure: a research note’, Accounting, Organizations and Society, vol. 27, pp. 763–773.
Ramanathan, R 1989, Introductory Econometrics, Harcourt Brace Jovanovich Inc., Orlando.

Vol. 18, No. 4, December 2012
281
Rao K, Tilt, CA & Lester, LH 2012, ‘Corporate governance and environmental reporting: an Australian study’, Corporate Governance, vol. 12, no. 2, pp.143–163.
Roberts, RW 1992, ‘Determinants of corporate social responsibility disclosure: an application of stakeholder theory’, Accounting, Organizations and Society, vol. 17, no. 6, pp. 595–612.
Sahay, A 2004, ‘Environmental reporting by Indian corporations’, Corporate Social Responsibility and Environmental Management, vol. 11, pp. 12–22.
Song, X & Li, J 1992, Accounting for Social Responsibility (Translation), China Financial Economics Publisher, Beijing.
Tilling, MV & Tilt, CA 2010, ‘The edge of legitimacy: voluntary social and environmental reporting in Rothmans’ 1956 – 1999 annual reports’, Accounting, Auditing and Accountability Journal, vol. 23, no.1, pp. 55–81.
Tilt, CA 2001, ‘The content and disclosure of Australian corporate environmental policies’, Accounting, Auditing and Accountability Journal, vol. 14, no. 2, pp. 190–212.
Trotman, KT & Bradley, GW 1981, ‘Associations between social responsibility disclosure and characteristics of companies’, Accounting, Organizations and Society, vol. 6, pp. 355–362.
University of Amsterdam & KPMG Global Sustainability ServicesTM
2005, KPMG International Survey of Corporate Responsibility Reporting 2005, KPMG Global Sustainability ServicesTM, Amsterdam.
Xiao, SF & Hu, W 2005, ‘A study on environmental information disclosure system of Chinese enterprises’ (Translation), Accounting Research, vol. 3, pp. 47–52.
Xiao, SF & Mi, HY 2004, ‘Analysis on the Survey of Enterprises’ Environmental Protection and Accounting - Views on Necessity and Feasibility of Etablishing Environmental Accounting in China’ (Translation), Green China, vol. 22, pp. 51–54.
Xinhua News 2005, ‘What is a harmonious society?’ (Translation), viewed 20 August 2009, <http://news.xinhuanet.com/english/2005-03/21/content_5278045.htm>.
Yusoff, H, Lehman, G & Nasir, NM 2006, ‘Environmental engagements through the lens of disclosure practices: a Malaysian story’, Asian Review of Accounting, vol. 14, no. 1/2, pp. 122–148.
Zhang, J, Guo, H, Li, B & Wang, W 2009, ‘The influence of financial factors on environmental information disclosure in China chemical industry’, International journal of global environmental issues, vol. 9, no. 3, pp. 272–286.

Vol. 18, No. 4, December 2012
282
Zhang, S 1993, ‘Relation between economic development and corporate social accountability’ (Translation), China Agriculture Accounting, vol. 2, viewed 10 June, 2009, < http://mall.cnki.net/magazine/Article/ZNKJ199302003.htm>.
Zhu, JF & Xue, HF 2007, ‘Research on environmental accounting in China: history, status quo and future’ (Translation), Journal of Modern Accounting and Auditing, vol. 3, no. 1, pp. 41–46.
Zissis, C & Bajoria, J 2008, ‘China’s environmental crisis’, viewed 7 April 2009, <http://www.cfr.org/publication/12608/>.

Vol. 18, No. 4, December 2012
283
Appendix 1: Definitions of sub-categories Themes: Environmental protection • Pollution control in the conduct of the business operations. • Statements indicating that the company’s operations are non-
polluting. • Statements indicating that pollution from operations has been or will
be reduced. • Air emission information. • Noise information. • Water discharge information. • Solid waste disposal information. • Research aim to reduce environmental pollution. • Supporting anti-litter campaigns. • Prevention or repair of damage to the environment resulting from
processing or natural resources. • Any information on land care and improvements done for the purpose
of sustaining the environment and nature. • Installation of effluent treatment plant. • Land reclamation and forestation programmes. • Land, water and forest protection. • Raw materials conservation. • Recycling plant of waste products. • Using recycled materials. • Efficiently using materials resources in the manufacturing process. • Minimizing wastage and preventing wastes. • Conservation of energy in the conduct of business operations. • Using energy more efficiently during the manufacturing process. • Utilizing waste materials for energy production. • Disclosing energy savings resulting from product recycling. • Discussing the company’s efforts to reduce energy consumption. • Disclosing increased energy efficiency of products. • Research aimed at improving energy efficiency of products. • Receiving an award for an energy conservation programme. General statements • Any statement of company’s philosophy and the background to all of
their activities that affect the environment. • Any information on company’s environmental policy, objectives,
commitments, aims and goals on future environmental undertakings or improvements.
• Environmental awareness.

Vol. 18, No. 4, December 2012
284
Environmental financial information • Past, current and future estimated expenditures or operating cost for
environment. • Financing and investment for environment. • Tax information for environment. • Fines. Compliance • Any information on the stewardships, benchmarking and compliance
of various environmental or company acts, regulations. • Any information on avoiding damages or violation of various
environmental or company acts, regulations. • Any information such as court cases, compounds regarding
misconduct of operations that describe violation of environment or violation of various environmental acts and/or laws.
• Any information on the stewardships, benchmarking and compliance of various environmental guidelines (for example, Global Reporting Initiatives).
• Any information include memberships or relationships with ‘green’ groups including government bodies, NGOs and other corporate bodies.
Environmental risk • Any statement concern about insurance related to environment. • Any current and potential impact from environmental regulations and
policies. • Any current and potential effect on company’s financial situation
from environment. Corporate governance • Any statement about corporate governance that related to
environment. Such as HSE system, EMS system and the Safety Health and Environment Committee.
Others • Environmental audit. • Environmental donation. • Environmental end products and services. • Environment educations. Evidence: Non-monetary quantitative • Any statements which are quantitative, but not in monetary form, like
how many emission have been reduced.

Vol. 18, No. 4, December 2012
285
Monetary quantitative • Any statements which are quantitative and in monetary form, like how
much has been spent to reduce the emission. Declarative • Any statements with no quantity expression. News type: Good news • Any positive impact of environment, like avoiding pollution, receive
environmental awards. Bad news • Any negative impact of environment, like fines of exceeding the
discharge limit, violating environmental regulations. Neutral • Any statements which are neither good news nor bad news, like the
illustration of company’s environmental policy.

Vol. 18, No. 4, December 2012
286
Appendix 2: Coding Rules • Headings are not counted;
• Graphs, charts, tables and pictures are excluded;
• Repeated disclosures are counted each time they appear;
• Financial statements are counted, and one line is the equivalent of one sentence, and coded in the category: ‘environmental financial information’;
• Notes below financial statements are counted and coded in category: ‘environmental financial statements’;
• The entire sentence is included in the word count if the sentence is relevant to environmental disclosure;
• Only the statements that specifically describe a company’s environmental activities will be recorded into the category: ‘environment protection’. General information such as a company’s commitment to save energy and reduce emissions is recorded into the category: ‘general statements’;
• All statements about environmental risk are counted as neutral;
• Any information that refers to increasing loans to green industries and decreasing loans to non-green industries is counted as ‘other – end product and services’.