Embed Size (px)
Citation preview

February 2009McKinsey & Company
China’s Green Revolution: Prioritizing Technologies to Achieve Energy and Environmental Sustainability

1
PROJECT BACKGROUND
Objective: Develop a comprehensive, objective, and consistent fact base to inform economically sensible and environmentally sustainable approaches for meeting China’s energy and resource growth requirements
Not intended to advocate specific policies or approaches. All content and conclusions remain solely the responsibility of McKinsey & Company

2
ABOUT THIS REPORT
What it does... What it does NOT do...
• Evaluate the technical potential of 200+ energy efficiency, clean energy and carbon management technologies
• Evaluate and prioritize abatementmeasures in 5 sectors – buildings,power, transportation, emission-intensive industries, agriculture/forestry
• Consider ONLY technology-related costs
• Incorporate input from several leading authorities
• Provide a realistic forecast • Lay out specific action plans for
China
• Recommend specific abatement targets
• Consider social costs (e.g., unemployment), taxes, transaction costs, etc.
• Draw only from McKinsey sources

3
CHINA IS EXPECTED TO SEE STRONG GDP GROWTH AND CONTINUED URBANIZATION IN THE NEXT TWO DECADES…
* Exchange rate in 2005 EUR1 = RMB10.1953Source: Expert interview; McKinsey analysis
China populationBillions
China GDP*EUR Billions, 2005 real
11,936
6,359
2,8911,803
2030
9.9%
6.5%
8.2%
202005 10
0.7 0.7 0.6 0.5
0.6
1.3
0.7
2005
1.3
2010
1.4
0.8 1.0
1.5
2030
Urban
Rural
Exhibit 5

4
… DRIVING UP DEMAND FOR BUILDING FLOOR SPACE, VEHICLES AND BASIC MATERIALS
Source: China industry year books; McKinsey analysis
9
10
6
2
19
Heavy dutyMedium duty
Light duty
12.6%
6.3%
31
25
152
182
37
291
337
Vehicle fleet Millions
1424
5
37
42
55
68
66
91
Commercial
Residential
3.3%
2.9%
Total floor space Billion sq. m
755755
355
2005 20 2030
Steel demandMegatons
2030
1,630
20
1,750
2005
1,069
Cement demandMegatons
Exhibit 6

5
THE CHINESE GOVERNMENT HAS RECOGNIZED THE CHALLENGES … AND IS TAKING ACTIONS
• Target 20% reduction in energy intensity per unit of GDP in 2006-2010
• Initiated “1000 Top Enterprise Energy Saving Project” to monitor energy
efficiency performance of the most energy intensive enterprises
• Shut-down and consolidated sub-scale, inefficient capacity in energy-intensive
industries
• Implemented energy efficiency standards for automobiles, buildings, and
appliances
• Cut taxes on small cars
• Invested in grid efficiency and efficient power plants
• Invested in renewable energy
• Enacted Renewable Energy Law
• Enacted Recycling Economy Law to encourage recycling of industrial waste
Recent energy efficiency policies in China
Source: McKinsey analysis

6
CURRENT POLICIES AND PLANS EXPECTED TO SUSTAIN 5% ANNUAL CARBON EFFICIENCY IMPROVEMENT IN THE “BASELINE SCENARIO”...
-1.4
1.3
1.7
2.7
4.9
4.8China baseline forecast
China
Germany
United States
India
Indonesia 4.4
6.0
3.0
1.6
10.1
7.8
Source: IEA; expert interview; McKinsey analysis
China 1990-2005China 2005-2030
Others 1990-2005
GDP growth ratePercent
GDP carbon efficiency improvementPercent

7* The U.S. and Canada
Source: McKinsey analysis
6.82005 Emissions
16.1Frozen technologyemissions growth
22.92030 frozen technologyemissions
8.4Baseline reduction
2030 baseline emissions 14.5
-37%
7.32005 Emissions
3.6Frozen technologyemissions growth
10.92030 frozen technologyemissions
1.7Baseline reduction
2030 baseline emissions 9.2
-16%
Baseline emissions reduction -North America*Giga tons of CO2e
Baseline emissions reduction -ChinaGiga tons of CO2e
...DRIVING “BASELINE EMISSIONS” 40% LOWER THAN THE “FROZEN TECHNOLOGY” SCENARIO, A BIGGER REDUCTION THAN IN NORTH AMERICA
8
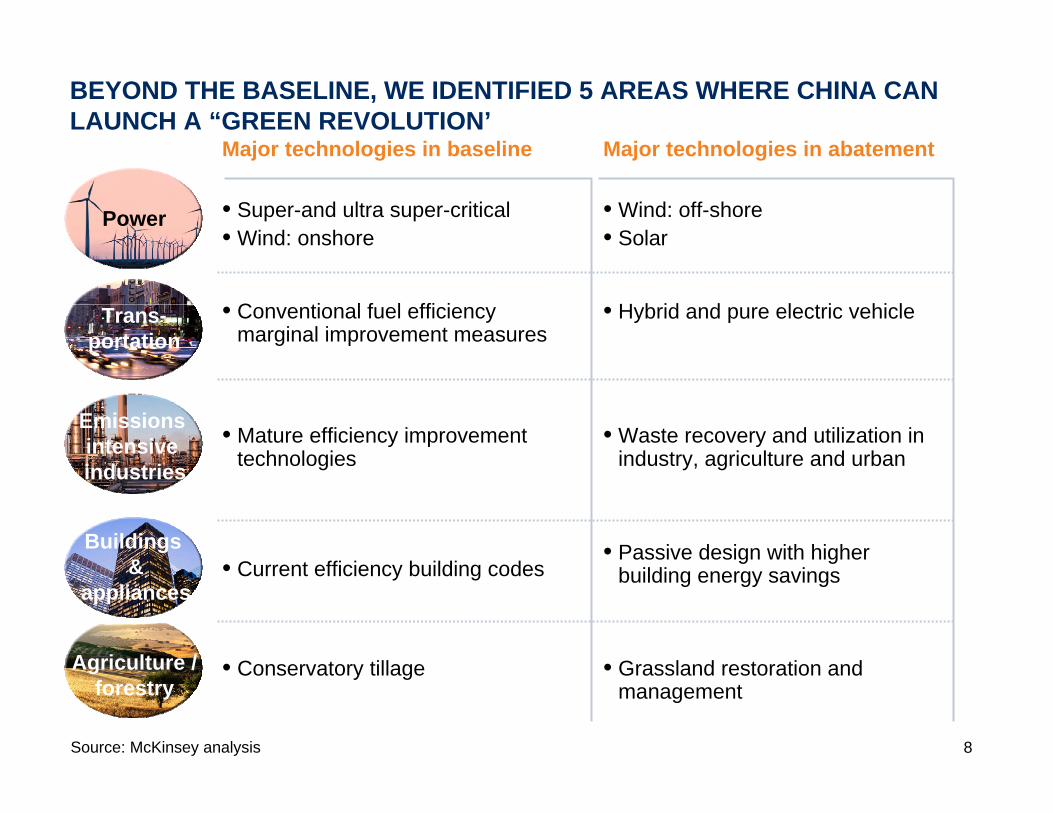
BEYOND THE BASELINE, WE IDENTIFIED 5 AREAS WHERE CHINA CAN LAUNCH A “GREEN REVOLUTION’
Major technologies in baseline Major technologies in abatement
Power
Trans-portation
Emissions intensive industries
Buildings &
appliances
Agriculture /forestry
• Super-and ultra super-critical• Wind: onshore
• Wind: off-shore• Solar
• Conventional fuel efficiency marginal improvement measures
• Hybrid and pure electric vehicle
• Current efficiency building codes• Passive design with higher
building energy savings
• Mature efficiency improvement technologies
• Waste recovery and utilization in industry, agriculture and urban
• Conservatory tillage • Grassland restoration and management
Source: McKinsey analysis

9
1. GREEN POWER IN CHINA: COAL COULD BE REPLACED BY NUCLEAR, HYDRO AND RENEWABLES AS THE PRIMARY SOURCE OF POWER
8
12
16
7
8
16
17
198165
34
1000
812
2,500
2005
20
9,250
2030 baseline
4
8,100
2030 abatement scenario
Coal
Hydro
Gas
Nuclear
WindSolarOthers*
100% =
* Including geothermal, CBM, MSW, LFG and biomassSource: Expert interview; literature research; McKinsey analysis
Generation ProjectionTWh, per cent

10
100% =
1. US CASE: SIMILAR TREND IN THE US POWER MIX
* Includes oil, geothermal, municipal solid waste, and pumped storageSource: U.S. EIA Annual Energy Outlook (2007), McKinsey analysis
2320 17
241714
9
5260
42
983
2030 baseline
1
3,865
2005
Coal
2030 abatement scenario
2
Gas
Nuclear
All renewables
Others*
100% = 5,385 4,135
Generation ProjectionTWh, per cent

11
* Generation cost includes amortized capital at 4% risk free discount rate, OPEX and fuel expenses, and excludes tax, subsidy, etc.** Learning rate is applied to global capacity built-up, as China is likely to be the world exporter for wind and solar equipments
Source: China solar association; Huangneng Group; Tsinghua Univ; SERC; McKinsey analysis
0.031Coal
0.035Nuclear
0.056Wind (strong)
0.170Solar PV(strong)
Grid parity
0.030
0.033
Grid parity
0.044
0.038
20052030 abatement scenario
Generation cost*EUR/KWh
1. GREEN POWER IN CHINA: GENERATION COST FOR CLEAN TECHNOLOGIES COULD DROP TO COMPARABLE LEVELS OF COAL

12
2. GREEN FLEET IN CHINA:EV TECHNOLOGIES CAN BREAK THE RELIANCE ON IMPORTED OIL
0
1.6
4.8
5.2
7.4 0
3,600
1,600
1,500
950
7
9
13
14
20
Exhibit 30
• Japan
• Europe, US, Japan
• China shows potential to be technology leader
Base vehicle
Max ICE improvement bundle
Full hybrid
Plug-in hybrid
Pure electric vehicle
Additional investmentEUR/vehicle
Well-to-wheel emission*Kg CO2e/100 Km
Gasoline consumptionLiter/100 Km
Country technology leadership
* Emission is calculated based on 2030 power mix assumed in our baseline, where coal power share is 65 percent** Pure electric vehicle electricity consumption 9 KWh/100 Km, plant to battery efficiency 85%; Battery-to-wheel
efficiency 81%; hybrid car with 66 percent electric shareSource: DRIVE; expert interview; McKinsey analysis

13
2. GREEN FLEET IN CHINA: OIL SAVINGS DEPENDS ON HOW FAST EVSROLL OUT
Total gasoline consumption in 2030Megatons, assuming EV penetration in new cars reach 100% in 5 years after starting point
2030…2016 2021Starting year of massive EV deployment
PEV penetration in passenger car fleetPercent
91
63
0
Source: McKinsey analysis
73
136
250
Exhibit 33
14
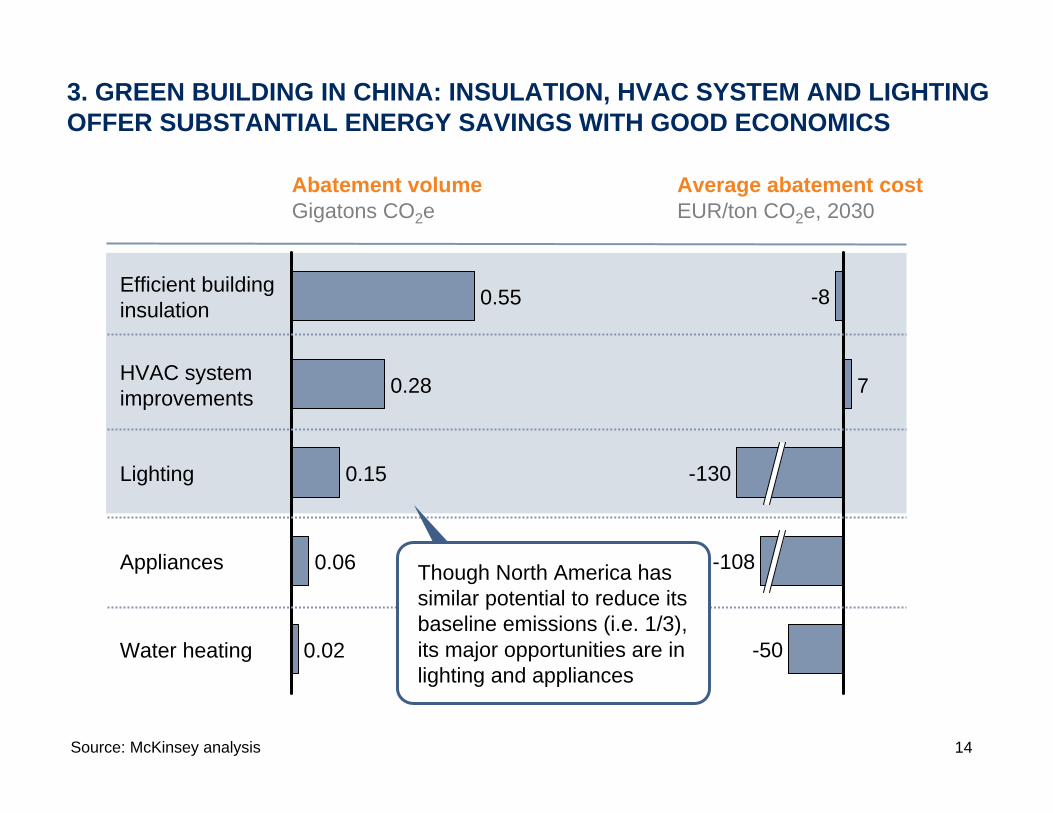
3. GREEN BUILDING IN CHINA: INSULATION, HVAC SYSTEM AND LIGHTINGOFFER SUBSTANTIAL ENERGY SAVINGS WITH GOOD ECONOMICS
0.55Efficient building insulation
0.28HVAC systemimprovements
0.15Lighting
0.06Appliances
0.02Water heating
7
-50
-8
-130
-108
图24
Average abatement costEUR/ton CO2e, 2030
Abatement volumeGigatons CO2e
Source: McKinsey analysis
Though North America has similar potential to reduce its baseline emissions (i.e. 1/3), its major opportunities are in lighting and appliances

15
3. GREEN BUILDING IN CHINA: ENERGY EFFICIENT BUILDING INSULATIONCOULD BE APPLIED TO 2/3 OF FLOOR SPACE BY 2030
* Majority will be floor space in rural areasSource: McKinsey analysis
4838
15
32
18
10
03050
2010
1
12
67
2020 2030
91
31
Passive designCompliance of current building codes
Economic retrofit
Inadequate insulation*
Penetration of energy efficient building insulation technologies, abatement scenario
Billion square meters, 2030
Energy efficiency building insulation technologies

16
0.84
0.39
0.34
~1.6
PotentialGiga tons CO2e Key technologies
4. GREEN INDUSTRY IN CHINA: ON TOP OF ENERGY EFFICIENCY, WASTE RECOVERY PRESENTS A SIZEABLE ABATEMENT OPPORTUNITY
图38
• Steel– CCPP– CMC
• Coal bed methane utilization
• Municipal waste management
• CCS• Relocating steel
production to Australia for NG-based DRI
• Clinker substitution• Agriculture waste
utilization
• Chemical – Process automation – Catalyst optimization
• Switching from coal-based ammonia production to NG-based
CCS and others
Total
Energy efficiency
By-product and waste recovering
Source: McKinsey analysis

17
5. GREEN ECO-SYSTEM IN CHINA: RESTORING AND EXPANDING FORESTS AND GRASSLANDS
23
5
57
-20
-41
28
0.64
-10
0.34
0.02
0.08
0.07
0.06
0.04
0.04
图54
Forestry
Agriculture
Grassland management &restoration
Fertilizermanagement
Afforestation &reforestation
Livestockmanagement
Croplandmanagement &restoration
Forestmanagement
Total
Methane utilization
PotentialGigatons CO2e
Average abatement cost EUR/ton CO2e
Source: McKinsey analysis

18
GREEN MINDSET IN CHINA: SMALL CHANGES TO CONSUMER BEHAVIOR + DENSER URBAN PLANNING = ADDITIONAL ABATEMENT
0.67
0.10Lower heatingtemperature
0.15Efficient usage ofprivate cars
0.02Better managementof appliances
Total
More high-rise buildings 0.10
Drive less 0.20
Change fromruminant to non-ruminant animals
0.10
Source: China Building Energy Efficiency Annual Report; NSB; expert interview; McKinsey analysis
Abatement potentialGigatons CO2e
+
Behaviorchange
Urbanplanning
Exhibit 19

19
FULL APPLICATION OF THESE TECHNOLOGIES COULD BRING A “GREEN REVOLUTION” FOR BOTH CHINA AND NORTH AMERICA
Abatement potential of China vs. baselineGiga tons CO2e
Abatement potential of North Americavs. baselineGiga tons CO2e
Source: McKinsey analysis
14.52030 baselinescenarioemissions
6.7Technicalabatementpotential
7.82030 abatement scenarioemissions
-46%
9.22030 baselinescenarioemissions
5.1Technicalabatementpotential
4.12030 abatement scenarioemissions
-55%
20
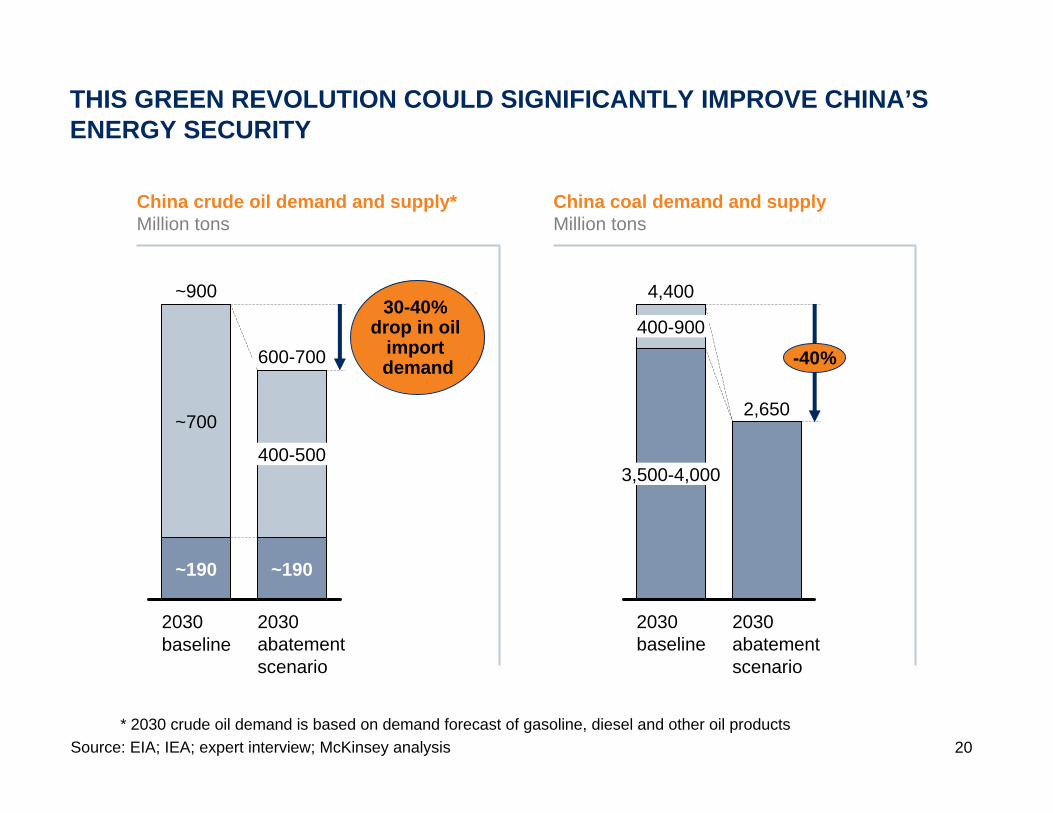
THIS GREEN REVOLUTION COULD SIGNIFICANTLY IMPROVE CHINA’S ENERGY SECURITY
* 2030 crude oil demand is based on demand forecast of gasoline, diesel and other oil productsSource: EIA; IEA; expert interview; McKinsey analysis
Exhibit 18
China crude oil demand and supply*Million tons
~700
~190
~900
2030 baseline
400-500
~190
2030 abatement scenario
600-700
30-40% drop in oil
import demand
400-900
3,500-4,000
4,400
2030 baseline
2030 abatement scenario
2,650
-40%
China coal demand and supplyMillion tons

21
300
240
145
35
Average150~200
2011-2015 2016-2020 2021-2025 2026-2030
ON AVERAGE EUR 150-200 BILLION WILL BE NEEDED IN ADDITIONAL ANNUAL INVESTMENT TO COMPREHENSIVELY IMPLEMENT THE TECHNOLOGIES
Source: McKinsey analysis
Incremental capital needed to capture the technical potentialReal 2005 EUR billions, annual average of each 5-year period
Exhibit 15

22
JUST A FIVE-YEAR DELAY COULD REDUCE ABATEMENT POTENTIAL BY ONE-THIRD
图16
1.4
1.6
0.6
0.5
0.6
Power
0.7
0.4
2030 reduced abatement
1.3
Building
0.2
Industry
0.2
1.1
Transportation
Industry
Forestry & agriculture
0.1 4.4
Power
Building
2.8
Others
6.7
0.4
2030 totalabatement
1.5
Trans-portation
-35%
Loss of abatement potential due to 5-year delay of technology implementationGigatons CO2e
Loss of abatement due to5-year implementation delay
Power
Building
Source: McKinsey analysis
23
IN SUM…
• Current policies will deliver real impact
• Additional reductions are possible and significant...
• ...which will deliver both environmental and energy security benefits
• However, investments needed are very large
• And decisions need to be made soon