Embed Size (px)
Citation preview

-0-

-1-
AGENDA
Foreword
History
Country Profile
China Economic Indicators
International Comparison
Conclusions
Implications
About THE BEIJING AXIS
Disclaimer

-2-
In the same manner that a compass highlights the cardinal points of north, south, east, and west, The China Compass is intended to serve as a navigational instrument for determining China’s position and direction in the context of the world’s economic landscape. As such, by closely examining China’s relevance, importance and progressive integration with the world economy, The China Compass is a knowledge tool for executives with a China agenda.
The growth of China’s economy is without precedent and its rise has been a unique and complex experience – requiring the adoption of a customised and dedicated planning approach. Although many MNCs are already active in China, access to reliable information and channels of strategic knowledge are not always easy to come by and are, more often than not, the product of a long-term investment in research, analysis and strategic thinking. It is against this background that this publication aims to make a modest contribution as a desk reference.
The China Compass, in presentation format, outlines China’s past and present, combining basic country data with a detailed analysis of a wide range of macroeconomic and social information. It offers a concise, yet reasonably comprehensive, high-level picture of the ever-changing and evolving Chinese landscape.
We trust that The China Compass will be useful for those that are in a planning process, and that it will shed light on the past development and future prospects of an engrossing, ongoing and uniquely Chinese story of human development.
As always, we welcome all feedback.
Kobus van der WathFounder & Group Managing DirectorTHE BEIJING AXISChina Business SolutionsStrategy I Sourcing I [email protected]

-3-
0%
10%
20%
30%
40%
50%
60%
70%
80%
90%
100%
World GDP2008
World GDP2008
DevelopingCountriesGDP 2008
China GDP2008
China GDP2008
China GDP2008
China GDP2008
China GDP2008
Source: IMF; China Statistical Yearbook; THE BEIJING AXIS Analysis
Russia
UK
SpainBrazil
Others
France
Italy
GermanyHenan
Zhejiang
HebeiShanghai
HubeiSichuanLiaoning
Others
Developed Countries
China
Jiangsu
West China
Government Consumption Expenditure
Tertiary Industry
Japan
USChina
China
Shandong
Guangdong
Central China
EastChina
Secondary Industry
PrimaryIndustry
Net Exports
Gross Capital Formation
Private Consumption Expenditure
A HIGH LEVEL VIEW OF CHINA’S KEY ECONOMIC CHARACTERISTICS AND ITS CURRENT GLOBAL POSITION
USD60.7 tn
USD60.7 tn
USD18.6 tn
USD4.4 tn
USD4.4 tn
USD4.4 tn
USD4.4 tn
USD4.4 tn
Developing Asia
(excl. China)
Developing Countries
(excl. China)
China
Other Developing Countries

-4-
AGENDA
Foreword
History
Country Profile
China Economic Indicators
International Comparison
Conclusions
Implications
About THE BEIJING AXIS
Disclaimer

-5-
Xia Dynasty
2070BC-1600BC
• First dynasty described in ancient historical records
• Establishment of Chinese dynastic system
• Bronze age
Shang Dynasty
1600BC-1046BC
• Rudimentary writing system using oracle bones; origins of Chinese writing system
• Innovation of charioteering and large-scale taming of horses
Zhou Dynasty
1046BC-256BC
• Production of a corpus of influential literature, i.e. Classic of Changes (I-ching) and the oldest known history of China
• Warring States period (453-221) : Consolidation of feudal system; proliferation of iron works; spread of philosophies of Confucianism and Taoism; publication of Sun Tzu’s Art of War
Qin Dynasty
221BC-206BC
• First unification of China; centralised feudal systemand legalistic mode of government
• Unified language, currency, metric and legal systems established
• Commencement of Great Wall construction
Han Dynasty
206BC-220AD
• Commencement of Silk Road trade route; interaction with Roman Empire
• Official adoption of Confucianism
• 105 BC: Invention of paper-making technology
• Buddhism first introduced to China
• Life of China’s famous historian Sima Qian (145-87)
Three Kingdoms
220AD-280AD
• Short, violent period yet greatly romanticized in Chinese literature, most notably with the fictional Romance of the Three Kingdoms
Jin Dynasty
265AD-420AD
South and North Dynasties
420AD-589AD
• Period of civil war and disunity, yet great advances made in medicine, astronomy, mathematics and cartography, as well as a flourishing of poetry, calligraphy, painting and music
Sui Dynasty
581AD-618AD
• Reunification of China, launching of Three Departments and Six Ministries system
• Large-scale construction work on Grand Canal
• 605 AD: First civil service exam, based on the Confucian classics
2 43 51 6 7 8 9
Source: Various; THE BEIJING AXIS Analysis
CHINA IS ONE OF THE WORLD’S OLDEST CIVILISATIONS, WITH RECORDS DATING BACK MORE THAN 4,000 YEARS

-6-
Tang Dynasty
618-907
• Regarded as high point in history of Chinese civilization
• Golden age of Chinese literature and art; renowned for leisure activities like archery, hunting, polo, football, cockfighting, etc.
• Strong Chinese maritime presence in places like Persian Gulf, Red Sea, Arabia, Egypt and East Africa
• Briefly interrupted by the Second Zhou dynasty (690-705) ruled by China’s only female emperor, Wu Zetian
Five Dynasties and Ten Kingdoms
907-960
• Period of upheaval: Successive brief dynasties and states
• Shift of China’s political power centre from the northwest (Shaanxi) eastward to the Yellow River plain in Henan
• First complete printed edition of 11 Confucian classics produced
Song Dynasty
960-1279 • First government issue of paper money and establishment of permanent standing navy, making use of gunpowder
• c. 960: Invention of the compass
• 1040: Invention of movable type printing
• Substantial exploitation of gold, silver, copper, iron, and other mineral deposits
• Emergence of the earliest manufacturing and processing plants
• 1078: China's steel output reaches 1.25 million tons, levels only attained in the West by 1788
Yuan Dynasty
1271-1368
• China under Mongol rule; society of rich cultural diversity and extensive interchange with West Asian and European societies
• First recorded European travels to China, notably by Marco Polo
• World's largest foreign trade port at Quanzhou
Ming Dynasty
1368-1644
• Return to ethnic Han (Chinese) rule
• 1406-1420: Forbidden City constructed in Beijing
• 1405-1433: Admiral Zheng He undertakes 7 voyages, reaching Africa and more than 30 countries
• Commercial interaction with Portuguese and Dutch traders from 16th century; appearance of Western missionaries in China
Qing Dynasty
1636-1911
• Extended period of stable dynastic rule in the 17th/18th centuries
• Serious threat of Christian Taiping rebellion in 19th century
• Increasing presence of foreign powers in China; rapid growth of Chinese population; Dynasty weakened by Opium Wars, Boxer Rebellion (1899-1901)
Republic of China
1912-1949
• 1912: Republic declared under Sun Yat-sen
• 1919: May Fourth Movement of students protesting foreign violations of Chinese sovereignty
• 1921: Establishment of Communist Party of China
• 1934-1936: The Long March
• 1937-1945: War with Japan
People’s Republic of China (PRC)
Since 1949
Source: Various; THE BEIJING AXIS Analysis
10 11 12 13 14 15 16AD
PRE-MODERN CHINA’S SOCIAL, LEGAL AND ECONOMIC SYSTEMS EVOLVED OVER CENTURIES

-7-
1949 1954
1953: First Five Year Plan released
1959 1964
1958-1960: The Great Leap Forward
1969 1974
1969: First atomic bomb successfully detonated
1979
1970: First satellite launched
1978: Reform and opening up initiated by Deng Xiaoping
1984 1989 1994 1999 2004 2009 2014
1993: Daya Bay Nuclear Power Station commences operations
1997: Hong Kong transfer of sovereignty to China
1999: Macau transfer of sovereignty to China
2001: China joins the WTO
2008: Beijing Olympic Games
2010: Shanghai World Expo
MODERN CHINA
Source: Various; THE BEIJING AXIS Analysis
1950-1952: Land Reform
CHINA’S RECENT HISTORY ILLUSTRATES A BROAD-BASED TRANSFORMATION THAT PAVED THE WAY FOR THE
RISE OF CHINA AS AN ECONOMIC SUPERPOWER
1966-1976: Cultural Revolution
2008: China overtakes Germany as world’s third-largest economy
2009: China set to overtake Japan as world’s second-largest economy

-8-
AGENDA
Foreword
History
Country Profile
China Economic Indicators
International Comparison
Conclusions
Implications
About THE BEIJING AXIS
Disclaimer

-9-
Plains, deltas, and hills in the east; mountains, high plateaus and deserts in the west
Terrain
Tropical in the south to sub-arctic in the north
Climate
Capital: Beijing Other major cities: Shanghai, Tianjin, Shenyang, Wuhan, Guangzhou, Chongqing, Harbin and Chengdu
Cities
35º00’ N, 105º00’ EEastern Asia, bordering the East China Sea, Korea Bay, Yellow Sea, and South China SeaShares 22,117 kilometres of land boundaries with 14 other countries
Location and Boundaries
9,596,960 sq. km. Area
People’s Republic of China
Source: CIA World Factbook; THE BEIJING AXIS Analysis
N
E
S
O Beijing
CHINA IS THE WORLD’S THIRD-LARGEST COUNTRY BY LAND MASS
The country’s size and location afford it a strategic advantage in trade, natural resources and international relations

-10-
China Facts and Figures 2008Population 1.33 bnNationality ChineseEthnic Groups Han Chinese (91.5%), Zhuang,
Manchu, Hui, Miao, Uygur, Yi, Mongolian, Tibetan, Buyi, Korean, and other (8.5%)
Religions Officially atheist, Buddhism, Taoism, Islam, Christianity, and Catholicism
Language Mandarin (Putonghua), many local dialects
Labour Force 807.7 mnGDP Nominal USD4,327 bnGDP Growth Rate 9%GDP Per Capita USD3,258Exports USD1,428.5 bnImports USD1,133.1 bnForex Reserves USD1,946 bnCurrency Renminbi (Chinese yuan) Time GMT + 8hrs
Source: CIA World Factbook; China Statistical Yearbook; China Monthly Economic Indicators; MOFCOM; THE BEIJING AXIS Analysis
> 5000 3000-50002000-3000< 2000
Shanghai
Hainan
FujianTaiwan
GuangdongGuangxi
GuizhouHunan
YunnanJiangxi
Chongqing Zhejiang
JiangsuTibet
HubeiSichuan
Shaanxi Henan
HebeiShandong
NingxiaQinghai Shanxi Tianjin
Jilin
LiaoningBeijingInner
MongoliaXinjiang
Gansu
Heilongjiang
CHINA HAS 56 ETHNIC GROUPS, OF WHICH THE HAN ETHNIC GROUP ACCOUNTS FOR
91% OF THE TOTAL POPULATION
Anhui
GDP Per Capita (USD, 2008)

-11-
Type of Government Socialist republic (or ‘people's democratic dictatorship’ as defined by PRC constitution)
Branches of Government
Executive - President, Premier, Vice President, State CouncilLegislative - Unicameral National People's CongressJudicial - Supreme People's Court, Local People's Courts, Special People's Courts
Administrative Divisions 23 provinces; 5 autonomous regions; 4 municipalities directly under the State Council
Political Parties Chinese Communist Party, 70.8 million members; 8 minor parties under Communist Party supervision
Constitution 4 December 1982
Independence 221 BC (unification under the Qin or Ch'in Dynasty); 1 January 1912 (Qing or Ch'ing Dynasty replaced by the Republic of China); 1 October 1949 (People's Republic of China established)
National Holiday Anniversary of the founding of the People's Republic of China, 1 October (1949)
Source: CIA World Factbook; US Dept. of State Background Notes; THE BEIJING AXIS Analysis
THE COMMUNIST PARTY OF CHINA (CPC) REMAINS THE DOMINANT FORCE IN GOVERNMENT

-12-
Legal SystemBased on civil law system; derived from Soviet and continental civil code legal principles. Legislature retains power to interpret statutes; constitution ambiguous on judicial review of legislation and has not accepted compulsory International Court of Justice jurisdiction
Flag Red with a large yellow five-pointed star and four smaller yellow five-pointed stars (arranged in a vertical arc toward the middle of the flag) in the upper hoist-side corner
International Organisation Participation
ADB, AfDB (nonregional members), APEC, APT, Arctic Council (observer), ARF, ASEAN (dialogue partner), BIS, CDB, EAS, FAO, G-20, G-24 (observer), G-77, IAEA, IBRD, ICAO, ICC, ICRM, IDA, IFAD, IFC, IFRCS, IHO, ILO, IMF, IMO, IMSO, Interpol, IOC, IOM (observer), IPU, ISO, ITSO, ITU, LAIA (observer), MIGA, MINURSO, MONUC, NAM (observer), NSG, OAS (observer), OPCW, PCA, PIF (partner), SAARC (observer), SCO, UN, UN Security Council, UNAMID, UNCTAD, UNESCO, UNHCR, UNIDO, UNIFIL, UNITAR, UNMIL, UNMIS, UNMIT, UNOCI, UNTSO, UNWTO, UPU, WCO, WFTU, WHO, WIPO, WMO, WTO, ZC
Source: CIA World Factbook; THE BEIJING AXIS Analysis
THE FOUNDING OF THE PRC IN 1949 ESTABLISHED A LEGAL SYSTEM INFLUENCED BY SOVIET PRINCIPLES

-13-
Other key institutions
High-Level View of China’s Political System
People’s Republic of China
President
Central Committee of theCommunist Party of China
(CCCPC)
General SecretaryPolitburo Standing Committee PolitburoSecretariat
PremierVice Premiers (4)State Councilors (5)Ministers (25)Central Bank GovernorAuditor-General
ChairmanVice ChairmanSpecial Committees of the NPC
State CouncilNational People’s
Congress(NPC)
Central MilitaryCommission
Supreme People’sCourt
Supreme People’sProcuratorate
Source: CIA World Factbook; US Dept. of State Background Notes; THE BEIJING AXIS Analysis
POLITICAL POWER IN CHINA HAS BECOME LESS PERSONAL AND MORE INSTITUTIONAL
The primary organs of state power - the NPC, the President and the State Council - are largely made up of party members

-14-
Order Name Party Positions State Positions1 Hu Jintao General Secretary of the Central Committee,
Chairman of the CPC Central Military CommissionPresident of the People’s Republic of China, and Chairman of the PRC Central Military Commission
2 Wu Bangguo - Chairman of the Standing Committee of the National People’s Congress
3 Wen Jiabao - Premier of the State Council4 Jia Qinglin - Chairman of the People’s Political
Consultative Conference5 Li Changchun - -
6 Xi Jinping Principal of the Central Party School. Top-ranked member of the Secretariat of the Communist Party of China Central Committee
Vice President of the People’s Republic of China
7 Li Keqiang - First Vice-Premier of the State Council8 He Guoqiang Secretary of the Central Commission for Discipline
Inspection-
9 Zhou Yongkang
Secretary of the Political and Legislative Affairs Committee
-
Source: CIA World Factbook; US Dept. of State Background Notes; THE BEIJING AXIS Analysis
Politburo Standing Committee of the Communist Party of China (2009)
THE POLITBURO STANDING COMMITTEE IS THE HIGHEST AND MOST POWERFUL DECISION-MAKING BODY IN CHINA

-15-
700,000 Engineers graduate annually from schools in China53,000 RMB is the average cost of a license plate in Shanghai40,000 Cabs drive around Shanghai daily30,000 Chinese MBA students were expected to graduate in 2008. The number in 1998 was 0649.7 Million mobile phones were in circulation in China in 2008
500 Coal-fired power plants to be built in China by the next decade160 Cities in China with populations that exceed 1 million. There are 9 in the US and just 2 in the UK97 New airports to be built in the next 12 years, bringing the total number to 244 by 202080 Percent of the world’s zippers are produced in the factories of Qiaotou city in Zhejiang Province80 Percent of the world’s toys are made in China, in more than 10,000 toy factories70 Percent of the world’s pirated goods come from China50 Percent of the world’s pork is eaten in China34 Children are born every minute in China30 Percent of Chinese adults live with their parents30 Nuclear power plants currently being built in China
6.3 Million passenger cars are registered in China. The number in 2004 was 2.4 million5.7 Million students graduated from Chinese universities in 2007. The number in 1977 was 270,000
5 Million Chinese are estimated to visit ski resorts this year. Ten years ago, only 500 people in China could ski1.8 Is the average number of credit cards owned by a person in Shanghai
Source: Various; THE BEIJING AXIS Analysis
VARIOUS FACTORS IDENTIFY CHINA AS ONE OF THE WORLD’S MOST SIGNIFICANT COUNTRIES

-16-
AGENDAForeword
History
Country Profile
China Economic Indicators
Selected Macroeconomic IndicatorsTrade Indicators: Domestic & ForeignInvestment Indicators: Domestic & ForeignFinancial IndicatorsSocial Indicators
International Comparison
Conclusions
Implications
About THE BEIJING AXIS
Disclaimer

-17-
0
1,000
2,000
3,000
4,000
5,000
6,000
78 79 80 81 82 83 84 85 86 87 88 89 90 91 92 93 94 95 96 97 98 99 00 01 02 03 04 05 06 07 08 09F10F
CAGR 10%
Note: GDP is calculated at current pricesCAGR: compound annual growth rate
Source: China Statistical Yearbook; China Monthly Economic Indicators; THE BEIJING AXIS Analysis
Nominal GDP (USD bn, 1978-2010F)
CHINA’S ECONOMY HAS GROWN TREMENDOUSLY, BECOMING THE THIRD-LARGEST ECONOMY IN THE WORLD
In 2008, China’s GDP reached USD4.4 trillion, which is 4 times its 1998 level (USD1 trillion). From 1978, it grew at a CAGR of 10%

-18-
0 200 400 600
GuangdongShangdong
JiangsuZhejiang
HenanHebei
ShanghaiLiaoningSichuan
HubeiHunanFujian
BeijingAnhui
HeilongjiangInner
GuangxiShanxi
ShaanxiJiangxi
JilinTianjin
YunnanChongqing
XinjiangGuizhou
GansuHainan
NingxiaQinghai
Tibet
123456789
10111213141516171819202122232425262728293031
2
4
35
1
Henan
Zhejiang
Shandong
Top 5 provinces’GDP equates to 46%
of total GDP
Guangdong
Jiangsu
GDP by Province (USD bn, 2008)
CHINA HAS A LARGE GDP BUT IT IS HIGHLY CONCENTRATED IN A FEW PROVINCES NEAR THE COAST
The top 5 provinces of Guangdong, Shandong, Jiangsu,Zhejiang, and Henan account for roughly 46% of GDP
31
30 29
28
27
Qinghai
Tibet
Gansu
Hainan
Ningxia
Note: GDP is calculated at current pricesSource: China Monthly Indicators; THE BEIJING AXIS Analysis

-19-
0
4
8
12
16
78 79 80 81 82 83 84 85 86 87 88 89 90 91 92 93 94 95 96 97 98 99 00 01 02 03 04 05 06 07 08 09F10F
7-10% GDP growth ‘band’
Past periods of
overheating
7-8% GDP growth ‘band’
Temporary slowdown below 7-
8% 'government target GDP' in 2009
Overheating concerns
Source: World Bank; China Statistical Abstract; OECD; THE BEIJING AXIS Analysis
China Nominal GDP Growth Rate (% y-o-y, 1978-2010F)
WE FORECAST GDP GROWTH RATES OF APPROXIMATELY 7% IN 2009 AND 7.5% IN 2010
The current cool-down period has been exacerbated by the global financial crisis;hence, GDP is projected to fall well below the average growth band in 2009

-20-
4
12
3
Tianjin
Inner Mongolia
Shanghai
Shaanxi
Jilin
5
GDP Growth Rate by Province (%, 2008)
ALTHOUGH GDP IS CONCENTRATED IN THE EAST, THE CENTRAL PROVINCES HAVE THE HIGHEST GDP GROWTH RATES
This illustrates the central government’s plan to develop the central and western regions of the country
31
30
29 28
27 Hainan
Chongqing
Beijing
Sichuan
Shanxi
123456789
10111213141516171819202122232425262728293031
0 5 10 15 20
Inner MongoliaTianjin
JilinShaanxi
ChongqingHubei
LiaoningFujianHunan
GuangxiAnhui
QinghaiJiangxiJiangsuNingxia
ShandongHenan
HeilongjiangYunnan
XinjiangGuizhou
GuangdongZhejiang
HebeiGansu
TibetHainan
ShanghaiSichuanBeijingShanxi
Source: China Monthly Indicators; THE BEIJING AXIS Analysis

-21-
0
1,000
2,000
3,000
4,000
78 79 80 81 82 83 84 85 86 87 88 89 90 91 92 93 94 95 96 97 98 99 00 01 02 03 04 05 06 07 08 09F 10F
CAGR 9%
GDP Per Capita (USD, 1978-2010F)
Note: GDP is calculated at current pricesSource: China Statistical Yearbook; National Bureau of Statistics of China; THE BEIJING AXIS Analysis
CHINA’S GDP PER CAPITA HAS GROWN CONSIDERABLY IN THE LAST 30 YEARS
In 2008, China’s GDP per capita reached USD3,258, which represents a CAGR of 9% over the last 30 years

-22-
5
4
32
Shanghai1
Zhejiang
Jiangsu
Source: Various; THE BEIJING AXIS Analysis
GDP Per Capita by Province (USD, 2008)
31
30
29
28
27
Beijing
Tianjin
Tibet
Gansu
YunnanGuizhou
Anhui
123456789
10111213141516171819202122232425262728293031
THE PROVINCES WITH THE HIGHEST GDP PER CAPITA ARE LOCATED IN EASTERN CHINA
The lowest GDP per capita is found in Central and Western China
0 2,000 4,000 6,000 8,000 10,000
ShanghaiBeijingTianjin
ZhejiangJiangsu
GuangdongShandong
InnerLiaoning
FujianJilin
HebeiHeilongjiang
ShanxiXinjiang
HubeiHenan
ShaanxiChongqing
NingxiaQinghai
HunanHainan
SichuanGuangxiJiangxi
AnhuiTibet
YunnanGansu
Guizhou
Inner Mongolia

-23-
259274
302
369
489
210200191181178174 179
0
1,000
2,000
3,000
4,000
5,000
1997 1998 1999 2000 2001 2002 2003 2004 2005 2006 2007 2008-10%
0%
10%
20%
30%
40%
CAGR 10%
Source: China Statistical Yearbook; China Monthly Economic Indicators; THE BEIJING AXIS Analysis
Composition of GDP by Sector (USD bn, 1997-2008)
PRIMARY INDUSTRY CONSTITUTES ROUGHLY 11% OF GDPChina’s primary industry grew at a CAGR of 10%
from 1997, and contributed USD489 billion to total GDP in 2008
Primary Industry Secondary Industry
Tertiary Industry Growth Rate of Primary Industry

-24-
0
400
800
1,200
1,600
9798990001020304050607
Industry Sector Construction Sector
Primary11%
Secondary49%
Tertiary40%
Breakdown of Secondary Industry and Trends (2007)
CAGR 13%
Value-Add of Secondary Industry (at current prices, USD bn, 1997-2007)
SECONDARY INDUSTRY IS THE LARGEST CONTRIBUTOR TO GDP, MAKING UP 49%
China’s secondary industry grew at a CAGR of 13% from 1997 to 2007, and contributed USD1.59 trillion to GDP in 2007, of which 88% came from
manufacturing
12%
88%
Note: CAGR is calculated for the last 10 years Source: China Statistical Yearbook; THE BEIJING AXIS Analysis
-25-
0
500
1,000
1,500
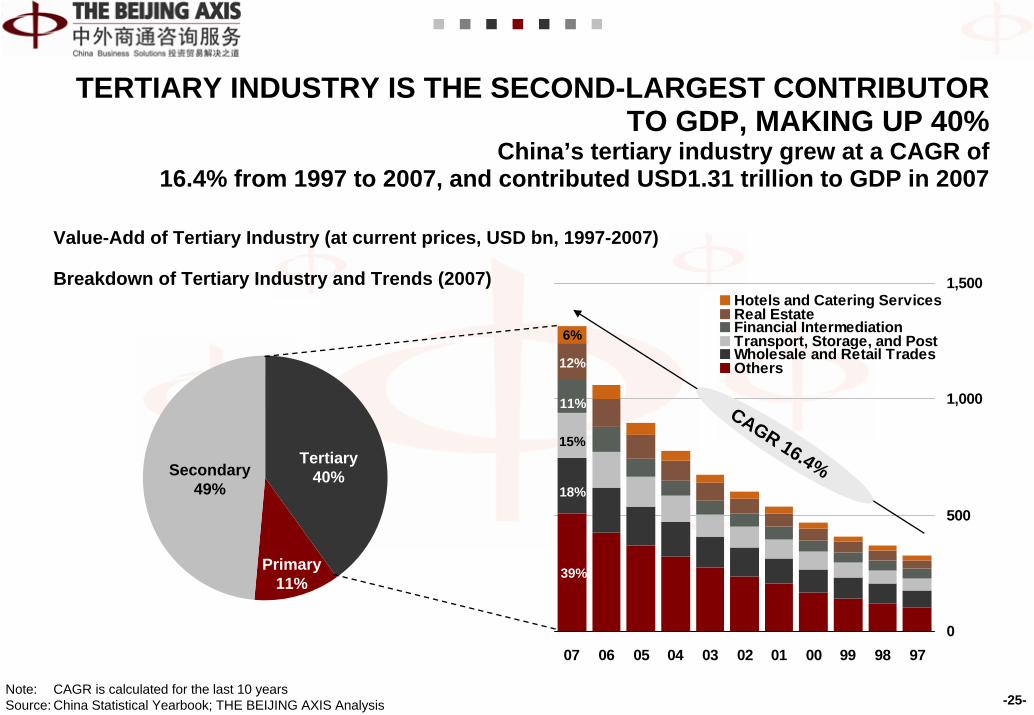
07 06 05 04 03 02 01 00 99 98 97
Hotels and Catering Services Real Estate Financial Intermediation Transport, Storage, and PostWholesale and Retail TradesOthers
CAGR 16.4%
Primary11%
Secondary49%
Tertiary40%
39%
18%
15%
11%
12%
6%
Value-Add of Tertiary Industry (at current prices, USD bn, 1997-2007)
Breakdown of Tertiary Industry and Trends (2007)
TERTIARY INDUSTRY IS THE SECOND-LARGEST CONTRIBUTOR TO GDP, MAKING UP 40%
China’s tertiary industry grew at a CAGR of 16.4% from 1997 to 2007, and contributed USD1.31 trillion to GDP in 2007
Note: CAGR is calculated for the last 10 years Source: China Statistical Yearbook; THE BEIJING AXIS Analysis

-26-
0%
20%
40%
60%
80%
100%
97 98 99 00 01 02 03 04 05 06 07
Net Exports of Goods and ServicesGross Capital FormationFinal Consumption Expenditure (household + gov)
0
2
4
6
8
97 98 99 00 01 02 03 04 05 06 07
Net Exports of Goods and ServicesGross Capital FormationFinal Consumption Expenditure (household + gov)
Note: The three components of GDP by expenditure approach are final consumption expenditure (composed of household and government consumption), gross capital formation and net exports of goods and services.
Source: China Statistical Yearbook; THE BEIJING AXIS Analysis
Contribution/Share of the three Components of GDP Growth (1997-2007)
Contribution to the Growth of GDP(Percentage Points, 1997-2007)
GROSS CAPITAL FORMATION AND FINAL CONSUMPTION EXPENDITURE ARE THE MAIN COMPONENTS OF CHINA’S GDP
In 2007, final consumption and gross capital formation each contributed 40% to GDP while net exports contributed 20%

-27-
20%
40%
60%
80%
100%
0 50 100 150 200
Shandong
Jiangsu
Guangxi
Hunan Hubei
Inner Mongolia
Beijing Fujian
Sichuan
Shanghai
Liaoning
Hebei
Henan
Zhejiang
Jilin
Anhui
ShanxiShaanxi
Heilongjiang Guangxi
Tianjin
Jiangxi
Chongqing
Yunnan
Xinjiang
Guizhou
Gansu
Ningxia
Hainan
Qinghai
Tibet
Total Capital Formation, USD bn
CHINA’S GROSS CAPITAL FORMATION IS CONCENTRATEDIN THE MORE DEVELOPED REGIONS
In 2007, China’s top 5 provinces by annual gross capital formation accounted for 40% of the national total
Source: China Statistical Yearbook; THE BEIJING AXIS Analysis
China’s Gross Capital Formation (2007)
Size of the bubble represents % of
total
Coastal provinces are responsible for a significant amount of capital formation
Provinces in central and western China have higher capital formation
rates
% of Province GDP

-28-
20%
40%
60%
80%
0 50 100 150 200
Jiangsu
ShandongZhejiang
Qinghai
Shanghai
Hebei
Sichuan
Guangdong
Hunan
HenanJiangxi
YunnanGuangxi
Heilongjiang
Anhui
Fujian
Liaoning
Hubei
Beijing
Ningxia
Hainan
Gansu
Xinjiang
Tianjin
Shaanxi
Jilin
Inner Mongolia
Shanxi
Chongqing
GuizhouTibet
Note: Final Consumption = Private Household Consumption + Government ConsumptionSource: China Statistical Yearbook; THE BEIJING AXIS Analysis
China’s Final Consumption (2007)
Total Final Consumption, USD bn
THE LARGEST SHARE OF CHINA’S FINAL CONSUMPTIONTAKES PLACE IN THE COASTAL PROVINCES
In 2007, Shandong, Guangdong, Jiangsu and Zhejiang were responsible for 34% of China’s total annual final consumption
34% of China’s total final consumption is centered
around the coastal provinces
Size of the bubble represents % of
total
% of Province GDP

-29-
190.311.312.020.821.528.0
44.1
44.4
79.4
98.2
109.5659.5
0%
20%
40%
60%
80%
100%
Tota
lG
over
nmen
tEx
pend
iture
Gen
eral
Pub
licSe
rvic
es
Educ
atio
n
Soci
al S
ecur
ityan
dEm
ploy
men
t
Urb
an &
Rur
alC
omm
unity
Affa
irs
Agr
icul
ture
,Fo
rest
ry a
ndIrr
igat
ion
Med
ical
Trea
tmen
t and
Hea
lth
Tran
spor
tatio
n
Scie
nce
and
Tech
nolo
gy
Envi
ronm
ent
Prot
ectio
n
Cul
ture
,Ph
ysic
alTr
aini
ng a
ndM
edia
Oth
ers
Government Expenditure Breakdown (USD bn, Jan-Nov 2008)
Source: China Monthly Economic Indicators; THE BEIJING AXIS Analysis
GOVERNMENT EXPENDITURE IS MOSTLY AIMED AT IMPROVING THE QUALITY OF LIFE OF THE POPULATION
In 2008, 55% of government expenditure was focused onpublic services, education, social security, employment and community affairs

-30-
0
1,000
2,000
3,000
4,000
5,000
6,000
1998 1999 2000 2001 2002 2003 2004 2005 2006 20070%
10%
20%
30%
40%
50%Industrial Output Growth Rate
WTO Accession11 December 2001
Source: CEIC Data; THE BEIJING AXIS Analysis
Gross Industrial Output (USD mn, 1998-2007)
CHINA’S INDUSTRIAL OUTPUT GROWTHACCELERATED WITH ACCESSION TO THE WTO IN 2001
Since then, a large number of foreign companies have established a manufacturing base in China, driving gross industrial output up at a CAGR of 9% from 1998 - 2007
CAGR 9%

-31-
0
10
20
30
40
50
Oil Nickel Copper Aluminium Zinc Lead Steel Coal SeaborneIron Ore
Tin
2nd
1st 1st
1st 1st 2nd 1st1st
1st 1st
Note: The percentages for Zinc, Lead and Tin are for 2007Source: WBMS; Barlow Jonker; IEA; BP; Macquarie; THE BEIJING AXIS Analysis
China’s Share of the World’s Consumption of Selected Resources (%, World Ranking, 2008)
CHINA IS THE WORLD’S LEADING CONSUMER OF SEVERAL RESOURCES
Rapid modernisation, industrialisation and urbanisation are the key drivers of the trend, which is unlikely to recede anytime soon

-32-
AGENDAForeword
History
Country Profile
China Economic Indicators
Selected Macroeconomic IndicatorsTrade Indicators: Domestic & ForeignInvestment Indicators: Domestic & ForeignFinancial IndicatorsSocial Indicators
International Comparison
Conclusions
Implications
About THE BEIJING AXIS
Disclaimer

-33-
0
200
400
600
800
1,000
1,200
1,400
1,600
78 79 80 81 82 83 84 85 86 87 88 89 90 91 92 93 94 95 96 97 98 99 00 01 02 03 04 05 06 07 08-20%
-10%
0%
10%
20%
30%
40%
50%
Retail Sales (Urban) Retail Sales (Sub-urban) Retail Sales (Rural)Urban Growth Sub-urban Growth Rural Growth
Annual Retail Sales and Growth Rate by Administrative Level (USD bn1, 1978-2008)
1. Figures converted from RMB to USD using the average exchange rate for the respective years; however, the growth rate does not factor in exchange rate fluctuationsSource: China Statistical Yearbook; China Monthly Economic Indicators; THE BEIJING AXIS Analysis
REFLECTING CHINA’S DEVELOPMENT, PERSONAL CONSUMPTION HAS BEEN ON THE RISE (I)
Whereas retail sales were quite volatile in the 1980s and 1990s,there has been substantial, stable growth in the current decade

-34-
0
40
80
120
160
Jan-
06
Apr
-06
Jul-0
6
Oct
-06
Jan-
07
Apr
-07
Jul-0
7
Oct
-07
Jan-
08
Apr
-08
Jul-0
8
Oct
-08
0
400
800
1,200
1,600
78 81 84 87 90 93 96 99 02 05 08
Source: China Statistical Yearbook; China Monthly Economic Indicators; THE BEIJING AXIS Analysis
Annual Retail Sales (USD bn, 1978-2008) Monthly Retail Sales (USD bn, 2006-2008)
REFLECTING CHINA’S DEVELOPMENT, PERSONAL CONSUMPTION HAS BEEN ON THE RISE (II)
The sustained growth in retail sales reflects China’s development and the consequent increase in the purchasing power of the population

-35-
3.58.9
86.9
Wholesale and Retail Trade Hotels and Catering ServicesOther
27.1
1,312.6
221.7
1978
84%
14%
2%
87%
4%9%
2008
Source: China Statistical Yearbook; China Monthly Economic Indicators; THE BEIJING AXIS Analysis
Annual Retail Sales of Consumer Goods by Sub-sector (USD bn, 1978 vs. 2008)
REFLECTING CHINA’S DEVELOPMENT, PERSONAL CONSUMPTION HAS BEEN ON THE RISE (III)
Wholesale and retail trade continue to dominate retail sales; however, hotels and catering services have seen considerable growth in the past 30 years

-36-
0 50 100 150 200
GuangdongShandong
JiangsuZhejiang
HenanHubei
LiaoningHebei
SichuanBeijing
ShanghaiHunanFujianAnhui
HeilongjiangJilin
Inner MongoliaShanxi
GuangxiShaanxiJiangxi
ChongqingTianjin
YunnanXinjiangGuizhou
GansuHainan
NingxiaQinghai
Tibet
Guangdong
Jiangsu
Shandong
Zhejiang
1
5
4
3
2
123456789
10111213141516171819202122232425262728293031
27
28
293031
Gansu
Hainan
Ningxia
QinghaiTibet
1. The top 5 provinces in terms of population does not include Zhejiang, but does include the four other provincesSource: China Statistical Yearbook; THE BEIJING AXIS Analysis
Total Retail Sales of Consumer Goods by Province (USD bn, 2008)
Henan
THE MAJORITY OF RETAIL SALES ARE CONCENTRATED IN THE EASTERN COASTAL PROVINCES
Unsurprisingly, the top 5 provinces in terms of retail sales are also the leading provinces in terms of population1, employed persons and income per capita

-37-
24.0
28.5
29.6
31.7
41.4
48.7
56.1
102.0
184.4
233.1
India
Russia
Singapore
UK
Netherlands
Germany
S. Korea
Japan
HK, SAR
USA
Russia
US19.1%
Hong Kong SAR15.1%
South Korea4.6%
Japan8.4%
Germany4.0%
Top Exports by UN Classification • Electrical machinery, equipment and parts
• Nuclear reactors, boilers, machinery and mechanical appliances
• Articles of apparel and clothing
51% OF CHINA’S EXPORTS ARE DESTINED FOR THE US,HONG KONG, JAPAN, SOUTH KOREA, AND GERMANY
The US and Hong Kong1 are China’s main export destinations
China’s Top Export Destinations (USD bn, 2007)
Total Exports = USD1,218 bn
1. Hong Kong is admittedly used a gateway to the rest of the worldSource: UN Comtrade; THE BEIJING AXIS Analysis

-38-
0
20
40
60
80
100
120
140
160
Jan-
07
Mar
-07
May
-07
Jul -
07
Sep-
07
Nov
-07
Jan-
08
Mar
-08
May
-08
Jul-0
8
Sep-
08
Nov
-08
-80%
-60%
-40%
-20%
0%
20%
40%
60%Exports Export Monthly Growth Rate
0
200
400
600
800
1,000
1,200
1,400
1,600
97 98 99 00 01 02 03 04 05 06 07 08-30%
-20%
-10%
0%
10%
20%
30%
40%Exports Export Growth Rate
China’s entry to the WTO
Annual Exports (USD bn, 1997-2008)
CHINA’S EXPORTS EXPERIENCED RAPID GROWTH FOLLOWING THE COUNTRY’S ACCESSION TO THE WTO
The global financial crisis, however, has sharply affected China’s exports
Dec
-08
Source: China Statistical Yearbook; China Monthly Economic Indicators; THE BEIJING AXIS Analysis
Monthly Exports (USD bn, 2007-2008)

-39-
94.9 127.0 187.9 268.3 352.3456.4
577.2
87.1 101.2126.1
156.4194.2
238.0
296.9
43.853.0
69.0
100.7
129.1
174.8
219.9
1,428.5
0
300
600
900
1,200
1,500
2001 2002 2003 2004 2005 2006 2007 2008
OthersMineral ItemsFoodstuffsChemicals and Related ProductsProducts Classified by Material Sundry (Manufactured Goods)Machinery Equipment
1. SITC Classification SystemSource: MOFCOM; THE BEIJING AXIS Analysis
Export Commodity Composition1 (USD bn, 2001-2008)
COMMONLY REGARDED AS THE WORLD’S FACTORY FLOOR, CHINA IS KNOWN FOR ITS COMPETITIVE PRODUCTS
This is supported by the fact that the bulk of the country’s exports are manufactured goods

-40-Source: UN Comtrade; THE BEIJING AXIS Analysis
Russia
US7.3%
Malaysia3.0%
South Korea10.8%
Japan14.0%
Germany4.8%
40% OF CHINA’S IMPORTS COME FROM JAPAN,SOUTH KOREA, THE US, GERMANY, AND MALAYSIA
In 2007, Japan and South Korea were the topsuppliers, accounting for 25% of China’s total imports
China’s Top Import Origins (USD bn, 2007)
18.3
19.7
22.7
23.1
25.8
28.7
45.4
69.5
103.8
133.9
Brazil
Russia
Thailand
Philippines
Australia
Malaysia
Germany
USA
S. Korea
JapanTotal Imports = USD956 bn
Top Imports by UN Classification• Electrical machinery, equipment and parts• Nuclear reactors, boilers, machinery and mechanical appliances
• Mineral fuels, mineral oils and products of their distillation

-41-
0
200
400
600
800
1,000
1,200
97 98 99 00 01 02 03 04 05 06 07 08-30%
-20%
-10%
0%
10%
20%
30%
40%Imports Import Growth Rate
China’s accession to
the WTO
Annual Imports (USD bn, 1997-2008)
CHINA’S IMPORTS EXPERIENCED RAPID GROWTH AFTER THE COUNTRY’S ACCESSION TO THE WTO
Imports registered a peak annual growth of 40% before stabilising at around 20%; the latter part of 2008 saw plunging imports due to the global crisis
Dec
-08
Source: China Statistical Yearbook; China Monthly Economic Indicators; THE BEIJING AXIS Analysis
Monthly Imports (USD bn, 2007-2008)
40
50
60
70
80
90
100
110
120
Jan-
07
Mar
-07
May
-07
Jul-0
7
Sep-
07
Nov
-07
Jan-
08
Mar
-08
May
-08
Jul-0
8
Sep-
08
Nov
-08 -40%
-30%
-20%
-10%
0%
10%
20%
30%
40%Imports Import Growth Rate

-42-
107.0 137.0 192.9 252.6 290.6 357.1 412.541.9 48.5
63.974.1
81.287.0
102.9
32.139.0
49.065.7
77.787.1
107.5 1133.1
0
200
400
600
800
1,000
1,200
2001 2002 2003 2004 2005 2006 2007 2008
OthersFoodstuffsSundry (Manufactured Goods)Mineral ItemsChemicals and Related ProductsProducts Classified by Material Machinery Equipment
1. SITC Classification SystemSource: MOFCOM; THE BEIJING AXIS Analysis
Import Commodity Composition1 (USD bn, 2001-2008)
AS AN ECONOMIC SUPERPOWER WITH AN AMBITIOUS DEVELOPMENT PLAN, CHINA NEEDS IMPORTED GOODS
The majority of these imports are machinery equipment, chemicals and related products, as well as, of course, minerals

-43-
Russia
US13.9%
Hong Kong SAR9.1%
South Korea7.4%
Japan10.9%
Germany4.3%
45% OF CHINA’S TOTAL TRADE IS WITH THE US, JAPAN,HONG KONG, SOUTH KOREA, AND GERMANY
The US accounted for USD302 bn in 2007
China’s Largest Trading Partners (USD bn, 2007)
China’s Total Trade with the World = USD2,174 bnTotal Exports = USD1,218 bnTotal Imports = USD956 bn
Source: UN Comtrade; THE BEIJING AXIS Analysis
43.8
46.3
46.4
47.1
48.2
94.1
159.9
197.2
236.0
302.6
Australia
Netherlands
Malaysia
Singapore
Russia
Germany
S. Korea
HK. SAR
Japan
USA

-44-
HK, SARUS
NetherlandsUK
UAEMalaysia
AngolaPhilippines
JapanS. Korea -47.7
-31.9
-15.6-11.7
-11.0
14.023.9
36.5163.6
171.6
Source: UN Comtrade; THE BEIJING AXIS Analysis
Russia
US
Hong Kong SAR
South Korea
Japan
UK
UAE
Angola
Netherlands
MalaysiaPhilippines
CHINA HAS A LARGE TRADE SURPLUS WITH HONG KONG & THE US, WHILE IT HAS A TRADE DEFICIT WITH S. KOREA & JAPAN
The larger share of China’s trade deficit is centered in Asia Pacific
China’s Trade Balance with the 5 Largest Surplus and Deficit Countries (USD bn, 2007)
China’s Trade Surplus = USD262 bn

-45-
0
10
20
30
40
50
Jan-
05
Mar
-05
May
-05
Jul-0
5
Sep-
05
Nov
-05
Jan-
06
Mar
-06
May
-06
Jul-0
6
Sep-
06
Nov
-06
Jan-
07
Mar
-07
May
-07
Jul-0
7
Sep-
07
Nov
-07
Jan-
08
Mar
-08
May
-08
Jul-0
8
Sep-
08
Nov
-08
-30%
-10%
10%
30%
50%
Trade Balance Exports, % change y-o-y Imports, % change y-o-y
Source: China Customs; THE BEIJING AXIS Analysis
China’s Monthly Trade Balance (USD bn, 2005-2008)
DEC 08’s TRADE SURPLUS OF USD39 BN WAS THE SECOND-HIGHEST EVER AFTER NOV 08’s USD40.1 BN
This surprising figure, at the ‘height’ of the global crisis, was the result of plummeting imports that greatly exceeded the drop in exports

-46-
0%
2%
4%
6%
8%
10%
06 -I
06 -II
06-III
06-IV
07 -I
07 -II
07-III
07-IV
08 -I
08 -II
08-III
08-IV
0%
2%
4%
6%
8%
10%
97 98 99 00 01 02 03 04 05 06 07 08
1. Total Consumption = Private Household Consumption + Government ConsumptionSource: China Statistical Yearbook; China Monthly Economic Indicators; THE BEIJING AXIS Analysis
Net Exports / GDP Annual (1997-2008) Net Exports / GDP Quarterly (2006-2008)
AS AN ELEMENT OF GDP, CHINA’S TRADE SURPLUS PEAKED AT AROUND 8% IN 2007
However, the current environment caused China’s trade to plunge in late 2008, leaving fixed investment and total consumption1 as the primary drivers of GDP

-47-
Percentage of China Total Trade Value
Top 65 %Next 25 %Next 10 %
HunanShandong
ShaanxiHenan
Imports: USD1,133.1 bnExports: USD1,428.5 bn
Total Trade: USD2,561.6 bn
Hunan
FujianTaiwan
Guangdong26.4%
Guangxi
Guizhou
Yunnan
Heilongjiang
Jilin
Liaoning
Hebei
Jiangsu, 15.4%
Shanghai, 12.6%
Anhui
ZhejiangJiangxi
Tibet
Hubei
Inner Mongolia
Ningxia
Sichuan
Qinghai
Xinjiang
Gansu
ShanxiTianjin
Chongqing
Beijing10.8%
China Total Trade Value by Province (2008)
Hainan
Source: China Monthly Economic Indicators; THE BEIJING AXIS Analysis
90% OF CHINA’S TOTAL INTERNATIONAL TRADE VALUE IS CONCENTRATED IN 9 PROVINCES
These coastal areas also have the highest GDP, GDP per capita, retail sales, fixed asset investment, FDI, and personal income

-48-
AGENDAForeword
History
Country Profile
China Economic Indicators
Selected Macroeconomic IndicatorsTrade Indicators: Domestic & ForeignInvestment Indicators: Domestic & ForeignFinancial IndicatorsSocial Indicators
International Comparison
Conclusions
Implications
About THE BEIJING AXIS
Disclaimer

-49-
0
500
1,000
1,500
2,000
2,500
3,000
1997 1998 1999 2000 2001 2002 2003 2004 2005 2006 2007 20080%
10%
20%
30%
40%Fixed Asset Investment Growth Rate
Source: China Statistical Yearbook; THE BEIJING AXIS Analysis
Fixed Asset Investment (USD bn, 1997-2008)
CHINA’S FIXED ASSET INVESTMENT HAS BEEN GROWING AT AN INCREASING PACE SINCE 1999
China has depended heavily on investment for its economic growth
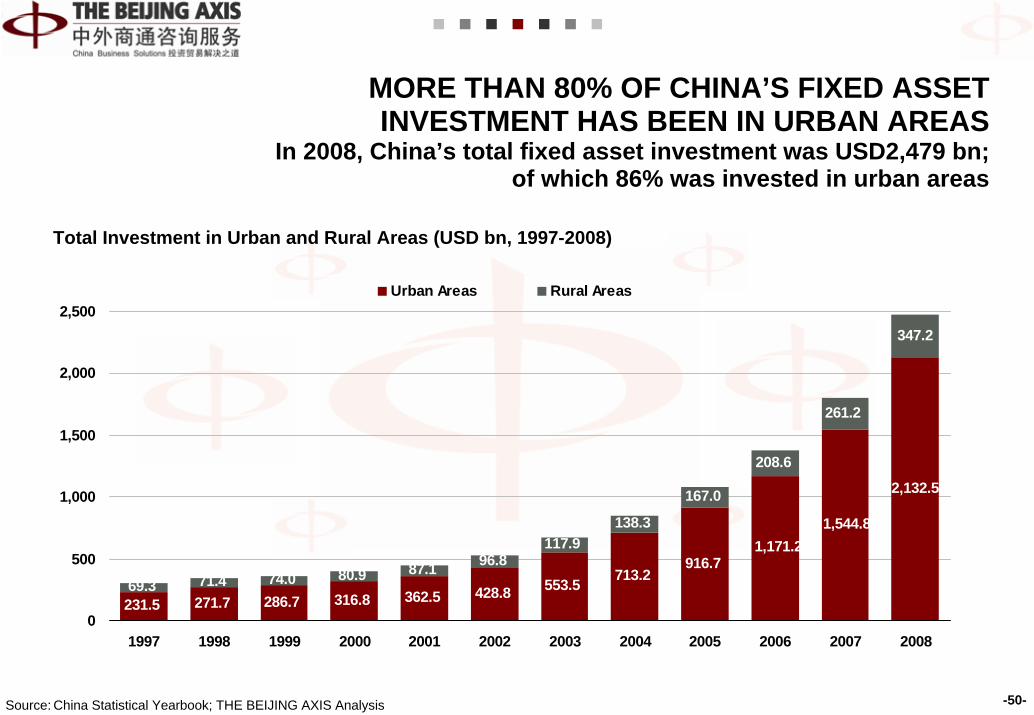
-50-
231.5 271.7 286.7 316.8 362.5 428.8 553.5 713.2916.7
69.3 71.4 74.0 80.9 87.1 96.8117.9
138.3
167.0
208.6
261.2
347.2
1,171.21,544.8
2,132.5
0
500
1,000
1,500
2,000
2,500
1997 1998 1999 2000 2001 2002 2003 2004 2005 2006 2007 2008
Urban Areas Rural Areas
Source: China Statistical Yearbook; THE BEIJING AXIS Analysis
Total Investment in Urban and Rural Areas (USD bn, 1997-2008)
MORE THAN 80% OF CHINA’S FIXED ASSET INVESTMENT HAS BEEN IN URBAN AREAS
In 2008, China’s total fixed asset investment was USD2,479 bn; of which 86% was invested in urban areas

-51-
123456789
1011121314151617181920212223242526272829303132
1
4
3
25
Jiangsu
Henan
Zhejiang
Guangdong
Shandong
Source: China Statistical Yearbook; THE BEIJING AXIS Analysis
Fixed Asset Investment by Province (USD bn, 2007)
CHINA’S FIXED ASSET INVESTMENT IS PRIMARILY FOCUSED ON THE COASTAL PROVINCESChina’s coastal provinces have greater demand for
fixed asset investment in order to develop their economies
0 50 100 150 200
ShandongJiangsu
GuangdongZhejiang
HenanLiaoning
HebeiSichuan
AnhuiShanghai
Inner MongoliaHubeiFujianHunanBeijing
JilinShaanxiJiangxi
ChongqingGuangxi
ShanxiHeilongjiang
YunnanNot Classified
TianjinXinjiangGuizhou
GansuNingxiaHainan
QinghaiTibet
Top 5 provinces -36.8%
Remaining provinces -
61.4%
Not classified by region - 1.8%

-52-
177.5 236.6 324.4 427.6585.3
803.7158.8
201.5238.1
307.6
426.6
585.8
76.092.4
117.4
152.3
186.1
255.6
52.861.3
76.6
102.3
133.5
183.4
47.970.0
92.2
107.7
124.5
171.0
21.529.0
43.8
58.7
77.3
106.2
137.0160.7
191.2
223.7
272.6
374.2
0
500
1,000
1,500
2,000
2,500
2003 2004 2005 2006 2007 2008E
OthersMining Utilities Environmental Protection and Public FacilitiesTransport, Storage and PostReal EstateManufacturing
Source: China Statistical Yearbook; THE BEIJING AXIS Analysis
Fixed Asset Investment by Sector (USD bn, 2003-2008E)
MANUFACTURING AND REAL ESTATE HAVE BEEN THE TOP TWO SECTORS FOR ATTRACTING FIXED ASSET INVESTMENT
China’s ongoing industrialisation has prompted an increasing amount of investment in some sectors, especially manufacturing

-53-
0
20
40
60
80
100
1997 1998 1999 2000 2001 2002 2003 2004 2005 2006 2007 2008-20%
-10%
0%
10%
20%
30%FDI Inflow FDI Growth
Note: FDI = foreign direct investmentSource: IMF; MOFCOM; THE BEIJING AXIS Analysis
FDI Inflow (USD bn, 1997-2008)
FDI FLOWS INTO CHINA HAVE BEENGROWING STEADILY FOR THE LAST DECADE
China’s low manufacturing costs, large market potential and attractive investmentenvironment are key factors in attracting FDI
-54-Source: MOFCOM; THE BEIJING AXIS Analysis
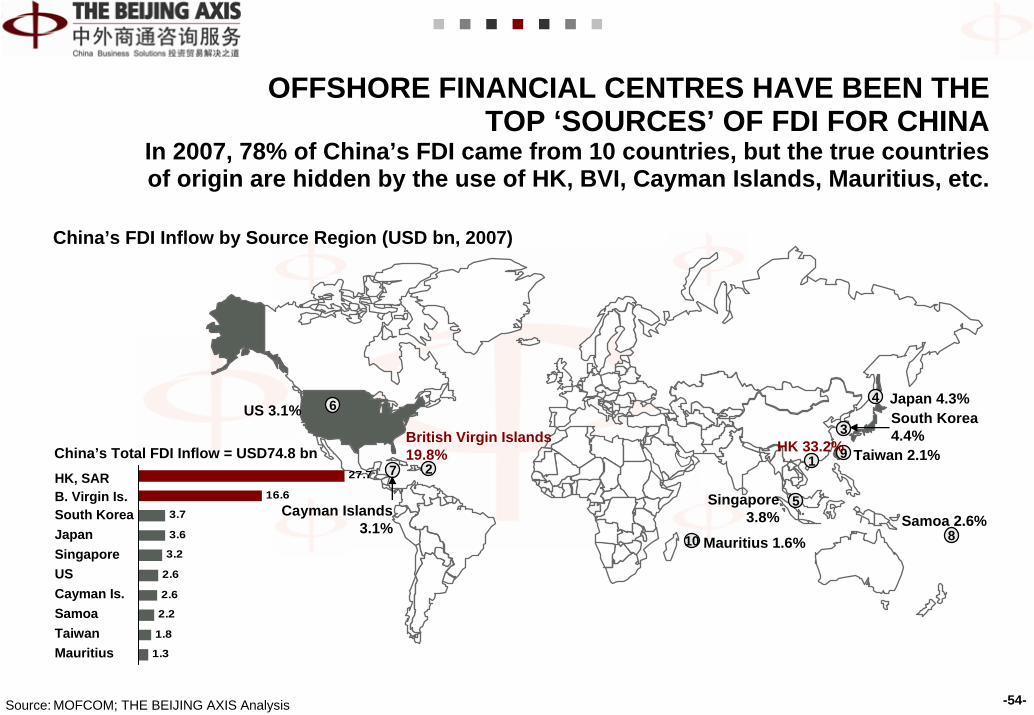
China’s FDI Inflow by Source Region (USD bn, 2007)
OFFSHORE FINANCIAL CENTRES HAVE BEEN THE TOP ‘SOURCES’ OF FDI FOR CHINA
In 2007, 78% of China’s FDI came from 10 countries, but the true countries of origin are hidden by the use of HK, BVI, Cayman Islands, Mauritius, etc.
27.7
16.6
3.7
3.6
3.2
2.6
2.6
2.2
1.8
1.3
HK, SARB. Virgin Is.South KoreaJapanSingaporeUSCayman Is.SamoaTaiwanMauritius
12
5
4
7
3
6
8
9
10
US 3.1%
HK 33.2%
Japan 4.3%South Korea4.4%
Taiwan 2.1%
Samoa 2.6%Mauritius 1.6%
British Virgin Islands19.8%
Cayman Islands3.1%
Singapore3.8%
China’s Total FDI Inflow = USD74.8 bn

-55-
0 5,000 10,000 15,000 20,000 25,000
JiangsuGuangdong
ShandongZhejiangLiaoning
ShanghaiTianjinBeijingFujianHunan
JiangxiHenanAnhuiHubei
ShanxiHebei
Inner MongoliaSichuanShaanxi
HainanChongqing
JilinGuangxi
HeilongjiangYunnanQinghaiGuizhouXinjiang
GansuNingxia
Tibet
123456789
10111213141516171819202122232425262728293031
3
4
2
1
5
Zhejiang
Liaoning
Jiangsu
Guangdong
Shandong
Top 5 provinces account for
56.8% of China’s total FDI
Source: China Statistical Yearbook; THE BEIJING AXIS Analysis
FDI Inflow by Province (USD mn, 2007)
CHINA’S COASTAL PROVINCES HAVE ATTRACTEDSUBSTANTIALLY MORE FDI THAN INLAND PROVINCES
The larger market size, infrastructure and the more attractive nature of the business environment are key elements in attracting FDI to coastal provinces

-56-
36.9 43.0 42.5 40.1 40.949.9
5.26.0 5.4 8.2
17.1
18.6
2.8 3.8 4.2
4.0
5.1
6.0
4.42.9
6.26.4 6.7
8.1
11.6
3.2
2.7
1.81.01.1
2.0
2.01.31.3
0.9
1.6
0
20
40
60
80
100
2003 2004 2005 2006 2007 2008
OthersTransport, Storage and PostWholesale and Retail TradesLeasing and Business ServicesReal EstateManufacturing
Source: China Statistical Yearbook; THE BEIJING AXIS Analysis
China’s FDI Inflow by Sector (USD bn, 2003-2008)
ALMOST HALF OF CHINA’S FDI HAS BEEN INVESTEDIN ITS MANUFACTURING SECTOR
This is rooted in the context of China’s industrialisation and the perceived status of the country as the world’s factory floor

-57-
0
20
40
60
1997 1998 1999 2000 2001 2002 2003 2004 2005 2006 2007 20080%
50%
100%
150%OFDI Flow OFDI Growth Rate (from 2003)
Source: IMF; MOFCOM; THE BEIJING AXIS Analysis
China Outward FDI Flow (USD bn, 1997-2008)
CHINA’S OUTWARD FDI (OFDI) HAS SEEN SHARP GROWTH OVER RECENT YEARS
Over the past 5 years China has become more active in its OFDI activities, driven by its increasing need for new markets, technology and more resources

-58-Source: MOFCOM; THE BEIJING AXIS Analysis
China’s Outward FDI Stock by Region (2007)
CHINA’S OFDI HAS EXTENDED TO ALL CONTINENTSUsually via international financial centres such as HK, Cayman Islands and BVI
68.8
16.8
6.6
1.9
1.4
1.4
1.4
1.3
1.2
1.1
HKCayman Is.B. Virgin Is.USAustraliaSingaporeRussiaCanadaSouth KoreaPakistan
USD bnHK 58.3%
12
Cayman Islands14.3%
3
British Virgin Islands5.6%
4US 1.6%
Australia 1.2%
5
6 Singapore 1.2%
Russia 1.2%7Canada 1.1%8
South Korea1.0%
910
Pakistan 0.9%
China’s total cumulative outward FDI stock for 2007 amounted to USD117.9 bn

-59-
0 500 1,000 1,500
GuangdongZhejiang
ShandongHunanGansu
LiaoningShanghai
FujianJiangsuYunnanHenan
BeijingXinjiang
TianjinShaanxi
HeilongjiangSichuan
ChongqingGuangxi
JilinAnhuiHebeiHubei
ShanxiNingxiaJiangxi
Inner MongoliaQinghaiHainan
GuizhouTibet
123456789
10111213141516171819202122232425262728293031
3
42
GuangdongHunan
Zhejiang
Shandong
Top 5 provinces’OFDI account for
50%
The remaining of provinces’ OFDI account for 50%
Tibet has no reported OFDI
1
5
Gansu
Source: MOFCOM; THE BEIJING AXIS Analysis
OFDI by Province (USD mn, 2008)
IN 2008, HALF OF CHINA’S NON-FINANCIAL OFDI CAME FROM FIVE PROVINCES
Unlike with FDI, Chinese sources of OFDI are not restricted to the coastal areas

-60-
0.8 2.3 1.1
6.60.7
4.94.5
5.6
0.8
0.61.4
4.1
1.8
1.7
8.5
4.1
0.8
2.3
0.9
2.1
0.6
0.5
4.7
4.0
0
5
10
15
20
25
30
2004 2005 2006 2007
OthersManufacturingMiningTransport, Storage and PostLeasing and Business ServicesWholesale and Retail Trades
Source: China Statistical Yearbook; THE BEIJING AXIS Analysis
China OFDI Flow by Sector (USD bn, 2004-2007)
CHINA’S OFDI COVERS MANY SECTORS BUT THERE IS A DISPROPOTIONATE FOCUS ON CERTAIN SECTORS
A substantial portion of China’s outward investments are in natural resources, wholesale and retail trades, and manufacturing

-61-
AGENDAForeword
History
Country Profile
China Economic Indicators
Selected Macroeconomic IndicatorsTrade Indicators: Domestic & ForeignInvestment Indicators: Domestic & ForeignFinancial IndicatorsSocial Indicators
International Comparison
Conclusions
Implications
About THE BEIJING AXIS
Disclaimer

-62-
92
96
100
104
108
97 98 99 00 01 02 03 04 05 06 07 08
Annual CPI
1
4
2
3
5Guangxi107.8
Xinjiang108.1
Qinghai110.1
Gansu108.2
Ningxia108.5
Jilin
105.14
5Sichuan105.1
3 Zhejiang105
2Liaoning104.6
1 Fujian104.6
1. Preceding year = 100Source: China Statistical Yearbook; China Monthly Economic Indicators; THE BEIJING AXIS Analysis
Consumer Price Index Annual (1997-2008)1 Consumer Price Index by Province (2008)1
Bottom 5 ProvincesTop 5 Provinces
CHINA HAS SEEN PHASES OF INFLATION, DISINFLATION AND DEFLATION OVER THE PAST DECADE
In 2008, the provinces with the highest CPI were concentrated in western China while the provinces with the lowest CPI were concentrated along the coastline
Commodity and Food Price Pressures
Overheating and overinvestment
Deflation and overcapacity

-63-
92
96
100
104
108
97 98 99 00 01 02 03 04 05 06 07 08
Annual PPI
1
32
2
Shaanxi122.4
Hebei116.7
3 Xinjiang108.1
5Heilongjiang114
4
Ningxia112.9
4 Tianjin104.1
Beijing103.3
5 Fujian104.6
Guangdong103.1
1 Shanghai102.2
1. Preceding year = 100Source: China Statistical Yearbook; Various; THE BEIJING AXIS Analysis
Producer Price Index, Annual (1997-2008)1 Producer Price Index by Province (2008)1
Bottom 5 ProvincesTop 5 Provinces
CHINA’S PPI HAS SEEN SIMILAR FLUCTUATIONS IN THE PAST DUE TO THE RISE IN RAW MATERIAL, FUEL AND ENERGY COSTS
In 2008, the provinces with the lowest PPI were the coastal provincesof Shanghai, Fujian, Guangdong, Beijing, and Tianjin

-64-
95
100
105
110
115
99 00 01 02 03 04 05 06 07 08
Selling Price Index of HousesLand Transaction Price IndexRenting Price Index of Houses
1
2
2
5 Urumqi105.1
4
5
Yinchuan110.7
4
1
Jinhua105.8
Sanya107.9
Chongqing95.9
Yantai105.1
Xiamen97.0
Guangzhou95.6
Shenzhen85.8
1. Preceding year = 100Source: China Statistical Yearbook; THE BEIJING AXIS Analysis
Bottom 5 CitiesTop 5 Cities
Property Price Index, Annual (1999-2008)1 Selling Price Index of Houses by Province (Q4, 2008)1
CHINA’S PROPERTY MARKET HAS SEEN DRAMATIC PRICE INCREASES OVER THE PAST DECADE
In 2007, China experienced the highest rise in residential property prices inthe world, with prices in major cities doubling from the previous year
Haikou106.5
3
3Nanjing97.3 5

-65-
Apr
-09
30
40
50
60
Jan-
06
Mar
-06
May
-06
Jul-0
6
Sep-
06
Nov
-06
Jan-
07
Mar
-07
May
-07
Jul-0
7
Sep-
07
Nov
-07
Jan-
08
Mar
-08
May
-08
Jul-0
8
Sep-
08
Nov
-08
Jan-
09
Mar
-09
PMI 2 Month Moving Average (PMI)
FROM A TROUGH OF 38.8 IN NOV 08, CHINA’S PMI HAS BEEN RISING AND SURPASSED THE 50 BENCHMARK IN MARCH 09
A PMI index of over 50% signals expansion of the manufacturing industry
Purchasing Manager Index of the Manufacturing Industry (2006-Apr 2009)
Source: China Monthly Economic Indicators; THE BEIJING AXIS Analysis

-66-
86.586.887.3
90.2
92.493.493.7
94.594.194.394.094.594.3
95.696.9
96.0
80
85
90
95
100
Nov
-07
Dec
-07
Jan-
08
Feb-
08
Mar
-08
Apr
-08
May
-08
Jun-
08
Jul-0
8
Aug
-08
Sep-
08
Oct
-08
Nov
-08
Dec
-08
Jan-
09
Feb-
09
Source: CEIC Data; THE BEIJING AXIS Analysis
Consumer Confidence Index (%, Nov 2007-Feb 2009)
CONSUMER CONFIDENCE IN CHINA HAS SUFFERED AS A RESULT OF THE GLOBAL FINANCIAL CRISIS
The weaker trend is expected to continue well into 2009; however, the effects of the government’s stimulus plan should have a positive impact
Although Consumer Confidence decreased, it is still among the
highest in the world

-67-
EconomicSlowdown
Economy Overheating
Bank Deposit-Reserve Ratio (%, 1998-2008)
IN MID 2008, CHINA’S MONETARY POLICYCHANGED FROM TIGHT TO MODERATE
Since 2006, the bank reserve ratio has been gradually increased in order to curb excess liquidity and reduce inflationary pressures, but from Sep.
2008 policy has eased considerably
Note: Bank Deposit-Reserve Ratio is a standard determined by a central bank. It governs the relationship between the amount of money that banks must keep on hand and the amount that they can lend. By raising and lowering the ratio, the central bank can decrease or increase money supply
Source: BNET Business Dictionary; THE BEIJING AXIS Analysis
0
5
10
15
20
21-M
ar-9
8
21-N
ov-9
9
21-S
ep-0
3
25-A
pr-0
4
5-Ju
l-06
15-A
ug-0
6
15-N
ov-0
6
15-J
an-0
7
25-F
eb-0
7
16-A
pr-0
7
15-M
ay-0
7
5-Ju
n-07
15-A
ug-0
7
25-S
ep-0
7
25-O
ct-0
7
26-N
ov-0
7
25-D
ec-0
7
25-J
an-0
8
25-M
ar-0
8
25-A
pr-0
8
20-M
ay-0
8
7-Ju
n-08
25-J
un-0
8
15-S
ep-0
8
15-O
ct-0
8
26-N
ov-0
8

-68-
0
2
4
6
8
10
25-M
ar-9
8
1-Ju
l-98
7-D
ec-9
8
10-J
un-9
9
21-F
eb-0
2
29-O
ct-0
4
19-A
ug-0
6
19-A
ug-0
6
18-M
ar-0
7
19-M
ay-0
7
21-J
ul-0
7
22-A
ug-0
7
15-S
ep-0
7
21-D
ec-0
7
9-O
ct-0
8
30-O
ct-0
8
27-N
ov-0
8
23-D
ec-0
8
5 Years 1 Year 6 Months 3 Months
Deposit Interest Rate (% p.a., 1998-2008)
Source: China Statistical Yearbook; THE BEIJING AXIS Analysis
UNTIL THE FINANCIAL CRISIS, MONETARY POLICY WAS AIMED AT PREVENTING THE ECONOMY FROM OVERHEATING
But during 2008 deposit interest rates were lowered as the full extent of the economic slowdown became clear

-69-
0
3
6
9
12
23-O
ct-9
7
25-M
ar-9
8
1-Ju
l-98
7-D
ec-9
8
10-J
un-9
9
21-F
eb-0
2
29-O
ct-0
4
28-A
pr-0
6
19-A
ug-0
6
18-M
ar-0
7
19-M
ay-0
7
21-J
ul-0
7
22-A
ug-0
7
15-S
ep-0
7
21-D
ec-0
7
16-S
ep-0
8
9-O
ct-0
8
30-O
ct-0
8
27-N
ov-0
8
23-D
ec-0
8
Longer than 5 Years 1 Year to 3 Years (Include 3 years) 6 Months to 1 Year (Include 1 year)
First decrease in loan interest rates
in six years
Loan Interest Rate (%, 1997-2008)
Source: China Statistical Yearbook; THE BEIJING AXIS Analysis
LENDING RATES STARTED TO SHIFT LOWER FOR THE FIRST TIME IN 6 YEARS IN SEPTEMBER 2008
Rates were lowered relatively rapidly since September 2008 as the economic slowdown in Q3 2008 and Q4 2008 unfolded

-70-
0
2,000
4,000
6,000
8,000
1997 1998 1999 2000 2001 2002 2003 2004 2005 2006 2007 2008
Loans Deposits
Deposits CAGR: 19.2%
Loans CAGR: 16.0%
Source: China Statistical Yearbook; THE BEIJING AXIS Analysis
Total Loans and Deposits (USD bn, 1997-2008)
DURING THE PAST 10 YEARS, CHINESE BANK DEPOSITS HAVE BEEN RISING FASTER THAN BANK LENDING
By the end of 2008, China’s total deposits amounted toUSD6.7 trillion whilst loans stood at USD4.4 trillion

-71-
6,710 3,136
2,269
53154145260
316
0%
20%
40%
60%
80%
100%
T o t alD ep osit s
Ho useho ldSaving s
D epo sit s
C o mp anyD ep o sit s
D ep o sit s o fGo vernment
D epart ment s &Org anisat io ns
F iscalD ep osit s
A g ricult uralD ep o sit s
T rustD ep osit s
Ot herD ep osit s
1,251.9 1,444.5 1,721.9 2,027.0 2,269.03,135.9875.8
1,023.01,173.7
1,420.51,823.7
2,268.7
0
2,000
4,000
6,000
8,000
10,000
2003 2004 2005 2006 2007 2008
Other DepositsTrust DepositsAgricultural DepositsFiscal DepositsDeposits of Government Departments & OrganisationsCompany DepositsHousehold Savings Deposits
Source: China Statistical Yearbook; The People’s Bank of China; THE BEIJING AXIS Analysis
Sources of Deposits (USD bn, 2008) Sources of Deposits (USD bn, 2003-2008)
HOUSEHOLD SAVINGS HAVE BEEN THE MAINDRIVER OF THE HIGH GROWTH IN DEPOSITS
In 2008, household banking deposits accounted for 47% of totaldeposits, whilst company deposits accounted for 34%
47%
34%

-72-
291
4,367 2,231
720
4453
254255
520
0%
20%
40%
60%
80%
100%
Total Loans Medium &Long-term
Loans
Other Short-term Loans
Short-termLoans to
IndustrialSector
Short-termLoans to
CommercialSector
Short-termLoans to
AgriculturalSector
Short-termLoans to
ConstructionSector
Trust Loans Other Loans
766.0 926.7 1,067.7 1,336.61,729.8
2,230.9380.5
401.7 414.7456.5
576.5
719.5
274.9288.7
274.9
359.4
442.2
520.2
0
1,000
2,000
3,000
4,000
5,000
2003 2004 2005 2006 2007 2008
Other LoansTrust LoansShort-term Loans to Construction SectorShort-term Loans to Agricultural SectorShort-term Loans to Commercial SectorShort-term Loans to Industrial SectorOther Short-term LoansMedium & Long-term Loans
Source: China Statistical Yearbook; The People’s Bank of China; THE BEIJING AXIS Analysis
Loan Duration (USD bn, 2008) Loan Duration (USD bn, 2003-2008)
MEDIUM AND LONG-TERM LOANS MAKE UP THE BULK OF TOTAL LOANS
In 2008, medium and long-term loans made up 51%of total loans, while short-term loans made up 41%
51%

-73-
646 715 780 837 834 842 860 864 864
514509 507
540 547 592 684 740 736
0
400
800
1,200
1,600
2001 2002 2003 2004 2005 2006 2007 2008 2009.5
Number of Companies listed on the Shenzhen Stock ExchangeNumber of Companies listed on the Shanghai Stock Exchange
525.8 463.1 513.0 447.7 395.9 1,121.5 4,302.2 1,746.8 2,069.9
1. As of May 2009Source: China Statistical Yearbook; China Monthly Economic Indicators; World Federation of Exchanges; THE BEIJING AXIS Analysis
Total Market Value,
USD bn
Number of Listed Companies
THE SHANGHAI AND SHENZHEN STOCK EXCHANGES HAVE THE 6th AND 20th LARGEST MARKET VALUES IN THE WORLD1
In 2007, China’s total market capitalisation reached USD4 trillion,with 1,544 listed companies and around 72.14 million investors
2007 stock market bubble

-74-
0
500
1,000
1,500
2,000
2,500
2001 2002 2003 2004 2005 2006 2007 2008 Jan-May2009
0
500
1,000
1,500
0
500
1,000
1,500
2,000
2,500
2001 2002 2003 2004 2005 2006 2007 2008 Jan-May2009
0
2,000
4,000
6,000
8,000
Volume, bn Shares Price
Average P/E Ratio 37.7 34.4 36.5 24.2 16.3 33.3 59.2 14.9 24.2
Total Turnover USD bn
274 205 252 320 235 725 4,017 2,597 1,691
Average P/E Ratio 39.8 37.0 36.2 24.6 16.4 32.7 69.7 16.7 32.1
Total Turnover USD bn
188 133 136 192 152 410 2,040 1,248 933
PriceVolume, bn Shares
Source: China Statistical Yearbook; China Monthly Economic Indicators; Shanghai Stock Exchange; Shenzhen Stock Exchange; www.sina.com.cn; THE BEIJING AXIS Analysis
Shanghai Stock Exchange (2001- May 2009) Shenzhen Stock Exchange (2001- May 2009 )
THE GLOBAL FINANCIAL CRISIS, ALONG WITH OTHER FACTORS, HAS CAUSED LARGE DECLINES IN FINANCIAL MARKETS
In 2009, however, Chinese stock markets have been recovering at a faster pace compared to their global counterparts

-75-
0
500
1,000
1,500
2,000
2,500
1997 1998 1999 2000 2001 2002 2003 2004 2005 2006 2007 2008 Jan-Mar2009
0%
20%
40%
60%
80%Foreign Exchange Reserves Growth Rate
Lowest level since 2000, caused by the slowing of
‘hot money’ inflows
Foreign Exchange Reserves & Annual Growth (USD bn, 1997- March 2009)
Source: China Statistical Yearbook; China Monthly Economic Indicators; THE BEIJING AXIS Analysis
CHINA HAS THE LARGEST FOREIGN EXCHANGE RESERVES IN THE WORLD
In March 2009, China’s foreign reserves reached USD1.9 trillion – consisting mainly of US government and institutional bonds

-76-
70
90
110
130
150
2001 2002 2003 2004 2005 2006 2007 2008 May 2009
EUR AUD ZAR USD RUB JPY KRW
Note: Index 2001 = 100 (EUR Index 2002=100)Source: PBOC; THE BEIJING AXIS Analysis
Annual RMB Exchange Rate (2001- May 2009)
THE CHINESE RENMINBI (RMB) HAS APPRECIATED BY 18% AGAINST THE USD SINCE CHINA AMENDED ITS EXCHANGE
RATE POLICY IN 2005
AUD
EUR
USDZAR
KRW
JPY
RUB

-77-
AGENDAForeword
History
Country Profile
China Economic Indicators
Selected Macroeconomic IndicatorsTrade Indicators: Domestic & ForeignInvestment Indicators: Domestic & ForeignFinancial IndicatorsSocial Indicators
International Comparison
Conclusions
Implications
About THE BEIJING AXIS
Disclaimer
-78-
0
200
400
600
800
1,000
1,200
1,400
1978 1981 1984 1987 1990 1993 1996 1999 2002 2005 20080.0%
0.5%
1.0%
1.5%
2.0%Population Population Growth Rate
Source: IMF; National Bureau of Statistics of China; THE BEIJING AXIS Analysis
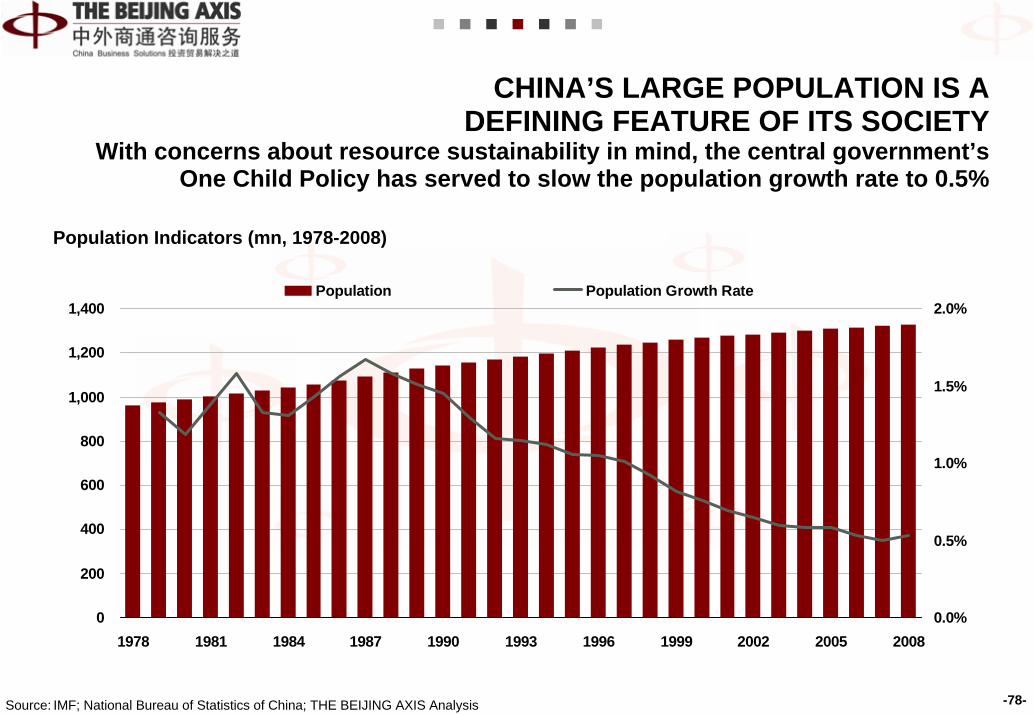
Population Indicators (mn, 1978-2008)
CHINA’S LARGE POPULATION IS A DEFINING FEATURE OF ITS SOCIETY
With concerns about resource sustainability in mind, the central government’s One Child Policy has served to slow the population growth rate to 0.5%

-79-
0
7
14
21
28
1978 1981 1984 1987 1990 1993 1996 1999 2002 2005-20%
-10%
0%
10%
20%New Births New Births Growth Rate
Children born during the boom of the mid-80’s will soon enter
childbearing age
2007
Source: National Bureau of Statistics of China; THE BEIJING AXIS Analysis
China’s Annual Births (mn, 1978-2007)
HOWEVER, EVEN WITH FAMILY PLANNING MEASURES, CHINA STILL HAS AROUND 16 MN BIRTHS PER YEAR
Introduced in 1979, the One Child Policy has been a controversial topic
-80-
6.7%
25.7%
67.6%
0-14 15-64 65 and over
8.2%
19.0%
72.8%
1998 (Total Population - 1.2 bn) 2008 (Total Population - 1.3 bn)
Source: National Bureau of Statistics of China; THE BEIJING AXIS Analysis
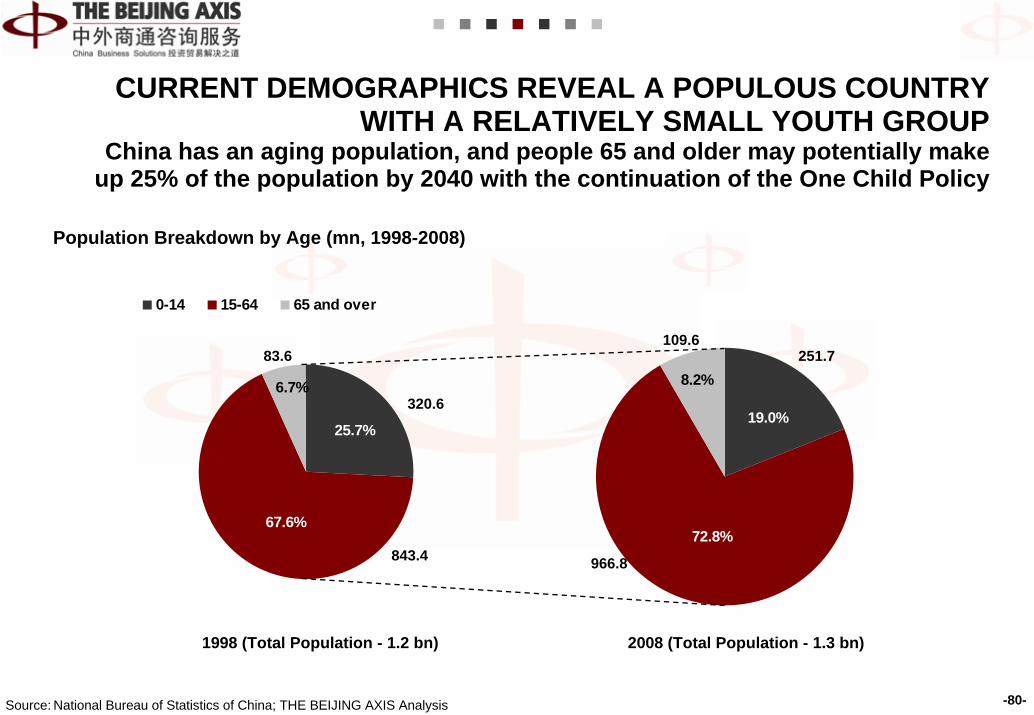
Population Breakdown by Age (mn, 1998-2008)
109.6
966.8
251.783.6
843.4
320.6
CURRENT DEMOGRAPHICS REVEAL A POPULOUS COUNTRY WITH A RELATIVELY SMALL YOUTH GROUP
China has an aging population, and people 65 and older may potentially make up 25% of the population by 2040 with the continuation of the One Child Policy

-81-
0 20 40 60 80 100
Guangdong Shandong
Henan Sichuan Jiangsu
Hebei Hunan Anhui Hubei
Zhejiang Guangxi Yunnan Jiangxi
Liaoning Heilongjiang
Guizhou Shaanxi
Fujian Shanxi
Chongqing Jilin
Gansu Inner Mongolia
Xinjiang Shanghai
Beijing Tianjin Hainan
Ningxia Qinghai
Tibet
Urban PopulationRural Population
123456789
10111213141516171819202122232425262728293031
Source: China Statistical Yearbook; THE BEIJING AXIS Analysis
2
4
3 5
1
Henan
Hainan
Shandong
Guangdong
JiangsuSichuan
31Tibet
30Qinghai 29
Ningxia
28
27 Tianjin
Population by Urban and Rural Residence and Province (mn, 2007)
Top 5Bottom 5
THE MAJORITY OF THE MOST POPULOUS PROVINCES ARE LOCATED IN MORE DEVELOPED AREAS IN EASTERN CHINA
Unsurprisingly, these areas also adjoin the coast or major waterways and have a solid agricultural or manufacturing base
-82-
0
100
200
300
400
500
600
700
800
1997 1998 1999 2000 2001 2002 2003 2004 2005 2006 2007
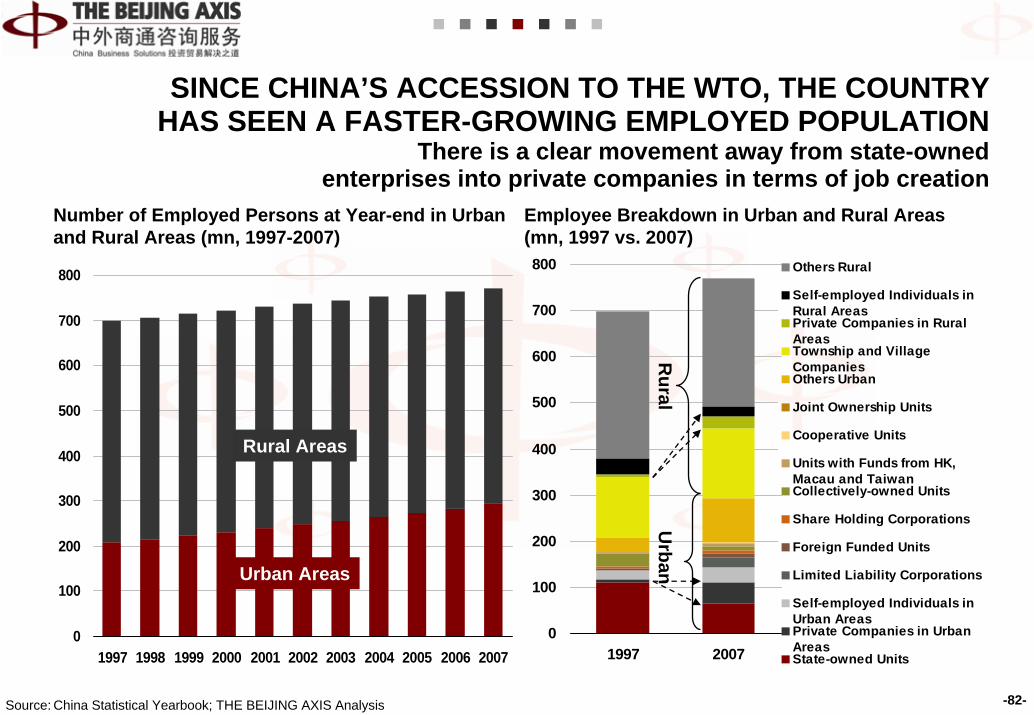
SINCE CHINA’S ACCESSION TO THE WTO, THE COUNTRY HAS SEEN A FASTER-GROWING EMPLOYED POPULATION
There is a clear movement away from state-owned enterprises into private companies in terms of job creation
Source: China Statistical Yearbook; THE BEIJING AXIS Analysis
Rural Areas
Urban Areas
Employee Breakdown in Urban and Rural Areas (mn, 1997 vs. 2007)
Number of Employed Persons at Year-end in Urban and Rural Areas (mn, 1997-2007)
0
100
200
300
400
500
600
700
800
1997 2007
Others Rural
Self-employed Individuals inRural Areas Private Companies in RuralAreas Township and VillageCompanies Others Urban
Joint Ownership Units
Cooperative Units
Units with Funds from HK,Macau and Taiwan Collectively-owned Units
Share Holding Corporations
Foreign Funded Units
Limited Liability Corporations
Self-employed Individuals inUrban Areas Private Companies in UrbanAreas State-owned Units
Rural
Urban

-83-
123456789
10111213141516171819202122232425262728293031
Source: China Statistical Yearbook; THE BEIJING AXIS Analysis
3
451
2
HainanGuangdong
31Tibet
30Qinghai
29
Ningxia
28
27
ShandongJiangsu
Tianjin
SichuanHenan
Number of Employed Persons by Province (mn, 2007)
PREDICTABLY, THE MORE POPULATED PROVINCES HAVE THE HIGHEST NUMBER OF EMPLOYED PERSONS
The majority of the workforce can be found in townships, villages and private companies, underscoring the country’s agricultural and manufacturing roots
0 10 20 30 40 50 60
TibetQinghaiNingxiaHainanTianjin
XinjiangShanghai
InnerJilin
BeijingGansu
ShanxiHeilongjiang
ChongqingShaanxi
FujianLiaoning
JiangxiGuizhouYunnan
GuangxiHubeiHebeiAnhui
ZhejiangHunan
JiangsuSichuan
ShandongGuangdong
Henan
Urban Areas
Rural Areas
Inner Mongolia
Top 5Bottom 5

-84-
0
100
200
300
400
500
600
700
800
78 81 84 87 90 93 96 99 02 05
Primary Industry
Secondary Industry
Tertiary Industry
Primary Industry
41%
Tertiary Industry
32%
Secondary Industry
27%
Note: The sizeable gap between the 1989 and 1990 figures is due to the adjustment of urban and rural employed persons subtotals in accordance with the data obtained from the 5th National Population Census
Source: China Statistical Yearbook; THE BEIJING AXIS Analysis
2007
FOLLOWING THE TREND SET BY DEVELOPED COUNTRIES, CHINA IS STEADILY DEVELOPING ITS SERVICES SECTOR
However, a large portion of the population is still employed in the primary and secondary sectors
07
Total Employed Persons By Sector (mn, 1978-2007)

-85-
622
931
655 707 759 829
1,0241,138
1,281
1,475
1,813
2,271
672545
450397355317299
286272267261252
0
500
1,000
1,500
2,000
2,500
1997 1998 1999 2000 2001 2002 2003 2004 2005 2006 2007 20080%
5%
10%
15%
20%
25%
30%Urban Rural Urban Growth Rural Growth
Annual Disposable Income of Urban Households andNet Income of Rural Households Per Capita (USD, 1997-2008)
INCOME LEVELS OF URBAN AND RURAL HOUSEHOLDS HAVE BEEN STEADILY INCREASING
Urban households initially saw a higher growth rate than their rural counterparts, but this disparity in growth rates has decreased in recent years
Note: Growth rates are calculated at current pricesSource: National Statistics Database; THE BEIJING AXIS Analysis

-86-
123456789
10111213141516171819202122232425262728293031
Source: National Statistics Database; THE BEIJING AXIS Analysis
Guangdong
Shanghai
Zhejiang
Tianjin
Beijing
1
5
4
3
231
30
29
28
27
Gansu
Guizhou
Qinghai
Xinjiang
Tibet
Disposable Income of Urban Households and Income of Rural Households Per Capita by Province (USD, 2008)
INCOME LEVELS ARE PARTICULARLY HIGH IN THE MORE DEVELOPED EASTERN COASTAL PROVINCES
As the political and commercial capitals of China, Beijing and Shanghai maintain their status as the two most attractive cities in terms of income levels
0 2,000 4,000 6,000
ShanghaiBeijing
ZhejiangTianjin
GuangdongJiangsu
FujianShandong
LiaoningChongqingInner Mong
HunanHebei
GuangxiHubei
JilinHenan
JiangxiShanxi
AnhuiHainan
SichuanNingxia
HeilongjianYunnan
ShaanxiTibet
XinjiangQinghaiGuizhou
Gansu
Urban
Rural
Inner Mongolia
Top 5Bottom 5

-87-
25
35
45
55
65
75
1978 1980 1982 1984 1986 1988 1990 1992 1994 1996 1998 2000 2002 2004 2006 2008
Urban Area Rural Area
1. Engel's Law states that household expenditure on food, on aggregate, declines as income rises; in other words, the income elasticity of demand for food in the aggregate is less than one and declines towards zero with income growth. A common application of this statistic is to regard it as a reflection of the living standards of a country. Engel’s coefficient has an inverse correlation with the standard of living of a country
Source: China Statistical Yearbook; THE BEIJING AXIS Analysis
43.7
37.9
57.5
67.7
Urban and Rural Engel’s Coefficients (%, 1978-2008)
PEOPLE IN CHINA ARE GRADUALLY SPENDING RELATIVELY LESS ON FOOD, DUE TO INCREASING INCOME LEVELS
The downward trend of Engel’s coefficient1 is expected to continue as this reflects a progressively higher standard of living
High food inflation caused temporary increase
High food inflation caused temporary increase

-88-
Note: The Gini Coefficient is a measure of statistical dispersion. It is most prominently used as a measure of inequality of income distribution or inequality of wealth distribution. It is defined as a ratio with values between 0 and 1. A low Gini Coefficient indicates more equal income or wealth distribution, while a high Gini Coefficient indicates more unequal distribution
Source: National Statistics Database; THE BEIJING AXIS Analysis
Gini Coefficient (1997-2008)
ATHOUGH INCOME LEVELS HAVE BEEN INCREASING, THERE IS STILL LARGE INEQUALITY IN THE DISTRIBUTION OF INCOME
The inequality of wealth distribution is particularly striking when the urban-rural divide is examined
0.30 0.31 0.310.29
0.27 0.26 0.26 0.26
0.32 0.32 0.33 0.34 0.330.35
0.370.39 0.40 0.39
0.37 0.37 0.38 0.390.41 0.40
0.43 0.44 0.44 0.45 0.46 0.46
0.51
0.00
0.10
0.20
0.30
0.40
0.50
0.60
1978 1980 1982 1984 1986 1988 1990 1992 1994 1996 1998 2000 2002 2004 2006 2008

-89-
95.2
78.4
50.5
10.22.6
13.6
15.4
9.9
24.2
27.6
51.1
16.7
17
38.6
1.81.2
5.1 2.40.8
1.3 19.46.97.42
1985 1995 2005 2015 2025
Global Affluent
(>USD25,000)
Mass Affluent
(USD12,500-USD25,000)
Upper Middle Class
(USD5,100-USD12,500)
Lower Middle Class
(USD3,200-USD5,100)
Poor (≦USD3,200)
99.392.9
77.3
23.29.7
5.7
12.6
49.7
9.4
21.2
59.4
5.67.7
0.5
19.8
1.3 0.5 0.4 3.3
1985 1995 2005 2015 202566 109 191 280 373 64 204 644 1,574 3,267
Segments by Annual Income
Urban Households (mn) Urban Disposable Income (USD)
1
1 11
1. Base forecast. Certain figures do not amount to 100% due to the effects of roundingSource: National Bureau of Statistics of China; McKinsey Global Institute Analysis; THE BEIJING AXIS Analysis
Share of Chinese Urban Households (%) Share of Total Urban Disposable Income (%)
A LARGE MIDDLE CLASS IS DEVELOPINGIN CHINA’S URBAN AREAS
In 2025, China will potentially have more than 350 million urbanhouseholds with a annual disposable income of more than USD3,200

-90-
0
10
20
30
40
50
1978 1980 1982 1984 1986 1988 1990 1992 1994 1996 1998 2000 2002 2004 2006 2008
Urbanisation Rate (%, 1978-2008)
CHINA’S URBANISATION RATE HAS INCREASED FROM 18% IN 1978 TO 44.9% IN 2008, WITH THE URBAN POPULATION
REACHING 595 MILLION However, China’s urbanization rate is currently still
lower than the world average (50%)
Source: China Statistical Yearbook; THE BEIJING AXIS Analysis

-91-
AGENDAForeword
History
Country Profile
China Economic Indicators
International Comparison
Selected Macroeconomic IndicatorsTrade Indicators: Domestic & ForeignInvestment Indicators: Domestic & ForeignFinancial IndicatorsSocial Indicators
Conclusions
Implications
About THE BEIJING AXIS
Disclaimer

-92-
GDP of Top 30 Economies (USD bn, % of World GDP, 2008)
0
1,000
2,000
3,000
4,000
5,000
USA
Japa
n
Chi
na
Ger
man
y
Fran
ce UK
Italy
Rus
sia
Spai
n
Bra
zil
Can
ada
Indi
a
Mex
ico
Aus
tral
ia
S. K
orea
Net
her.
Turk
ey
Pola
nd
Indo
nesi
a
Bel
gium
Switz
er.
Swed
en
Saud
i Ara
bia
Nor
way
Aus
tria
Taiw
an
Gre
ece
Iran
Den
mar
k
Arg
entin
a
23.5%
8.1%
7.3%
6.0%
4.7%4.4%
3.8%
2.8% 2.7%2.6% 2.5%2.0%1.8%1.7%1.6%1.4%1.2% 0.9%0.8% 0.8%0.8%0.8% 0.8%0.8%0.7% 0.6% 0.6%0.6% 0.6% 0.5%
The US economy is the world’s largest, reaching
USD14.26 tn in 2008
Note: Nether. = Netherlands; Switzer. = Switzerland Source: IMF; THE BEIJING AXIS Analysis
IN 2008, CHINA WAS THE WORLD’S THIRD-LARGEST ECONOMY China’s GDP amounted to USD4.4 trillion, more than double the size
of other developing economies such as Russia, Brazil or India
World GDP in 2008 was
USD 60.7 tn

-93-Source: China Statistical Yearbook; IMF; THE BEIJING AXIS Analysis
China GDP by Province Compared with Similar World Economies (USD bn, 2007)
PolandAustriaGreeceFinland
UAEMalaysia
SingaporePhilippines
HungaryEgypt
Central AmericaKuwait
PeruKazakhstan
CaribbeanMorocco
Slovak RepublicBangladesh
QatarVietnam
LibyaAngolaCroatia
LuxembourgSudan
TunisiaGuatemala
JordanBotswana
NepalZimbabwe
SOME CHINESE PROVINCES’ GDP ARE THE SAME SIZE AS NATIONAL ECONOMIES IN EUROPE, ASIA, AFRICA, S. AMERICA
For example, the size of the Guangdong economy is larger than that of Austria, Greece and Finland
409342339
247198
180160
145138
123122121121
9793
8078757272706662
5446
3636
1612105
75 74
107
128 144
119
105
422 371
314 246
187 191
161 138
112
93
75
71
5 10 12 16
34 35
46 50 51
61 70 73
500 400 300 200 100 0 100 200 300 400 500
Guangdong Shandong Jiangsu Zhejiang Henan Hebei Shanghai Liaoning Sichuan Beijing Fujian Hubei Hunan Anhui Heilongjiang Inner Guangxi Shanxi Jiangxi Shaanxi Jilin Tianjin Yunnan Chongqing Xinjiang Guizhou Gansu Hainan Ningxia Qinghai Tibet
Inner Mongolia

-94-
0
1,000
2,000
3,000
4,000
5,000
6,000
1980 1982 1984 1986 1988 1990 1992 1994 1996 1998 2000 2002 2004 2006 2008
JapanGermanyChinaUKFranceItaly
Trend for the Past 9 Years
Source: IMF; THE BEIJING AXIS Analysis
GDP Top 6 Economies excl. the US (USD bn, 1980-2008)
THE SIZE OF CHINA’S ECONOMY HAS SEEN ADRAMATIC INCREASE IN THE PAST 10 YEARS
With a fourfold increase since 1998, China is now the third-largest economy after the US and Japan (but it is likely to overtake Japan within 2 years)
China
China

-95-
-4
0
4
8
12
16
80 82 84 86 88 90 92 94 96 98 00 02 04 06 08
World Average China y-o-y GDP growth US y-o-y GDP growth
Source: IMF; THE BEIJING AXIS Analysis
China vs. US, Annual GDP Growth (% y-o-y, 1980-2008)
SINCE 1980, CHINA HAS EXPERIENCED AN ANNUAL AVERAGE GDP GROWTH RATE OF 9.91%
Since the country’s economic reform, China’s growth rate has always been above the world average (3.4%); while the US has grown at 2.85% for the same period

-96-
Less than USD2,500 or no data
Brazil
RussiaEurope
JapanUS
India
China
USD25,000 or more USD10,000-USD25,000
USD2,500-USD10,000
Source: IMF; National Bureau of Statistics of China; THE BEIJING AXIS Analysis
Nominal GDP Per Capita (USD, 2008)
HOWEVER, CHINA’S GDP PER CAPITA IS STILL LOW COMPAREDTO THAT OF OTHER ECONOMIES OF SIMILAR SIZE
In 2008, China’s GDP per capita reached USD3,258
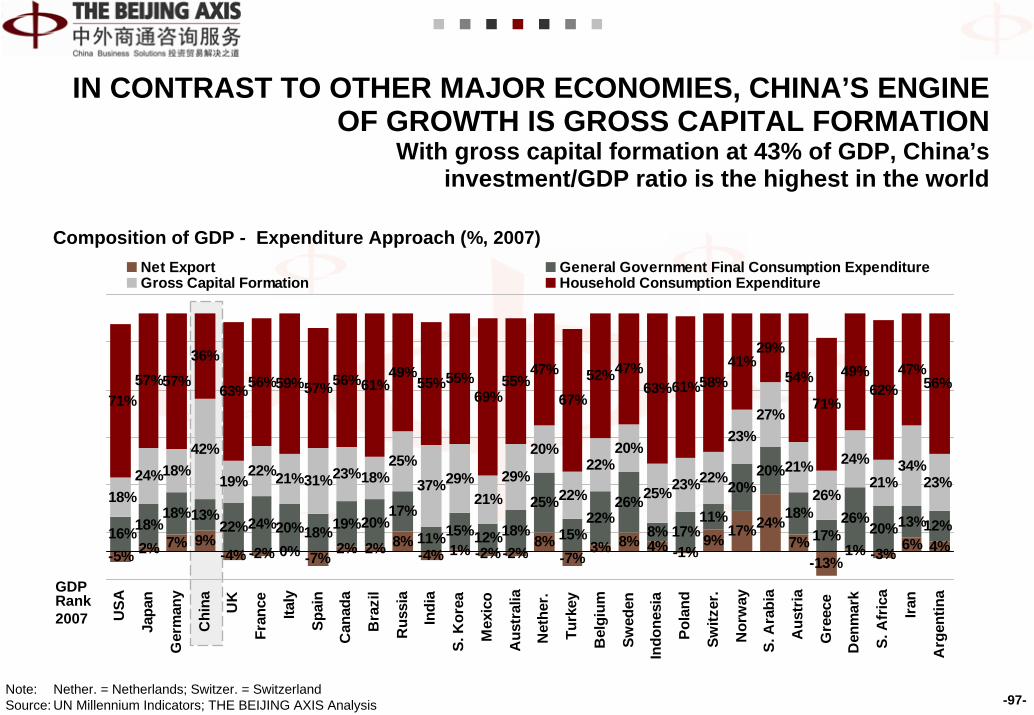
-97-
-5% 2% 7% 9%-4% -2% 0% -7% 2% 2% 8%
-4% 1% -2%-2%8%
-7%3% 8% 4% -1%
9% 17%24%7%
-13%1% -3% 6% 4%
16%18%18%13%
22%24%20%18%19%20%17%
11%15%12%18%
25%
15%22%
26%
8% 17%11%
20%20%
18%17%
26%20%13%12%
18%24%18%
42%
19%22%21%31%23%18%
25%37%29%
21%29%
20%
22%
22%20%
25%23%22%
23%27%
21%
26%
24%21%
34%23%
71%57%57%
36%
63%56%59%57%56%61%49%
55%55%69%
55%47%
67%52%47%
63%61%58%41%
29%
54%
71%
49%62%
47%56%
USA
Japa
n
Ger
man
y
Chi
na UK
Fran
ce
Italy
Spai
n
Can
ada
Bra
zil
Rus
sia
Indi
a
S. K
orea
Mex
ico
Aus
tral
ia
Net
her.
Turk
ey
Bel
gium
Swed
en
Indo
nesi
a
Pola
nd
Switz
er.
Nor
way
S. A
rabi
a
Aus
tria
Gre
ece
Den
mar
k
S. A
fric
a
Iran
Arg
entin
a
Net Export General Government Final Consumption ExpenditureGross Capital Formation Household Consumption Expenditure
GDP Rank2007
IN CONTRAST TO OTHER MAJOR ECONOMIES, CHINA’S ENGINE OF GROWTH IS GROSS CAPITAL FORMATION
With gross capital formation at 43% of GDP, China’s investment/GDP ratio is the highest in the world
Note: Nether. = Netherlands; Switzer. = SwitzerlandSource: UN Millennium Indicators; THE BEIJING AXIS Analysis
Composition of GDP - Expenditure Approach (%, 2007)

-98-
1% 2% 1%12%
1% 2% 2% 4% 2%8% 5%
20%
3% 4% 4% 2%11%
1% 1%13%
5% 2% 2% 3% 2% 5% 1% 3%11% 10%
20%25% 29%
48%
26% 21%29% 29% 29%
38%37%
19%41%
26% 26% 24%
29%
24% 28%
46%
31% 34%41%
67%
30% 21% 25%30%
42%36%
79%73% 70%
40%
73% 77%69% 67% 69%
54% 58% 61% 56%71% 70% 74%
59%
75% 71%
41%
64% 65%56%
30%
68%74% 74%
67%
47%55%
0%
50%
100%
USA
Japa
n
Ger
man
y
Chin
a
UK
Fran
ce
Italy
Spai
n
Cana
da
Braz
il
Russ
ia
Indi
a
S. K
orea
Mex
ico
Aus
tral
ia
Net
her.
Turk
ey
Belg
ium
Sw
eden
Indo
nesi
a
Pola
nd
Sw
itzer
.
Nor
way
S. A
rabi
a
Aus
tria
Gre
ece
Denm
ark
S. A
fric
a
Iran
Arge
ntin
a
Primary Industry Secondary Industry Tertiary Industry
Note: Nether. = Netherlands; Switzer. = SwitzerlandSource: CIA World Factbook; World bank; THE BEIJING AXIS Analysis
Share of GDP by Industry (%, 2007)
GDP Rank2007
CHINA’S ECONOMY IS DOMINATED BY ITS SECONDARY INDUSTRY, UNLIKE THE ECONOMIES OF OTHER MAJOR NATIONS
THAT ARE DRIVEN BY THE SERVICES INDUSTRY

-99-
AGENDAForeword
History
Country Profile
China Economic Indicators
International Comparison
Selected Macroeconomic IndicatorsTrade Indicators: Domestic & ForeignInvestment Indicators: Domestic & ForeignFinancial IndicatorsSocial Indicators
Conclusions
Implications
About THE BEIJING AXIS
Disclaimer

-100-
World’s Major Exporters (USD bn, 2007)
Note: To make international comparisons, this section utilises China’s export figure from the IMF (USD1,342 bn) instead of the one from MOFCOM (USD1,218 bn), which is used in the China Economic Indicators section
Source: IMF; THE BEIJING AXIS Analysis
0
500
1,000
1,500
2,000
0 20 40 60 80 100 120 140
USGermany
China
Exports
Exports/GDP
Belgium
Malaysia
Japan
BrazilAustralia Turkey
FranceUK
Italy
SpainRussia
Mexico
S. Korea
Norway
Sweden
Canada
Poland
S. Arabia
AustriaDenmark
Switzerland
Netherlands
Thailand
IrelandCzech Republic
Size of bubble represents
nominal GDP
IN 2007, CHINA WAS THE WORLD’S THIRD-LARGESTEXPORTER AFTER THE US AND GERMANY
In 2007, China exported a total of USD1,342 bn, about 40% of its GDP, leaving a large gap to the next top exporter, Japan, with exports of USD807 bn
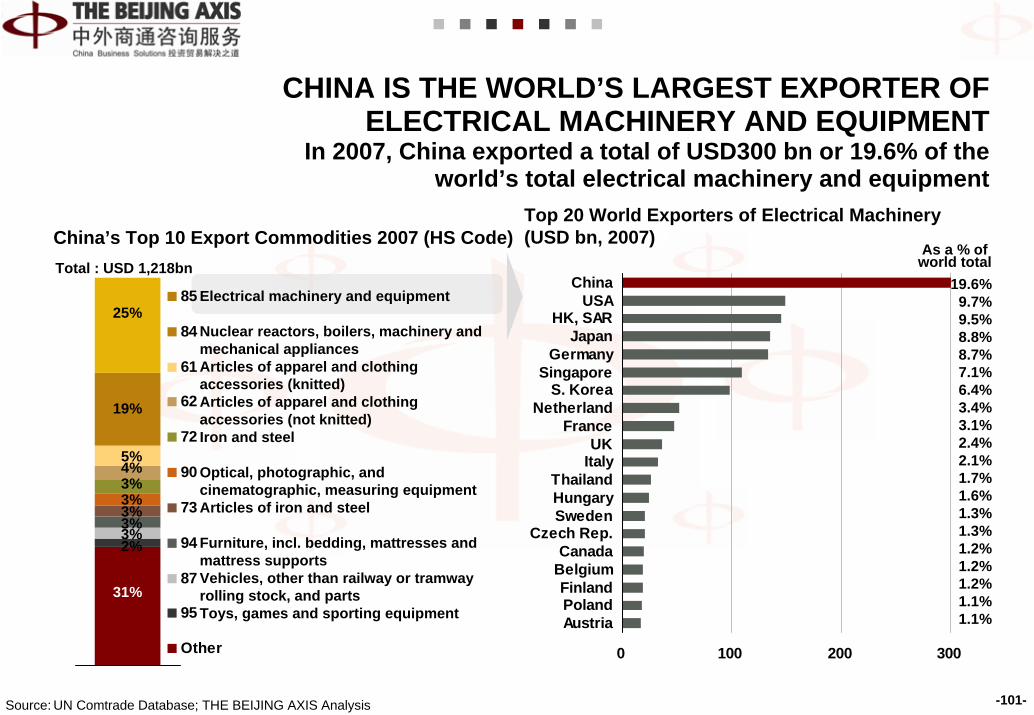
-101-
Electrical machinery and equipment
Nuclear reactors, boilers, machinery and mechanical appliancesArticles of apparel and clothing accessories (knitted)Articles of apparel and clothing accessories (not knitted)Iron and steel
Optical, photographic, and cinematographic, measuring equipmentArticles of iron and steel
Furniture, incl. bedding, mattresses and mattress supportsVehicles, other than railway or tramway rolling stock, and partsToys, games and sporting equipment
85
84
61
62
72
90
73
94
87
95
Other 0 100 200 300
ChinaUSA
HK, SARJapan
GermanySingapore
S. KoreaNetherland
FranceUK
ItalyThailandHungarySweden
Czech Rep.Canada
BelgiumFinlandPolandAustria
19.6%9.7%9.5%8.8%8.7%7.1%6.4%3.4%3.1%2.4%2.1%1.7%1.6%1.3%1.3%1.2%1.2%1.2%1.1%1.1%
Total : USD 1,218bn
China’s Top 10 Export Commodities 2007 (HS Code)Top 20 World Exporters of Electrical Machinery (USD bn, 2007)
25%
19%
5%4%3%
2%
31%
3%3%3%3%
CHINA IS THE WORLD’S LARGEST EXPORTER OF ELECTRICAL MACHINERY AND EQUIPMENT
In 2007, China exported a total of USD300 bn or 19.6% of the world’s total electrical machinery and equipment
As a % of world total
Source: UN Comtrade Database; THE BEIJING AXIS Analysis

-102-
0 100 200 300
GermanyChina
USAJapan
ItalyNetherland
UKFrance
SingaporeHK, SARS. KoreaBelgiumCanadaAustria
ThailandSweden
SwitzerlandCzech Rep.
SpainIreland
14.7%13.9%12.1%
8.5%6.5%4.5%4.3%4.2%3.1%2.7%2.6%2.1%2.0%1.8%1.7%1.6%1.6%1.5%1.3%1.2%
85
84
61
62
72
90
73
94
87
95
Other
China’s Top 10 Export Commodities 2007 (HS Code)Top 20 World Exporters of Power Generation Equipment (USD bn, 2007)
Source: UN Comtrade Database; THE BEIJING AXIS Analysis
25%
19%
5%4%3%
2%
31%
3%3%3%3%
Total : USD 1,218bn As a % of world total
Electrical machinery and equipment
Nuclear reactors, boilers, machinery and mechanical appliancesArticles of apparel and clothing accessories (knitted)Articles of apparel and clothing accessories (not knitted)Iron and steel
Optical, photographic and cinematographic, measuring equipmentArticles of iron and steel
Furniture, incl. bedding, mattresses and mattress supportsVehicles, other than railway or tramway rolling stock, and partsToys, games and sporting equipment
CHINA IS THE WORLD’S SECOND-LARGEST EXPORTER OF MACHINERY AND MECHANICAL APPLIANCES
In 2007, China exported a total of USD228 bn or13.9% of the world’s power generation equipment

-103-
0 20 40 60 80
ChinaHK, SAR
ItalyTurkey
GermanyFrance
BelgiumUK
NetherlandsSpain
PortugalUSA
ThailandDenmark
SingaporeRomania
AustriaGuatemala
S. KoreaGreece
44.8%10.5%
6.0%5.9%4.5%3.0%2.8%1.9%1.8%1.8%1.7%1.5%1.5%1.2%0.9%0.8%0.8%0.7%0.7%0.7%
85
84
61
62
72
90
73
94
87
95
Other
Top 20 World Exporters of Knitted Articles of Apparel (USD bn, 2007)
Source: UN Comtrade Database; THE BEIJING AXIS Analysis
25%
19%
5%4%3%
2%
31%
3%3%3%3%
Total : USD 1,218bn
Electrical machinery and equipment
Nuclear reactors, boilers, machinery and mechanical appliancesArticles of apparel and clothing accessories (knitted)Articles of apparel and clothing accessories (not knitted)Iron and steel
Optical, photographic and cinematographic, measuring equipmentArticles of iron and steel
Furniture, incl. bedding, mattresses and mattress supportsVehicles, other than railway or tramway rolling stock, and partsToys, games and sporting equipment
China’s Top 10 Export Commodities 2007 (HS Code)
CHINA IS THE WORLD’S LARGEST EXPORTER OF KNITTED ARTICLES OF APPAREL AND CLOTHING ACCESSORIES
In 2007, China exported a total of USD61 bn or 44.8%of the world’s knitted apparel and clothing accessories
As a % of world total

-104-
0 20 40 60
ChinaItaly
HK, SARGermany
FranceTurkey
BelgiumSpain
RomaniaUK
NetherlandsDenmark
PolandUSA
ThailandAustria
SwitzerlandPortugalBulgaria
Czech Rep.
85
84
61
62
72
90
73
94
87
95
Other
35.7%10.2%
9.7%6.7%4.5%4.1%3.1%2.7%2.4%2.3%2.1%1.5%1.3%1.2%1.0%0.9%0.9%0.9%0.9%0.7%
Top 20 World Exporters of Un-knitted Articles of Apparel (USD bn, 2007)
Source: UN Comtrade Database; THE BEIJING AXIS Analysis
25%
19%
5%4%3%
2%
31%
3%3%3%3%
Total : USD 1,218bn
Electrical machinery and equipment
Nuclear reactors, boilers, machinery and mechanical appliancesArticles of apparel and clothing accessories (knitted)Articles of apparel and clothing accessories (not knitted)Iron and steel
Optical, photographic and cinematographic, measuring equipmentArticles of iron and steel
Furniture, incl. bedding, mattresses and mattress supportsVehicles, other than railway or tramway rolling stock, and partsToys, games and sporting equipment
China’s Top 10 Export Commodities 2007 (HS Code)
CHINA IS THE WORLD’S LARGEST EXPORTER OF NON-KNITTED ARTICLES OF APPAREL AND CLOTHING ACCESSORIES
In 2007, China exported a total of USD47 bn or 35.7% ofthe world’s non-knitted apparel and clothing accessories
As a % of world total

-105-
0 20 40 60
ChinaGermany
JapanBelgium
RussiaFrance
USAItaly
S. KoreaNetherland
UKSweden
SpainTurkeyAustria
S. AfricaFinlandCanada
Czech Rep.Poland
85
84
61
62
72
90
73
94
87
95
Other
11.1%10.0%
8.4%7.2%5.9%5.7%4.8%4.7%4.6%4.1%3.4%2.7%2.7%2.3%2.2%2.1%1.8%1.7%1.3%1.3%
Top 20 World Exporters of Iron and Steel(USD bn, 2007)
Source: UN Comtrade Database; THE BEIJING AXIS Analysis
25%
19%
5%4%3%
2%
31%
3%3%3%3%
Total : USD 1,218bn
Electrical machinery and equipment
Nuclear reactors, boilers, machinery and mechanical appliancesArticles of apparel and clothing accessories (knitted)Articles of apparel and clothing accessories (not knitted)Iron and steel
Optical, photographic and cinematographic, measuring equipmentArticles of iron and steel
Furniture, incl. bedding, mattresses and mattress supportsVehicles, other than railway or tramway rolling stock, and partsToys, games and sporting equipment
China’s Top 10 Export Commodities 2007 (HS Code)
CHINA IS THE WORLD’S LARGEST EXPORTER OF IRON AND STEEL
In 2007, China exported a total of USD40 bn or 11.1% of the world’s iron and steel
As a % of world total

-106-
-400
-200
0
200
400
USA
Japa
n
Ger
man
y
Chi
na UK
Fran
ce
Italy
Spai
n
Can
ada
Bra
zil
Rus
sia
Indi
a
S. K
orea
Mex
ico
Aus
tral
ia
Net
her.
Turk
ey
Bel
gium
Swed
en
Indo
nesi
a
Pola
nd
Switz
er.
Nor
way
S. A
rabi
a
Aus
tria
Gre
ece
Den
mar
k
S. A
fric
a
Iran
Arg
entin
a
Note: To make international comparisons, this section utilises the China trade surplus figure from the IMF (USD307 bn) instead of the one from MOFCOM (USD352 bn), which is used in the rest of this document
Source: IMF; THE BEIJING AXIS Analysis
As % of GDP -5.1 1.9 7.2 9.4 -3.7 -1.5 -0.2 -6.5 1.8 2.0 8.6 0.0 0.9 -1.6 -1.8 6.9 -5.0 1.8 7.4 4.8 -2.6 10.7 15.7 33.7 5.0 -11 2.1 -3.2 0 5.0
18 5 23 20 -238 -199 -182 -234 7 -205 26 -100 -203 31 -221 7 21 n/a 7 43 5 11 15 16 -217 11 2 -216 -100 -206CAGR %97-07
-700
Trade Surpluses of the World’s Major Economies (USD bn, 2007)
DESPITE NOT BEING THE WORLD’S LARGEST EXPORTER,CHINA HAS THE WORLD’S LARGEST TRADE SURPLUS
In 2007, China’s total trade surplus reached USD307 bn, which is 28% higher than that of Germany, the world’s largest exporter

-107-
World’s Major Importers (USD bn, 2007)
0
700
1,400
2,100
2,800
0 20 40 60 80 100
US
Brazil
Japan
RussiaAustralia
Turkey
FranceUK
China
Italy
Saudi ArabiaNorway
Mexico
CanadaSpain
Germany
PolandSweden
S. Korea
Denmark
SwitzerlandAustria
NetherlandsThailand
Ireland
Czech Republic
BelgiumMalaysia
Size of bubble represents
nominal GDP
Note: To make international comparisons, this section utilises China’s import figure from the IMF (USD1,035 bn) instead of the one from MOFCOM (USD956 bn), which is used in the China Economic Indicators section
Source: IMF; THE BEIJING AXIS Analysis
Imports
Imports/GDP
IN 2007, CHINA WAS THE WORLD’S THIRD-LARGESTIMPORTER AFTER THE US AND GERMANY
In 2007, China imported a total of USD1,035 bn, about 32% of its GDP
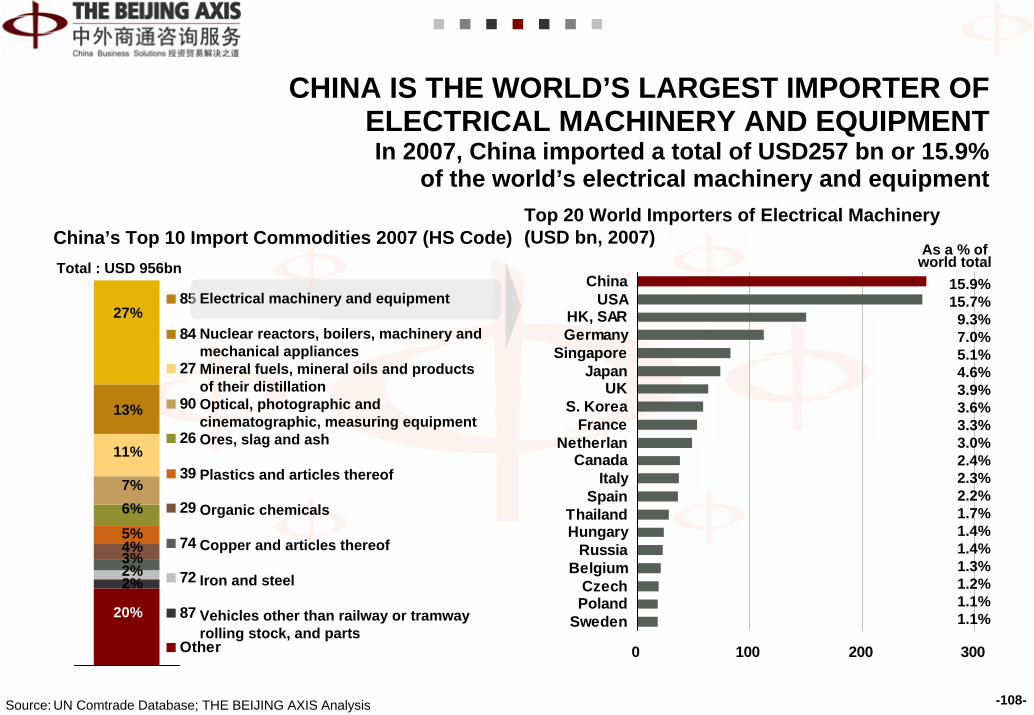
-108-
0 100 200 300
ChinaUSA
HK, SARGermany
SingaporeJapan
UKS. Korea
FranceNetherlan
CanadaItaly
SpainThailandHungary
RussiaBelgium
CzechPoland
Sweden
15.9%15.7%
9.3%7.0%5.1%4.6%3.9%3.6%3.3%3.0%2.4%2.3%2.2%1.7%1.4%1.4%1.3%1.2%1.1%1.1%
85
84
27
90
26
39
29
74
72
87
Other
Electrical machinery and equipment
Nuclear reactors, boilers, machinery and mechanical appliancesMineral fuels, mineral oils and products of their distillationOptical, photographic and cinematographic, measuring equipmentOres, slag and ash
Plastics and articles thereof
Organic chemicals
Copper and articles thereof
Iron and steel
Vehicles other than railway or tramway rolling stock, and parts
27%
13%
11%
7%6%5%4%3%2%2%
20%
Total : USD 956bn
China’s Top 10 Import Commodities 2007 (HS Code)Top 20 World Importers of Electrical Machinery (USD bn, 2007)
As a % of world total
CHINA IS THE WORLD’S LARGEST IMPORTER OF ELECTRICAL MACHINERY AND EQUIPMENT In 2007, China imported a total of USD257 bn or 15.9%
of the world’s electrical machinery and equipment
Source: UN Comtrade Database; THE BEIJING AXIS Analysis

-109-
0 100 200 300
USAGermany
ChinaUK
FranceNetherlands
CanadaJapan
ItalyHK, SAR
SpainSingapore
S. KoreaBelgium
RussiaAustralia
AustriaTurkeyPoland
Sweden
16.9%8.8%8.2%5.5%5.2%3.9%3.9%3.7%3.3%3.0%2.9%2.8%2.6%2.4%2.1%1.6%1.5%1.5%1.5%1.4%
85
84
27
90
26
39
29
74
72
87
Other
Top 20 World Importers of Power Generation Equipment (USD bn, 2007)
27%
13%
11%
7%6%5%4%3%2%2%
20%
As a % of world total
China’s Top 10 Import Commodities 2007 (HS Code)
Electrical machinery and equipment
Nuclear reactors, boilers, machinery and mechanical appliancesMineral fuels, mineral oils and products of their distillationOptical, photographic and cinematographic, measuring equipmentOres, slag and ash
Plastics and articles thereof
Organic chemicals
Copper and articles thereof
Iron and steel
Vehicles other than railway or tramway rolling stock, and parts
Total : USD 956bn
CHINA IS THE WORLD’S THIRD-LARGEST IMPORTER OF MACHINERY AND MECHANICAL APPLIANCES
In 2007, China imported a total of USD124 bn or 8.2% of the world’s power generation equipment
Source: UN Comtrade Database; THE BEIJING AXIS Analysis
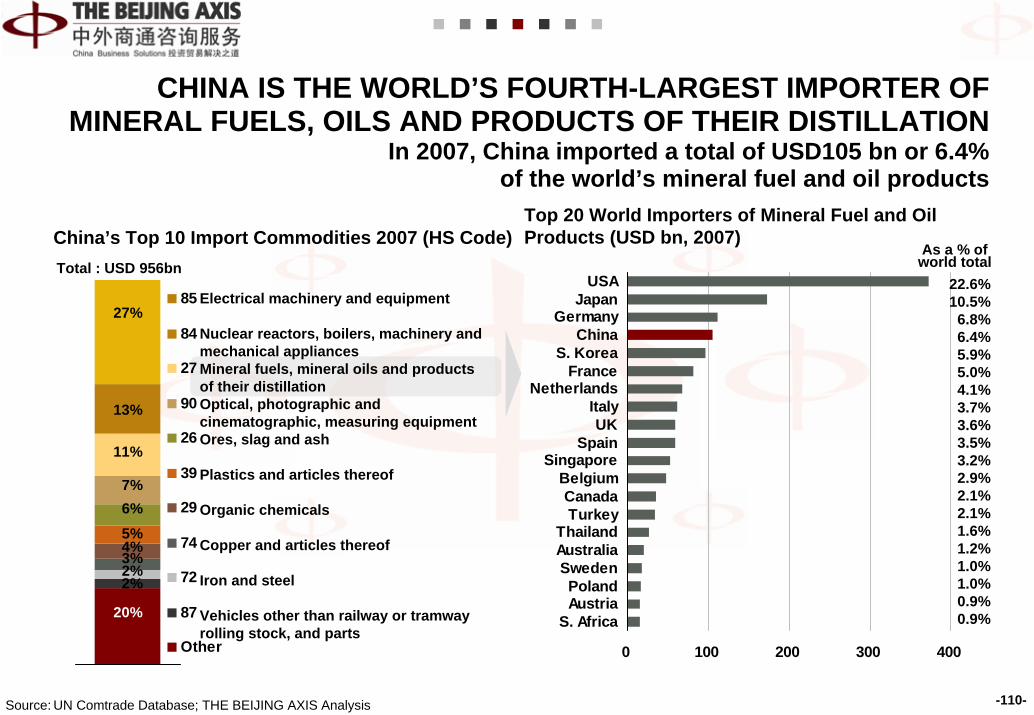
-110-
0 100 200 300 400
USAJapan
GermanyChina
S. KoreaFrance
NetherlandsItalyUK
SpainSingapore
BelgiumCanadaTurkey
ThailandAustraliaSwedenPolandAustria
S. Africa
22.6%10.5%
6.8%6.4%5.9%5.0%4.1%3.7%3.6%3.5%3.2%2.9%2.1%2.1%1.6%1.2%1.0%1.0%0.9%0.9%
85
84
27
90
26
39
29
74
72
87
Other
Top 20 World Importers of Mineral Fuel and Oil Products (USD bn, 2007)
27%
13%
11%
7%6%5%4%3%2%2%
20%
As a % of world total
China’s Top 10 Import Commodities 2007 (HS Code)
Electrical machinery and equipment
Nuclear reactors, boilers, machinery and mechanical appliancesMineral fuels, mineral oils and products of their distillationOptical, photographic and cinematographic, measuring equipmentOres, slag and ash
Plastics and articles thereof
Organic chemicals
Copper and articles thereof
Iron and steel
Vehicles other than railway or tramway rolling stock, and parts
Total : USD 956bn
CHINA IS THE WORLD’S FOURTH-LARGEST IMPORTER OF MINERAL FUELS, OILS AND PRODUCTS OF THEIR DISTILLATION
In 2007, China imported a total of USD105 bn or 6.4% of the world’s mineral fuel and oil products
Source: UN Comtrade Database; THE BEIJING AXIS Analysis

-111-
0 20 40 60 80
ChinaUSA
GermanyJapan
FranceUK
NetherlandsS. KoreaHK, SAR
ItalyCanada
BelgiumSingapore
SpainRussia
SwitzerlandAustraliaSwedenPolandAustria
85
84
27
90
26
39
29
74
72
87
Other
19.6%15.5%
7.6%5.9%4.6%4.5%4.0%3.4%3.3%3.1%2.9%2.3%2.1%2.0%1.7%1.5%1.5%1.2%1.1%1.0%
Top 20 World Importers of Optical, Photographic and Cinematographic Equipment (USD bn, 2007)
27%
13%
11%
7%6%5%4%3%2%2%
20%
As a % of world total
China’s Top 10 Import Commodities 2007 (HS Code)
Electrical machinery and equipment
Nuclear reactors, boilers, machinery and mechanical appliancesMineral fuels, mineral oils and products of their distillationOptical, photographic and cinematographic, measuring equipmentOres, slag and ash
Plastics and articles thereof
Organic chemicals
Copper and articles thereof
Iron and steel
Vehicles other than railway or tramway rolling stock, and parts
Total : USD 956bn
CHINA IS THE WORLD’S LARGEST IMPORTER OF OPTICAL, PHOTOGRAPHIC AND CINEMATOGRAPHIC EQUIPMENT
In 2007, China imported a total of USD70 bn or 19.6% of the world’s optical, photographic, cinematographic, and measuring equipment
Source: UN Comtrade Database; THE BEIJING AXIS Analysis

-112-
0 20 40 60
ChinaJapan
S. KoreaGermany
SpainUK
BelgiumUSA
FinlandCanada
NetherlandsItaly
FranceBulgaria
AustriaRussia
SwedenChile
PolandTurkey
85
84
27
90
26
39
29
74
72
87
Other
38.2%17.9%
6.6%5.9%3.4%2.8%2.6%2.4%2.2%2.1%1.8%1.8%1.4%1.1%1.0%0.9%0.9%0.8%0.7%0.5%
Top 20 World Importers of Ores, Slag and Ash (USD bn, 2007)
27%
13%
11%
7%6%5%4%3%2%2%
20%
Electrical machinery and equipment
Nuclear reactors, boilers, machinery and mechanical appliancesMineral fuels, mineral oils and products of their distillationOptical, photographic and cinematographic, measuring equipmentOres, slag and ash
Plastics and articles thereof
Organic chemicals
Copper and articles thereof
Iron and steel
Vehicles other than railway or tramway rolling stock, and parts
Total : USD 956bn As a % of world total
China’s Top 10 Import Commodities 2007 (HS Code)
CHINA IS THE WORLD’S LARGEST IMPORTER OF ORESIn 2007, China imported a total of USD54 bn
or 38.2% of the world’s ore, slag and ash
Source: UN Comtrade Database; THE BEIJING AXIS Analysis

-113-
AGENDAForeword
History
Country Profile
China Economic Indicators
International Comparison
Selected Macroeconomic IndicatorsTrade Indicators: Domestic & ForeignInvestment Indicators: Domestic & ForeignFinancial IndicatorsSocial Indicators
Conclusions
Implications
About THE BEIJING AXIS
Disclaimer

-114-
0 70 140 210 280 350
USAUK
FranceGermany
SpainItaly
JapanCanada
HK, SARLuxembourSwitzerland
BelgiumRussia
SwedenAustria
NetherlandAustralia
B. Virgin Is.China
Ireland
0 50 100 150 200 250
USAUK
FranceCanada
NetherlandsChina
HK, SARSpain
RussiaGermanyBelgium
SwitzerlandItaly
BrazilAustriaIrelandMexico
SaudiSingapore
India
China ranks 6th
China ranks 19th
Top 20 World FDI Outflows (USD bn, 2007)
Note: To make international comparisons, this section utilises China’s FDI figure (USD83.4 bn) and China’s OFDI figure (USD22.4 bn) from the WIR 2008 instead of the MOFCOM figures (USD74.7 bn and USD26.5 bn, respectively) that is used in the China Economic Indicators section
Source: WIR 2008; THE BEIJING AXIS Analysis
Top 20 World FDI Inflows (USD bn, 2007)
IN 2007, CHINA’S FDI INFLOW WAS SUBSTANTIALLY GREATER THAN ITS FDI OUTFLOW
China ranked 6th in the world in 2007 for FDI inflow with USD83 bn,while it ranked only 19th for OFDI with USD22 bn

-115-
0 500 1,000 1,500 2,000 2,500 3,000
USAUK
FranceGermanyHK, SAR
NetherlandSpain
SwitzerlanJapan
CanadaItaly
SwedenAustralia
RussiaDenmark
TaiwanB. Virgin Is.Singapore
IrelandNorway
China
0 500 1,000 1,500 2,000 2,500
USAUK
HK, SARFrance
NetherlandsGermany
SpainCanada
ItalyBrazilChina
RussiaAustralia
SwitzerlandMexico
SwedenSingapore
IrelandDenmark
Turkey
Top 20 World FDI Inward Stock (USD bn, 2007) Top 20 World FDI Outward Stock (USD bn, 2007)
China ranks 11th
China ranks 25th… …
CHINA IS THE SECOND-LARGEST ASIAN RECIPIENT OF FDI STOCK
In 2007, China ranked 11th for FDI stock with USD327 bn, while for OFDI it ranked 25th with USD95 bn
Source: WIR 2008; THE BEIJING AXIS Analysis

-116-
60
40
20
0
20
40
60
80
USA
Japa
n
Ger
man
y
Chi
na UK
Fran
ce
Italy
Spai
n
Can
ada
Bra
zil
Rus
sia
Indi
a
S. K
orea
Mex
ico
Aus
tral
ia
Net
her.
Turk
ey
Bel
gium
Swed
en
Indo
nesi
a
Inward Outward
Note: GFCF = Gross Fixed Capital Formation; Nether. = NetherlandsSource: WIR 2008; THE BEIJING AXIS Analysis
172% 19% 24% 7% 37% 16% 22% 28% 11% 20% 21% 43% 43% 5% 182% -44% 14% 6% 2% 0%
28% 94% -1% -8% -1% 14% 19% 16% 45% 12% 27% 25% -33% 3% 179% 18% 16% -2% 15% -20%
CAGR 2005-2007
Top 20 GDP Countries FDI In/Out Flow as a % of Gross Fixed Capital Formation (%, 2007)CAGR
2005-2007
IN 2007, BOTH CHINA’S FDI INFLOWS AND OUTFLOWS, AS A PERCENTAGE OF GFCF, WERE RELATIVELY SMALL
In 2005-2007, China’s FDI outflows grew faster than its FDI inflows

-117-
160
80
0
80
160
USA
Japa
n
Ger
man
y
Chi
na UK
Fran
ce
Italy
Spai
n
Can
ada
Bra
zil
Rus
sia
Indi
a
S. K
orea
Mex
ico
Aus
tral
ia
Net
her.
Turk
ey
Bel
gium
Swed
en
Indo
nesi
a
Inward Outward
5% 9% 3% 3% 0% 6% 5% 5% 1% 3% 12% 26% 3% 17% 4% 4% 4% n/a 4% 2%
2% 13% 4% -6% 6% 9% 6% 4% 3% 3% 9% 8% 7% 7% 2% 4% 15% n/a 5% -1%
CAGR 2000-2007
CAGR 2000-2007
Note: Nether. = NetherlandsSource: WIR 2008; THE BEIJING AXIS Analysis
Top 20 GDP Countries FDI Stock as a % of GDP (%, 2007)
IN 2007, BOTH CHINA’S INWARD AND OUTWARD FDI STOCKS, AS A PERCENTAGE OF GDP, WERE RELATIVELY SMALL
China’s small inward and outward FDI stocks, as a percentage of GDP, show substantial potential for growth

-118-
0 100 200 300 400
USAUK
NetherlandsCanada
GermanySpain
FranceAustraliaBermuda
SwitzerlandItaly
Hong KongRussiaJapan
LuxembourgChina
TurkeySwedenFinland
Denmark
0 100 200 300 400
USAUK
GermanyFranceCanada
ItalyAustralia
SpainSweden
JapanNetherlands
IndiaSwitzerland
SingaporeLuxembourg
MexicoUAE
RussiaSaudi Arabia
Brazil
China
China ranks 16th
China ranks 31st
Value of Cross-Border M&A ‘Purchases’ for World’s Top 20 Countries (USD bn, 2007)
Value of Cross-Border M&A ‘Sales’ for World’s Top 20 Countries (USD bn, 2007)
IN TERMS OF VALUE, CHINA’S INTERNATIONAL M&A ‘PURCHASES’ARE RANKED MUCH LOWER THAN ITS M&A ‘SALES’
China saw its cross-border M&A ‘purchases’ grow dramatically in 2008. This trend is expected to continue
… …
Source: WIR 2008; THE BEIJING AXIS Analysis

-119-
Russia
Europe
US
<USD100 bn
>USD500 bn
USD300 bn – USD500 bn
USD100 bn – USD300 bn
Top 30 Principal Sovereign Wealth Funds (2007)
China
THE ESTABLISHMENT OF THE CHINA INVESTMENT CORPORATION (CIC) IS IN LINE WITH INCREASING GLOBAL
INVESTMENT FLOWS BY SOVEREIGN WEALTH FUNDS
China1. State Administration of
Foreign Exchange (SAFE)2. China Investment
Corporation (CIC)3. Central Huijin Investment
Corporation4. Hong Kong Monetary
Authority (HKMA)-Exchange Fund
Note: We provide a breakdown in the next slideSource: WIR 2008; THE BEIJING AXIS Analysis

-120-Source: WIR 2008; THE BEIJING AXIS Analysis
Rank Economy Fund Assets under management($ billion)
1 United Arab Emirates Abu Dhabi Investment Authority (ADIA) 500–8752 Norway Government Pension Fund-Global (GPF-G) 3733 Singapore Government of Singapore Investment Corporation (GIC) 3304 Saudi Arabia Saudi Arabia Monetary Authority foreign holdings 3275 Netherlands Stichting Pensioenfonds ABP 3166 China State Administration of Foreign Exchange (SAFE) 3127 Kuwait Kuwait Investment Authority (KIA) 2508 United States California Public Employees’ Retirement System 2379 China China Investment Corporation (CIC) 200
10 Hong Kong, China Hong Kong Monetary Authority (HKMA)-Exchange Fund 16311 Singapore Temasek Holdings 16012 Canada Caisse de dépôt et placement de Québec 15713 Russian Federation Oil and Gas Fund (OGF) 15714 China Central Huijin Investment Corporation 10015 United Arab Emirates Investment Corporation of Dubai 8216 Australia Queensland Investment Corporation (QIC) 6517 Australia Australian Government Future Fund (AGFF) 6118 Qatar Qatar Investment Authority (QIA) 6019 France Pension Reserve Fund 5120 Libyan Arab Jamahiriya Reserve Fund 5021 Algeria Revenue Regulation Fund 4722 United States Alaska Permanent Fund (APF) 3723 Australia Victorian Funds Management Corporation (VFMC) 3624 Brunei Darussalam Brunei Investment Agency (BIA) 3525 Ireland National Pensions Reserve Fund (NPRF) 3126 Korea, Republic of Korea Investment Corporation (KIC) 3027 Malaysia Khazanah Nasional Fund BHD (KNF) 2628 Saudi Arabia Kingdom Holding Company 2529 Kazakhstan Kazakhstan National Fund (NFRK) 2330 Venezuela, Bolivarian Rep. of National Development Fund (FONDEN) 28
Names and Locations of World‘s Top 30 Sovereign Wealth Funds (2007)
CHINESE SOVEREIGN WEALTH FUNDS, SAFE AND CIC, RANK IN THE WORLD’S TOP 10

-121-
AGENDAForeword
History
Country Profile
China Economic Indicators
International Comparison
Selected Macroeconomic IndicatorsTrade Indicators: Domestic & ForeignInvestment Indicators: Domestic & ForeignFinancial IndicatorsSocial Indicators
Conclusions
Implications
About THE BEIJING AXIS
Disclaimer

-122-
Saudi Arabia 139 bn
US -673 bn
Current Account Balance (USD bn, 2008)
Source: WIR 2008; THE BEIJING AXIS Analysis
Russia102 bn
Japan157 bn
China440 bn
IN 2008, CHINA HAD THE WORLD’S LARGEST CURRENT ACCOUNT BALANCE WITH USD440 BN
Followed by Germany (USD235 bn) and Japan (USD157 bn)
Spain -154 bn
UK -45 bn
Greece --51 bn
Italy -73 bn
Germany 235 bn
Top 5 Current Account SurplusTop 5 Current Account Deficits

-123-
0
400
800
1,200
1,600
Chi
na
Japa
n
Rus
sia
Indi
a
Taiw
an
S.K
orea
Bra
zil
Sing
apor
e
Hon
g K
ong
Ger
man
y
Fran
ce
Alg
eria
Mal
aysi
a
Italy
Thai
land
Mex
ico
Liby
a
UA
E
Turk
ey
Switz
erla
nd
USA Ira
n
Pola
nd
Nor
way UK
Indo
nesi
a
Nig
eria
Arg
entin
a
Can
ada
Rom
ania
As % of World
1,534
Source: CIA World Book 2008; THE BEIJING AXIS Analysis
Forex and Gold Reserves of World’s Top 30 Countries/Regions (USD bn, 2008)
CHINA HAS THE WORLD’S LARGEST FOREIGN EXCHANGE RESERVES
In 2008, China had 22% of the world’s total forex reserves with USD1,534 bn, which was 61% higher than the second-largest forex reserve holder, Japan
22.9 13.5 7.2 4.3 4.2 3.7 2.7 2.4 2.2 1.7 1.6 1.5 1.5 1.3 1.1 1.1 1.1 1.1 1.1 1.1 1.0 1.0 0.9 0.9 0.8 0.8 0.7 0.7 0.6 0.5
Asia

-124-
0
4,000
8,000
12,000
USA UK
Ger
man
y
Fran
ce
Net
her.
Irela
nd
Japa
n
Switz
er.
Bel
gium
Spai
n
Italy
Aus
tral
ia
Can
ada
Aus
tria
Swed
en HK
Den
mar
k
Nor
way
Port
ugal
Chi
na
Rus
sia
Finl
and
Turk
ey
Bra
zil
S. K
orea
Mex
ico
Pola
nd
Indi
a
Indo
nesi
a
Arg
entin
a
24.0 20.5 8.8 8.6 4.5 3.6 2.9 2.6 2.6 2.1 2.0 1.6 1.5 1.5 1.2 1.2 1.0 0.9 0.9 0.7 0.7 0.5 0.5 0.4 0.4 0.4 0.3 0.3 0.3 0.3
12,250
Note: Nether. = Netherlands; Switzer. = SwitzerlandSource: CIA World Book 2008; Department of U.S. Treasuries; SAFE; THE BEIJING AXIS Analysis
CHINA’S EXTERNAL DEBT IS RELATIVELY SMALL COMPARED TO OTHER MAJOR ECONOMIES
In 2008, China only accounted for 1% of the world’s total external debt with USD375 bn
World’s Top 30 Countries’ External Debt (USD bn, 2007)As % of World
In 2008, the external debt of the US increased to
USD13,642 bn
In 2008, China’s
external debt amounted to USD375 bn

-125-
0
10
20
30
40
Zim
babw
e
Vene
zuel
a
STP
Turk
ey
Gui
nea
Iraq
Para
guay
Ang
ola
Bra
zil
Cos
ta R
ica
Jord
an
Viet
nam
Sain
t V.
Mac
edon
ia
Guy
ana
Den
mar
k
Thai
land
Cze
ch R
ep.
Swed
en
Chi
na
S. K
orea
Mor
occo
Switz
er.
Om
an
Japa
n
… …3.3
High rate countries
1. The interest rate charged by a central bank on loans to its member banks. A change in the discount rate is usually followed by similar changes in the interest rates charged by banks and in money marketsSTP: Sao Tome and Principe; Antig.: Antigua and Barbuda; Saint V.: Saint Vincent and the Grenadines; Saint K.: Saint Kitts and Nevis; Czech Rep.: Czech Republic; Switzer.: Switzerland
Source: CIA World Book 2008; THE BEIJING AXIS Analysis
CHINA HAS A RELATIVELY LOW CENTRAL BANK DISCOUNTRATE IN COMPARISON TO ITS GLOBAL PEERS
In 2007, China’s discount rate stood at 3.33%, comparable to that of Switzerland, Demark and Sweden
Central Bank Discount Rate1 (%, 2007)
Medium rate countries
Low rate countries

-126-
0
20
40
60
Zim
babw
e
Hai
ti
Mad
agas
car
Bra
zil
STP
Laos
Gam
bia
Mal
awi
Kyr
gyzs
tan
Para
guay
Gre
ece
Mex
ico
Chi
na
Qat
ar
Om
an
Fran
ce
Bos
nia.
Cze
ch R
ep.
Finl
and
UK
Bah
amas
Bru
nei
Pola
nd
Sing
apor
e
Swed
en
Switz
erla
nd
Japa
n
579
7.5
… …
1: Prime Lending Rate: A short-term interest rate quoted by a commercial bank as an indication of the rate being charged on loans to its best commercial customers. Even though banks frequently charge more and sometimes less than the quoted prime rate, it is a benchmark against which other rates are measured. For various reasons, a rising prime rate is generally considered detrimental to security pricesSTP: Sao Tome and Principe; Bosnia.: Bosnia and Herzegovina; Czech Rep.: Czech Republic
Source: CIA World Book 2008; THE BEIJING AXIS Analysis
CHINA ALSO HAS A MODERATE PRIME LENDING RATE COMPARED TO OTHER DEVELOPING ECONOMIES
In 2007, China’s prime lending rate was 7.5%,comparable to prime lending rates of either France or Greece
High rate countries
Commercial Bank Prime Lending Rate1 (%, 2007)
Medium rate countries
Low rate countries

-127-
AGENDAForeword
History
Country Profile
China Economic Indicators
International Comparison
Selected Macroeconomic IndicatorsTrade Indicators: Domestic & ForeignInvestment Indicators: Domestic & ForeignFinancial IndicatorsSocial Indicators
Conclusions
Implications
About THE BEIJING AXIS
Disclaimer
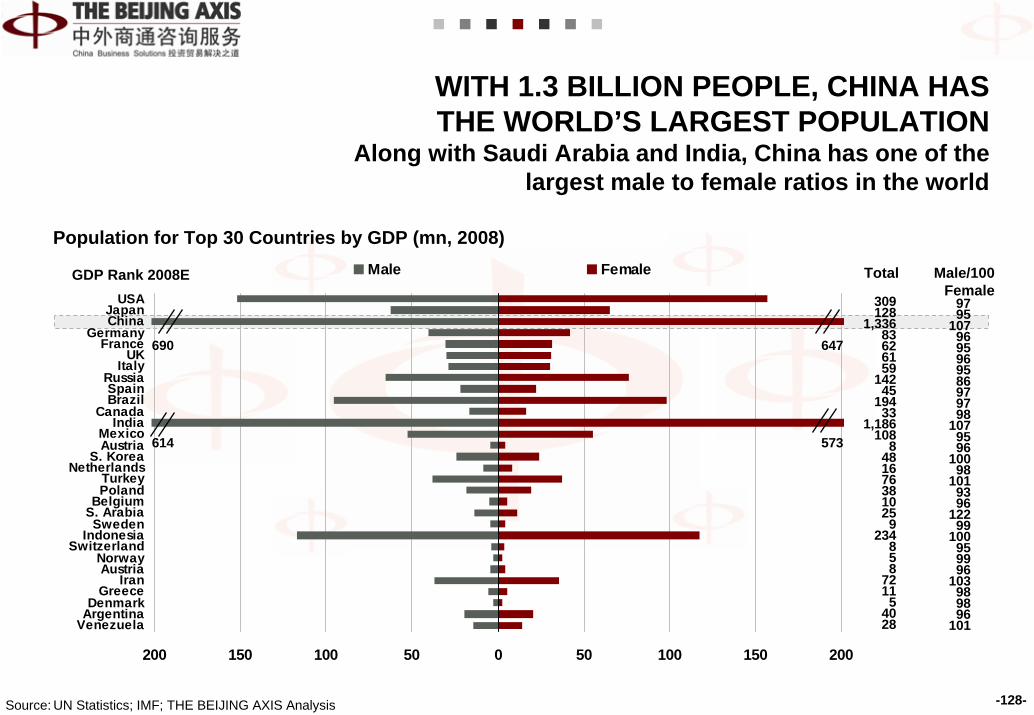
-128-
20015010050050100150200
USAJapanChina
GermanyFrance
UKItaly
RussiaSpainBrazil
CanadaIndia
MexicoAustria
S. KoreaNetherlands
TurkeyPoland
BelgiumS. ArabiaSweden
IndonesiaSwitzerland
NorwayAustria
IranGreece
DenmarkArgentina
Venezuela
Male FemaleGDP Rank 2008E Total
309 128
1,336 83 62 61 59
142 45
194 33
1,186 108
8 48 16 76 38 10 25 9
234 8 5 8
72 11 5
40 28
9795
1079695969586979798
1079596
10098
1019396
12299
100959996
103989896
101
690 647
614 573
Population for Top 30 Countries by GDP (mn, 2008)
Male/100 Female
Source: UN Statistics; IMF; THE BEIJING AXIS Analysis
WITH 1.3 BILLION PEOPLE, CHINA HAS THE WORLD’S LARGEST POPULATION
Along with Saudi Arabia and India, China has one of the largest male to female ratios in the world

-129-Source: IMF; THE BEIJING AXIS Analysis
Child and Elderly Population for Selected Countries (%, 2008)
0
10
20
30
40
50
0 10 20 30 40 50 60 70 80
Iran
India
% Population under 15
% Population aged 60+
Saudi Arabia
IndonesiaTurkey
VenezuelaMexico
Brazil
China
Argentina
S. Korea
Russia
US
Poland
Canada
NetherlandsNorway
Switzerland
UK
DenmarkFrance
AustriaSpain
Belgium
Greece
Sweden
GermanyItaly
Japan
Size of the bubble represents total
population
25% OF CHINA’S POPULATION IS OLDER THAN 60 YEARS
The bulk of the Chinese population is currently at a working age

-130-
Annual Rate of Population Change (%) 2005-2010Urban and Rural Population (%, 2007)
0
Note: Nether. = Netherlands; Switzer. = SwitzerlandSource: CIA World Factbook; World Bank; THE BEIJING AXIS Analysis
1.3 0.2 0.1 2.7 0.5 0.8 0.4 0.9 1 1.8 -0.5 2.4 0.9 1.5 0.7 0.9 1.9 0.3 0.5 3.3 -0.3 0.5 0.7 2.5 0.7 0.6 0.5 1.4 2.1 1.2
100
-0.7 -0.5 -0.4 -1 -0.4 -0.5 -0.3 0.2 0.4 -1.9 -0.4 1.1 -0.6 -0.2 -0.3 -2.7 -0.2 -0.9 0 -1.1 0 0.1 0.3 1.1 -0.3 -0.3 -1.8 -0.7 -0.3 -1.5UrbanRural
CHINA’S POPULATION HAS BEEN STEADILY MIGRATING TO THE CITIES, RAISING THE URBAN-RURAL POPULATION RATIO
However, the share of the Chinese urban population remains much smaller than that of other economies of similar size
8266
74
43
9077
6877 80 86
73
29
81 7767
8269
9785
5261
73 77 8267 61
87
61 68
92
1834 26
57
1023
3223 20 14
27
71
19 2333
1831
315
4839
27 23 1833 39
13
39 32
8
USA
Japa
n
Ger
man
y
Chi
na UK
Fran
ce
Italy
Spai
n
Can
ada
Bra
zil
Rus
sia
Indi
a
S. K
orea
Mex
ico
Aus
tria
Net
her.
Turk
ey
Bel
gium
Swed
en
Indo
nesi
a
Pola
nd
Switz
er.
Nor
way
S. A
rabi
a
Aus
tria
Gre
ece
Den
mar
k
S. A
fric
a
Iran
Arg
entin
a
Urban Rural

-131-
10080604020020406080100
USAJapanChina
GermanyFrance
UKItaly
RussiaSpainBrazil
CanadaIndia
MexicoAustraliaS. Korea
NetherlandTurkeyPoland
BelgiumS. ArabiaSweden
IndonesiaSwitzerland
NorwayAustria
IranGreece
DenmarkArgentina
Venezuela
Male FemaleGDP Rank 2008E
Life Expectancy (years, 2008)
Source: UN Statistics; IMF; THE BEIJING AXIS Analysis
THE AVERAGE LIFE EXPECTANCY IN CHINA IS SLIGHTLY HIGHER THAN IN OTHER LARGE DEVELOPING
COUNTRY ECONOMIES

-132-
10080604020020406080100
USAJapan
GermanyChina
UKFrance
ItalySpain
CanadaBrazil
RussiaIndia
S. KoreaMexico
AustraliaNetherla
TurkeyBelgiumSweden
IndonesiPoland
SwitzerlNorway
S. ArabiaAustriaGreece
DenmarkS. Africa
IranArgentin
Male FemaleGDP Rank 2007 Total
594851715650394763605734415857572461465060476219524361324753
Adult (15+) Economic Activity Rate (%, 2007)
Source: UN Statistics; THE BEIJING AXIS Analysis
CHINA’S ECONOMIC ACTIVITY RATE IS COMPARATIVELY LARGER THAN OTHER DEVELOPED ECONOMIES
Out of the top economies in the world, China has the largest female economic activity rate

-133-
0
1
2
3
4
Mex
ico
Slov
ak R
ep.
Pola
nd
Gre
ece
Turk
ey
Indi
a
S. A
fric
aH
unga
ry
Bra
zil
Rus
sia
Italy
N. Z
eala
ndPo
rtug
al
Spai
n
Irela
ndC
hina
Cze
ch R
ep.
Nor
way
Luxe
mbo
urg
Net
herla
nds
UK
Bel
gium
Can
ada
Aus
tral
ia
Fran
ce
Ger
man
yD
enm
ark
Aus
tria
USA
Icel
and
Switz
erla
nds
S. K
orea
Japa
n
Finl
and
Swed
en
2007 or Latest Available Year 1998 or First Available Year
Gross Domestic Expenditure on R&D as a % of GDP (1998-2007)
1
Source: OECD Factbook 2009; THE BEIJING AXIS Analysis
DURING THE LAST TEN YEARS, CHINA AND SOUTH KOREA SHOWED THE LARGEST INCREASE IN R&D EXPENDITURE
This supports the surge of technological advancement and the rapid increase in Chinese living standards

-134-
AGENDAForeword
History
Country Profile
China Economic Indicators
International Comparison
Conclusions
Implications
About THE BEIJING AXIS
Disclaimer

-135-
INDICATORS CONCLUSIONS
Selected Macroeconomic Data
China became the world’s 3rd-largest economy in 2008, and has experienced a dramatic fourfold increase in the past 10 years. Since its economic reform, China has been growing at 10%, substantially above the world average of 3.4% for the same 30-year period. China’s vast GDP is largely concentrated in a few coastal provinces and has been boosted by its secondary industry and industrialisation. Compared to other major economies, China’s GDP per capita, consumption expenditure and service industry are still insignificant, providing scope for long term sustained growth
Trade Mirroring the country’s economic growth, China’s consumption and retail sales have been on the rise and are mainly concentrated in the eastern provinces. As the world’s factory floor, China is the world’s third-largest exporter and an undisputed leader in exports of electrical machinery, textiles and steel. Ranked as the world’s third-largest importer, China leads the world in imports of electrical machinery & ores and ranks fourth in oil imports. China has, in addition, the world’s largest trade surplus. With the global financial crisis unfolding in 2008, China’s trade has been significantly affected, causing some concerns. However, it also highlighted the ability of China to fuel its own growth
Investment China has depended heavily on investment for its economic growth, with the bulk of such investment occurring in urban areas, coastal provinces and in the manufacturing and real estate sectors. Although China is widely known as a leading destination for FDI, it is currently experiencing a fast-paced increase in its OFDI, driven by its increasing need for new markets, technology and resources. Many of China’s outward investments are in the natural resources, wholesale, retail, and manufacturing sectors, and are increasingly spanning the globe.
Financial The Chinese government has been putting monetary and fiscal measures in place in order to assure an adequate response to inflationary cycles over the past 10 years. Bank restructuring and more prudent loan management have created a stable financial sector and the country’s two stock markets have become the second largest in the world.Exchange rate reform and management have ensured a consistently stable RMB exchange rate pattern despite ongoing international criticism that the currency is undervalued.
Social With 1.3 billion people and 16 million new births per year, China has the world’s largest population. Mass migration to the cities of eastern China, a growing middle class in urban areas and growing income levels in urban and rural households are particularities that are currently shaping China’s social landscape. Compared to other economies of similar size, China still has an extremely low urbanisation rate but a relatively high percentage of the population is active in the labour market. The large population offers many opportunities but also endless challenges
CONCLUSIONS

-136-
AGENDAForeword
History
Country Profile
China Economic Indicators
International Comparison
Conclusions
Implications
About THE BEIJING AXIS
Disclaimer

-137-
INDICATORS IMPLICATIONS
Selected Macroeconomic Data
Economic forecasts predict China to become the world’s largest economy in the next two decades, surpassing both the US and Japan. Japan will be overtaken in the next 2 years. Following a trend of GDP growth well above the world average, China will replicate the economic development of its coastal provinces in the north, centre and western provinces in the central and western regions. This will result in ongoing trade and investment opportunities. China’s consumption is expected to play an even greater role as an engine for economic growth, and the service industry is expected to fulfill a larger role in China’s economy, while the manufacturing sector is becoming more sophisticated
Trade China’s evolving retail sales trends and data clearly indicate the large potential of its consumption market for domestic as well as international products. As a low cost country, China is expected to further expand its manufacturing base, increase its exports and strengthen the ongoing structural change of its export mix; from low value added (textiles) to high value added products (equipment). As its industrialisation and urbanisation processes continue, it is also likely that China will increase imports of raw materials such as oil and a variety of ores, as well as many manufactured products
Investment As living standards and production costs increase in China’s coastal provinces, more investment opportunities are arising in China’s central provinces - in the manufacturing, real estate and other sectors. While there is still substantial scope to attract FDI in such sectors, China’s most impressive phenomenon in the investment arena is its outward investment trend. Driven by the need to secure resources to feed its fast growing economy and the expansion of its domestic companies, China will continue to increase its outward investments very significantly, creating many implications
Financial Although reform over the past decade has been substantial, China’s financial markets are still under-developed compared to other economies, offering many service sector opportunities to foreign businesses. Expect a more discerning financial services sector consumer and many opportunities. Years of growing exports and FDI have enabled China to attain the position of having the world’s largest foreign exchange reserves, a key stability ‘buffer’
Social China’s emerging middle class and growing income levels, in both urban and rural areas, are not only signs of the potential of the Chinese consumption market but also of a growing pool of suitably qualified professionals who will progressively compete in the domestic and international labour markets. Higher education levels and growing urbanisation in central provinces evince the potential to not only foster poverty reduction but to also expand industrialisation while keeping domestic talent in the country
IMPLICATIONS

-138-
AGENDAForeword
History
Country Profile
China Economic Indicators
International Comparison
Conclusions
Implications
About THE BEIJING AXIS
Disclaimer

-139-
THE BEIJING AXIS is a cross-border business bridge to/from China in three principal areas: Strategy, Sourcing and Investment.
Since our establishment in 2002, we have successfully worked with many large international and Chinese MNC clients across various sectors and industries, with a core focus on the Chinese mining & resources sector; and the burgeoning industrial, engineering & manufacturing sector.Our work is always cross-border - supporting international firms as they act in unfamiliar territory in China, or supporting Chinese firms as they venture out and ‘go global.’ We are committed to safety and sustainability, and our solutions emphasise ‘actions and transactions.’ Our principal office is in Beijing, with additional offices in Hong Kong and international offices in Singapore, Perth, Moscow and Johannesburg.
THE BEIJING AXIS is organised along three synergistic cross-border China businesses: the China Strategy Group, the China Sourcing Unit, and China Capital Advisors:
The CHINA STRATEGY GROUP (CSG) assists CEOs, boards and senior management with their cross-border China strategy formulation and implementation. For international MNCs we are a trusted China strategy advisor and implementation partner; for Chinese MNCs we perform strategic business planning and implementation as they develop global businesses.
The CHINA SOURCING UNIT (CSU) supports international firms as they exploit China’s status as a leading global supply base, while at the same time supporting Chinese firms that are looking at global sourcing. The CSU provides a comprehensive range of procurement services across the sphere of supply chain management with a focus on cost savings, quality control and on-time delivery. We emphasise total cost of ownership and holistic project, risk and relationship management.
CHINA CAPITAL ADVISORS (CCA) provides specialised financial advisory services to Chinese firms that are undertaking outbound cross-border investment, or that are vying for international investment. Similarly, we advise international firms that are undertaking investments in China or that are looking to attract strategic capital from China. The focus is on origination activities, but we provide selected execution services across the transaction chain.

-140-
For further information, please visit our English, Chinese, Russian or Spanish websites at www.thebeijingaxis.com, or contact an appropriate office:
Beijing, ChinaCheryl Tang China Strategy Group China Sourcing Unit China Capital AdvisorsDirector & GM: China Javier Cuñat Diana Wang Edward Wang [email protected] Manager Manager Director & GM(T)+86 (0)10 6440 2106 [email protected] [email protected] [email protected] (F)+86 (0)10 6440 2672
Johannesburg, South Africa Moscow, Russia/CIS Perth, Australia Latin America Desk (Beijing)Michele (Mitch) Cosani Lilian Luca, Director: Russia/CIS Jim Hu Javier Cuñat Manager:Johannesburg Office & Group Corporate Office Senior Consultant [email protected] [email protected] [email protected] [email protected](T)+27 (0)11 201 2453
or Jackie LiManager:Business [email protected](T)+27 (0)11 201 2550

-141-
AGENDAForeword
History
Country Profile
China Economic Indicators
International Comparison
Conclusions
Implications
About THE BEIJING AXIS
Disclaimer

-142-
This document is issued by THE BEIJING AXIS Ltd. While all reasonable care has been taken in preparing this document, no responsibility or liability is accepted for errors or omissions of fact or for any opinions expressed herein. Opinions, projections and estimates are subject to change without notice. This document is for information purposes only, and solely for private circulation. The information presented here has been compiled from sources believed to be reliable. While every effort has been made ensure that the information is correct and that the views are accurate, THE BEIJING AXIS Ltd. cannot be held responsible for any loss, irrespective of how it may arise. In addition, this document does not constitute any offer, recommendation or solicitation to any person to enter into any transaction or to adopt any investment strategy, nor does it constitute any prediction of likely future movements or events in any form. Some investments discussed here may not be suitable for all investors. Past performance is not necessarily indicative of future performance; the value, price or income from investments may fall as well as rise. THE BEIJING AXIS Ltd., and/or a connected company may have a position in any of the investments mentioned in this document. All readers are advised to make their own independent judgement with respect to any matter contained in this document. .
Copyright Notice: Copyright of all materials, text, articles and information contained herein resides in and may only be reproduced with permission of an authorised signatory of THE BEIJING AXIS Ltd. Copyright in materials created by third parties and the rights under copyright of such parties is hereby acknowledged. Copyright in all other materials not belonging to third parties and copyright in these materials as a compilation vests in and shall remain copyright of THE BEIJING AXIS and should not be reproduced or used except for business purposes on behalf of THE BEIJING AXIS Ltd. or save with the express prior written consent of an authorised signatory of THE BEIJING AXIS Ltd. All rights reserved. © THE BEIJING AXIS Ltd. 2009.