Embed Size (px)
Citation preview

China Telecom
Presentation at UBS Global Communications Conference
Mr Chang Xiaobing
President of China Telecom
19 November 2003
New York

1
Content
♦ Telecom Industry in China
♦ Performance Review: First 9 months in 2003
♦Overview of the Acquisition

2
Favorable Market Fundamentals
GDP(1)
(RMB in billion)
7,8358,207
8,947
9,731
10,479
1998 1999 2000 2001 2002
CAGR= 7.5%
Telecom Service Revenue(2)
(RMB in billion)
230
279307
357
412
1998 1999 2000 2001 2002
CAGR= 15.7%
Notes: (1) Source: National Statistic Bureau, China
(2) Source: Ministry of Information Industry, China

3
Located in China’s Most Affluent Provinces
Sichuan
GuangxiGuangdong
Anhui
Zhejiang
Jiangsu
Shanghai
JiangxiFujian
Chongqing
Current provincial assets in Listco
Provincial assets slated for acquisition
16.8%25.7%Fixed-line telephone penetration rate3.9%5.3%Internet penetration rate
214.456.9Access line in service (in millions)9701,954GDP per capita (USD)(1)
1,276221Population (in millions) Nationwide ListcoIn 2002
Notes: (1) Calculated by GDP/population, exchange rate: USD1.0=RMB 8.27lculated
Source: National Statistic Bureau and Ministry of Information Industry of China/population, exchange rate: USD1.0=RMB 8.27

4
Strong Drivers Pushing Fixed-line Penetration
Increasing Disposable Incomeper Capita
(RMB)7,161
6,2556,755
2000 2001 2002
Accelerated Urbanization
48.1%46.4% 47.2%
2000 2001 2002
Notes: (1) All figures are for Listco
(2) Source: provincial statistics bureaus

5
Regulatory Framework
Other Regulatory Bodies:
National Development & Reform CommissionState-owned Assets Supervision & Administration Commission Ministry of Finance State Administration of Taxation……
Other Regulatory Bodies:
National Development & Reform CommissionState-owned Assets Supervision & Administration Commission Ministry of Finance State Administration of Taxation……
Provincial communication administrationsProvincial communication administrations
Ministry of Information IndustryMinistry of Information Industry
♦ Regulatory policies
♦ Enforcement
♦ Licensing
♦ Tariff regulation and guidance
♦ Services quality control
♦ Technical standards
♦ Resource allocation
♦ ……

6
Content
♦ Telecom Industry in China
♦ Performance Review: First 9 months in 2003
♦Overview of the Acquisition

7
First Half of 2003: Sustained Healthy Growth
Revenue(RMB in billion)
39.536.9
1H 2002 1H 2003
7.2%
EBITDA(RMB in billion)
23.120.9
1H 2002 1H 2003
10.2%Net Profit
(RMB in billion)
9.38.5
1H 2002 1H 2003
9.2%
8
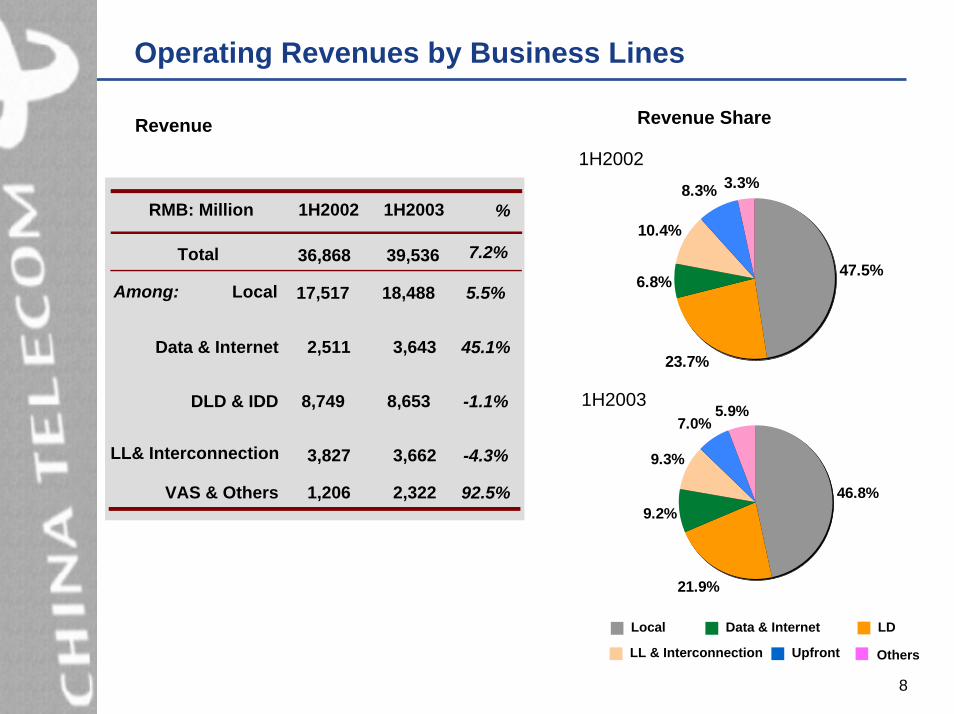
Operating Revenues by Business Lines
Revenue ShareRevenue
RMB: Million 1H2002 1H2003 Δ %
Among: Local 17,517 18,488 5.5%
Data & Internet 2,511 3,643 45.1%
DLD & IDD 8,749 8,653 -1.1%
3,827 3,662 -4.3%
VAS & Others 1,206 2,322 92.5%
Total 36,868 39,536 7.2%
LL& Interconnection
47.5%
23.7%
6.8%
10.4%
8.3% 3.3%
46.8%
21.9%
9.3%
7.0%5.9%
9.2%
1H2002
1H2003
Data & InternetLocal LD
LL & Interconnection Upfront Others

9
Cost Structure More Rationalized
Operating Expenses Operating Expenses Share
RMB: Million 1H2002 1H2003 Δ
Depreciation & Amortisation
10,030 10,859 8.3%
7,973 6,551 -17.8%
SG&A 3,170 3,527 11.3%
3,393 5,091 50.6%Interconnection
Charges & Others1,404 1,310 -6.7%
Total 25,970 27,338 5.3%
Personnel
38.6%
30.7%
12.2%
13.1%5.4%
39.7%
24.0%
12.9%
18.6%
4.8%
1H2002
1H2003
D&A Network O&S SG&A
Network Operations &Support
Personnel Interconnection & Others
10
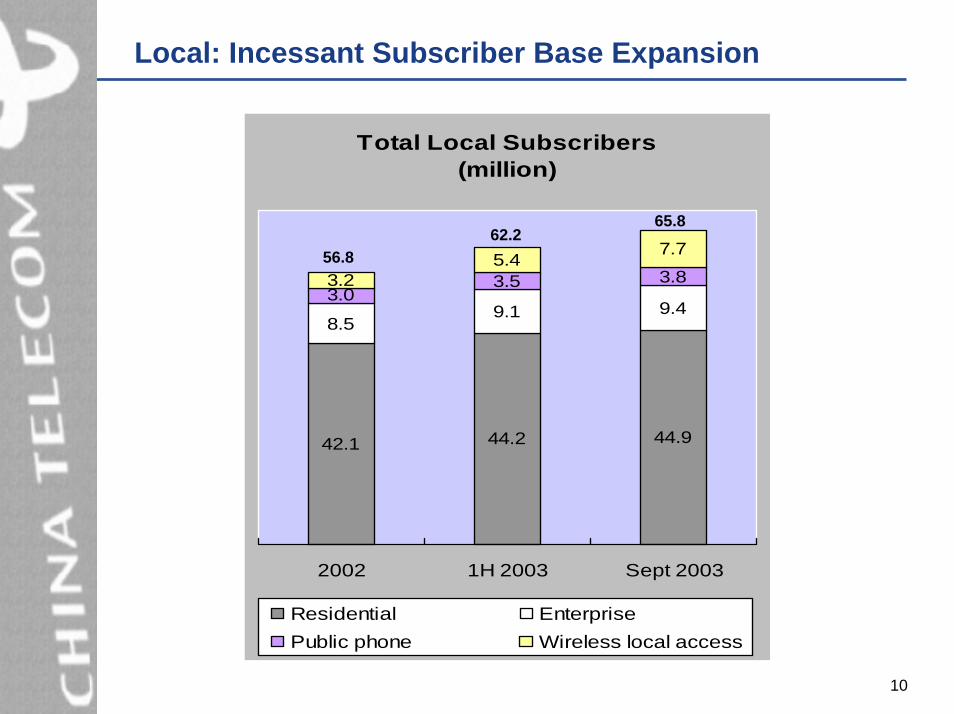
Local: Incessant Subscriber Base Expansion
Total Local Subscribers(million)
42.1 44.2 44.9
8.59.1 9.4
3.03.5 3.83.25.4 7.7
2002 1H 2003 Sept 2003
Residential EnterprisePublic phone Wireless local access
56.862.2
65.8

11
Local: Sustained Traffic Growth
Total Local Voice Usage Volume(pulses in billions)
137.8
120.7
104.6
85.3 88.7 88.7
1H 2002 2H 2002 1H 2003 Jan-July2003
Jan-Aug2003
Jan-Sept2003

12
Long Distance: Stable Market Share & Moderated Risk
Traffic Volume Market Share
54.0% 52.6% 52.1%59.2%
63.4% 65.8%
2002 1H 2003 Jan-Aug 2003
DLD IDD
Traffic Volume(minutes in billions)
16.3 17.319.1
29.2
0.6 0.7 0.7 1.1
1H 2002 2H 2002 1H 2003 Jan-Sept 2003
DLD IDD

13
Broadband Internet: Explosive growth Growth
Broadband Subscribers(thousand)
3,517
1,379
2,562
2002 1H 2003 Sept 2003

14
First 9 months of 2003 – Challenges & Opportunities
Our Strategies:♦Market segmentation
and distribution channel enhancement
♦Extended local branch companies’BPR initiatives
♦Strengthened overall budget management and performance evaluation
♦Acquisition of quality assets for external growth
Strong Drivers for Growth:♦ Steady wire-line service with great
potential
♦ Fast growing broadband service, a major driver of growth
♦ Burgeoning VAS,a powerful revenue growth contributor
Challenges from Competitions:♦More significant mobile substitution
♦ Fiercer competition in the long distance market

15
Content
♦ Telecom Industry in China
♦ Performance Review: First 9 months in 2003
♦Overview of the Acquisition

16
Terms of Acquisition
Anhui Telecom, Fujian Telecom, Jiangxi Telecom, Sichuan Telecom, ChongqingTelecom, Guangxi Telecom and their subsidiaries, and certain network management and R&D facilities currently owned by the Parent
Anhui Telecom, Fujian Telecom, Jiangxi Telecom, Sichuan Telecom, ChongqingTelecom, Guangxi Telecom and their subsidiaries, and certain network management and R&D facilities currently owned by the Parent
Target AssetsTarget Assets
Acquisition ConsiderationAcquisition Consideration
Consideration PaymentConsideration Payment
Extraordinary GeneralMeetingsExtraordinary GeneralMeetings
Financial Advisors to theChina TelecomFinancial Advisors to theChina Telecom
Independent FinancialAdvisorIndependent FinancialAdvisor
Valuation MultiplesValuation Multiples
EPS AccretionEPS Accretion
2003 Earning Forecastfor Target Group2003 Earning Forecastfor Target Group
JP Morgan Securities (Asia Pacific) LimitedJP Morgan Securities (Asia Pacific) Limited
Morgan Stanley Dean Witter Asia LimitedChina International Capital (Hong Kong) CorporationMorgan Stanley Dean Witter Asia LimitedChina International Capital (Hong Kong) Corporation
December 15th, 2003December 15th, 2003
P/E: 11.49x(1)P/E: 11.49x(1)
21.1% (3) (4)21.1% (3) (4)
RMB 4.004Bn (Excluding Upfront Connection Fee)RMB 6.352Bn (Including Upfront Connection Fee)(1)RMB 4.004Bn (Excluding Upfront Connection Fee)RMB 6.352Bn (Including Upfront Connection Fee)(1)
Equity Value: RMB 46BnAssumed Net Debt: RMB 34Bn (2)
Enterprise Value: RMB 80 Bn
Equity Value: RMB 46BnAssumed Net Debt: RMB 34Bn (2)
Enterprise Value: RMB 80 Bn
Initial consideration: RMB 11BnDeferred consideration: RMB 35BnInitial consideration: RMB 11BnDeferred consideration: RMB 35Bn
Notes: (1) Otherwise indicated, all information related to valuation hereafter excluding upfront connection fee of 2.348 billion RMB(2) As of June 30th, 2003(3) Calculation based on 20 trading days average closing price HK$2.27 as of Oct 24th, 2003; P/E ratio of target company is based on company’s earnings forecast and acquisition consideration(4) EPS estimate for ListCo is based on the average of estimated EPS from Morgan Stanley and CICC research department. Illustrative purpose only, it does not reflect Company’s guidance on earnings

17
Wire-line Telephone Service Experienced Rapid Growth
Local Revenue(1)
(RMB in billion)
10,270
19,15917,096
2001 2002 1H 2003
Access Lines in Services(million)
45.07
39.93
32.36
6.53
4.05
1.26
2001 2002 1H 2003Access lines in service Wireless local access
10.8%13.4% 15.1%
Wire-line penetration rate
Local MOU(2)
(pulses/month/per subscriber)
207232
263
2001 2002 1H 2003
Note: (1) Upfront connection fee excluded
(2) Excluding Dial-up minutes

18
Data and Internet Services
Revenue of Data & Internet Servicesand % of Revenue
(RMB in million)
650
1,139
841
308
642
575
2001 2002 1H 2003
Internet Data
45.4%
1,225
1,781
1,1493.8%
1.8%
2.0%
5.2%
1.9%
3.3%
6.3%
1.7%
4.6%
Broadband Subscribers(thousand)
1,031
495
87
2001 2002 1H 2003
CAGR= 420.7%

19
Risk in Long Distance Service Moderated
6,342 6,167
3,141
Revenue of Long Distance Service(RMB in million)
5,949 5,758
2,941
200
409393
2001 2002 1H 2003
DLD IDD
6,167
3,141
6,342
19.8%
18.1%
17.2%
Total long distance revenue share
Long Distance Market Share(1)
55.7% 51.8%
65.1%59.0%68.2%
68.2%
2001 2002 1H 2003
DLD IDD
Long Distance Traffic Volume(minutes in millions)
12,07013,168
6,790
77
169155
2001 2002 1H 2003
DLD IDD
9.1%12,22513,337
6,867
Note: (1) Market share of international long distance service is based on outgoing call minutes long distance

20
Realization of Operating Synergy
Reduce CostReduce Cost
Interconnection revenue decreased by 13MM, interconnection expense decreased by 140MM in the first half of 2003 on a pro forma basis
Achieve Management SynergyAchieve Management Synergy
Centralize investment planning, procurement and financial managementLaunch business process reengineering initiativesImprove centralized management of network operation and R&D capabilities Wider implementation of employee incentive programs

21
Significant Earnings Accretion
EPS excluding Upfront Connection Fees(1)(2)
(HK$)
0.195
0.161
Listco Pro Forma
Accretion: 21.1%
Note: (1) Borrowing interest rate 5.18%, deposit interest rate 1.8%, income tax rate33%(2) EPS estimates for ListCo is based on average estimated EPS from Morgan Stanley and CICC
research department. Illustrative purpose only, it does not reflect Company’s guidance on earnings

22
Improvement of Capital Structure,Enhancement of Shareholder Return
Pro Forma
Total Debt/Total Capital(1)(2)
12.7%
37.2%
Listco Pro Forma
Net Debt/EBITDA(1)(2)(3)
1.29
0.12
Listco Pro Forma
Note: (1) As of June 30, 2003(2) Total Debt/Total Capital = Total Debt/(Total Debt + Deferred Revenue + Shareholders’ Equity +
Minority Interest); Total Debt = Long-term Debt + Short-term Debt + Financial Lease; Net Debt = Total Debt - Cash
(3) We annualize EBITDA of 1H2003 to get Net Debt/EBITDA

China Telecom
Presentation at UBS Global Communications Conference
19 November 2003
New York