Embed Size (px)
Citation preview

THIS REPORTHAS BEENPRODUCED INPARTNERSHIPWITH
Ecological Footprint and Sustainable Consumption in China
2014
Ecological Footprint and Sustainable Consumption in China
REPORTCHINA

Ecological Footprint and Sustainable Consumption in China
2
China-ASEAN Environmental Cooperation Center
Established in March 2010, the China-ASEAN Environmental Cooperation Center is a department-level institution directly under the Ministry of Environmental Protection. Its main functions include: to be responsible for handling environmental cooperation affairs within the framework of ASEAN; to work out plans and suggestions for environmental cooperation programs and the implementation; to coordinate and implement related policies and strategic research on environmental protection cooperation and key international and regional environmental cooperation mechanism; to promote international environmental protection industrial cooperation and organize and conduct activities of related technology exchange and transfer, environmental education and training.
China-ASEAN Environmental Cooperation Center1 Yuhui South Road, Chaoyang District, BeijingZip code: 100029www.ChinaAseanEnv.org
World Wild Fund for Nature
WWF (World Wild Fund for Nature) is one of the world’s largest and most respected independent non-government organizations dedicated to the conservation of nature. WWF boasts a global network active in more than 100 countries with nearly 5.2 million supporters.
WWF's mission is to stop the degradation of the Earth's natural environment and to build a future in which humans live in harmony with nature. Therefore, WWF is dedicated to conserving the world's biological diversity; ensuring that the use of renewable natural resources is sustainable; and promoting the reduction of pollution and wasteful consumption.
Beijing Representative Office of World Wild Fund for Nature (Switzerland)Room 1609, Wen Hua Gong, East Gate, Working People’s Culture Palace, BeijingZip code: 100006www.wwfchina.org
Advisor:Xu Qinghua, Peng Jinxin, Guo Jing, Fang Li, Li Lin, Zhang Shigang, Zhao Ping, Zhang Jianping, Zhou Xuegeng, Xie Gaodi
Head of the Research:Zhou Guomei, Li Xia, Chen Boping
Member of the Research Group:Cao Shuyan, Zhou Shuang, Zhou Ye, Ouyang Wei, Peng Ning, Wu Yanyang, Gao Ying
Co-authored by:Li Xia, Zhou Ye

Ecological Footprint and Sustainable Consumption in China
3
TAblE OF CONTENTS
Preface 02
Executive Summary 04
Chapter One: Ecological Footprint under Global Context 06
Chapter Two: China's Consumption Ecological Footprint 10
Chapter Three: Ecological Footprint Comparison Analysis in China 17
Chapter Four: Urbanization and Ecological Footprint 26
Chapter Five: Policy Recommendation 30
Reference 38

Ecological Footprint and Sustainable Consumption in China
2
FOREWARD
Our planet is our common home, but it is suffering from unprecedented pressure to provide natural resources to support our lifestyles. This increasing demand for natural resources, already far exceeds the Earth’s regeneration capacity.
Unsustainable forms of consumption are part of creating this destructive pressure on the ecological system. Current consumption models, and the high and rising levels of individual consumption, ironically even threaten people’s health and quality of life.
If our current and increasing consumption trends continue, we may need the equivalent of “two Earths” by 2030 to meet this increasing demand.
But we only have one Earth. The only thing we can do is create more sustainable consumption models and lifestyles and, as a result, enable humans and nature to live in harmony.
With fast economic development and urbanization, China’s ecological system and natural resources are facing great challenges. Our future use of natural resources, and the nature of our consumption model, will strongly influence the future of China and its people.
In order to transform our economy towards more sustainable consumption, government at all levels, enterprises and other stakeholders will need to work together to create long-term commitments and joint solutions.
This report looks at current consumption trends in China and provides suggestions for how to create and promote sustainable consumption as part of China’s goal to be an ecological civilization.

Ecological Footprint and Sustainable Consumption in China
3

Ecological Footprint and Sustainable Consumption in China
4
As China’s economy rapidly expands, people’s incomes are improving and their levels of consumption rising. China’s large population and current consumption model is placing huge pressures on available resources and the wider environment.
China’s leadership is promoting ‘ecological civilization’. This study supports this goal by looking at the impacts of China’s current consumption model and suggesting ways to promote sustainable consumption as well as create appropriate and sustainable economic policy.
In order to analyze the relationship between China’s increasing consumption and impacts on the environment, we have used the ‘Ecological Footprint’, an effective tool to measure people’s demand for, and consumption of, natural resources. It tracks humanity’s demand on nature by comparing
SUMMARY OF FINDINGS
human consumption with the Earth’s regenerative capacity or biocapacity. We have also looked at the different Ecological Footprints across China and compared these with consumption drivers and trends.
Our overall findings are that:
● Although China’s per capita Ecological Footprint is below the world average, it has already exceeded a sustainable level. China’s overall Ecological Footprint is 2.5 times its own biocapacity.
● This report compares the Ecological Footprint of China’s consumption with that of the US, UK and South Africa. These countries are chosen because they represent two developed countries and an emerging economy in different geographical regions.
● China has relatively inefficient resource use compared with the US, UK and
South Africa. Every 1000 USD of Chinese consumption generates about four a half times more Ecological Footprint than the US and UK and over twice as much as South Africa. China will therefore need to transform to a model of consumption which is much more resource-efficient.
● If we look at the different contributions of categories of consumption across these same four countries, China has relatively less service consumption and relatively more infrastructure investment. A shift towards more services (which are relatively resource-light), as well as a reduction in resource-intensive infrastructure, will help lower China’s Ecological Footprint.
● Ecological Footprints vary considerably across China and the highest footprint areas tend not to have high biocapacity or Ecological Function Zones. Provinces
Ecological Footprint and Sustainable Consumption in China
5
with high economic development and high Ecological Footprints therefore tend to consume not only their own biocapacity but that of others, particularly from those areas with high biocapacity which tend to also have low economic development, such as provinces in West China. It is therefore necessary to either reduce the environmental impact of resource use through, for example, sustainable certification and increasing consumer awareness, or by promoting forms of ecological compensation between areas.
● Urbanization is a major driving force of China’s ecological overshoot. Changing consumer trends for urban populations between 2000 and 2010 show a large increase in car ownership, as well as greater use of computers and the internet. China ranks the highest in the world for
carbon emissions. There seems to be a relative decline of cultural, education and recreational services as a proportion of the economy, indicating their relatively slow development compared to resource-intensive industries . There are also widening differences between the Ecological Footprints of urban and rural populations.
There is therefore a need for government policy which creates and supports a sustainable system of consumption and production, promotes more service-based consumption, balances consumption levels between different geographical areas, and ensures urban planning with strongly reduced environmental impact.

Ecological Footprint and Sustainable Consumption in China
6
The Eco log ica l Footpr int measures humanity’s demand on the biosphere by calculating the geographical area required to produce the renewable resources that people consume (whether cropland, fishing grounds, or grazing land), the area occupied by infrastructure, and the area of forest required to sequester (or store) that part of CO2 emissions from human activities that is not absorbed by the oceans (Figure 1).
This area is then compared with the Earth’s biocapacity – the amount of productive area available to generate the resources required as well as to absorb wastes.
Both the Ecological Footprint and biocapacity are measured in ‘global hectares’ (gha). One
CHAPTER ONE: ECOlOGICAl FOOTPRINT UNDER GlObAl CONTExT
1.1 Ecological Footprint And Consumption
Ecological Footprint for imported goods and services minus that of exports. (See WWF’s China Ecological Footprint Report 2012 for further details of the methodology.)
If there is a biocapacity deficit, the extra resource use must therefore come from trade, whether within countries or through imports from other countries, or from over-using current resources which affects their availability for future generations.
To reduce the gap between local and national Ecological Footprints and the available biocapacity, consumption levels would need to reduce, and/or the efficiency of resource-use in the creation of goods and services dramatically increase.
global hectare represents the productive capacity of one hectare of available land at global average biological productivity levels.
The ‘biocapacity deficit’ or surplus of a country or region depends on the relat ionship between the Ecological Footprint and the biocapacity of that region or country. Biocapacity surplus exists when the available biocapacity exceeds the Ecological Footprint generated by the people living in that area. With a biocapacity deficit the Ecological Footprint exceeds the available biocapacity.
At the national level , the Ecological Footprint is based on ‘net’ consumption, meaning that it takes into account the

Ecological Footprint and Sustainable Consumption in China
7
Figure 1 Components of the Ecological Footprint, Global Footprint Network.
Every human activity uses biologically productive land and/or fishing grounds. The components of the Ecological Footprint are: cropland, grazing land, forest land, built-up land, fishing grounds and carbon.
Data source: Global Footprint Network, 2011

Ecological Footprint and Sustainable Consumption in China
8
Since around 1970, the world has been in a state of ecological overshoot (Figure 1.2). Human’s demand on the Earth’s ecosystems has exceeded its regenerative capacity. In 2008, the Earth’s total biocapacity was 12 billion gha, or 1.8 gha per person, while the Ecological Footprint worldwide was 18.2 billion gha, or 2.7 gha per person.
This means that it would take 1.5 years for the Earth to fully regenerate the renewable resources that people use in one year. In other words, we use the equivalent of 1.5 Earths to support our current consumption.
Nearly 90 countries have a per capita Ecological Footprint which is greater than the available global average biocapacity (1.8 gha).
Figure 1-2 Trends in global average per capita Ecological Footprint and biocapacity from1961 to 2008
(Data source: Global Footprint Network, 2011)
1.2 Global Ecological Footprint: long- Term And Serious Overshoot
Ecological Footprint and Sustainable Consumption in China
9
Asia's available biocapacity at 2.87 billion gha accounts for 24% of the world’s total. However, Asia's per capita biocapacity, at 0.72 gha, is less than half the world’s average, because of its high population. In fact, relative to other continents, Asia has the world’s lowest per capita biocapacity (Data source: Global Footprint Network).
Asia’s large population (about 60% of the global population) creates 40% of the world’s Ecological Footprint. From 1961 to 2007, Asia's total Ecological Footprint increased nearly 340% to about 5.1 billion gha, while per capita Ecological Footprint increased by about 30% at the same time as Asia's total population more than doubled.
1.3 The Ecological Footprint In Asia: Fast Growth
However, because of different economic development and consumption models, Ecological Footprints vary significantly. For example, the UAE has a per capita ecological footprint of 10.3 gha, the highest in the world, whilst Pakistan’s per capita Ecological Footprint is only 0.75 gha.
Currently, Asia's Ecological Footprint is around 2.5 times that of its biocapacity. China has the largest total Ecological Footprint in the world, followed by India.
Within Asia, this biocapacity deficit is closely related to the overuse of resources and loss of ecosystem services. The biocapacity deficit also arises from imports which embody resource use, therefore using
up other regions' biocapacity and land area. Countries in Asia tend to have net imports of biocapacity. In other words, they import more biocapacity than that used in exports. The biocapacity imported from other regions accounts for about 12% of Asia’s total Ecological Footprint.
While population increase is an important reason for increasing total Ecological Footprint, the increase of per capita Ecological Footprint through consumption has played a significant role. Compared with other regions in the world, Asia has the fastest growing Carbon Footprint, a significant part of total Ecological Footprint.

Ecological Footprint and Sustainable Consumption in China
10
CHAPTER TWO: CHINA'S CONSUMPTION ECOlOGICAl FOOTPRINT
2.1 China’s Per Capita Ecological Footprint Is 2.5 Times Its biocapacity
China's total biocapacity has remained stable over the last 50 years, although its per capita biocapacity has slightly declined in line with its population increase. At the same time, rapid economic development has caused China's Ecological Footprint, whether total amount or per capita volume, to sharply increase to become the highest in the world at 2.9 billion gha in 2008.
Since 1970, the biocapacity deficit has continued to rise. In 2008, China's per capita Ecological Footprint reached 2.1 gha, 2.5 times as much as the available per capita biocapacity in the country of 0.87 gha (Figure 2-1).
Figure 2-1 China's per capita Ecological Footprint and biocapacity from 1961 to 2008
(Data Source: Global Footprint Network, 2011)

Ecological Footprint and Sustainable Consumption in China
11
In 2008, China's per capita Ecological Footprint was 2.1 gha, nearly 80% that of the global per capita average of 2.7 gha. However, China's per capita household consumption was 879 USD, less than 24% of global per capita expenditure by households. These differences suggest that China's per capita consumption of ecological resources per $ is relatively high, suggesting low resource-use efficiency (Figure 2.2). If these trends persist, its per capita natural resource consumption will very quickly exceed the average global level.
2.2 China’s Resource Use Is Relatively Inefficient
4.0
3.5
3.0
2.5
2.0
1.5
1.0
0.5
0Household final consumption expenditure,
PPP in 2010/1,000USDPer Capita Ecological Footprint in
2008/ gha
WorldChina
Key
Figure 2-2 Comparison of China's and global per capita GDP and Ecological Footprint (2008)
(Data Source:Institute of Geographical Sciences and Natural Resource Research, Chinese Academy of Sciences &World Bank WDI Database, 2008)

Ecological Footprint and Sustainable Consumption in China
12
We can further explore China’s relative resource efficiency by looking at the relationship between per capita consumption and Ecological Footprint for China, the USA, UK and South Africa.
Across these four countries, the level of Ecological Footprint is roughly proportional to per capita household and government consumption (Figure 2.3).
If we look in more detail at the figures, in China, every 1000 USD of consumption produces 0.77 gha of Ecological Footprint. This impact is much higher than that of the US and UK at 0.17 gha and 0.16 gha respectively, and over twice as high as South Africa (0.35 gha) which is at a comparable level of development to China. This analysis supports the previous conclusion that China has a relatively low efficiency of resource use which therefore needs to increase in order to create more sustainable consumption and reduce environmental pressure.
2.3 The Relative Resource Efficiency Of Consumption Expenditure Across Four Countries
Per capita consumption, PPP/ USD1,000
Per
capi
ta E
colo
gica
l Foo
tpri
nt/g
ha
Figure 2-3 Relationship between per capita consumption (PPP ) and per capita Ecological Footprint for China, the USA, UK and South Africa
(Data Source: Institute of Geographical Sciences and Natural Resource Research, Chinese Academy of Sciences &World Bank WDI Database, 2008)
8.00
7.00
6.00
5.00
4.00
3.00
2.00
1.00
0.0010.00 20.00 30.00 40.00 50.000.00
South Africa
China
UK
USA

Ecological Footprint and Sustainable Consumption in China
13
Figure 2.4 shows that China has relatively l o w l e v e l s o f c u r r e n t c o n s u m p t i o n expendi ture compared wi th capi ta l investment if we look across China, USA, UK and South Africa.
2.4 China Has Relatively lowConsumption Expenditure Relative To Investment In Infrastructure
Figure 2-4 GDP components of China, the USA, UK and South Africa
(Data Source: World Bank WDI Database,2010)
140000.0
120000.0
100000.0
80000.0
60000.0
40000.0
20000.0
0.0
-20000.0 UKUSA South Africa China
USD 100 million
Consumption Expenditures Gross InvestmentNet Exports
Key

Ecological Footprint and Sustainable Consumption in China
14
We can also look at consumption-to-GDP levels. In 2010, China's household consumption accounted for 34.4% of GDP, while government consumption (mostly public procurement) accounted for 11.7%. Compared with consumption-to-GDP ratios in the USA and UK (both developed countries) and in South Africa (emerging market), Figure 2-5 shows that China's household consumption-to-GDP ratio was the lowest among the four countries, and about half that of the USA and UK.
According to China’s 12th Five-Year Plan, China's economic growth model will change from being investment and export-led to one driven by domestic demand. As a result, household consumption is likely to become the main driver of future growth in China's Ecological Footprint.
19.7%
59.8%
23.1%
64.4%
17.5%
70.9%11.7%
34.4%
UKUSA South Africa
Figure 2-5 Comparison of the consumption-to-GDP ratios of China, the USA, UK and South Africa
(Data Source: World Bank WDI Database, 2010)
100.0%
80.0%
60.0%
40.0%
20.0%
0.0%
Government consumptionResident consumption
China
Key

Ecological Footprint and Sustainable Consumption in China
15
T h e c o n s u m p t i o n e l e m e n t s o f t h e Ecological Footprint have been broken down by the Global Footprint Network into the household consumption categories of: clothing, food, housing, transport and services. Food consumption includes consumption inside or outside the home; residential consumption includes housing services, housing energy and water use as well as consumption of appliances and devices which improve comfort and convenience; transport can be direct or indirect (in other words household use or transport involved in moving goods and services); and services include cultural and entertainment services, medical and health care services, as well as use of public services. On these measures, food, housing and transport generate most of the world’s Ecological Footprint.
Expenditure on food, transport and
2.5 China Has Relatively less Service Consumption
housing account for nearly 80% of per capita consumption in China, whereas in the USA, UK and South Africa, there is relatively more consumption of culture, entertainment and other services (Figure 2.6). Food consumption alone in China a c c o u n t s f o r 4 1 % o f t h e E c o l o g i c a l Footprint, which is 10% higher than that in South Africa, also an emerging economy.
The Ecological Footprint generated b y s e r v i c e c o n s u m p t i o n ( i n c l u d i n g entertainment and recreation services) accounts for less than 10% of the total Ecological Footprint in many countries around the world. However, in developed countries, the output value of the service industry can account for nearly 80% of total economic value, indicating that service industries can generate relatively high economic benefits. At the same time, services tend to use fewer resources.
In China, the output value of the service industry currently accounts for around 50% of GDP and the Ecological Footprint generates a relatively low economic value. This suggests that China's economic development and domestic consumption could include a greater proportion of services.

Ecological Footprint and Sustainable Consumption in China
16
Figure 2-6 The impacts of different kinds of household consumption on the Ecological Footprints of China, USA, UK and South Africa.
(Data Source: Global Footprint Network, 2011)
Food
Hou
sing
Hou
se D
ecor
atio
n an
d M
aint
enan
ce
Cul
tura
l and
E
nter
tain
men
t Ser
vice
s
Hot
el a
nd R
esta
uran
t Se
rvic
es
Tran
spor
tati
on
Com
mun
icat
ions
Hea
lth
Car
e
Edu
cati
on
Oth
er S
ervi
ces
Clo
thes
and
Sh
oes
Win
es a
nd
Toba
cco
45%
40%
35%
30%
25%
20%
15%
10%
5%
0%
ChinaUSA UKSouth Africa
Key

Ecological Footprint and Sustainable Consumption in China
17
CHAPTER THREE: ECOlOGICAl FOOTPRINT COMPARISON ANAlYSIS IN CHINA
3.1 Ecological Footprint Is Unevenly Distributed Across China
Ecological Footprint is closely related to per capita GDP across China
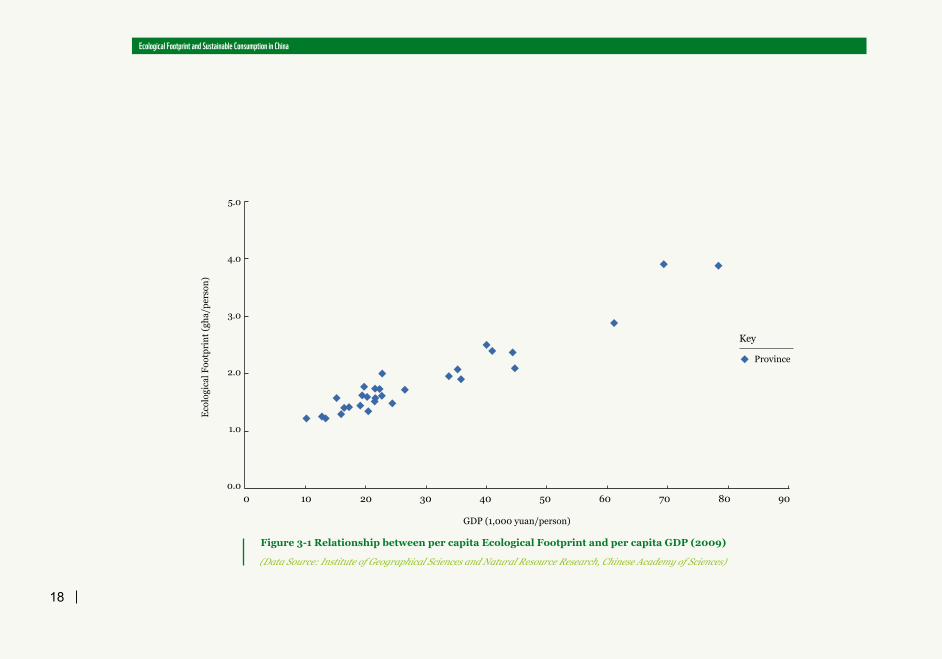
Ecological Footprints and per capita GDP of different provinces, municipalities and autonomous regions show positive correlations (Figure 3-1).
In 2009, f ive provinces Guangdong, Shandong, Jiangsu, Henan and Zhejiang -consumed 35% of the Ecological Footprint of China. Of these, Jiangsu and Zhejiang are also in the top five provinces for GDP per capita, while the other three also rank
highly: Guandong (7th), Shandong (10th) although Henan is 23rd. Guangdong alone accounts for nearly 10% of the national Ecological Footprint.
The Tibet Autonomous Region, Qinghai, Ningxia, Hainan and Gansu together account for only about 3% of total Ecological Footprint (Figure 3.2). These areas also have relatively low per capita GDP.
Ecological Footprint and Sustainable Consumption in China
18
GDP (1,000 yuan/person)
Eco
logi
cal F
ootp
rint
(gha
/per
son)
Figure 3-1 Relationship between per capita Ecological Footprint and per capita GDP (2009)
(Data Source: Institute of Geographical Sciences and Natural Resource Research, Chinese Academy of Sciences)
5.0
4.0
3.0
2.0
1.0
0.010 20 30 40 50 60 70 80 900
Province
Key

Ecological Footprint and Sustainable Consumption in China
19
Prop
orti
on o
f Eco
logi
cal F
ootp
rint
to n
atio
nal t
otal
Figure 3-2 Proportion of Ecological Footprint to national total in different provinces, municipalities and autonomous regions of China (2009)
(Data Source: Institute of Geographical Sciences and Natural Resource Research, Chinese Academy of Sciences\)
Gua
ngdo
ng
Shan
dong
Jian
gsu
Hen
an
Zhej
iang
Sich
uan
Heb
ei
Hun
an
Hub
ei
Liao
ning
Anh
ui
Shan
ghai
Fujia
n
Bei
jing
Hei
long
jiang
Gua
ngxi
Jian
gxi
Inne
r M
ongo
lia
Tibe
t
Qin
ghai
Nin
gxia
Hai
nan
Gan
su
Tian
jin
Xin
jiang
Jilin
Gui
zhou
Yunn
an
Shaa
nxi
Cho
ngqi
ng
Shaa
nxi
10.0
9.0
8.0
7.0
6.0
5.0
4.0
3.0
2.0
1.0
0.0
Ecological Footprint and Sustainable Consumption in China
20
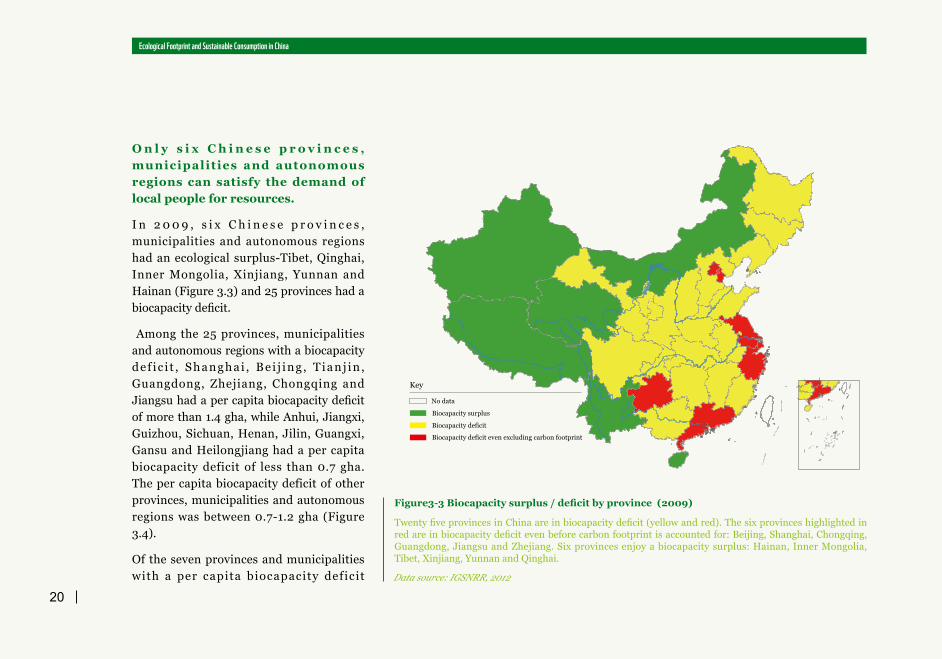
Figure3-3 Biocapacity surplus / deficit by province (2009)
Twenty five provinces in China are in biocapacity deficit (yellow and red). The six provinces highlighted in red are in biocapacity deficit even before carbon footprint is accounted for: Beijing, Shanghai, Chongqing, Guangdong, Jiangsu and Zhejiang. Six provinces enjoy a biocapacity surplus: Hainan, Inner Mongolia, Tibet, Xinjiang, Yunnan and Qinghai.
Data source: IGSNRR, 2012
O n l y s i x C h i n e s e p r o v i n c e s , municipalities and autonomous regions can satisfy the demand of local people for resources.
I n 2 0 0 9 , s i x C h i n e s e p r o v i n c e s , municipalities and autonomous regions had an ecological surplus-Tibet, Qinghai, Inner Mongolia, Xinjiang, Yunnan and Hainan (Figure 3.3) and 25 provinces had a biocapacity deficit.
Among the 25 provinces, municipalities and autonomous regions with a biocapacity de f i c i t , Shanghai , Be i j ing , T ianj in , Guangdong, Zhejiang, Chongqing and Jiangsu had a per capita biocapacity deficit of more than 1.4 gha, while Anhui, Jiangxi, Guizhou, Sichuan, Henan, Jilin, Guangxi, Gansu and Heilongjiang had a per capita biocapacity deficit of less than 0.7 gha. The per capita biocapacity deficit of other provinces, municipalities and autonomous regions was between 0.7-1.2 gha (Figure 3.4).
Of the seven provinces and municipalities with a per capita biocapacity deficit

Ecological Footprint and Sustainable Consumption in China
21
Per
Cap
ita/
Gha
Figure 3-4 Contrasting levels of per capita Ecological Footprint and per capita biocapacity for different provinces, municipalities and autonomous regions in China
(Data Source: Institute of Geographical Sciences and Natural Resource Research, Chinese Academy of Sciences, 2009)
Bei
jing
Shan
ghai
Tian
jin
Inne
r M
ongo
lia
Gua
ngdo
ng
Zhej
iang
Jian
gsu
Liao
ning
Cho
ngqi
ng
Fujia
n
Shan
dong
Xin
jiang
Nin
gxia
Hei
long
jiang
Jilin
Qin
ghai
Hub
ei
Hun
an
Shaa
nxi
Tibe
t
Shan
xi
Heb
ei
Hai
nan
Sich
uan
Jian
gxi
Anh
ui
Hen
an
Gua
ngxi
Gan
su
Gui
zhou
Yunn
an
BiocapacityEcological Footprint
Key
5.0
4.5
4.0
3.5
3.0
2.5
2.0
1.5
1.0
0.5
0.0
larger than 1.4 gha, Tianjin, Shanghai, Beijing, Jiangsu and Zhejiang are the top 5 provinces for per capita GDP nationwide, and Guangdong the seventh. Of the six
provinces and autonomous regions which have an ecological surplus, Tibet and Yunnan rank among the lowest 4 in per capita GDP.

Ecological Footprint and Sustainable Consumption in China
22
3.2 Provinces with high Ecological Footprints tend to have few or no Ecological Function Zones
If we look at the Ecological Footprints of different provinces, municipalities and autonomous regions alongside the location of China’s Ecological Function Zones, there is a mismatch (Figure 3.5). For example, Guangdong, with an Ecological Footprint accounting for 10% of the national total, only has a functional zone for biodiversity in its northern mountainous area. Shandong, Jiangsu, Henan and Zhejiang have no national Ecological Function Zones, but the Ecological Footprint of these provinces respectively accounts for more than 5% of the national total.
On the other hand, although Tibet, Qinghai, Ningxia and Gansu have the most important Ecological Function Zones in China, their Ecological Footprints together only account for less than 3% of the national total. To
some extent, these variations reflect the differences between the east and west of China in terms of relative economic development and ecological function of the area.
Overall , this mismatch of Ecological Function Zones and regions of high Ecological Footprint means that the latter not only use their own biocapacity but also that of others, suggesting the need for greater ecological compensation.
Consumers often do not realize that the environmental impact of their goods and services affects the natural resources and ecosystem services of other regions. China therefore also needs to promote sustainable product certification so that consumers can be encouraged to engage
in sustainable consumption. Certification enables consumers to know whether or not particular goods have been produced sustainably throughout the entire supply chain. One example is that of a clear logo on those products which have met standards for sustainable wood use as developed and promoted by the Forest Stewardship Council.

Ecological Footprint and Sustainable Consumption in China
23
Figure 3-5 National Ecological Functional Zones of China

Ecological Footprint and Sustainable Consumption in China
24
3.3 Ecological Footprints Are Affected by Different Kinds Of Consumption Across China
The Ecological Footprints of 5 provinces and municipalities at different economic levels were compared: Beijing, the political, high-tech and economic development center of China; Shanghai, the financial center of China and manufacturing center of the Yangtze River Delta; Guangdong, the manufacturing center of the Pearl River Delta; Henan, the largest province in for agricultural development and population in the middle of China; Guizhou, part of Western China (Figure 3.6)
The main factors affecting per capita Ecological Footprint are: housing and food, which is highest in Beijing and Shanghai (Figure 3.7). However, food, as a proportion of total footprint has the highest percentage in Ghiuzhou at 41% compared to 28.7% in Beijing. The per capita Ecological Footprint
for services is closely related in amount and percentage of total footprint to the level of economic development; again, it is the highest in Beijing (16.4%) and Shanghai (12.7%) and with the lowest proportion in Henan at 3.7%.
Transport makes up relatively more of the total footprint in Beijing, Shanghai and Guandong than in Henan and Guizhou.

Ecological Footprint and Sustainable Consumption in China
25
Figure 3-6 Breakdown of per capita Ecological Footprint in 2009 by components (gha)
(Data Source: Institute of Geographical Sciences and Natural Resource Research, Chinese Academy of Sciences)
HenanGuangdongShanghaiBeijing Guizhou
5.0
4.0
3.0
2.0
1.0
0.0
Built-up Land (gha)Carbon Carbon (gha)Forest (gha)Fishing Grounds (gha)Grazing Land (gha)Cropland (gha)
Figure 3-7 Breakdown of per capita Ecological Footprint in 2009 by consumption types (gha)
(Data Source: Institute of Geographical Sciences and Natural Resource Research, Chinese Academy of Sciences)
5.0
4.0
3.0
2.0
1.0
0.0
Service Transportation Housing FoodClothes
HenanGuangdongShanghaiBeijing Guizhou

Ecological Footprint and Sustainable Consumption in China
26
CHAPTER FOUR: URbANIZATION AND ECOlOGICAl FOOTPRINT
4.1 Urbanization Is A Major Driving Force Of China’s Ecological Overshoot
Urbanization tends to drive an increase in people’s income which leads to increased consumption and therefore a larger Ecological Footprint. From 1980 to 2011, the urbanization rate in China increased from 26% to 51.3% of the population, while the proportion of urban residents within total consumption increased from 40% to nearly 80%.
The rising per capita Ecological Footprint has kept roughly in line with this increase in urbanization (Figure 4-1).
Appendix 1 also shows the varying relationships between urbanization and the different dimensions of the Ecological Footprint across China.
Figure 4-1 Per capita Ecological Footprint and urbanization coverage rate in China
(Data Source: Institute of Geographical Sciences and Natural Resource Research, Chinese
2.5
2.0
1.5
1.0
0.5
0.0 1970
1972
1974
1976
1978
1980
1982
1984
1986
1988
1990
1992
1994
1996
1998
2000
2002
2004
2006
2008
Com
pari
son
wit
h th
at in
197
0Per capita Ecological FootprintUrbanization rate
Key

Ecological Footprint and Sustainable Consumption in China
27
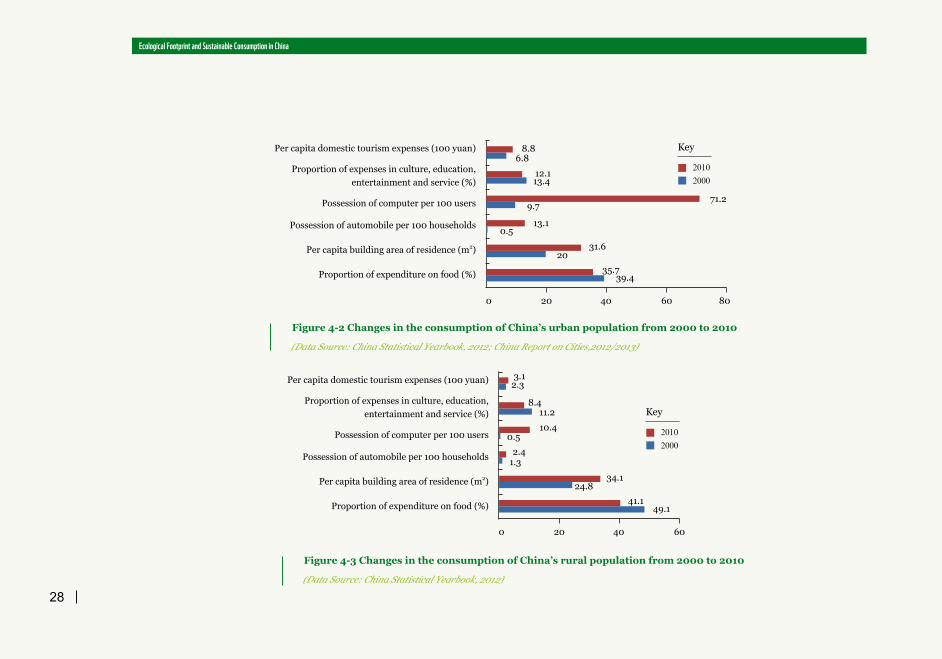
According to the China Statistical Yearbook 2012, the consumption of the urban population is about three times that of the rural population.
F i g u r e s 4 - 2 a n d 4 - 3 c o m p a r e t h e consumption of urban and rural populations between 2000 and 2010. Both show similar trends but at different levels.
Looking just at Figure 4.2 for urban areas, from 2000 to 2010, the changes in urban consumption were:
● Large increase in car ownership and use which increased the Ecological Footprint
for transport;
● Greater use of computers and the internet in urban families (above 70%);
● Relative decline in consumption of cultural, education and recreational services and food. This indicates that in China, the development of the service sector has been relatively slower than that of the industrial sector.
4.2 Widening Differences between The Ecological Footprints Of Urban And Rural Populations In China
Ecological Footprint and Sustainable Consumption in China
28
80
Figure 4-2 Changes in the consumption of China’s urban population from 2000 to 2010
(Data Source: China Statistical Yearbook, 2012; China Report on Cities,2012/2013)
8.8
12.1
71.29.7
13.1
0 20 40 60
0.5
31.620
35.739.4
6.8
13.4
Per capita domestic tourism expenses (100 yuan)
Proportion of expenses in culture, education, entertainment and service (%)
Possession of computer per 100 users
Possession of automobile per 100 households
Per capita building area of residence (m2)
Proportion of expenditure on food (%)
2010
2000
Key
Figure 4-3 Changes in the consumption of China’s rural population from 2000 to 2010
(Data Source: China Statistical Yearbook, 2012)
3.1
8.4
2.3
0.510.4
2.4
0 20 40 60
1.3
34.124.8
41.149.1
11.2
Per capita domestic tourism expenses (100 yuan)
Proportion of expenses in culture, education, entertainment and service (%)
Possession of computer per 100 users
Possession of automobile per 100 households
Per capita building area of residence (m2)
Proportion of expenditure on food (%)
2010
2000
Key

Ecological Footprint and Sustainable Consumption in China
29
4.3 China’s Car Use And Ownership Is Rising Rapidly And Creating High Co2 Emissions
The car market rapidly developed during the 11th Five-Year Plan period which ran from 2005 to 2010, with a Compound Annual Growth Rate (CAGR) of over 25%. Some cities even planned for the automobile industry to be a key growth sector. In urban areas, on average, every 100 households owned 13.1 automobiles in 2010, rising by over 60% to 21.5 in 2012. In Beijing, in 2012, every 100 households owned more than 60 private cars.
This rapid increase in car consumption has resulted in huge carbon emissions. OECD statistics show that in 2011 Shanghai was the highest ranked global city for CO2 emissions (more than 25 million tons). Beijing and Tianjin ranked fourth and fifth, each with a CO2 emission level of more than 15 million tons (Figure 4-4). These emissions have serious impacts on air quality and health.
100,
000
tons
Figure 4-4 CO2 emissions from transport in international major cities in 2011
(Data Source: OECD, Cities and green growth)
3000.0
2500.0
2000.0
1500.0
1000.0
500.0
0.0
2532.2
1910 1904.63 1816.2
1489.41319.2
1109.871062.62 1046
561
313.6 189.3 129.68 34.632
Shan
ghai
Los
Ang
eles
Ban
gkok
Bei
jing
Tian
jin
New
Yor
k
Chi
cago
Lond
on
Toro
nto
Cap
e To
wn
Pari
s
Prag
ue
Bar
celo
na
Gen
eva

Ecological Footprint and Sustainable Consumption in China
30
CHAPTER FIvE: POlICY RECOMMENDATION
By looking at the different relationships between the Ecological Footprint and consumption structure across China, we can better suggest ideas for how to create an ‘ecological civilisation’.
The Ecological Footprint is closely related to levels of economic development and urbanization. Rapid increases in both wil l put further pressure on China’s environment. China’s consumption model needs to change, particularly because of the excessive use of resources and the slow increase in service consumption.
In order to develop an ecological civilization and realize sustainable development, we suggest government policies to promote sustainable consumption and guide the transformation of the current consumption model.
I. Improve resource consumption and environmental efficiency, and promote transformation towards sustainable consumption
Compared with developed countries, China generates far less economic benefit from consumption of natural resources. China’s household consumption also accounts for a much smaller percentage of the economy relative to more developed countries, and there is also a relatively smaller percentage of services. Both the consumption structure and efficiency of resource use could be improved through:
1 . P o l i c y g u i d a n c e a n d s u p p o r t f o r the development of low resource-use services such as education, culture and entertainment, to transform China’s consumption model from high resource use
to more service consumption;
2. Policy guidance and encouragement to drive the improvement of resource use efficiency through, for example, green taxes and subsidies, the introduction of new green technologies, and development of industrial standards;
3. Wide application of resource efficiency indicators by local governments and enterprises within policy planning and implementation, as well as integration of resource efficiency indicators into the assessment systems for local government officials.

Ecological Footprint and Sustainable Consumption in China
31
I I . C o o r d i n a t e l o c a l e c o n o m i c development with resource and environmental protection, leading to sustainable consumption and more balanced development levels across China.
Ecological Footprints correlate positively with per capita GDPs across different provinces, municipalities and autonomous regions of China. The eastern area with insufficient biocapacity is consuming the biocapacity of the less developed western areas. Major Ecological Function Zones, which tend to be in relatively less economically developed areas, are under great pressure. China needs to better balance, or harmonise, the relationship between economic development and the environment, taking into account the characteristics and situations of different areas.
Appropriate local policies should take into account the available biocapacity, current level of economic development, the consumption models and location of particular development Zones.
We encourage market-based methods for promoting a sustainable ecological system, alongside frameworks of appropriate and enforced regulat ion, as wel l as infrastructure and supportive policy. Great efforts should also be made to use national-level ecological compensation mechanisms between di f ferent areas to promote improved coordination between economic development and environmental protection.
I I I . C o n t r o l u r b a n E c o l o g i c a l Footprint
T h e p o s i t i v e r e l a t i o n s h i p b e t w e e n the Ecological Footprint and level of
urbanization indicates that urbanization causes great pressure on resources and ecosystem serv ices . The increas ing urbanization rate will clearly exacerbate this trend. Planning should promote low-carbon and more ecological urban development, be coordinated between rural and urban areas, and promote environment-friendly consumption.
Planning, layout and control of urban and rural residential space and transport models will be core elements of this strategy, particularly in order to reduce the extremely high levels of carbon emissions. Space should also be limited for urban and rural development in order to avoid excessive land-use.

Ecological Footprint and Sustainable Consumption in China
32
I V . P r o m o t e t r a n s f o r m a t i o n o f the economy towards sustainable consumption, particularly through public participation
1. Advocate and promote low-carbon and environment-friendly consumption which would include: encouraging moderate consumption; adopting economic incentives for certified green products; ability to choose environment-friendly products and services; and supporting the establishment and development of markets for ecological products. The Chinese Government should also set a good example through their own green purchasing and energy-saving practices. It should also introduce green infrastructure planning and improve the
long-term service capacity of infrastructure in order to reduce the amount of repeat and low-quality construction.
2. Promote Ecological Footprint and sustainable consumption concepts, and boost sustainable consumption through public participation techniques such as community promotion, roundtables and public dialogues.
3 . R e l e a s e i n f o r m a t i o n a b o u t t h e environmental impact of products and expose enterprises which pollute heavily, have high energy use or large Ecological Footprints. This information will increase transparency and can also underpin the development of effective public supervision of enterprises to promote sustainable
consumption.
4. Make full use of media, environmental p r o t e c t i o n N G O s , a n d o t h e r n o n -governmental institutions, to promote the ideas and practices of sustainable consumption and Ecological Footprints.

Ecological Footprint and Sustainable Consumption in China
33
APPENDIx 1
Urbanisation rates and a breakdown of ecological footprint dimensions for different regions in China
(a) Western Provinces, Regions and Municipality
Inne
r M
ongo
lia
Nin
gxia
Sich
uan
Shaa
nxi
Qin
ghai
Xin
jiang
Gua
ngxi
Yunn
an
Gan
su
Gui
zhou
Cho
ngqi
ng
Tibe
t
3.0
2.5
2.0
1.5
1.0
0.5
0.0
Built-up Land (gha)Carbon Carbon (gha)Forest (gha)Fishing Grounds (gha)Grazing Land (gha)Cropland (gha)Urbanization rate in 2009Urbanization rate in 2011
Key

Ecological Footprint and Sustainable Consumption in China
34
(b) Eastern Provinces and Municipalities
5.0
4.0
3.0
2.0
1.0
0.0
Bei
jing
Shan
ghai
Tian
jin
Zhej
iang
Heb
ei
Fujia
n
Shan
dong
Gua
ngdo
ng
Jian
gsu
Hai
nan
Built-up Land (gha)Carbon Carbon (gha)Forest (gha)Fishing Grounds (gha)Grazing Land (gha)Cropland (gha)Urbanization rate in 2009Urbanization rate in 2011
Key

Ecological Footprint and Sustainable Consumption in China
35
(c) Provinces in Central China
1.81.61.41.21.00.80.60.40.20.0
Sha
nxi
Hub
ei
Hun
an
Jian
gxi
Anh
ui
Hen
an
Built-up Land (gha)Carbon Carbon (gha)Forest (gha)Fishing Grounds (gha)Grazing Land (gha)Cropland (gha)Urbanization rate in 2009Urbanization rate in 2011
Key

Ecological Footprint and Sustainable Consumption in China
36
(d) Provinces in Northeastern China
Figure 4-5 Urbanization vs Per Capita Ecological Footprint, 2009
(Data Source: National Economy and Social Development Statistical Bulletins, 2009 and 2012; Institute of Geographical Sciences and Natural Resource Research, Chinese Academy of Sciences, 2012)
2.5
2.0
1.5
1.0
0.5
0.0
Jilin
Liao
ning
Hei
long
jiang
Built-up Land (gha)Carbon Carbon (gha)Forest (gha)Fishing Grounds (gha)Grazing Land (gha)Cropland (gha)Urbanization rate in 2009Urbanization rate in 2011
Key
(a) Eastern China
5.00
4.00
3.00
2.00
1.00
0.000.00% 10.00% 20.00%
y=5.2131x-0.798
R2=0.9434
30.00% 40.00% 50.00% 60.00%
Urbanization Rate
Eco
logi
cal F
ootp
rint

Ecological Footprint and Sustainable Consumption in China
37
(b) Western China
3.00
2.50
2.00
1.50
1.00
0.50
0.000.00% 10.00% 20.00%
y=3.2689x+0.3164
R2=0.5749
30.00% 40.00% 50.00% 60.00%
Urbanization Rate
Eco
logi
cal F
ootp
rint
(c) Provinces, Autonomous Regions and Municipalities of China
Figure 4-6 Correlation between Urbanization and Per Capita Ecological Footprint
4.50
4.00
3.50
3.00
2.50
2.00
1.50
1.00
0.50
0.000.00% 20.00%
y=4.2339x-0.1222
R2=0.5521
40.00% 60.00% 80.00% 100.00%
Urbanization Rate
Eco
logi
cal F
ootp
rint
Ecological Footprint and Sustainable Consumption in China
38
REFERENCE
(1) China Ecological Footprint Report 2012, World Wild Fund for Nature
(2) China Ecological Functional Zoning, 2008
(3) China Statistical Yearbook 2010
(4) China Statistical Yearbook 2012
(5) Provincial, Municipal National Economy and Social Development Statistical Gazette 2009
(6) Provincial, Municipal National Economy and Social Development Statistical Gazette 2012
(7) China City Status Report, 2012/2013
(8) Beijing, Shanghai Urban Transportation Energy-Consumption and Greenhouse Gases Comparison, Energy Research Institute, National Development and Reform Commission 2010
Data in the report come from Global Footprint Network, the World Bank, Geosciences and Resource Institute of the China Academy of Sciences, China National Statistical Bureau

Ecological Footprint and Sustainable Consumption in China
39
Copy of the report for education or with other non-commercial purposes does not require a written consent from the owner of the copyright. However, a written notice to WWF in advance should be required. Copy of the report for sales or with other commercial purposes without the consent of the owner of the copyright is prohibited.
Acknowledgement to the following people who provide precious suggestions and contributions:
Jin Zhonghao, Zhou Xiaojing, Huang Lihua, Hu Dongwen, Mu Lingling
Cover photo: Brent Stirton / Getty Images / WWF-UK

Ecological Footprint and Sustainable Consumption in China
WWW.WWFCHINA.ORG© 1986 Panda symbo l WWF – World Wide Fund For Nature (Formerly World Wildlife Fund )® “WWF” is a WWF Registered Trademark.
RECYClED
Why we are here.To stop the degradation of the planet's natural environment and to build a future in which humans live in harmony with nature.
2015Our goal: by 2015 China’s trade, aid investment policies integrate solid environmental principles.
1961WWF was founded in 1961.
+100WWF is in over 100 countries, on 5 continents. 16 offices are in Africa.
1980WWF has been working in China since 1980. WWF China is headquartered in Beijing and has 9 field offices across the country.


![Relative value (1961=1) - footprintnetwork.org · Po pu l ation Eco og ica F otp rint - Total Ecological Footprint per c pi ta ... EF per capita [gha] 4.92 1.92 156% · EF Carbon](https://img.dokumen.tips/doc/110x75/5be83b8309d3f24f1b8b687a/relative-value-19611-po-pu-l-ation-eco-og-ica-f-otp-rint-total-ecological.jpg)