Embed Size (px)
Citation preview

CHILEAN EXPERIENCE IN DEVELOPING ELECTRIC POWER INFRASTRUCTURE
1st Workshop for APEC Initiative for Enhancing
Quality of Electric Power Infrastructure
August 26th - 27th , 2015

On behalf of Chilean Ministry of Energy, The National Energy Commission and my own, I would like to express our gratitude to the organized committee, to METI, KPMG, APEC, APERC and Japanese government for the opportunity to participate in this APEC Workshop.
The Chilean electric power grid is organized in four independent systems. From north to south, they are the Northern Interconnected System (SING), the Central Interconnected System (SIC), and two medium size systems in the extreme southern region.
3
4
SIC
SING
Aysén
Magallanes
Arica y Parinacota Tarapacá Antofagasta
Atacama Coquimbo Valparaiso Región Metropolitana Lib. Gral. Bdo O’Higgins Bio Bio Araucanía Los Ríos Los Lagos
Aysén Palena General Carrera
Punta Arenas Puerto Natales Porvenir Puerto Williams
15,141 MW Share: 76.4%
4,461 MW Share: 22.8%
50 MW Share: 0.25%
112 MW Share: 0.56%
52,243 GWh 2.66%
17,762 GWh 2.70%
157 GWh 3.70%
297 GWh 2.36%
Gross Capacity Dec-2014
Generation 2014
7,536 MW 3.56%
2,362 MW 6.33%
27.3 MW 12.3%
52.7 MW 1.90%
Max. Demand 2014
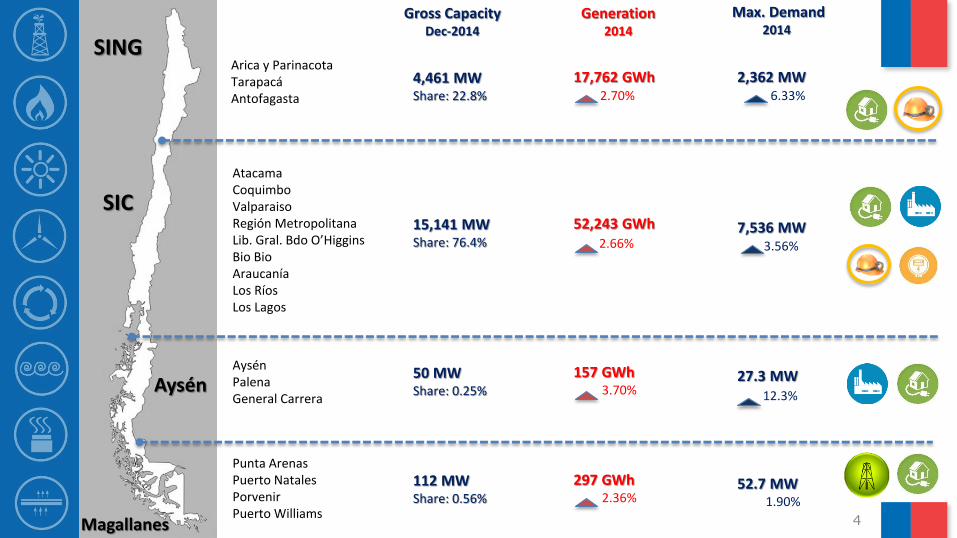
SING and SIC systems are the most relevant, as they concentrate near 99.1% of the installed generation capacity. SING system is almost 100% thermal (99.6% thermal and 0.4% hydraulic), while SIC system is hydrothermal with a mix of 42.7% hydroelectric, 55.0% thermoelectric and 2.3% of wind generation capacity. The other two medium size systems in the southern region of the country have approximately 165 MW of installed capacity.
• SIC system is located between Taltal and the Chiloé Island, covering an extension of 326,412 km2. It supplies more than 90% of Chile’s total population and has an installed gross capacity of 15,141 MW as of december 2014. Maximum demand in the year 2014 was 7,536 MW. In this system, almost 70% of the generation is consumed by regulated customers through distribution companies.
• SING system is located between the cities of Arica and Antofagasta covering an extension of 185,142 km2. It has an installed gross capacity of 4,461 MW as of December 2014. Maximum demand in year 2014 was 2,243 MW. It provides energy mainly to large non-regulated customers as mining and industrial customers which represent near 90% of the total system demand
5

Chilean electricity structure is based on a competitive market with a private efficiently investment in generation and regulated private investment in Transmission & distribution sector.
Generation developers decide upon private assessment what, where, when and how much new capacity is needed.
Technology neutrality except for renewable quota (20%)
Must comply with environmental regulation by applying for license.
Little or no land use regulation.
Installed gross capacity in both SIC and SING interconnected systems per fuel type as of Dec
2014 Source: CNE
Coal24%
Diesel13%
Gas/Diesel23%
Hydro run of the river
12%
Hydro dam22%
Wind2%
Others4%
6

Source: World Bank, Jan 2015
GDP vs. Energy Consumption (2014)
0
5.000
10.000
15.000
20.000
25.000
30.000
35.000
40.000
45.000
50.000
55.000
60.000
65.000
70.000
0 2.000 4.000 6.000 8.000 10.000 12.000 14.000
GDP per capita
Electric power consumption (kWh per capita)
(US$ at current price)
India
United Kingdom
Spain
Germany
France
USA
OECD
Chile 2020 (expected)
Chile 2000
World
Chile 2013

0
2,000
4,000
6,000
8,000
10,000
12,000
14,000
16,000
Gross capacity[MW]
Run of River Dam Coal Gas Diesel Biomass Wind Solar Max Demand
Milestones in the Chilean electricity system
8
Natural gas expansion
Golden Age (Lower energy price)
Gas crisis Higher energy
prices Hydroelectricity
and coal expansion
Diesel and coal
expansion
1980 2011
1982Statutory Decree Nº1
General Law on
Electricity Utilities
1997Regulations Applicable to
the General Law on
Electricoty Utilities
2004Short Law I
2005Short Law II
2006Technical Standard
on Service Quality
and Assurance
2007Statutory Decree Nº 4
General Law on
Electricity Utilities
2008Law 20.257
ERNC quota
obligation
1985Organic Law of the
Superintendence of
Electricity and Fuels
1982 world pioneer
in deregulation
1996 Opportunities to investment
in natural gas technologies
1998 - 1999 Hydro crisis and units failures.
Regulation changes
2004 Argentine cutoff gas to Chile.
Regulation changes
Increased in energy cost
2009 -2015 Drought scenarios
Social rejection
Introduction LNG supply
Renewable energy

Gas crisis, earthquake and dry hydrology. High energy prices for the past seven years. Perfect storm or market failure?
Source: CDEC-SIC, Own eleboration Gas crisis
4 ½ drought years diésel earthquake High availability of Argentinian gas
New LNG Terminals
0
50
100
150
200
250
300
350
400
0
500
1.000
1.500
2.000
2.500
3.000
3.500
4.000
4.500
5.000
1 4 7 10 1 4 7 10 1 4 7 10 1 4 7 10 1 4 7 10 1 4 7 10 1 4 7 10 1 4 7 10 1 4 7 10 1 4 7 10 1 4 7 10 1 4 7 10 1 4 7 10 1 4 7 10 1 4 7 10 1 4 7
2000 2001 2002 2003 2004 2005 2006 2007 2008 2009 2010 2011 2012 2013 2014 2015
Run of river Dam Biomass Wind Solar Coal LNG Diesel Spot price (US$/MWh)
GWh US$/MWh
On the last decade Chile has been facing a several natural disasters events; indeed, just in the last year we facing volcanic eruptions, earthquakes, even storms in the middle of the dessert; and this one was the major storms in the last hundred years
• For all those scenarios, electric power infrastructure has been able to respond appropriately in a quite range of expected quality and safety. However distribution networks has shown several weaknesses especially in terms of resistance to rain, wind, storms and others climate events. These weaknesses have led to the recovery times of service has been higher than expected than according to the rules and standards of quality of service defined by law. In this way, we have some challenges in order to enhance and facilitate the coordination between utilities, ISO and end customers.
• We have stringent earthquake policy regulation for any facility and this design has demonstrated to be effective in our country. However, further progress is still needed in terms of land management plans and in the design of priority infrastructure in tsunami risk areas.
In Chile there has been a kind of perfect storm
• 5 consecutive drought years,
• gas supply restrictions,
• high penetration of non-conventional technologies mainly wind and solar,
• a strong social rejection both generation projects as well as transmission lines,
consequences: • higher power supply costs and
• congestion in transmission networks.
11

• Social Rejection: Not in my backyard effect
• Judicialization: Environmental permit processes normally end in court
• Regulatory uncertainty: Changes in the market rules New energy policy to under discussion
12
Uncertainty in future generation expansion
Regulatory uncertainty
Judicialization of the
approval of new
generation projects
Increasing social
rejection due to
environmental issues
Energy cost?
As a consequence, nowadays there is uncertainty regarding the future energy prices and its associated risks, not being evident the expansion technology that will prevail in the future.
For the main Transmission system, stakeholders play a role in the planning process and make influence to reduce it payment against reliability increasing their market influence.
• For sub-transmission system, which is defined as those lines to supply the utility companies and secondary transmission systems, the rate is determined by tariff studies based on the expected use of the network.
• Nevertheless, the expansion plans are not mandatory, existing high rates of unavailability in this segment (an average 15 hr./yr./customer).
As consequence of this issues and those mentioned before, we are facing congestion scenarios in relevant transmission lines across each interconnected system.
13

Chile’s development is challenged NIMBY reached developing countries
14
How to face this trend ??

In this way, Chile have at least three major challenges in the energy sector
• Improve the grid development through a real long-term energy planning to facilitate competition in generation, help the development of transmission and improve the design of distribution networks considering the technological advances in smart grids, distributed generation and quality of service, and
• to strengthen the empowerment of civil society giving binding solutions as mandatory like a contract between society, government and utilities, and
• design appropriate policies to deal with natural disasters.
15
As a government we have made significant progress in regulatory framework, looking accomplish these objectives
• Redesign of the tender’s process to supply regulated customers in order to increase competition in generation sector.
• A new transmission law (currently in discussion by Senate): which establishes a new electric transmission system and create an independent coordinator for national electrical system. The main characteristics are:
• Strengthening the role of ISO to ensure open access and encourage competition in generation. – Long term energy planning made by the Ministry of energy (at least 30 years) is incorporated. With citizen
participation and considering environmental and territorial restrictions.
– Planning of the grid is performed at least 20 years, mandatory and designed with additional capacity for the future.
– alternative outlines when necessary, are determined by the Ministry of Energy considered environmental assessment and sustainability of projects resilience disaster criteria
– New tariff mechanism for recover investment of transmission facilities (stamp)
16

APEC assistance
Chile is going moving forward to new and modern Power Market: our view aims at a reliable, sustainable, and inclusive energy development at reasonable prices. The kind of assistance from APEC does to Chile should be oriented to:
• Discussion in order to exchange our experiences and shared the lessons learned based in each economy experience
• to facilitate enough discussion scenarios, and working group related with the main issues of Asia and Pacific power markets and propose solution based in this discussion and experiences
• To promote roadshows in order to invite to invest in our market. We believe now is the perfect time, and full of opportunities especially in the energy sector in Chile.
18

Energy Agenda
19
“…to tackle barriers for NCRE in Chile, compromising that at least 45% of the electricity generation to be installed in the country between 2014 and 2025 come from such sources…”
Commitment of 20% NCRE at 2025

Solar, Wind and Hydro energy potential by technology
• Solar-PV with tracking: 1,263 GW
• CSP with storage: 548 GW
• Wind (0.34)
* This is only a technical and probabilistic potential without taking account technical-economics key variable..
Technology Installed Capacity
[MW]
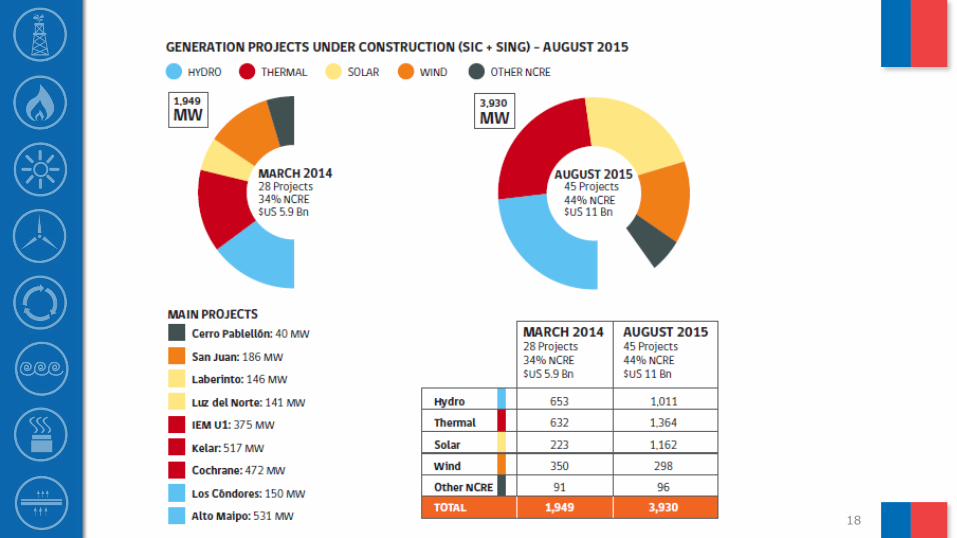
Under construction
[MW]
Approved [MW]
Potential* [MW]
PF Under
Assessment [MW]
Small hydro 368 57 337 7,951 0.63 215
Wind 832 165 5,513 37,477 0.34 1,960
Large hydro 6,017 1,021 1,352 4,521 0.61 611
Solar-PV 452 748 8,173 1,263,407 0.33 4,792
Solar -CSP 0 110 760 548.478 0.52 370
Geothermal 0 0 120 16,000 0.85 0
Total 7,669 2,101 10,478 1,840,394 - 7,948
Source: SEIA, CNE, Min Energia, CDEC, Jan 2015
Thank you
For more information please visit our website:
www.minenergia.cl
www.cne.cl
Contact info:
Víctor J. Martínez [email protected]
Fernando Flatow [email protected]
21