Embed Size (px)
Citation preview

THIS REPORT CONTAINS ASSESSMENTS OF COMMODITY AND TRADE ISSUES MADE BY
USDA STAFF AND NOT NECESSARILY STATEMENTS OF OFFICIAL U.S. GOVERNMENT
POLICY
Date:
GAIN Report Number:
Approved By:
Prepared By:
Report Highlights: Opportunities vary depending on the subsector within the HRI sector. Increasing economic prosperity and changing
consumption patterns offer new opportunities for U.S. products but competition from local producers and neighboring
countries will remain fierce.
María José Herrera M.,
Marketing Specialist
Rachel Bickford,
Agricultural Attaché
HRI Food Service Sector
Food Service - Hotel Restaurant Institutional
Chile
CI0030
11/30/2010
Required Report - public distribution

Post:
Executive Summary: Section I. Market Summary
The overall scenario appears highly favorable for the Chilean HRI Food Service sector. Chileans’ busier lifestyles,
more working women, a growing middle class and higher disposable incomes were the main reasons for increased
sales.
Over the past five years the economic conditions of middle- and lower-income segments have been improving while
poverty in Chile has been diminishing so a growing number of Chileans can now pay for a wide range of services
which had been out of their reach before, or were used only sporadically. This trend has been pushing the
expansion of chain restaurants to mid-sized cities and to middle- and lower-income neighborhoods. However, the
most recent survey of income levels in Chile showed a surprising increase in poverty in 2009, the first increase in 20
years. According to the CASEN survey (Socioeconomic Characterization Survey), poverty in Chile increased to
15.1% of the population during 2009, compared to 13.7% in 2006.
Despite this set-back, improvements in purchasing power in the middle class have encouraged the development of
shopping centers, malls and strip centers nationwide, generating space for food services expansion in high-traffic
locations. Chain food services investors have made shopping centers, malls and strip centers a key part of their
growth strategy.
The leading food retailers, Cencosud (Jumbo and Santa Isabel supermarkets) and Wallmart (Lider supermarkets),
invested in introducing self-service cafeterias, coffee shops and increaseing their offering of take-away dishes. Self-
service cafeterias generally provide a full range of home-style meals at highly affordable prices. These outlets cater
for workers in areas where there are few affordable foodservice options. Unimarc, a smaller chain, has a gourmet
ready-to-eat line that the other supermarkets are copying.
Chile enjoys a healthy tourism sector. According to Sernatur (National Tourism Service), the national tourism
industry counted 2.7 million tourists visiting Chile during 2009 and it is expected to reach 3.0 million in 2010.
Even though Chile receives more international tourists than many other countries in the region, revenue generated
by the tourism industry is relatively small. In 2009 Chile generated USD 1.5 billion in revenue from tourism, while
Colombia and Peru generated USD 2.0 billion and Argentina generated over USD 3.0 billion. Nevertheless,
Sernatur is expecting to see a significant increase in tourism dollars in 2010, with projections as high as USD 2.0
billion.
It is estimated that in 2010 Chile will have 4,350,969 obese people (2,732,015 adults, 1,294,649 children and
324,305 senior citizens). Including the 4,679,400 people considered “overweight”, the total reaches 9,030,369
people, equivalent to just over half of the population. As a result of this trend, Chileans are increasingly concerned
about the impact of dietary habits on their health, and are in search of food alternatives which can help them feel
better and avoid obesity. Slowly, processed food services units have incorporated more dishes based on vegetables,
fruit and white meat into their menus. The trend has not only impacted menu design, but has also fuelled the
demand for healthier food.
On January 31, 2008, Chile’s Livestock and Agricultural Service (SAG) approved the entry of U.S. poultry and
turkey into the Chilean market. U.S. poultry benefits from zero-duty tariff rate.
Competitive pricing is very important in the Chilean food market.
Santiago

Advantages Challenges
The domestic farm sector produces a wide variety of crops,
but Chile is still a net importer of most bulk and intermediate
commodities.
Domestic production and European imports present the
greatest challenge to U.S. processed foods.
The depreciation of the U.S. dollar against the Chilean peso
makes U.S. products cheaper for Chilean consumers.
Imports from Asia and other South American countries
usually have lower prices, making them very attractive
to Chileans.
Chile’s healthy export-oriented economy is helping to fuel the
country’s growth rate, and its expanding per-capita income
should continue to increase local demand for food and
beverages.
Less than two percent of beverages in Chile are
imported.
Eighty percent of Chilean companies provide their employees
with in-house food services or vouchers to eat at local
restaurants.
Most Chileans prefer fresh foods, which they perceive
as higher quality
The majority of importers have their main office in Santiago
or the surrounding Metropolitan Region, and many act as
local distributors for foreign products. A good local
distributor will have an aggressive sales force with national
coverage.
Shipping expenses and delivery times and minimum
order quantities (especially by boat) can be onerous.
Imports from neighboring countries have an advantage
here.
Partially processed foods (frozen, etc.) save time and
compensate for lack of kitchen staff abilities.
U.S. products do not enjoy as much of a gourmet
image as European products do. The image should be
strengthened.
Maintenance of cold chain, warehouses and on-time delivery
are appreciated.
Sometimes, U.S. products are perceived to be too
unnatural (long lists of ingredients and additives,
cholesterol and sugar contents, etc.).
The value-added of U.S. products may compensate for the
higher price, especially for large volume products. Portions are not always according to local usage, both
at home and in HRI establishments.
Imported products compensate for seasonal drops in local
production and ensuing price hikes.
Finding a good, reliable distributor is not easy. To gain
an advantage, ensure that the distributor complies with
your quality, customer service and delivery standards.
The Chilean Government predicts between 4.5 and 5.5
percent growth in GDP for 2010.
Chile has Free Trade Agreements with the NAFTA
countries, Mercosur, the European Union, many Latin
American countries, South Korea and China; as such,
U.S. products face stiff price competition.


Author Defined: Section II. Road Map for Market Entry
A. Entry Strategy
Establishing local or regional operations or joint ventures can be a reasonable way to become a player in South
American markets like Chile. Lower-cost supply of competing products from neighboring markets represent a
threat, as cost is a fundamental factor, and an inability to compete on a price basis may be compensated by the
possibility to establish production facilities in Chile or in neighboring countries.
Chileans are generally conservative and traditional, tending to frequent their favorite restaurants and order their
favorite dishes. They place importance on local taste, and thus restaurants will typically offer fresh vegetables,
seafood, meat, and poultry which were purchased locally.
Opportunities exist for U.S. companies interested in supplying specialized categories such as gourmet or ethnic
foods or “functional food” such as probiotic yogurt.
The main opportunities lie with products that guarantee a level of quality control, product uniformity, and reliability
not always available in local products. Part of this is the development of improved distribution service quality
levels.
Chileans are becoming more familiar with foreign products, and promotion of U.S. products is the key for
successful market entry and development.
There is a perceived prestige for European products, thus Chilean buyers must be courted with an image of U.S.
products that compares favorably with their European competitors that already have higher visibility. Suppliers
should highlight the traditional strengths for which the U.S. is recognized, emphasizing quality control, uniformity,
reliability, and innovation.
Organic and natural products serve as a particularly attractive import from the U.S., given that the market is growing
as Chileans become more health-conscious.
B. Market Structure
The HRI sector typically does not import products directly, but contracts with local distributors; almost all foreign
companies wishing to sell food products in Chile must take this route. However, international hotels and restaurants
may have their own distribution networks arranged by company headquarters.
There are a number of large food distributors in Chile which deliver products to clients in the HRI sector, as well as
supermarkets and other food outlets. Distributors will usually ask the end client to pay for transportation costs
outside of Santiago or will already have these additional costs worked into their prices for distribution outside of the
Metropolitan Region.
All HRI sub-sectors procure most of their dry goods from large distributors that also supply supermarkets and other
stores. Specialty products are often purchased at supermarkets, and fresh products are obtained under delivery
contracts with specialized suppliers for each of these, such as beef, fish, produce and fruit (from distributors), and
dairy and poultry (usually from the producers).
The Institutional market buys more products directly from local producers or imports because the companies have
their own purchasing center and storage facilities.
Restaurants depend on large distributors or specialty importers/resellers and make purchases with greater frequency
and in smaller quantities to keep an adequate though limited stock.

The HRI purchasing patterns are heavily price-dependent. This motivates a broad diversification of suppliers for
any one food service institution.
Restaurants use the widest range of food product sources, depending on their product quality, price and delivery
requirements. They complement wholesaler and producer sources with spot purchases in supermarkets to replenish
supplies in limited quantities given their limited warehousing capabilities.
Distribution Channel Diagram
Distributors
Supermarkets: Wholesalers: Traditional
Channels: Others:
D&S /Wal–Mart (Lider) (34%) Rabié (25%) Grocery stores Exports
Cencosud (Jumbo and Santa Isabel) (29%) Adelco (13%) Minimarkets Industrial
Sales
SMU (Unimarc and other small supermarket
chains)(16%) Alvi (30%) Kiosks Casinos
Supermercados del Sur (8%) La Caserita (5%) Gas Stations Pharmacies
Falabella (Tottus) (6%) Mayorista 10
(15%) Retail Malls
Montserrat (2%) Source: Press, ASCH (Supermarket Chilean Association) and company interviews 2010

Source: Chilealimentos 2009
Demand from restaurants and hotels is increasingly more sophisticated, as chefs are becoming more selective about
ingredients and the gourmet food is penetrating the market. Hotels tend to have the most restrictive budgets in this sector,
and price is often a determining factor; approximately 95 percent of their purchases come from local suppliers. Many of
their imports come from specific distributors determined by their headquarters, as they must order specific brands (e.g.,
Special K or Jim Beam) as determined by company policy.
Interviews with managers in the HRI sector reveal that many Chilean consumers are not willing to spend more money to try
a new food product. However, if two items are the same price, a typical consumer may opt for the imported product which
often is deemed as higher quality.
Almost all five-star hotels, high-end restaurants, and institutional food service companies are located in Santiago.
C. Sub-Sector Profiles
1. Hotels and Resorts
According to Sernatur, in Chile there are 4,059 lodging or touristic places to sleep, with a capacity of 71,295 rooms and
152,936 beds, throughout the country.
Food and beverage sales are made through on-site bars, restaurants, and room service.
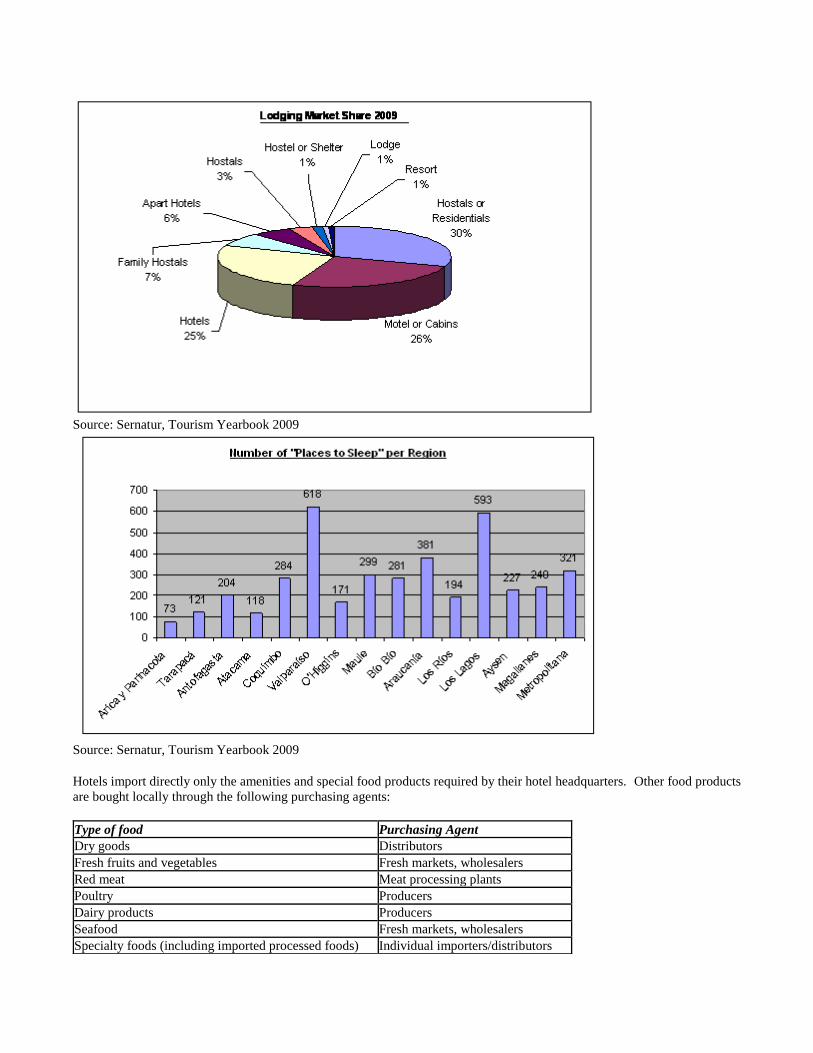
Source: Sernatur, Tourism Yearbook 2009
Source: Sernatur, Tourism Yearbook 2009
Hotels import directly only the amenities and special food products required by their hotel headquarters. Other food products
are bought locally through the following purchasing agents:
Type of food Purchasing Agent
Dry goods Distributors
Fresh fruits and vegetables Fresh markets, wholesalers
Red meat Meat processing plants
Poultry Producers
Dairy products Producers
Seafood Fresh markets, wholesalers
Specialty foods (including imported processed foods) Individual importers/distributors

Organic and natural foods are beginning to increase in popularity in hotels and higher-end lodges. They either
cultivate themselves or buy from local producers.
There are 15 casinos operating during 2009 and 18 approved, which raises the number of outlets authorized to
operate in the country to 24. Some of the factors considered when assigning the licenses were the impact of the
casinos on tourism in the area, as well as hotels, restaurants and other foodservice units.
On average, less than five percent of hotels’ gastronomic budgets go toward imports.
Quality is very important in this sector, as many hotel restaurants only provide the “best” food to their guests.
Given their patrons’ refined tastes, typical imports include caviar, special spices from Asia, top-quality meat
(mainly from Argentina), and other specialized products.
Chileans used to perceive hotel restaurants as too expensive and fairly ordinary. However, this has changed with the
sector’s increased investment in state-of-the-art technology with professional staff, and chefs who have traveled
around the world learning different trends and styles making this cuisine more sophisticated, exclusive and of better
quality.
Hotels are also launching offers for happy hours to attract more customers to their bars and restaurants.
Best Hotel Restaurants
Restaurant
Name Hotel Name Location Type of food Purchasing
Agents
EL CID Hotel Sheraton Santiago International food with French
influence
Third-party
distributor
Brick Hotel Radisson Santiago International
Balandra Gran Hotel Colonos
del Sur Puerto
Varas International with southern Chilean
traditions
Adra Hotel Ritz-Carlton Santiago Mediterranean
BRISTOL Hotel Plaza San
Francisco Santiago
International food based on Chilean
food
ANAKENA Hotel Grand Hyatt Santiago International and Thailand food
Latin Grill Hotel Santiago
Marriott Santiago Meats
Source: “Premiación anual del circulo de cronistas gastronómicos 2009” and Culinary Guide 2009
2. Restaurants
According to Sernatur, during 2009 there were 3,218 food service establishments related to the tourism sector in Chile,
including restaurants, pizza places, coffee shops, fast-food establishments, tea salons, etc. Most of them are located in the
Valparaíso Region (24.3%), followed by the Santiago Metropolitan Region (17.5%), Bío Bío (8,5%), Coquimbo (7,4%) and
then the Southern Region of Los Lagos (7.3%).

Source: Sernatur, Tourism Yearbook 2009
According to the Chilean Gastronomy Association, Achiga, restaurant revenues in the Santiago Metropolitan
Region are increasing after the contraction they had last year. Sales in the second quarter of 2010 grew 6.8 percent
compared to the same period in 2009. It is estimated that the restaurant sector is recovering after the earthquake at
the end of February, 2010.
The economic conditions of middle- and lower-income segments improved, and a growing number of Chileans can
now pay for a wide range of services which had been out of their reach, or were used only sporadically.
Restaurants are one area which is benefiting from the improving economic conditions, which have fuelled the
expansion of restaurant chains to mid-sized cities and to middle- and lower-income neighborhoods. At the same
time, improvements in purchasing power have encouraged the development of shopping centers nationwide,
generating space for fast food restaurants’ expansion in high traffic locations. Fast food restaurant chains have made
shopping centers a key part of their growth strategy.
The leading food retailers, Cencosud (Jumbo and Santa Isabel supermarkets) and D&S/Walmart (Lider
supermarkets), have invested in extending their reach to consumer foodservice by introducing self-service
cafeterias, coffee shops and improving their offering of take-away dishes.
Franchise restaurants experienced tremendous growth in Chile in the 1990s, and fast food establishments have been
particularly successful. There are no laws in the country specifically targeted at franchises. On average, it takes
these restaurants 44 months to recover their initial investment.
Fast food establishments are diversifying their offer with more nutritional information, new Light menus and table
service.
The Chilean fast food industry has estimated annual revenues of USD 250 million.

Selected Fast Food Restaurants
Company Name Sales Range (USD) Country of Origin &
Number of Outlets Location Purchasing
Agents
Mc Donald's USD 5 billion
(worldwide) USA, 75
Nationwide
Third-party
distributor
Doggi’s USD 67 million
(Chile) Chile, 160
Burger King USD 2.2 billion
(worldwide) USA, 32
Kentucky Fried
Chicken USD 40 million USA, 46
Schopdog USD 25 million Chile, 45
Lomitón USD 12 million Chile, 60
Others
Domino’s Pizza
Less than USD 10
million
USA, 21
Nationwide &
Santiago
Dunkin Donuts USA, 38
Pizza Hut USA, 32
Subway USA, 75
Taco Bell USA, N/A
Telepizza Spain, 100
Sources: Chile Potencia Alimentaria, company and press information
Selected Family Restaurants
Company
Name Sales Range
(US$) Country of Origin & Number of
Outlets Location Purchasing Agents
Gatsby USD 30 million Spain, 17
Nationwide Third-party
distributor Tip y Tap USD14 million Chile, 12
Ruby Tuesday USD 2 Million USA, 11
Sources: Chile Potencia Alimentaria, company and press information
Selected Coffee Shops
Company
Name Sales Range (US$) Country of Origin & Number of
Outlets Location Purchasing
Agents
Starbucks USD 2.6 billion
(worldwide) USA, 30 Nationwide
Third-party
distributor
Juan Valdéz N/A Colombia,10 Santiago
Starlight
Coffee USD 1.5 million Chile, 7 Santiago
Tavelli N/A Chile, 15 Santiago
Coppelia USD 10 million Chile, 14 Santiago
Cory USD 4 million Chilean-Austrian, 10 Santiago
Sources: Chile Potencia Alimentaria, company and press information
Franchises.
Over the course of the past five years, the franchising system in Chile has grown 30%. After a boom in growth, the
franchising market in Chile is in a steady and stable growth line. Today there are 65 franchises operating in Chile, invoicing
USD 200 million annually and employing over 20,000 people.
Forty-five percent of all franchises in Chile are in the hotel and restaurant sectors, 50 percent of them come from the U.S.,
with McDonald’s being the most representative. Among the national chains, Lomiton, Doggi’s and Schoppdog are the
leaders. The location strategies are focused on high-traffic locations such as malls, main streets and avenues.

3. Main Institutional Food Service Firms
The Chilean institutional food service industry generated an estimated USD 1.4 billion in revenues in 2009 and the top three
companies control 64 percent of the market. The largest is Central Restaurantes Aramark (“CDR”), with 31 years in the
business, 21,000 employees, and sales close to USD 11 billion worldwide. The company also has operations in Peru,
Colombia, Argentina, and Brazil.
This company is strong in the corporate-industrial cafeteria sector and in the mining industry, with a 65% share of the
catering/casino services. Sodexho and Compass (the latter company’s revenues in Chile reached USD 60 million in 2009)
are the main competitors and they are strong in the institutional (education, health, etc.) sector. Sodexho is also strong in
food services in the prison system.
Aramark, as well as Compass, Sodexho and the smaller Express Group are dedicated to a range of oursourced services,
including not only catering, but also cleaning and security.
The expected growth rate for the leading companies is on average 15 percent per year.
Institutional Food Service Firms:
Estimated Market Share 2009
Selected Institutional Food Service Firms
Company Name 2009 Sales
(USD) Clients Location
Purchasing
Agents
Central de
Restaurantes
Aramark
11.0 billion
(worldwide)
Schools, universities, health
institutions, mining companies,
industries
Over 20 countries
Worldwide
Direct Import
Sodexho Chile 19.8 billion
(worldwide) Schools, health institutions,
mining companies, industries
Worldwide
Compass Catering
(Eurest) 60 million
(Chile) Over 70 countries
Worldwide
Casino Express 20 million Schools, health institutions,
industries, agriculture
Santiago
Metropolitan
Region
Source: Company interviews
4. Airlines & Cruise Ships
Chile will continue to focus on attracting long-haul tourists, and this effort will receive more resources as the government
seeks to honor its pledge to increase tourism's share of GDP to 10 percent by the end of 2010.
National Flights During 2009 there were 5,058,106 passengers flying commercial flights within the country, representing a 6.0 percent
increase over the previous year.
Nearly 87.7 percent of the flights are to or from the capital city of Santiago. The highest frequency national flights in order
of importance are:
Santiago - Antofagasta Santiago - Concepción Santiago - Iquique

Santiago - Puerto Montt Santiago - Calama
Source: Sernatur (Tourism National Service)
Lan Express, Lan Chile and Sky Service have flights all along the country, while Aerovías DAP is the only airline that
concentrates its flights in the extreme south of Chile: Punta Arenas with Puerto Natales; Porvenir; Puerto Williams and
Antártica.
International Flights During 2009, international flights registered 4,653,776 passengers, 5.8 percent lower than the previous year, which shows the
effects of the global financial crisis.
Of all the air traffic, 70.7 percent of flights are with Latin-American cities and Chile; 14.4 percent with U.S. and Canadian
cities; 10.9 percent with European cities; and 3.6 percent with the South Pacific, such as Sidney, Auckland y Papeete.
The flights with most arrivals and departures are Santiago - Buenos Aires (903,173 passengers) and Santiago - Sao Paulo
(532,481).
Source: Sernatur (Tourism National Service) -- 2009

Source: Sernatur (Tourism National Service) – 2009
Chilean Airlines with International Flights Lan Chile (2,326,445) Lan Express (133,977) And also Aerolínea Principal, Aerovias DAP, Sky Service and Pluna
Latin American Airlines operating in Chile TAM Líneas Aéreas (235,126) Lan Perú (177,506) Lan Ecuador (172,507) COPA (143,766)
North American Airlines operating in Chile: American Airlines Delta Airlines Air Canada
European Airlines operating in Chile: Iberia Air France Swiss
In August, 2010, LAN Airlines and TAM Airlines announced plans to merge, creating a new holding company called Latam
Airlines Group. The brands will be operated separately. If the deal is finalized, the new entity will control over 17% of
passenger revenues in Latin America, creating the largest airline in Latin America with revenues of USD 9 billion.
Cruise Ships
Foreign Tourist Entry to Chile through Ports (2009)
Year 2009
TARAPACA 2,673
ANTOFAGASTA 1,282

ATACAMA 156
COQUIMBO 3,719
VALPARAISO 7,146
BIOBIO 33
LOS LAGOS 182
MAGALLANES Y ANTARTICA CHILENA 96,510
Total 111,701
Source: Sernatur
Chilean tourist attractions such as the Antarctica have become a favorite destination of international cruise lines.
Iquique, Arica, Antofagasta, Coquimbo, Valparaiso and Puerto Montt are the Chilean ports that receive cruise ships.
Approximately 85 percent of these visitors are from the U.S. and the U.K. and they spend approximately USD 180 daily on
transportation, food, and entertainment.
In Chile, the most preferred destinations are Patagonia, the Lake Region in the south, the Atacama Desert in the north,
Valparaiso, Easter Island and Santiago.
Much of the food on cruise ships is prepared on-board, so the majority of their food purchases are fresh ingredients. Foreign
products can be found in the companies’ liquor collections, as Scottish whisky on ice from the glaciers is a popular drink.
Exact sales figures for this market are very difficult to estimate, but they typically purchase food through the same
distributors as hotels and restaurants and from their main headquarters.
International Cruise Ships operating in Chile: -CARNIVAL CRUISES LINES -CELEBRITY CRUISES / INFINITY -COSTA CRUCEROS -C & O Tours -CRYSTAL CRUISES -LE DIAMANT (Compagnie des Isles Du Ponant) -CUNARD LINE -HOLLAND AMERICA LINE / PRINSENDAM / ROTTERDAM -ISLAND CRUISES -LOUIS CRUISES LINES -NORWEGIAN DREAM CRUISE LINE / NCL CHILE -MSC CRUCEROS -ORIENT LINES / STAR CRUISES -PERTER DEILMANN -PULLMANTUR CRUISES -PRINCESS CRUISES -RADISSON SEVEN SEAS -ROYAL CARIBBEAN INTERNATIONAL -SEA CLOUD CRUISES -SEABOURNE -SILVERSEA -TRAVEL CRUISES – CENTRAL DE CRUCEROS -WINDSTAR CRUISES
Chilean Cruise lines operating in Chile: -CRUCEROS NACIONALES -CATAMARANES DEL SUR -CRUCEROS AUSTRALIS -NAVIERA MAGALLANES (NAVIMAG) -NAVIERA MAGALLANES (NAVIMAG) -PATAGONIA CONNECTION

-SKORPIOS
Main Airline and Cruise Ship catering companies:
LSG Sky Chefs Chile S.A.: - Air Canada
- Air France
- American Airlines
- Cargolux Airlines International
- Delta Air Lines
- GOL Transportes Aeros
- LAN Airlines
- Pluna
- Polar Air Cargo
- Sky Airlines
- TACA International Airlines
- TAM Mercosur
Gate Gourmet and LAN Airlines re-signed a four-year contract in 2009 covering the following airports: Santiago, Lima,
Guayaquil, Quito, Río de Janeiro, Sao Paulo, Ezeiza, Jorge Newberry, Madrid, Los Ángeles, Miami and New York-JFK.
The contract is valued at approximately USD 200 million. "LAN" makes reference to the consolidated entity that includes
LAN Airlines, LAN Express, LAN Peru, LAN Ecuador, and LAN Argentina, as well as LAN Cargo and its affiliates. Gate
Gourmet is the world's largest independent airline catering, hospitality and logistics company with dual headquarters in
Zurich, Switzerland, and Reston, VA, USA.
Casino Express: Aerolíneas Argentinas, Aerolíneas del Sur and Air Comet, and Cruceros Skorpio.
Section III. Competition
Most of the vegetables, fruit and processed foods, poultry, pork and seafood consumed by the HRI sector are of
local origin.
The agreement that allowed Chilean poultry to enter the U.S. market (signed on December 3
rd, 2007) and U.S.
poultry to Chile (signed on January 31st,
2008) increased exports considerably for both countries.
Imported products are mainly beef and meat from Argentina, Brazil and Uruguay, legumes and cereals such as corn
and wheat from Argentina and Canada.
Chileans still value freshness as much as possible, but do consume considerable amounts of frozen food because of
storage convenience and year-round availability. However, most of the frozen foods are produced domestically.
Other typical imported products are baked goods, bakery and confectionery ingredients, some fruits and fruit juices,
and edible oils.
Top level hotels consume up to 20-30 percent of their food budget on imported foods, and most spirits are also
imported.
Some chain hotels must also follow corporate instruction on certain foods and amenities, which must be imported.
Institutional food services buy imported foods such as beef, pork, poultry and dried legumes (peas, etc.), but very
few processed foods such as sauces or seasonings. The great majority of their purchases are local products.
A. Free Trade Agreement & Free Trade Zones

Chile ratified a Free Trade Agreement (FTA) with the U.S., which came into effect on January 1
st, 2004:
The FTA immediately eliminated tariffs on almost 90 percent of U.S. products imported into Chile and more than
95 percent of Chilean exports to the U.S. Tariffs on all products will be eliminated within 12 years.
Elimination of Chile’s six percent general tariff has made U.S. products significantly more competitive, as they had
been losing ground to other countries with which Chile already had preferential trade agreements (mainly
Argentina, Brazil, Canada, and Mexico).
Benefits of the FTA for the agricultural sector:
Since 2009, approximately 75 percent of both U.S. and Chilean farm goods are tariff-free, with all tariffs and quotas
phased out within 12 years.
U.S. access to this market is competitive with Canada and the European Union, both of which already had FTAs
with Chile.
Although the FTA allows immediate duty-free entry into Chile for the majority of U.S. goods, Chile’s two free trade zones
still offer some advantages: (Region I) Free Trade Zone of Iquique in the north and (Region XII) Free Trade Zone of Punta
Arenas in the extreme south. Modern facilities for packaging, manufacturing, and exporting exist in each zone, and the latter
has a free port. Imports entering and remaining in the Free Trade Zones pay no value-added tax (VAT).
Product Category
Import Supply
Sources Strengths of Key Supply
Countries Advantages & Disadvantages
of Local Suppliers
Beverages & Spirits
ARGENTINA
17.47% UNITED
KINGDOM
13.63% MEXICO 10.79% VENEZUELA
8.51% DOMINICAN
REPUBLIC
8.34% USA 6.76% AUSTRIA 5.94% NICARAGUA
4.61%
Rum (USD 37 million) beer
(USD 21 million) and whiskey
(USD 19 million) are the most
imported beverages
Chilean wine competes on the
world market with a good
price/quality ratio; major
international beverages have
established bottling facilities in
Chile
Confectionery
ARGENTINA
38.63% GUATEMALA
30.52% COLOMBIA
23.17% EL SALVADOR
1.44% USA 1.33% BRAZIL 1.24% CHINA 1.22% BOLIVIA 0.4%
Nestlé’s presence is so strong it
is almost viewed as a Chilean
product; neighboring supply
countries share Chile’s sweet
tooth (generally sweeter than in
the U.S.)
Many Chileans value fresh
ingredients and artisanal
products baked locally

Dairy
ARGENTINA
54.02% URUGUAY
16.83% USA 9.81% BRAZIL 6.46% PERU 2.91% CANADA 2.77% NEW
ZELAND2.64% FRANCE1.43%
Argentina is very price-
competitive with its weak
currency and geographical
proximity; opportunities for
licensing agreements (e.g.,
Yoplait with local producer,
Quillayes)
The local industry is dominant
and strong
Fish & Seafood
ECUADOR
45.27% ARGENTINA
9.45% NORUEGA
7.54% SPAIN 5.37% CHINA 4.98% PERU 4.26% VIETNAM
4.25% URUGUAY
3.37%
Ecuador is recognized as a
premium supplier of shrimp and
sea food.
Chile is one of the largest fish
exporters in the world (1st for
trout, 2nd for salmon);
nevertheless its local supply is
not as abundant, and very
expensive.
Fruits & Nuts
ECUADOR
65.88% USA 15.14% PERU 4.24% ARGENTINA
2.74% BRAZIL 2.06% BOLIVIA 1.72% PHILIPINAS
1.29% CHINA 1.03%
USA’s participation has been
growing in recent years taking
advantage of the opposite
seasons with Chile, and taking
market share away from
Ecuador.
Local fruit and nut production
is strong, but since the growing
regions of the country
experience all four seasons
there is insufficient supply in
the winter months
Grain Mill Products & Dry Goods
(including cereals) (HTS CODE 11: milling products;
malt; starch; inulin; wheat gluten HTS CODE 10: cereals; HTS CODE 12: oil seeds and
oleaginous fruits; miscellaneous
grains, seeds and fruits; industrial or medicinal
plants; straw and fodder
ARGENTINA
53.81% CANADA
13.92% USA 13.83% PARAGUAY
5.32% BRAZIL 3.94% URUGUAY
0.86% FRANCE 0.8% INDONESIA
0.79%
Argentina has an established
production base and is very
competitive in terms of
proximity and price.
Nevertheless U.S. breakfast
cereals are the most popular in
the local market.
Low local production; imports
are necessary to meet demand

Pet Food
ARGENTINA
74.74% BRAZIL 6.94% USA 3.6% GERMANY
3.49% FRANCE 2.78% SWISS 1.82% HOLLAND 1.8% SPAIN 1.22%
Argentina is competitive with
high product quality and
packaging
Demand in niche markets like
super premium brands and
special diet supplements is not
currently satisfied
Prepared Foods (HTS CODE 19: prepared cereals,
flour, starch or milk; bakers
wares; HTS CODE 20: prepared
vegetables, fruit and nuts or other
plant parts; HTS CODE 21:
miscellaneous edible preparations)
ARGENTINA
26.14% USA 16.27% BRAZIL 10.11% MEXICO 5.4% CHINA 4.83% PERU 4.55% HOLLAND 4.4% BELGIUM 4.25%
Opportunities to introduce new
innovations in this category.
Prepared gourmet food and
ready-to-eat food increasing in
popularity.
Local suppliers reacting well to
increased demand in frozen and
other prepared food categories
Red Meat & Poultry
PARAGUAY
48.12% ARGENTINA
38.55% BRAZIL 5.02% URUGUAY
3.46% AUSTRALIA
1.91% CANADA 1.51% USA 1.01% SPAIN 0.2%
The weaker dollar and the
recently enacted poultry trade
agreement represent important
opportunities for US meat and
poultry suppliers.
Challenging for US grain-fed
beef to compete against local
and neighboring grass fed beef,
which is completely priced
Sauces & Condiments (including
coffee & tea)
Sauces &
Condiments USA 43.18% ARGENTINA
33.58% BRAZIL 6.23% GERMANY 3.4% Coffee & Tea BRAZIL 26.16% SRI LANKA
24.01% ARGENTINA
17.52% PERU 7.58%
USA sauces and condiments are
well positioned in the Chilean
market. Tea and exotic products are
becoming more popular in the
local market. FTA with Asian
countries introducing new
products in Chile.
Chilean tastes are diversifying
slowly as they become familiar
with new products.

Vegetables
CANADA
32.97% CHINA 17.72% USA12.02% ARGENTINA
10.58% PERU 10.31% HUNGRY 3.82% HOLLAND
2.63% NEW ZELAND
2.34%
Opportunities for foreign
suppliers in Chile’s off-season.
USA participation has been
growing in the past years.
Local supply is strong, with
significant distribution through
informal channels (street
markets, etc.)
Alcoholic Beverages
Although the FTA has eliminated the majority of tariffs on U.S. exports into Chile, certain luxury goods incur additional
taxes:
Beer, cider, wine, champagne: 15%
Grape pisco, whisky, aguardiente, liquorice wines: 27%
B. Labeling and Marking Requirements
All processed food must be tested and found in compliance with government health regulations, and the Chilean Health
Services officer at the port of entry approves the import of processed food products on a case-by-case basis. There is no
blanket approval process for permitting identical products into the country. Meeting the labeling and fortification standards
can be cumbersome, which raises the overhead cost of introducing new products into the Chilean market.
Imported products intended for public consumption must specify the country of origin and be labeled in Spanish. All canned
or packaged food products must display the quality, purity, ingredients or mixtures (including additives), net weight in the
metric system, manufacturing and expiration dates, nutritional facts (since 2006)and the name of the producer or importer.
Labeling and fortification standards often differ from those in the U.S. and some U.S. processed foods must be labeled and/or
formulated especially for Chile. Goods not complying with the requirements may be imported but not sold until the
conversion is made.
For more information about general labeling provisions, please visit the following websites:
Chilean Ministry of Health
http://www.redsalud.gov.cl/portal/url/page/minsalcl/g_proteccion/g_alimentos/reglamento_sanitario_alimentos.html
Office of Agricultural Affairs (U.S. Embassy, Santiago)
www.usdachile.cl
Section IV. Best Product Prospects
Chilean consumers are more demanding of new flavors and textures. The gourmet food market is growing at a fast
rate spurred by an increasing interest in foreign foods.
Organic and natural food are also growing in demand in Chile.
Societal changes in Chile are fueling changes in the food service industry. More Chileans are eating outside of the
home, with many women in the workforce and employees working longer hours.
Although products from the U.S. do not presently command recognition in the HRI market, the FTA, evolving local

tastes, and a weak U.S. dollar should create an attractive environment for U.S. companies wishing to export.
One interesting trend in the HRI sector comes from casinos, hotels and restaurants, which are demanding -in their
annual contracts- from institutional food services, vegetables ready to serve, already chopped and cleaned.
A. Products present in the market with good sales potential
Products Present in the Market
Product
Category
Imports
2009
(USD)
Estimated
Import
Growth for
2010
Import Tariff
Rate Key Constraints Over
Market Development Market Attractiveness for
U.S.
Grain Mill
Products & Dry
Goods
615
million 10%
0% after full
implementation of
FTA*
Strong competition from
Argentina
Very low local production;
the U.S. is an established
supplier

Red Meat &
Poultry 509
million 15%
Brazil and Argentina
grass-fed beef dominates
the market, while the
U.S. exports mainly
grain-fed beef
The agreement signed to
allow U.S. poultry entrance
to Chile increased U.S.
presence in the market.
Chile imports 30% of its
meat
Beverages &
Spirits 127
million 3%
Require strong national
distribution, which
restricts U.S. companies
to working with a small
number of partners
Chilean companies with
national distribution have an
established track record for
adhering to licensing
agreements, etc.
Sauces &
Condiments
(including
coffee & tea)
90
million 8%
Asian products are
penetrating the market.
US sauces and condiments
have good opportunities in
the national market. Opportunities for offering a
complete line exist in
association with specific
retailers
Dairy 61
million 5%
Strong presence of local
and Argentinean
suppliers
Opportunities for
introducing innovative
products via licensing
agreements
Fruits & Nuts 72
million 8% Strong local production
Demand for imports rises in
Chile’s off-season, which is
opposite to that of the U.S. *The 2004 FTA states that the majority of products have no tariffs now, while the rest will be fully phased out within 12 years.
B. Products not present in significant quantities but which have good sales potential.
Products Not Present in Significant Quantities
Product
Category
Imports
2009
(USD)
Estimated
Import
Growth for
2010
Import Tariff
Rate Key Constraints Over
Market Development Market Attractiveness for
U.S.
*Health
Food
Products N/A 30%
0% after full
implementation
of FTA*
Local production growing for
exporting.
Significant investment in
marketing/promotion
compared to size of market
Good opportunities in
growing health food
segment; Chilean consumers
more demanding and aware
of nutritional and healthy
food ingredients.
**Prepared
Foods 295
million 40%
Opportunities to introduce
new innovations in this
category
Cereal 480
million 25%
USA is the 3rd most
important Chilean supplier of
cereal. Organic
Food N/A 50%
Good opportunities for
market entry. Gourmet
ready-to-
serve N/A N/A
It is a new and growing
market in Chile.
Ethnic
Foods N/A N/A
Small market size. Also
significant investment in
marketing/promotion
compared to size of market
Growing interest in
alternative foods especially
after FTA signed with
different countries.

*: The “Wellness” trend is more and more popular in Chile: Consumers are trying to achieve a “healthy” lifestyle combining
a measured diet with more physical activity.
** Domestic consumption of processed foods is on the rise, and the ever-increasing presence of women in the work force
calls for production of new packaged-food products to replace home-cooked meals.
C. Products Not Present Because They Face Significant Barriers
Although Chile has a general policy of free-market prices, there are some exceptions. Major agricultural products
such as wheat, sugar, and sugar-containing products fall under a price-band system which encourages local
production.
These price bands change with fluctuations in international market prices and are typically announced mid-year to
help the local agricultural industry determine what to sow.
Section V. Post Contact and Further Information
Mailing Address: Office of Agricultural Affairs FAS/USDA
3460 Santiago Pl. Washington, D.C. 20521 / 3460
Street Address: Office of Agricultural Affairs U.S. Embassy, Santiago Av. Andres Bello 2800 – Las Condes Santiago, Chile
Tel.: (56 2) 330-3704 Fax: (56 2) 330-3203 E-mail: [email protected] Websites: http://www.usdachile.cl; Agricultural Attaché’s Office in the U.S. Embassy Santiago homepage. http://www.fas.usda.gov; Foreign Agricultural Service homepage.