Embed Size (px)
Citation preview

Master of Nutrition and Dietetics, University of Sydney
Research Project 2005
Children's Health,
Dietary Preferences, Snack Food
Intake,
Salt Intake and Obesity
Supervisors:
Dr Anne Swain
Dr Velencia Soutter
Dr Rob Loblay
At
Royal Prince Alfred Hospital Allergy Unit
Name: Ada Lei Im Chok
Student Number: 0405778
Children’s Health, Dietary Preference, Snack Food intake, Salt intake & Obesity
1
TABLE OF CONTENTS
ACKNOWLEDGMENTS ................................................................................................ 3
ABSTRACT ....................................................................................................................... 4
INTRODUCTION ............................................................................................................ 5
OBJECTIVES ................................................................................................................... 8
MATERIALS AND METHODS ..................................................................................... 9
STUDY PARTICIPANTS ...................................................................................................... 9
METHOD ........................................................................................................................ 10
Children’s Eating Behaviour & Appetitie Scale ....................................................... 10
Parent’s Depression Anxiety & Stress Scale ............................................................ 11
Food Frequency Questionnaire ................................................................................ 11
Four-day food record ................................................................................................ 11
DATA ANALYSIS ............................................................................................................ 12
Children’s Eating Behaviour & Appetitie Scale ....................................................... 12
Parent’s Depression Anxiety & Stress Scale ............................................................ 12
Food Frequency Questionnaire ................................................................................ 13
Four-day food record ................................................................................................ 13
RESULTS ........................................................................................................................ 15
1. EATING BEHAVIOUR & NUTRITIONAL INTAKE ........................................................... 15
1.1 Eating behaviour in general ............................................................................... 15
1.2 Fussy eating and nutritional intake .................................................................... 15
1.3 Fussy eating and parents’ depression, anxiety and stress level ......................... 16
2. DIETARY PREFERENCES ............................................................................................. 17
3. NUTRITIONAL ADEQUACY.......................................................................................... 18
3.1 Comparison of food group intake with Dietary Guidelines ................................ 18
3.2 Comparison of nutrient intake with Recommended Dietary Intakes .................. 21
3.4 Contribution of sodium in diet ............................................................................ 22
4. NONCORE FOOD GROUP INTAKE ................................................................................ 23
4.1 Noncore food group consumption of participants .............................................. 23
4.2 Noncore food group intake by weight status....................................................... 24
DISCUSSION: ................................................................................................................. 25
FUSSY EATING & NUTRITIONAL INTAKE ......................................................................... 25
PARENTS CONCERNED ABOUT FUSSY EATING OF CHILDREN ........................................... 26
FOOD PREFERENCES DETERMINE FOOD CONSUMPTION ................................................... 26
IMBALANCED DIET ......................................................................................................... 27
IMBALANCED TYPE OF FAT IN DIET ................................................................................. 28
REASONS FOR EXCESSIVE INTAKE OF CERTAIN NUTRIENTS ............................................ 29
OVERCONSUMPTION OF NONCORE FOODS ...................................................................... 30
NONCORE FOOD CONSUMPTION INCONSISTENT WITH BODY WEIGHT .............................. 31
LIMITATIONS AND FURTHER RESEARCH ......................................................................... 32
IMPLICATIONS OF FINDINGS ........................................................................................... 33
CONCLUSION ............................................................................................................... 34
Children’s Health, Dietary Preference, Snack Food intake, Salt intake & Obesity
2
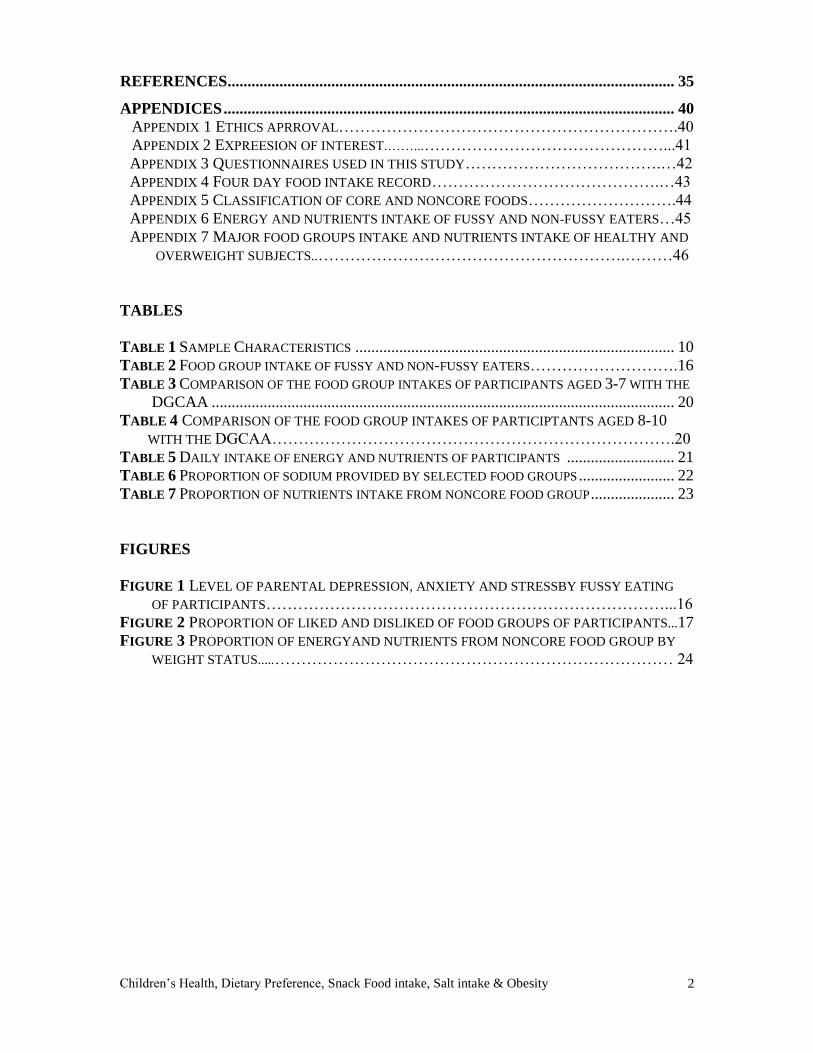
REFERENCES ................................................................................................................ 35
APPENDICES ................................................................................................................. 40
APPENDIX 1 ETHICS APRROVAL……………………………………………………….40
APPENDIX 2 EXPREESION OF INTEREST.……...………………………………………...41
APPENDIX 3 QUESTIONNAIRES USED IN THIS STUDY……………………………….…42
APPENDIX 4 FOUR DAY FOOD INTAKE RECORD…………………………………….…43
APPENDIX 5 CLASSIFICATION OF CORE AND NONCORE FOODS……………………….44
APPENDIX 6 ENERGY AND NUTRIENTS INTAKE OF FUSSY AND NON-FUSSY EATERS…45
APPENDIX 7 MAJOR FOOD GROUPS INTAKE AND NUTRIENTS INTAKE OF HEALTHY AND
OVERWEIGHT SUBJECTS..………………………………………………….………46
TABLES
TABLE 1 SAMPLE CHARACTERISTICS ................................................................................ 10
TABLE 2 FOOD GROUP INTAKE OF FUSSY AND NON-FUSSY EATERS……………………….16
TABLE 3 COMPARISON OF THE FOOD GROUP INTAKES OF PARTICIPANTS AGED 3-7 WITH THE
DGCAA .................................................................................................................... 20
TABLE 4 COMPARISON OF THE FOOD GROUP INTAKES OF PARTICIPTANTS AGED 8-10
WITH THE DGCAA………………………………………………………………….20
TABLE 5 DAILY INTAKE OF ENERGY AND NUTRIENTS OF PARTICIPANTS ........................... 21
TABLE 6 PROPORTION OF SODIUM PROVIDED BY SELECTED FOOD GROUPS ........................ 22
TABLE 7 PROPORTION OF NUTRIENTS INTAKE FROM NONCORE FOOD GROUP ..................... 23
FIGURES
FIGURE 1 LEVEL OF PARENTAL DEPRESSION, ANXIETY AND STRESSBY FUSSY EATING
OF PARTICIPANTS…………………………………………………………………...16
FIGURE 2 PROPORTION OF LIKED AND DISLIKED OF FOOD GROUPS OF PARTICIPANTS...17
FIGURE 3 PROPORTION OF ENERGYAND NUTRIENTS FROM NONCORE FOOD GROUP BY
WEIGHT STATUS.....………………………………………………………………… 24

Children’s Health, Dietary Preference, Snack Food intake, Salt intake & Obesity
3
Acknowledgments
I would like to thank my supervisors, Anne Swain (Dietitian), Velencia Soutter
(Paediatrician) and Rob Loblay (Director, Allergy Unit) for their valuable time to guide
and support me throughout the project. Also thanks for providing invaluable feedback
and suggestions on how to improve the paper.
I would also like to express my thanks to Katherine Rubelj (Research Dietitian), for her
invaluable advice, time and support on using Serve and SPSS.
My gratitude is also extended to Dorothy Callender (Dietitian), Tim Watkins
(Information Technician) and all other staff in the Allergy Unit for their friendly attitude.
Very special thanks to my co-researchers Angie Low, Elizabeth Parker, Katinka
Vanderlely and Tomoko Yokoyama for their friendship, encouragement and sharing of
skills and ideas for the past few months.
I would like to thank all the people that kindly volunteered their time to participate in the
study.
Finally, thanks to my family and all my friends who had supported me, gave me valuable
suggestions on how to improve the project and encouraged me during my stressful time.

Children’s Health, Dietary Preference, Snack Food intake, Salt intake & Obesity
4
Abstract
Children’s Health, Dietary Preference, Snack Food intake, Salt intake and Obesity
Im Chok Lei1, Anne Swain
2, Velencia Soutter
2, Rob Loblay
2
1 Human Nutrition Unit, University of Sydney, New South Wales 2008 Australia
2 Allergy Unit, Royal Prince Alfred Hospital, New South Wales 2050 Australia
Background
Children’s food preferences determine their dietary intake and their eating behaviours
established during childhood track into adulthood. Therefore, it is important to monitor
their dietary patterns in order to explore and prevent the onset of adult health problems.
Objectives
To examine children’s food preferences, eating behaviours and dietary intakes, and to
investigate their noncore food intakes and its impact on body weight.
Design, methods and subjects
Sixty-three children aged 3-10 years participated in this study. Carers of the children
completed questionnaires concerning the children’s eating behaviour and dietary intake
by Food Frequency Questionnaire and 4-day food records. Data were analyzed by SPSS
to calculate descriptive statistics. Independent T-test was used for testing differences
between means, and a significance level of P<0.05 was adopted.
Results
Twelve participants (21%) were classified as fussy eaters. No significant difference in
dietary intake between fussy and non-fussy eaters was found. The most liked and disliked
food groups were noncore foods and vegetables respectively. Participant’s average intake
of all food groups and nutrients exceeded the recommended levels except the cereals
intake (in Recommendation Example A) and vegetables intake (in Recommendation
Example B) of the 3-7 year-old group. Noncore foods contributed an average of 37% of
total energy intake, and no significant difference between healthy and overweight
participants was found.
Conclusions
Food preferences and fussy eating existed among the children. They were nutritionally
adequate with excessive consumption of noncore foods. Education for parents on
children’s food preference development and balanced diet is required.
Children’s Health, Dietary Preference, Snack Food intake, Salt intake & Obesity
5
Introduction
It is important to monitor children’s food consumption patterns in order to explore and
prevent the onset of adult health problems (1-3), since eating behaviors established during
childhood track into adulthood (4). Research has shown that children’s food preferences
predict dietary intake pattern (5-9). The development of food preferences is a result of the
interaction between genetic predisposition and different aspects of the eating environment
(10). Children are born to prefer foods that are sweet (11) and salty (12) and to reject
those that are sour and bitter (13). They also have neophobic reaction to new foods and
the ability to learn food preferences based on associations with the contexts and
consequences of eating various foods. Parents play an important role in children’s eating
environment and hence their food preferences, these include eating behaviours, attitudes,
and child-feeding practices (14). It is normal that children have their own food
preferences, however, if they develop fussy eating behaviours, their dietary intake would
be affected. Research (15-17) has found that fussy eaters had less dietary variety and
diversity than non-fussy eaters. Parents identify fussy eating behaviour as problematic
because fussy eaters may eat too little, and it can be difficult to persuade them to eat a
healthy diet (18). Children and parents have many areas of interactions and the influence
between them is bi-directional(19). A lot of research has studied how parents affect
children’s eating behaviours (19-21), but not much has been done on the relationship
between children’s eating behaviour and parents’ emotional status. A study (16) has
shown that parents of fussy eaters are more struggle in the families and more concession
around food and eating than parents of non-fussy eaters.
Children’s Health, Dietary Preference, Snack Food intake, Salt intake & Obesity
6
Much less research has been conducted on Australian children’s food preference and
eating patterns. The only detailed report on dietary intake of children was provided from
the National Nutrition Survey (NNS), 1995 (22), it indicated the dietary intake of
children did not follow the recommended guidelines. The cereals intake of 4-7-year-old
girls and 8-11-year-old boys were not enough. The children ate a considerable amount of
high-energy dense cereal-based products as biscuits, cakes, pastries, etc, rather than the
recommended breads, breakfast cereals, pasta, fruit, grain-based nutritious snacks and
rice. Fruit consumption decreased with age and half of the children did not eat fruit on the
day before the interview. Both vegetable and dairy products consumption were less than
the minimum quantity recommended.
The snacks intake of Australian children is relatively high. According to research group
MINTEL, Australians are the fourth largest consumers of snack foods (23). The NNS,
1995 indicated that over a third of 8-11-year-old children ate snack foods (potato crisps,
corn chips, etc), half ate confectionery and over a third drank soft drinks, flavoured
mineral waters or electrolyte drinks on the day before the interview (22). Previous
research (24) which examined noncore food intake of children showed that more than
40% of their energy intake was from noncore foods. A New South Wales study indicated
that, of the 90% of children who had a snack at recess, 39% had chips(25). In addition, of
the top five food types contributing to energy intake from food eaten by Australian
children at school, only bread could be considered a core food (26). The others were fast
food, fruit/cordial drinks, fat spreads and sweet biscuits and crackers. A study conducted
in 2004 (27) on dietary issues in Austistic Spectrum Disorders (ASD) showed that both
the ASD and Control group consumed in excess of the daily recommended level for all
food group except Cereals. It also revealed that children from both groups were
Children’s Health, Dietary Preference, Snack Food intake, Salt intake & Obesity
7
consuming over four snack foods per day and had a salt intake markedly higher than
recommended in the current Australian Dietary Guidelines.
Sodium intake is often related to blood pressure (28). Blood pressure tracks from
childhood into adulthood (29) and early diet with high sodium intake may have long term
effects on hypertension(30). The growing number of overweight children and the
epidemic of childhood obesity is a major public health concern. There is evidence that the
prevalence of overweight and obesity in Australian children is increasing. In 1995, 19%-
23% of Australian children aged 2-18 years were overweight or obese, a prevalence more
than doubled when compared to 1985 prevalence rates (31). One of the reasons for the
increase in the prevalence of childhood obesity is unhealthy eating patterns (32).
Increased snack consumption in children is often linked to the cause of obesity, however,
the relationship between snack food consumption and body weight remains controversial.
In a cross-sectional study of 1562 children in the Bogalusa Heart study found that
consumption of sweetened beverages; sweets and total consumption of low-quality foods
were positively associated with overweight status. Total amount of food consumed,
specifically from snacks, was positively associated with overweight status (33). In
contrast, Phillips et al(34) observed no association between snacks intake and either body
mass index (BMI) or percent body fat among 196 non-obese premenarcheal girls who
were followed annually over a 10-year period. Moreover, a previous Australian research
(24) showed that noncore food intake was inconsistent with body weight status, although
very young obese children obtained significantly more energy from noncore beverages
than children in a healthy weight range. Further study is required to investigate the effect
of snack intake and body weight status in children.
Children’s Health, Dietary Preference, Snack Food intake, Salt intake & Obesity
8
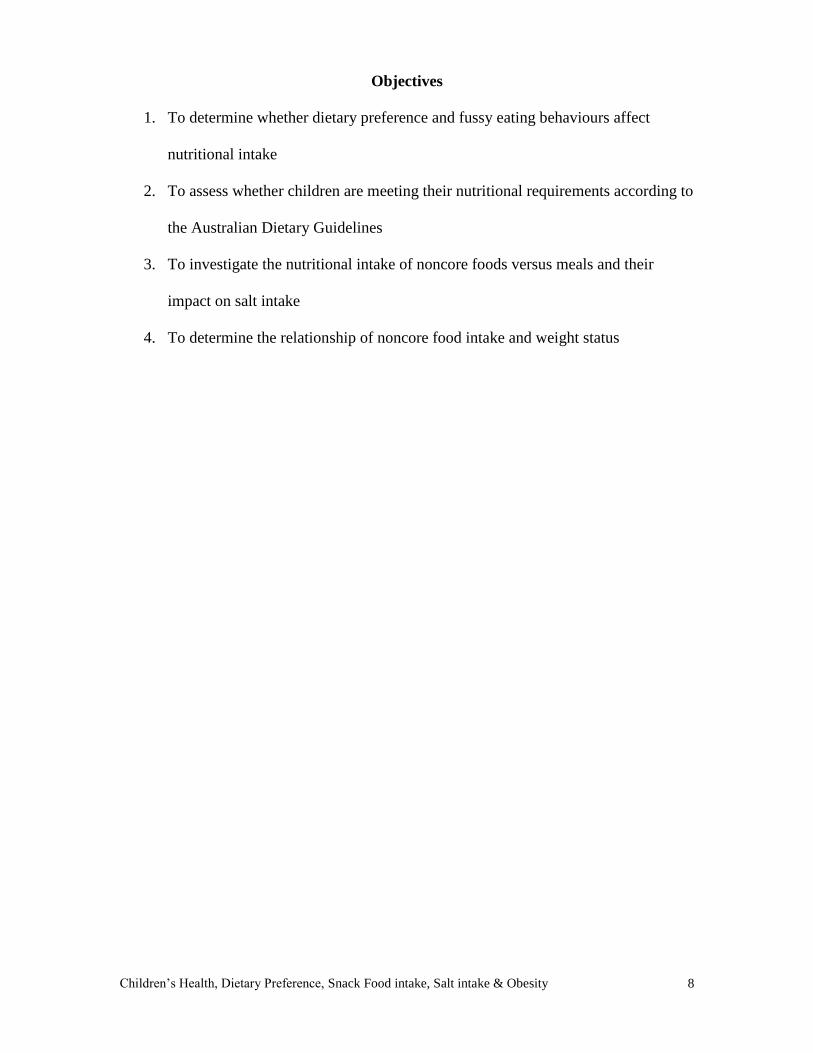
Objectives
1. To determine whether dietary preference and fussy eating behaviours affect
nutritional intake
2. To assess whether children are meeting their nutritional requirements according to
the Australian Dietary Guidelines
3. To investigate the nutritional intake of noncore foods versus meals and their
impact on salt intake
4. To determine the relationship of noncore food intake and weight status

Children’s Health, Dietary Preference, Snack Food intake, Salt intake & Obesity
9
Materials and methods
Study participants
The Dietary issues in children with and without Austic Spectrum Disorder (ASD) study
was initiated in 2003 to compare the eating behavior and nutritional status of children
with and without ASD. The original study design and data collection were described in
detail in a previous report (27). Children aged 3-10 attending the Allergy Clinic,
Childcare Centres, kindergartens in the Central Sydney Area Health Service region or
siblings of subjects were randomly recruited. This study included subjects entering the
study from 2003 to September 2005. To date, 207 completed questionnaire booklets and
food records were sent back to the Allergy Unit. Of these participants, children with ASD
(n=63) and any food intolerance (n=64) or allergy (n=14) were excluded, since they may
have restricted dietary intake. Written informed consent was given to the parents or carers
of the children for the participation in the study. Ethics approval for the study was
granted by the CSAHS Ethics Review Committee of the Central Sydney Area Health
Service. (see Appendix 1)
Of the 66 subjects that met the inclusion criteria, those whose food group intake appeared
implausible (>6 SDs from the mean for each food group; n=3) were excluded. Data
provided by participants (n=21) with missing height and weight measurements were used
for analysis of nutritional intake and eating behaviour (i.e. objective 1, 2 and 3).
Data by participants who provided height and weight (n=42) were also used to assess the
relationship of food intake and weight status. So the total number of analyses was 63.
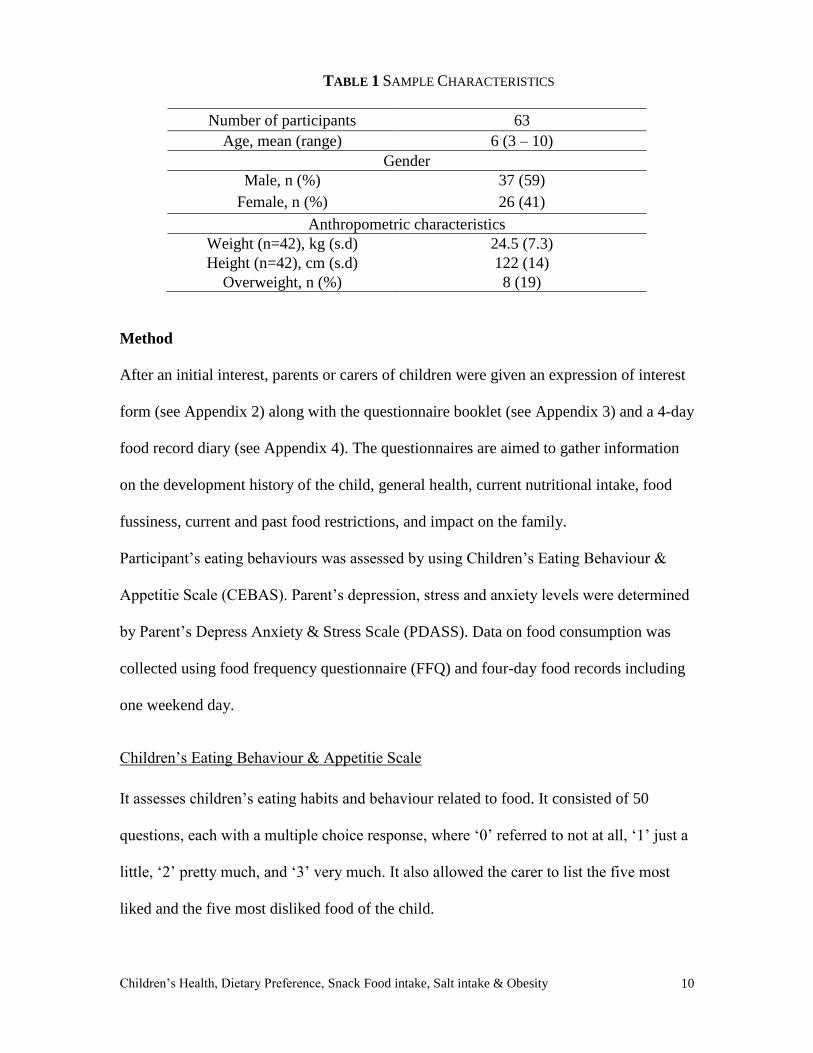
Table 1 shows the characteristics of the study sample.
Children’s Health, Dietary Preference, Snack Food intake, Salt intake & Obesity
10
TABLE 1 SAMPLE CHARACTERISTICS
Number of participants 63
Age, mean (range) 6 (3 – 10)
Gender
Male, n (%) 37 (59)
Female, n (%) 26 (41)
Anthropometric characteristics
Weight (n=42), kg (s.d) 24.5 (7.3)
Height (n=42), cm (s.d) 122 (14)
Overweight, n (%) 8 (19)
Method
After an initial interest, parents or carers of children were given an expression of interest
form (see Appendix 2) along with the questionnaire booklet (see Appendix 3) and a 4-day
food record diary (see Appendix 4). The questionnaires are aimed to gather information
on the development history of the child, general health, current nutritional intake, food
fussiness, current and past food restrictions, and impact on the family.
Participant’s eating behaviours was assessed by using Children’s Eating Behaviour &
Appetitie Scale (CEBAS). Parent’s depression, stress and anxiety levels were determined
by Parent’s Depress Anxiety & Stress Scale (PDASS). Data on food consumption was
collected using food frequency questionnaire (FFQ) and four-day food records including
one weekend day.
Children’s Eating Behaviour & Appetitie Scale
It assesses children’s eating habits and behaviour related to food. It consisted of 50
questions, each with a multiple choice response, where ‘0’ referred to not at all, ‘1’ just a
little, ‘2’ pretty much, and ‘3’ very much. It also allowed the carer to list the five most
liked and the five most disliked food of the child.
Children’s Health, Dietary Preference, Snack Food intake, Salt intake & Obesity
11
Parent’s Depression Anxiety & Stress Scale
It was used to obtain an indication of the level of stress parents experience in their daily
lifestyle. It consisted of 42 questions, each with a multiple choice response, where ‘0’
referred to not at all, ‘1’ just a little, ‘2’ pretty much, and ‘3’ very much.
Food Frequency Questionnaire (FFQ)
The FFQ, based on the CSIRO FFQ, was previously modified and used for this study.
When completing the FFQ, carers indicated how often, on average, their child had
consumed the amount of each food item in the past 3 months. The 6 response categories
available ranged from ‘Never Tried’, ‘Don’t Like’ or ‘Rarely’ to the frequency of
consuming the food item over either a month, week or day. FFQ was used in this study to
detect any differences in reported nutrient intake which may have been apparent between
the two dietary intake methodologies.
Four-day food record
The 4-day food diary is considered as a validated method of assessing children’s dietary
intake and dietary habits (35-37). It includes the dietary intake of the child over 4
consecutive days including one weekend day. The carers were given verbal and written
instructions on how to record food intake, brand names, recipes and cooking methods in
the food diary. A sample record was provided to the carers, and a contact telephone
number was provided if further assistance was required.

Children’s Health, Dietary Preference, Snack Food intake, Salt intake & Obesity
12
Data Analysis
Children’s Eating Behaviour & Appetitie Scale
Data was compiled into Microsoft Excess 2002 to assess the child’s eating behaviours.
Choices ‘Not at all’ and ‘Just a little’ were combined to one category (score:0), while
‘Pretty much’ and ‘Very much’ were combined to another category (score:1). The scores
are inversely related to the subject’s eating behaviour. Higher scores indicate poorer
eating behaviours. Question 5 was used to classify fussy and non-fussy eaters among the
participants. Nutritional status of fussy and non-fussy eaters was then compared to
determine whether fussy eating affect nutritional intake. Significant difference was
determined by t-test, using Statistical Package for the Social Sciences (SPSS, version 13)
with significant interval at p<0.05.
Food preference of the participants was determined by their 5 liked and 5 disliked foods
provided by the carer. The food items were classified into 5 major food groups based on
the Dietary Guidelines to Healthy Eating (AGHE) (38), namely cereals, vegetables, fruit,
dairy, meat and alternatives and extra foods.
Parent’s Depression Anxiety & Stress Scale
There are three scales to measure the negative emotional states of depression, anxiety and
stress of the parents. Each of the three scales contains 14 items. The results were used to
compare between parents of fussy and non-fussy eaters. Significant difference was
determined by t-test, using Statistical Package for the Social Sciences (SPSS, version 13)
with significant interval at p<0.05.
Children’s Health, Dietary Preference, Snack Food intake, Salt intake & Obesity
13
Food Frequency Questionnaire (FFQ)
Data from FFQ was entered and analyzed by Microsoft Excel Program 2002 and the
average serves per day intake for each food group was calculated, results were then
sorted into two age groups (3-7 and 8-10 years old) so that the results could be compared
to that of the Dietary Guidelines for Children and Adolescents in Australia
(DGCAA)(39). The minimum recommended daily intake was used to determine the
nutritional adequacy of the participants.
Four-day food record
Raw data from the food records was entered into a nutrient analysis program (M& H
Williams, Sydney, SERVE version 5.3 2003) based on Australian Composition of Foods
(National Food Authority, Canberra: Australia Government Publishing Service, 1992) to
derive nutrient data for all foods eaten in the four days.
The food items consumed were further separated into core and noncore categories. The
classification of food (see Appendix 5) (24) was based on the AGHE (38). Core foods
were defined as those included in the following five groups: (1) bread, cereals, rice, pasta
and noodles; (2) vegetables, legumes; (3) fruit; (4) dairy products and (5) meat and meat
alternatives. Water, coffee and tea were included as core beverages. All other foods and
beverages were classified as noncore. Further details have been previously reported (24).
The percentage of energy and other nutrients provided by the core and noncore foods and
beverages were compared.
Children’s Health, Dietary Preference, Snack Food intake, Salt intake & Obesity
14
Subjects’ weight and height were reported by the carers and were then classified as
healthy weight (includes underweight and healthy weight) and overweight (includes
overweight and obese in this study) using international standards (40). The intake of
noncore food group between healthy weight and overweight subjects was compared.

Children’s Health, Dietary Preference, Snack Food intake, Salt intake & Obesity
15
Results
1. Eating Behaviour & Nutritional Intake
1.1 Eating behaviour in general
The CEBAS contains description of 50 eating behaviours. The scores are inversely
related to the subject’s eating behaviour. Higher scores indicate poorer eating behaviours.
Fifty-three of the 62 participants scored less than 10 and only one participant scored
higher than 20. The common eating behaviours of the participants were as follows; 40%
‘ask for food between meals’ and ‘make repetitive food choice’, 30% ‘prefer bland
foods’, feel that there is a ‘lack of variety in food choices’ and are ‘afraid of trying new
foods’.
1.2 Fussy eating and nutritional intake
Based on parental report, 12 participants (21%) were classified as fussy eaters. There was
no overweight subject classified as fussy eater. The difference in major food group intake
between fussy and non-fussy eaters is shown in Table 2 where similar intake of most
food groups was apparent. They met or exceeded the minimum recommended intake for
all food groups, with a lower intake of vegetables in fussy eaters. The comparison of
nutrient intake between fussy and non-fussy eater is presented in Appendix 6. Fussy
eaters had a lower intake of all nutrients except riboflavin and calcium. The intake of
vitamin C was especially lower in fussy eaters. Based on the Independent Sample T-test
analyses, there was no significant difference (P>0.05) for nutrients intake between fussy
and non-fussy eaters.
Children’s Health, Dietary Preference, Snack Food intake, Salt intake & Obesity
16
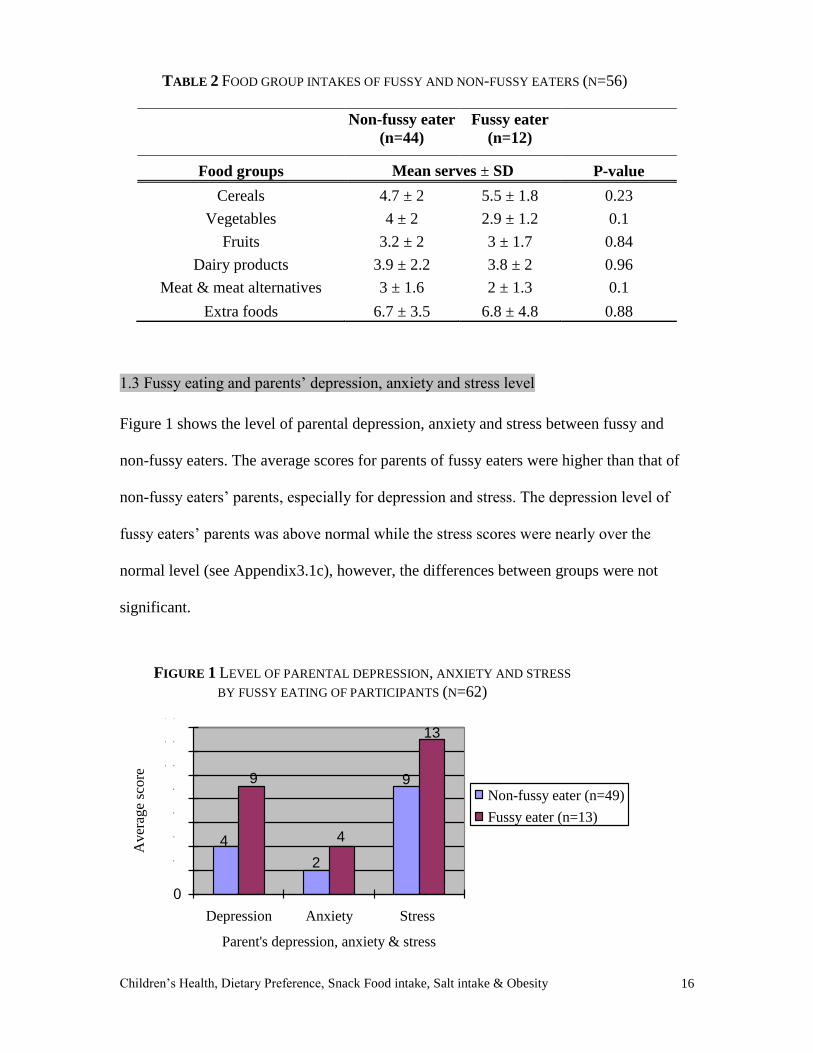
TABLE 2 FOOD GROUP INTAKES OF FUSSY AND NON-FUSSY EATERS (N=56)
Non-fussy eater
(n=44)
Fussy eater
(n=12)
Food groups Mean serves ± SD P-value
Cereals 4.7 ± 2 5.5 ± 1.8 0.23
Vegetables 4 ± 2 2.9 ± 1.2 0.1
Fruits 3.2 ± 2 3 ± 1.7 0.84
Dairy products 3.9 ± 2.2 3.8 ± 2 0.96
Meat & meat alternatives 3 ± 1.6 2 ± 1.3 0.1
Extra foods 6.7 ± 3.5 6.8 ± 4.8 0.88
1.3 Fussy eating and parents’ depression, anxiety and stress level
Figure 1 shows the level of parental depression, anxiety and stress between fussy and
non-fussy eaters. The average scores for parents of fussy eaters were higher than that of
non-fussy eaters’ parents, especially for depression and stress. The depression level of
fussy eaters’ parents was above normal while the stress scores were nearly over the
normal level (see Appendix3.1c), however, the differences between groups were not
significant.
9
2
4
13
4
9
0
2
4
6
8
1 0
1 2
1 4
Depression Anxiety Stress
Parent's depression, anxiety & stress
Aver
age
score
Non-fussy eater (n=49)
Fussy eater (n=13)
FIGURE 1 LEVEL OF PARENTAL DEPRESSION, ANXIETY AND STRESS
BY FUSSY EATING OF PARTICIPANTS (N=62)

Children’s Health, Dietary Preference, Snack Food intake, Salt intake & Obesity
17
2. Dietary Preferences
Figure 2 shows the proportion of liked and disliked food groups among all the
participants. The percentage of liked is higher than disliked for all food groups except for
the vegetable group. The favourite food group was the extra food group with 49
participants (>80%) liking this group. The second favourite food group was the cereal
group where 42 participants (> 70%) liked this food group. The most disliked food group
was the vegetable group as 43 participants (>70%) disliked this group.
25
83
58
3642
71
20
42
10
27
73
15
0
10
20
30
40
50
60
70
80
90
Cer
eals
Veg
etab
les
Fruits
Dai
ry p
rodu
cts
Mea
t & m
eat a
ltern
ativ
es
Extra
Food groups
Pe
rce
nta
ge
of
pa
rtic
ipa
nts
(%
)
Liked
Disliked
FIGURE 2 PROPORTION OF LIKED AND DISLIKED OF FOOD GROUPS OF
PARTICIPANTS (N=59)

Children’s Health, Dietary Preference, Snack Food intake, Salt intake & Obesity
18
3. Nutritional Adequacy
3.1 Comparison of food group intake with Dietary Guidelines
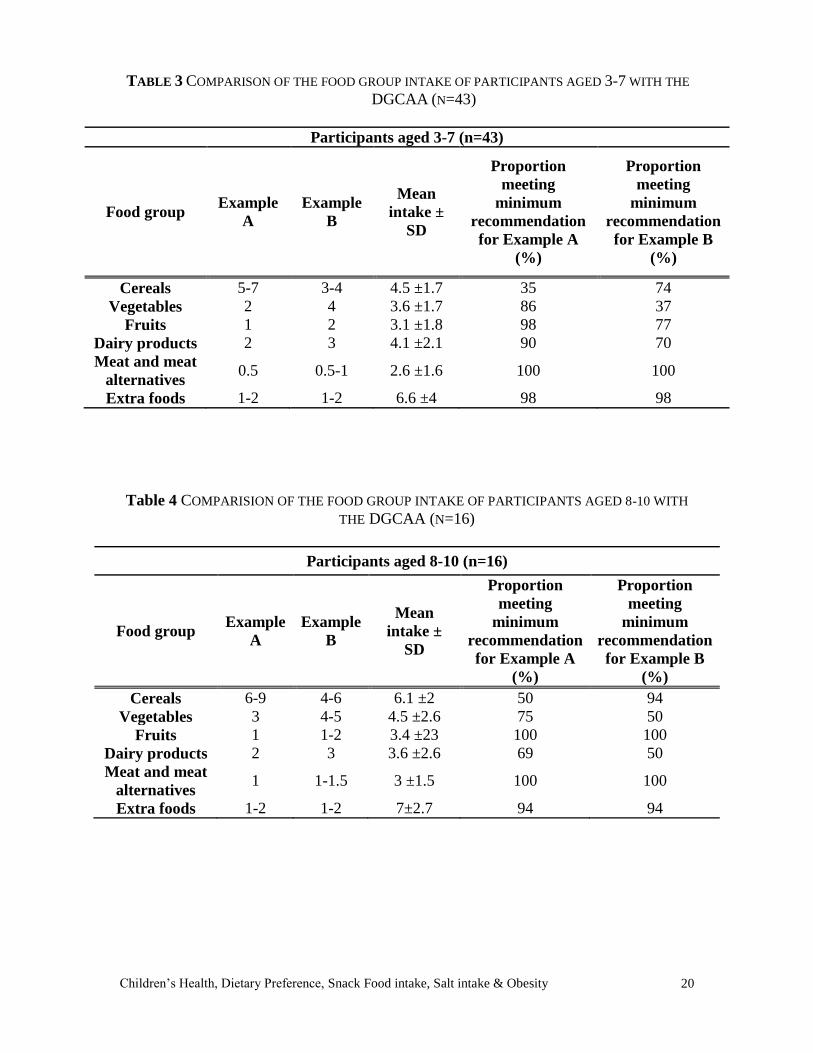
Table 3 & 4 summarizes the comparison of the major food groups intake of the
participants with the Dietary Guidelines for Children and Adolescents in Australia
(DGCAA) (39), and the proportion of participants meeting the minimum
recommendation. When compared with Recommendation Example A, the average daily
intakes of all major food groups exceeded the minimum recommendation for both age
groups, except for the cereal group in the younger age group where their intake was just
below the minimum recommendation. The proportion of children meeting the minimum
recommendation was the lowest in cereal group for both age groups as only 15
participants (35%) from the younger age group and 8 participants (50%) from the older
age group met the minimum recommendation. In the older age group, the dairy products
group was the second lowest. More participants in the younger age group met the
recommendation in the vegetable group than in the older age group.
When compared with Recommendation Example B, the average daily intake of both age
groups exceeded the minimum recommendation for all food groups except the vegetable
group in the younger age group. The average intake of extra food group was more than
five times the minimum recommendation for both age groups. As illustrated, a relatively
low proportion of participants (37%) in the younger age group met the recommendation
for vegetable intake. The meat and meat alternatives group had the largest proportion of
participants (100%) meeting the guideline for both groups. All the participants met the
recommendation for fruit consumption in the older age group. Only half the older group
participants met the recommendation for the vegetable and dairy products groups.
Children’s Health, Dietary Preference, Snack Food intake, Salt intake & Obesity
19
Regarding the individual food group, only 45 participants (76%) consumed fish in the
past 3 months, and the average intake was 1.8 serves per week. Among the participants
who consumed fish, only 26 of them (44% of all participants) consumed oily fish, and the
average serve was 0.87 serve per week. In the fruit group, the consumption of fruit juice
decreased with age where 51% of the younger age group consumed at least one serve of
fruit juice daily, while 31% of the older group consumed at least one serve of fruit juice
daily.
Children’s Health, Dietary Preference, Snack Food intake, Salt intake & Obesity
20
TABLE 3 COMPARISON OF THE FOOD GROUP INTAKE OF PARTICIPANTS AGED 3-7 WITH THE
DGCAA (N=43)
Participants aged 3-7 (n=43)
Food group Example
A
Example
B
Mean
intake ±
SD
Proportion
meeting
minimum
recommendation
for Example A
(%)
Proportion
meeting
minimum
recommendation
for Example B
(%)
Cereals 5-7 3-4 4.5 ±1.7 35 74
Vegetables 2 4 3.6 ±1.7 86 37
Fruits 1 2 3.1 ±1.8 98 77
Dairy products 2 3 4.1 ±2.1 90 70
Meat and meat
alternatives 0.5 0.5-1 2.6 ±1.6 100 100
Extra foods 1-2 1-2 6.6 ±4 98 98
Table 4 COMPARISION OF THE FOOD GROUP INTAKE OF PARTICIPANTS AGED 8-10 WITH
THE DGCAA (N=16)
Participants aged 8-10 (n=16)
Food group Example
A
Example
B
Mean
intake ±
SD
Proportion
meeting
minimum
recommendation
for Example A
(%)
Proportion
meeting
minimum
recommendation
for Example B
(%)
Cereals 6-9 4-6 6.1 ±2 50 94
Vegetables 3 4-5 4.5 ±2.6 75 50
Fruits 1 1-2 3.4 ±23 100 100
Dairy products 2 3 3.6 ±2.6 69 50
Meat and meat
alternatives 1 1-1.5 3 ±1.5 100 100
Extra foods 1-2 1-2 7±2.7 94 94
Children’s Health, Dietary Preference, Snack Food intake, Salt intake & Obesity
21
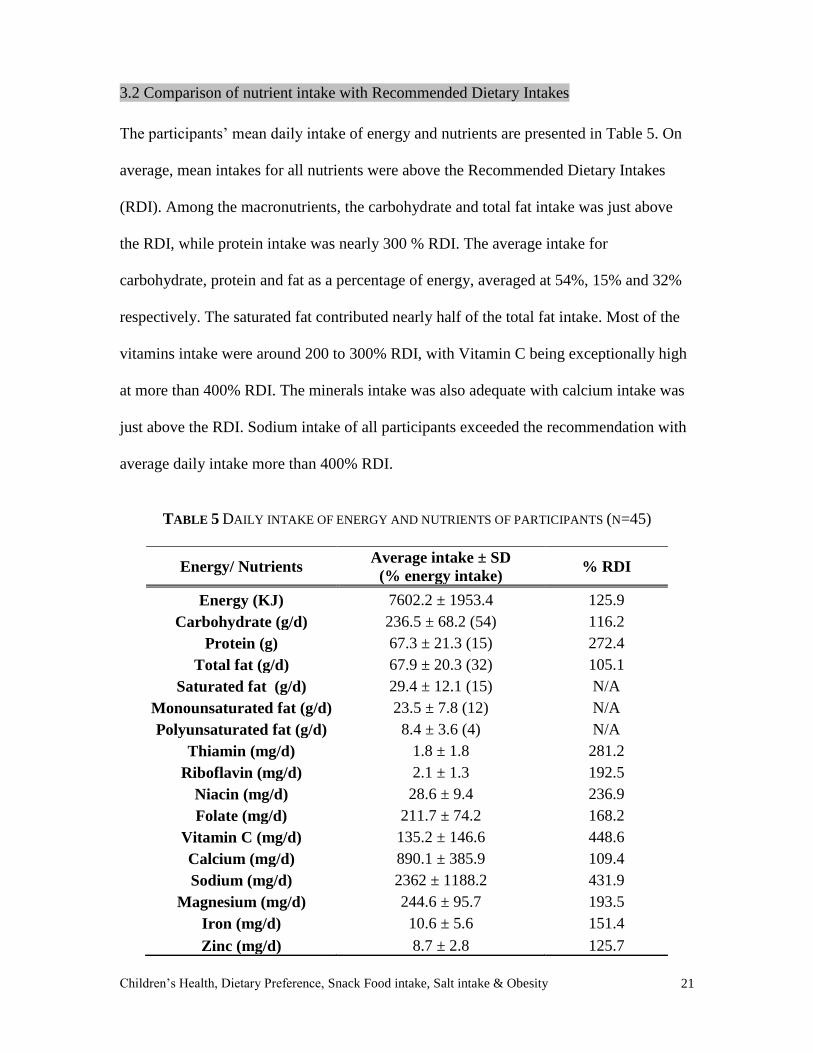
3.2 Comparison of nutrient intake with Recommended Dietary Intakes
The participants’ mean daily intake of energy and nutrients are presented in Table 5. On
average, mean intakes for all nutrients were above the Recommended Dietary Intakes
(RDI). Among the macronutrients, the carbohydrate and total fat intake was just above
the RDI, while protein intake was nearly 300 % RDI. The average intake for
carbohydrate, protein and fat as a percentage of energy, averaged at 54%, 15% and 32%
respectively. The saturated fat contributed nearly half of the total fat intake. Most of the
vitamins intake were around 200 to 300% RDI, with Vitamin C being exceptionally high
at more than 400% RDI. The minerals intake was also adequate with calcium intake was
just above the RDI. Sodium intake of all participants exceeded the recommendation with
average daily intake more than 400% RDI.
TABLE 5 DAILY INTAKE OF ENERGY AND NUTRIENTS OF PARTICIPANTS (N=45)
Energy/ Nutrients Average intake ± SD
(% energy intake) % RDI
Energy (KJ) 7602.2 ± 1953.4 125.9
Carbohydrate (g/d) 236.5 ± 68.2 (54) 116.2
Protein (g) 67.3 ± 21.3 (15) 272.4
Total fat (g/d) 67.9 ± 20.3 (32) 105.1
Saturated fat (g/d) 29.4 ± 12.1 (15) N/A
Monounsaturated fat (g/d) 23.5 ± 7.8 (12) N/A
Polyunsaturated fat (g/d) 8.4 ± 3.6 (4) N/A
Thiamin (mg/d) 1.8 ± 1.8 281.2
Riboflavin (mg/d) 2.1 ± 1.3 192.5
Niacin (mg/d) 28.6 ± 9.4 236.9
Folate (mg/d) 211.7 ± 74.2 168.2
Vitamin C (mg/d) 135.2 ± 146.6 448.6
Calcium (mg/d) 890.1 ± 385.9 109.4
Sodium (mg/d) 2362 ± 1188.2 431.9
Magnesium (mg/d) 244.6 ± 95.7 193.5
Iron (mg/d) 10.6 ± 5.6 151.4
Zinc (mg/d) 8.7 ± 2.8 125.7
Children’s Health, Dietary Preference, Snack Food intake, Salt intake & Obesity
22
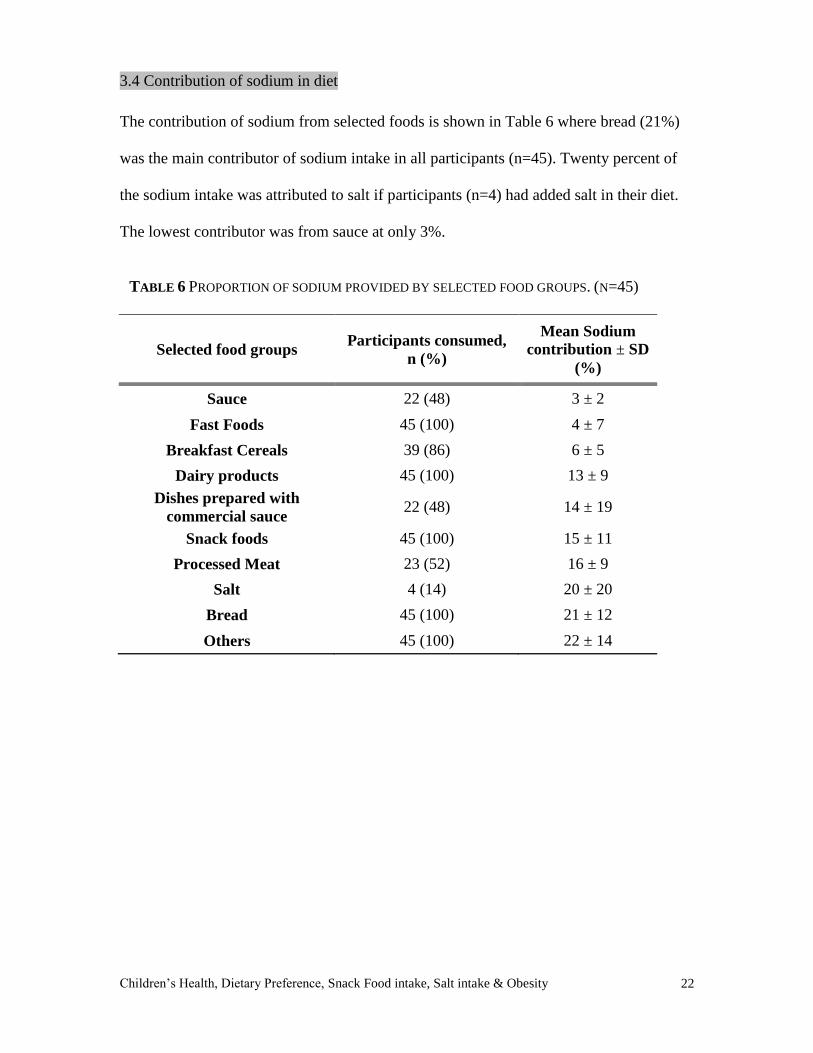
3.4 Contribution of sodium in diet
The contribution of sodium from selected foods is shown in Table 6 where bread (21%)
was the main contributor of sodium intake in all participants (n=45). Twenty percent of
the sodium intake was attributed to salt if participants (n=4) had added salt in their diet.
The lowest contributor was from sauce at only 3%.
TABLE 6 PROPORTION OF SODIUM PROVIDED BY SELECTED FOOD GROUPS. (N=45)
Selected food groups Participants consumed,
n (%)
Mean Sodium
contribution ± SD
(%)
Sauce 22 (48) 3 ± 2
Fast Foods 45 (100) 4 ± 7
Breakfast Cereals 39 (86) 6 ± 5
Dairy products 45 (100) 13 ± 9
Dishes prepared with
commercial sauce 22 (48) 14 ± 19
Snack foods 45 (100) 15 ± 11
Processed Meat 23 (52) 16 ± 9
Salt 4 (14) 20 ± 20
Bread 45 (100) 21 ± 12
Others 45 (100) 22 ± 14
Children’s Health, Dietary Preference, Snack Food intake, Salt intake & Obesity
23
4. Noncore Food Group Intake
4.1 Noncore food group consumption of participants
All the participants consumed foods and beverages from the noncore food group. The top
five commonly consumed noncore foods were; biscuits/ crackers (98%), spreads (90%),
hot chips (74%), ice-cream/dairy desserts (71%) and cake/muffin (62%).
Forty-four percent children in this study consumed sweetened beverages including soft
drinks and cordials. Among all the noncore food intake occasions, 50% were between
regular meals.
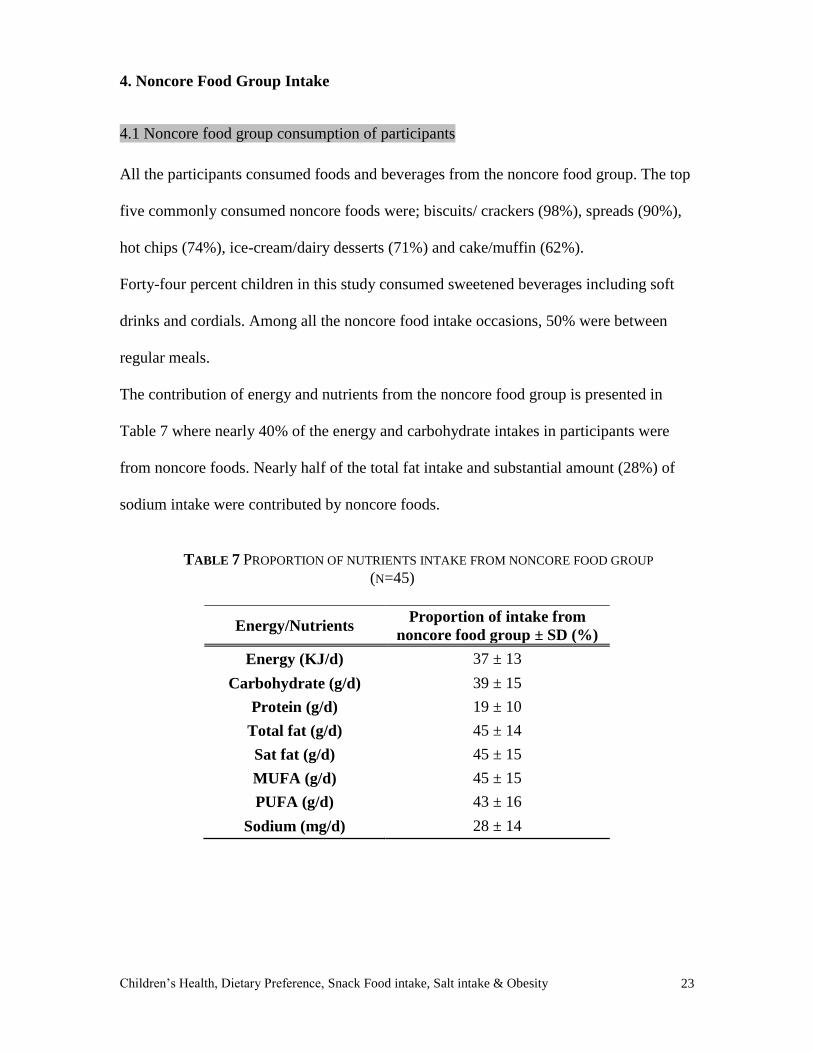
The contribution of energy and nutrients from the noncore food group is presented in
Table 7 where nearly 40% of the energy and carbohydrate intakes in participants were
from noncore foods. Nearly half of the total fat intake and substantial amount (28%) of
sodium intake were contributed by noncore foods.
TABLE 7 PROPORTION OF NUTRIENTS INTAKE FROM NONCORE FOOD GROUP
(N=45)
Energy/Nutrients Proportion of intake from
noncore food group ± SD (%)
Energy (KJ/d) 37 ± 13
Carbohydrate (g/d) 39 ± 15
Protein (g/d) 19 ± 10
Total fat (g/d) 45 ± 14
Sat fat (g/d) 45 ± 15
MUFA (g/d) 45 ± 15
PUFA (g/d) 43 ± 16
Sodium (mg/d) 28 ± 14
Children’s Health, Dietary Preference, Snack Food intake, Salt intake & Obesity
24
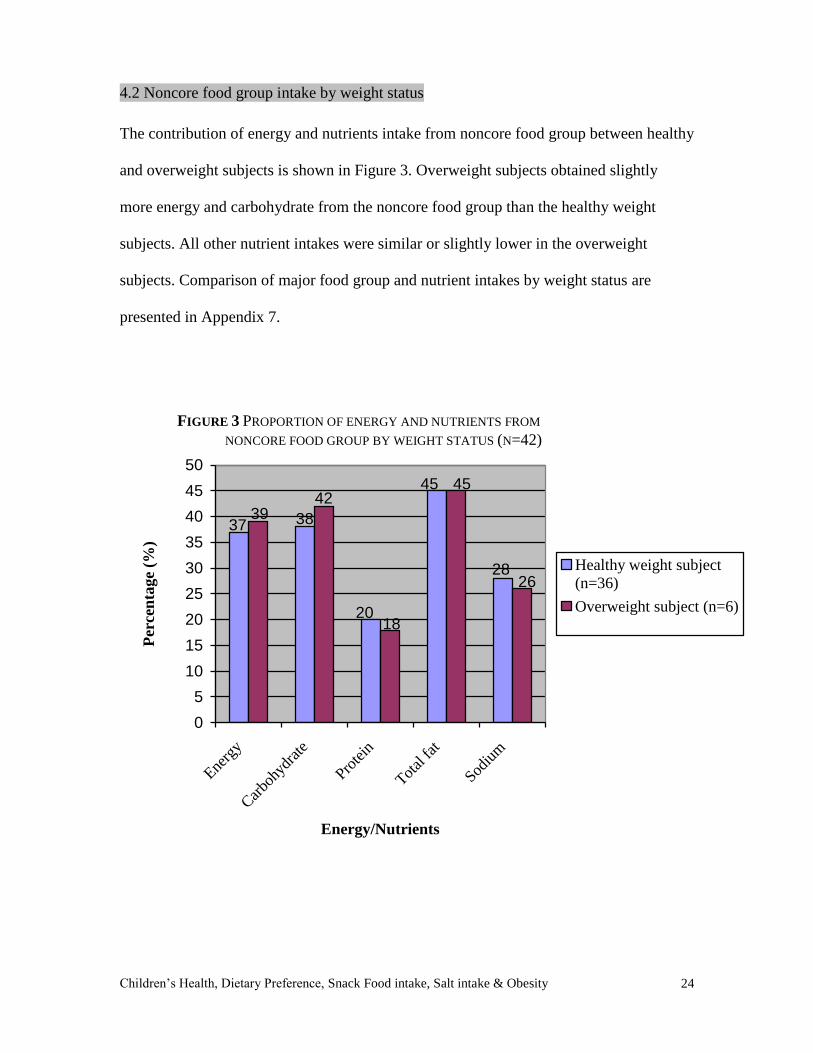
4.2 Noncore food group intake by weight status
The contribution of energy and nutrients intake from noncore food group between healthy
and overweight subjects is shown in Figure 3. Overweight subjects obtained slightly
more energy and carbohydrate from the noncore food group than the healthy weight
subjects. All other nutrient intakes were similar or slightly lower in the overweight
subjects. Comparison of major food group and nutrient intakes by weight status are
presented in Appendix 7.
28
45
20
3837
26
45
18
4239
0
5
10
15
20
25
30
35
40
45
50
Energ
y
Car
bohy
drat
e
Prote
in
Total
fat
Sodiu
m
Energy/Nutrients
Per
cen
tage
(%)
Healthy weight subject
(n=36)
Overweight subject (n=6)
FIGURE 3 PROPORTION OF ENERGY AND NUTRIENTS FROM
NONCORE FOOD GROUP BY WEIGHT STATUS (N=42)
Children’s Health, Dietary Preference, Snack Food intake, Salt intake & Obesity
25
Discussion
Fussy eating & nutritional intake
This study found that the participants’ eating behaviours were generally good as the
majority of them scored less than 10 out of 50. Some parents felt that their children’s diet
lacks variety in food choices because they are afraid of trying new foods, make repetitive
food choices and prefer bland foods. It is also common that the children ask for food
between meals. Some of these behaviours were classified as fussy eating in another study
(16). The results indicate that the diets of fussy and non-fussy eaters were more similar
than different. Their average intake met or exceeded the minimum recommendation for
all food groups. However, the vegetable intake of fussy eaters was lower than non-fussy
eaters. This is consistent with other studies (16, 17), fussy eaters consumed fewer fruits
and vegetables thus, their vitamin C intake was much lower in this study. All the nutrient
intakes were lower in the fussy eaters except riboflavin and calcium intakes. This may be
due to higher milk and diary products intake as these are the main sources for both
nutrients. Although fussy eaters, as a group, met or exceeded recommendations, some
individuals had marginal intakes of major food groups and nutrients. It is a concern that
these children cannot meet their nutritional needs in the long term if their fussy eating
continues. A particular interesting finding is that no overweight children in this study was
classified as a fussy eater. This is consistent with the finding in another study (17) that
fussy eaters were less likely to be overweight.
Children’s Health, Dietary Preference, Snack Food intake, Salt intake & Obesity
26
Parents concerned about fussy eating of children
As shown in Figure 1, parents of fussy eaters were more depressed, anxious and stressed
when compared to those of non-fussy eaters. This is because of the influence children and
parents have on each other (19). Parents shape children’s eating environment and hence
their food preferences. In turn, children affect parents’ psychological status by their
eating behaviours. Fussy eaters make meal time stressful (16), they also tend to eat small
meals, to eat slowly and to be less interested in food (15, 41). These factors result in
concern and anxiety over the child’s dietary intake. This may then lead to parents using
pressure as a feeding strategy (42). However, children would actually reduce their liking
and intake of the food they are being pressured to consume (17, 43, 44). This may further
worsen the fussy eating behaviour of the child. In order to reduce the anxiety of the
parents, it is essential to educate them about the development of food preferences in
children such as; their predisposititons to sweet and savoury foods, rejection of bitter and
sour foods, fear of trying new foods, learning to acquire new food preferences based on
the post-ingestive consequences and also the social contexts of eating. It is also important
to educate parents that the way they feed their children have a direct impact on their
children’s food preferences and eating behaviours(14).
Food preferences determine food consumption
The results shown in Figure 2 illustrate that most (>80%) participants liked extra foods
and many of them (>70%) disliked vegetables. The dislike of vegetables among the
children is consistent with the literature(5, 6, 8, 20). There are two reasons to explain this,
firstly, most noncore foods are high in fat, salt or sugar, and children are born with an
inherent preference for sweet and savoury tastes (11, 12). They also acquire the
Children’s Health, Dietary Preference, Snack Food intake, Salt intake & Obesity
27
preference for high-fat foods rather quickly(45), therefore, children prefer noncore foods.
Secondly, children’s preferences for foods that were used as a reward (nonfood related
task) was found to be increased (46), such as snack foods. Their preferences for the foods
encouraged by their parents (43, 47) such as vegetables was often reduced. It is shown
that food preferences in children are important determinants of their food consumption
(5-9) thus, their noncore food group intake was well above the recommended level in this
study.
Imbalanced diet
As shown in Table 3 and 4, the dietary intakes of the participants were more comparable
to Recommendation Example B of the dietary guideline because they include more of all
food groups and have a higher intake of animal products in their diet. Overall, when
compared with Recommendation Example B, participants were adequately nourished. In
the current study, average daily intake of all food groups were above recommended levels
except for the vegetable intake in the younger age group. Some food groups’ intake
greatly exceeded the recommendation, especially meat & meat alternatives group and
extra food. One particular concern is that less than half of the participants met the
recommendation for minimum vegetable intake, once again reflecting the children’s food
preferences determine their food intake (9). Another concern is that only half of the
participants from the older age group met the recommendation for diary products intake.
Dairy products are excellent sources of many nutrients, especially calcium (39). Calcium
is important for bone growth and for attaining peak bone mass at adolescence, which is
protective against osteoporosis and bone fractures later in life (48). In this study, children
appeared to have a high protein, low carbohydrate diet. Their protein intake was nearly
Children’s Health, Dietary Preference, Snack Food intake, Salt intake & Obesity
28
three times the RDI while carbohydrate intake was just above the RDI (see Table 5), in
which 40% carbohydrate was from noncore foods. The high prevalence of such eating
pattern may be because parents lack sufficient time for meal preparation. The proportions
of married women in the workforce have substantially increased in the past years (49).
Therefore, convenient meals are served instead of the traditional meals, which may not
provide children with enough energy. This may explain why they ask for foods between
meals, and most of the time, energy-dense snack foods are provided. For that reason,
increasing children’s cereals intake in regular meals is recommended such as
Recommendation Example A (see Table 3) because it provides more energy in the form
of carbohydrate from the cereals group (38). This will in turn allow them to have
sustainable energy and hence decrease the consumption of snacks between meals.
Imbalanced type of fat in diet
In this study, total fat provided 32% of the total energy, with 15%, 12% and 4% from
saturated fat, monounsaturated fat and polyunsaturated fat respectively. The results are
consistent with the NNS 1995 (22) where 33.4% of total energy was from fat and the
contribution of saturated fat, monounsaturated fat and polyunsaturated fat was 14%, 12%
and 5% respectively. The saturated fat intake was higher than the recommendation of
10% total energy intake (50), this may due to the high consumption of noncore foods and
dairy products among the participants. It is desirable to educate parents about the
appropriate alternative fat sources such as monounsaturated fatty acids and
polyunsaturated fatty acids. The polyunsaturated fat is much lower than the
recommended level of 10% of energy intake, so the omega-3 polyunsaturated fatty acid

Children’s Health, Dietary Preference, Snack Food intake, Salt intake & Obesity
29
(ω-3) intake can be considered negligible. This is because the oily fish consumption of
the participants is very low with less than one serve per week and more than half of the
participants did not include any oily fish in their diet. Oily fish is the main source of ω-3,
which is important for brain development. It also reduces the incidence and symptom
severity of several neurological, immunological, cardiovascular, and inflammatory
conditions (51-53). Many believe that the increased prevalence of atopic diseases, such
as asthma, eczema and allergic reactions is due to changes in the typical diet, that
includes a decreased consumption of ω-3 (54). A previous study (55) has shown that the
consumption of oily fish more than once a week reduces the risk of developing airway
hyperresponsiveness.
Reasons for excessive intake of certain nutrients
Results shown in Table 5 indicate that the mean energy and nutrient intakes of the
participants were above the RDI. This is inconsistent with the result of NNS, 1995 (22),
which indicated that many children’s micronutrients intakes were less than 70% of the
RDI. In this study, some nutrient intakes such as protein, vitamin C and sodium were
exceptionally high. The high protein intake (~300% RDI) is due to the elevated
consumption of meat and meat alternatives among the participants with their intake
exceeding five times the recommendation. A high fruit group intake contributed to the
soaring vitamin C intake (>400% RDI) in this study. Over half of the participants in the
younger age group consumed at least one serve of fruit juice daily. Fruit juice is a good
source of vitamin C and folate, however, most fruit juices contain added sugars and this
may contribute to excessive daily energy intakes. It is a concern that the sodium intake of
the participants were remarkably high (>400% RDI), some studies in children and
Children’s Health, Dietary Preference, Snack Food intake, Salt intake & Obesity
30
adolescents have found sodium to be positively associated with blood pressure (56). High
sodium intake in early life may cause high blood pressure later in life (30), so it is
important to control the sodium intake of children. In this study, salt is a big contributor
to the sodium intake if the children had added salt in their diet. However, there are also
many sources of ‘invisible salt’ in their diet. One of the main sources is bread, which is
the major component of their diet. All participants consumed bread and it has contributed
21% of their sodium intake. Another main source of sodium is processed foods, such as
processed meat and snack foods. The commercial sauce used in cooking is also a major
source of sodium in the children’s diet. This has important implications for identifying
sodium reduction strategies. It is found that responses to salty foods are strongly
influenced by environmental factors (57). An early experience with low or high salt diets
may have a long-term impact on preferred salt levels (58). Moreover, the acceptance of
certain foods increased with repeated exposure to that foods (59-61). Therefore, reduction
of salt in the food supply or increasing the availability of low salt food products in the
market are important strategies to reduce the sodium intake of children. However, the
high percentage RDI of sodium may also be due to the relatively low RDI values set for
sodium.
Overconsumption of noncore foods
In this study, the noncore food consumption was tremendously high where it exceeded
three times the maximum recommended quantity (see Table 3 & 4). Overconsumption of
noncore food has been reported in other studies and similar results were found (22, 24).
All participants in this study consumed noncore foods, making up 37% of their total
energy intake. The most commonly consumed noncore foods such as biscuits, hot chips,
Children’s Health, Dietary Preference, Snack Food intake, Salt intake & Obesity
31
ice-cream and cake, are all tend to be energy dense and of little nutritional value. They
also contributed nearly half the daily fat intake and considerable amount of sodium
intake. Despite this, snack foods are still readily available to children in a variety of
settings, including homes and schools. As mentioned previously, children did not get
enough energy from their main meals, so they asked for foods between meals and many
parents give them noncore foods, because they believed that it is acceptable for children
to have unhealthy snacks daily as a ‘treat’, which can be part of a healthy diet (62). A
previous study (26) showed that the top five food types contributing to energy intake at
school were all noncore foods except for bread. It also revealed that the energy intake
from snack foods were greater at school when compared to out of school. In this study,
half of the noncore food intake occasions were between regular meals and this implied
that noncore foods intake in children were spread throughout the whole day. It is crucial
to control the overconsumption of energy-dense food by providing children with a
substantial meal and avoid snacking all through the day.
Noncore food consumption inconsistent with body weight
The prevalence of overweight and obese participants was 20%, which is comparable to
the national average (19-23%) (31). Snack foods are frequently related to promotion of
weight gain in children, this is because, firstly, snack food consumption is very often
addition to the regular meals. Besides obtaining energy from the major food groups, the
children receive extra energy from the noncore foods resulting in a positive energy
balance which leads to weight gain. Secondly, most snack foods are high in fat and
dietary fat intake is associated with weight again (63, 64). In this study, there was no
significant difference in the contribution of energy and nutrients between different weight
Children’s Health, Dietary Preference, Snack Food intake, Salt intake & Obesity
32
groups. The lack of association of noncore food intake with body weight may be due to
under-reporting of energy intakes that has been observed among overweight children (36,
37). The other possible reason is the overweight participants may have modified their
dietary intake in response to their weight. A previous study (33) has shown an
association between low quality food and overweight status, while other studies have not
(24, 34). There are several reasons for the difference in results; it may be due to the
difference in age groups studied, length of the study, locations, methodologies, or
definition of snack. Even the association of snack food intake and weight status is
inconclusive, due to its low nutrient density and high saturated fat content. It is a concern
that high intake of noncore foods will lead to other health problems and will affect the
health status of the children in long term.
Limitations and further research
In this study, both FFQ and 4-day food records were used to collect the dietary intake of
children. This is unlike the other study where only 24 hour recall were used (24). When
used exclusively, a 24 hour recall method is inadequate for characterizing the usual eating
patterns of an individual (65, 66). The usage of both food diary and FFQ can give a more
detailed food intake of the child and it can also improve the confidence in results.
However, there are some concerns for these methods. For FFQ, the reported amounts and
the frequency of foods might not be correct and in most cases, overestimation occurs (66,
67). For food records, carers may not fill in the type and quantity of food accurately,
especially when participants have their meals at childcare centers or in schools. In
addition, the unclear descriptions of foods in the food record also lead to a source of error
when analyzing children’s dietary intake, so detailed explanations on how to fill in the
Children’s Health, Dietary Preference, Snack Food intake, Salt intake & Obesity
33
FFQ and food diary may be needed. It would be better if menus can be obtained from
childcare centers and schools with the assistance of staff for the recording of the amount
of food consumed by the child. The weight and height of participants were provided by
carers and this self-reported height and weight was not considered a big limitation, as it is
a validated method (68) and parents can provide valid information. We were unable to
detect significant differences in many of the comparisons between groups. This is
possibly due to the small sample size, hence resulting in the unexpected statistical results.
Increasing the sample size can thus be seen as important as it would allow less variation
and consequently more accurate results.
This study shows the general view of children’s eating pattern, further research on this
study should specifically address the limitations noted in this study. Further investigation
on parents’ nutrition knowledge, beliefs and attitudes are also crucial for planning
strategies for promoting healthy eating in children.
Implications of findings
The results in the current study provide insights that are potentially important to the
design of effective behaviour intervention for children such as changing children’s eating
patterns so to be more in line with dietary guidelines. Since the children are overeating,
the message to parents should no longer focus solely on increasing the intake of certain
food groups, it should focus more on educating the parents on a healthy diet and how to
provide their children with filling regular meals rather than snacking throughout the day.
Children’s Health, Dietary Preference, Snack Food intake, Salt intake & Obesity
34
Conclusion
The data in this study suggest that both of fussy and non-fussy eaters had adequate
nutritional intakes. However, the children’s diets were imbalanced due to their food
preferences. More than half of the participants did not meet the recommendation for
cereals (in Recommendation Example A) and vegetable (in Recommendation Example
B). In addition, noncore foods were a main contributor to the energy and fat levels. Even
though no significant association was found between snack intake and weight status, as a
result of poor nutritional content, they should be reduced in children’s diet. This study
also shows that parents were anxious about their child’s eating behaviours, therefore,
education is required for parents on children’s food preferences development and how to
offer their child a healthy diet.
Children’s Health, Dietary Preference, Snack Food intake, Salt intake & Obesity
35
References
1. Dietz WH. Critical periods in childhood for the development of obesity. Am J
Clin Nutr 1994;59:955-9.
2. Must A. Morbidity and mortality associated with elevated body weight in children
and adolescents. Am J Clin Nutr 1996;63:445S-447S.
3. Berenson GS, Srinivasan SR, Nicklas TA. Atherosclerosis: a nutritional disease of
childhood. Am J Cardiol 1998;82:22T-29T.
4. Kelder SH, Perry CL, Klepp KI, Lytle LL. Longitudinal tracking of adolescent
smoking, physical activity, and food choice behaviors. Am J Public Health
1994;84:1121-6.
5. Domel SB, Baranowski T, Davis H, Leonard SB, Riley P, Baranowski J.
Measuring fruit and vegetable preferences among 4th- and 5th-grade students.
Prev Med 1993;22:866-79.
6. Resnicow K, Davis-Hearn M, Smith M, et al. Social-cognitive predictors of fruit
and vegetable intake in children. Health Psychol 1997;16:272-6.
7. Drewnowski A. Taste preferences and food intake. Annu Rev Nutr 1997;17:237-
53.
8. Pilgrim FJ. What foods do people accept or reject? Group attitudes and behavior
toward food. J Am Diet Assoc 1961;38:439-43.
9. Birch LL, Fisher JO. Development of eating behaviors among children and
adolescents. Pediatrics 1998;101:539-49.
10. Ford DH, Lerner RM. Developmental Systems Theory. Newbury Park, CA: Sage,
1992.
11. Maller O, Turner RE. Taste in acceptance of sugars by human infants. J Comp
Physiol Psychol 1973;84:496-501.
12. Beauchamp GK, Cowart BJ, Moran M. Developmental changes in salt
acceptability in human infants. Dev Psychobiol 1986;19:17-25.
13. Steiner JE. Facial Expressions of the neonate infant indicating the hedonics of
food-related chemical stimuli. Washington, DC: US Gov. Print Off, 1997.
14. Birch LL. Development of food preferences. Annu Rev Nutr 1999;19:41-62.
Children’s Health, Dietary Preference, Snack Food intake, Salt intake & Obesity
36
15. Carruth BR, Skinner J, Houck K, Moran J, 3rd, Coletta F, Ott D. The
phenomenon of "picky eater": a behavioral marker in eating patterns of toddlers. J
Am Coll Nutr 1998;17:180-6.
16. Jacobi C, Agras WS, Bryson S, Hammer LD. Behavioral validation, precursors,
and concomitants of picky eating in childhood. J Am Acad Child Adolesc
Psychiatry 2003;42:76-84.
17. Galloway AT, Fiorito L, Lee Y, Birch LL. Parental pressure, dietary patterns, and
weight status among girls who are "picky eaters". J Am Diet Assoc
2005;105:541-8.
18. Rydell AM, Dahl M, Sundelin C. Characteristics of school children who are
choosy eaters. J Genet Psychol 1995;156:217-29.
19. Holden GW, Miller PC. Enduring and different: a meta-analysis of the similarity
in parents' child rearing. Psychol Bull 1999;125:223-54.
20. Skinner JD, Carruth BR, Wendy B, Ziegler PJ. Children's food preferences: a
longitudinal analysis. J Am Diet Assoc 2002;102:1638-47.
21. Pliner P, Pelchat ML. Similarities in food preferences between children and their
siblings and parents. Appetite 1986;7:333-42.
22. McLennan W & Podger A. National Nutrition Survery. Selected highlights.
Australia 1995. Canberra: Australian Bureau of Statistics, 1997.
23. Report on the weight status of NSW:2003. NSW Centre for Public Health
Nutrition
24. Bell AC, Kremer PJ, Magarey AM, Swinburn BA. Contribution of 'noncore' foods
and beverages to the energy intake and weight status of Australian children. Eur J
Clin Nutr 2005;59:639-45.
25. Scarlett G. Nutrition in primary schoolchildren. Sydney: Central Sydney Health
Service, sponsored by Nutrition Education Service, NSW Dairy Industry, 1993
26. Bell AC, Swinburn BA. What are the key food groups to target for preventing
obesity and improving nutrition in schools? Eur J Clin Nutr 2004;58:258-63.
27. Portela L. "Food Acceptance and Food Rejection in children with ASD: Dietary
Preference and Good". Nutrition Research Tropics in Nutrition and Dietetics,
component of the RPAH Allergy Unit ASD study, University of Wollongong,
2004.
28. Chobanian AV, Hill M. National Heart, Lung, and Blood Institute Workshop on
Sodium and Blood Pressure: a critical review of current scientific evidence.
Hypertension 2000;35:858-63.

Children’s Health, Dietary Preference, Snack Food intake, Salt intake & Obesity
37
29. Elliot WJ. Blood pressure tracking. J Cardiovasc Risk 1997;4:251-6
30. Geleijnse JM, Hofman A, Witteman JC, Hazebroek AA, Valkenburg HA,
Grobbee DE. Long-term effects of neonatal sodium restriction on blood pressure.
Hypertension 1997;29:913-7.
31. Magarey AM, Daniels LA, Boulton TJ. Prevalence of overweight and obesity in
Australian children and adolescents: reassessment of 1985 and 1995 data against
new standard international definitions. Med J Aust 2001;174:561-4.
32. Blundell JE, Cooling J. Routes to obesity: phenotypes, food choices and activity.
Br J Nutr 2000;83 Suppl 1:S33-8.
33. Nicklas TA, Yang SJ, Baranowski T, Zakeri I, Berenson G. Eating patterns and
obesity in children. The Bogalusa Heart Study. Am J Prev Med 2003;25:9-16.
34. Phillips SM, Bandini LG, Naumova EN, et al. Energy-dense snack food intake in
adolescence: longitudinal relationship to weight and fatness. Obes Res
2004;12:461-72.
35. Davies PS, Coward WA, Gregory J, White A, Mills A. Total energy expenditure
and energy intake in the pre-school child: a comparison. Br J Nutr 1994;72:13-20.
36. Livingstone MB, Prentice AM, Coward WA, et al. Validation of estimates of
energy intake by weighed dietary record and diet history in children and
adolescents. Am J Clin Nutr 1992;56:29-35.
37. Bandini LG, Schoeller DA, Cyr HN, Dietz WH. Validity of reported energy
intake in obese and nonobese adolescents. Am J Clin Nutr 1990;52:421-5.
38. Smith A, Kellet E & Schmerlaib Y. The Australian Guide to Healthy Eating.
Canberra: Commonwealth Department of Health and Family Services. 1998.
39. NHMRC & DHA. Food for Health: Dietary Guidelines for Children and
Adolescents in Australia. Canberra: Commonwealth Department of Health. 2003.
40. Cole TJ, Bellizzi MC, Flegal KM, Dietz WH. Establishing a standard definition
for child overweight and obesity worldwide: international survey. Bmj
2000;320:1240-3.
41. Reau NR, Senturia YD, Lebailly SA, Christoffel KK. Infant and toddler feeding
patterns and problems: normative data and a new direction. Pediatric Practice
Research Group. J Dev Behav Pediatr 1996;17:149-53.
42. Francis LA, Hofer SM, Birch LL. Predictors of maternal child-feeding style:
maternal and child characteristics. Appetite 2001;37:231-43.
Children’s Health, Dietary Preference, Snack Food intake, Salt intake & Obesity
38
43. Birch LL, Birch D, Marlin DW, Kramer L. Effects of instrumental consumption
on children's food preference. Appetite 1982;3:125-34.
44. Batsell WR, Jr., Brown AS, Ansfield ME, Paschall GY. "You will eat all of that!"
a retrospective analysis of forced consumption episodes. Appetite 2002;38:211-9.
45. Birch LL. Children's preferences for high-fat foods. Nutr Rev 1992;50:249-55.
46. Birch LL, Zimmerman S, Hind H. The influence of social-effective context on
preschool children’s food preferences. Child Dev. 1980;51:856-861.
47. Newman J, Taylor A. Effect of a means-end contingency on young children's
food preferences. J Exp Child Psychol 1992;53:200-16.
48. Mascarenhas MR, Tershakovec AM, Stettler N. Nutrition interventions in
childhood for the prevention of chronic diseases in adulthood. Curr Opin Pediatr
1999;11:598-604.
49. Commission, E. P. A. The Changing Australian Labour Market, Australian
Government Publishing Service. 1996.
50. National Health and Medical Research Council. The role of polyunsaturated fats
in Australian diet. Canberra: Australian Government Publishing Service 1991
51. Shahidi F, Miraliakbari H. Omega-3 fatty acids in health and disease: part 2--
health effects of omega-3 fatty acids in autoimmune diseases, mental health, and
gene expression. J Med Food 2005;8:133-48.
52. Kremer JM, Jubiz W, Michalek A, et al. Fish-oil fatty acid supplementation in
active rheumatoid arthritis. A double-blinded, controlled, crossover study. Ann
Intern Med 1987;106:497-503.
53. Calder PC. Immunoregulatory and anti-inflammatory effects of n-3
polyunsaturated fatty acids. Braz J Med Biol Res 1998;31:467-90.
54. Black PN, Sharpe S. Dietary fat and asthma: is there a connection? Eur Respir J
1997;10:6-12.
55. Hodge L, Salome CM, Peat JK, Haby MM, Xuan W, Woolcock AJ. Consumption
of oily fish and childhood asthma risk. Med J Aust 1996;164:137-40.
56. Simons-Morton DG, Obarzanek E. Diet and blood pressure in children and
adolescents. Pediatr Nephrol 1997;11:244-9.
57. Mattes RD. The taste for salt in humans. Am J Clin Nutr 1997;65:692S-697S.
58. Beauchamp GK, Engelman K. High salt intake. Sensory and behavioral factors.
Hypertension 1991;17:I176-81.
Children’s Health, Dietary Preference, Snack Food intake, Salt intake & Obesity
39
59. Birch LL, Marlin DW. I don't like it; I never tried it: effects of exposure on two-
year-old children's food preferences. Appetite 1982;3:353-60.
60. Birch LL, McPhee L, Shoba BC, Pirok E, Steinberg L. What kind of exposure
reduces children's food neophobia? Looking vs. tasting. Appetite 1987;9:171-8.
61. Pliner P. The effects of mere exposure on liking for edible substances. Appetite
1982;3:283-90.
62. Hesketh K, Waters E, Green J, Salmon L, Williams J. Healthy eating, activity and
obesity prevention: a qualitative study of parent and child perceptions in
Australia. Health Promot Int 2005;20:19-26.
63. Klesges RC, Klesges LM, Eck LH, Shelton ML. A longitudinal analysis of
accelerated weight gain in preschool children. Pediatrics 1995;95:126-30.
64. Nguyen VT, Larson DE, Johnson RK, Goran MI. Fat intake and adiposity in
children of lean and obese parents. Am J Clin Nutr 1996;63:507-13.
65. Thompson FE, Byers T. Dietary assessment resource manual. J Nutr
1994;124:2245S-2317S.
66. Kaskoun MC, Johnson RK, Goran MI. Comparison of energy intake by
semiquantitative food-frequency questionnaire with total energy expenditure by
the doubly labeled water method in young children. Am J Clin Nutr 1994;60:43-7.
67. Serra Majem L, Morales D, Domingo C, Caubet E, Ribas L, Nogues RM.
[Comparison of 2 methods of evaluation of food and nutrient intake: 24-hour
recall and semiquantitative frequency questionnaire]. Med Clin (Barc)
1994;103:652-6.
68. Goodman E, Hinden BR, Khandelwal S. Accuracy of teen and parental reports of
obesity and body mass index. Pediatrics 2000;106:52-8.

Children’s Health, Dietary Preference, Snack Food intake, Salt intake & Obesity
40
Appendices
Appendix 1
Ethics Approval
Children’s Health, Dietary Preference, Snack Food intake, Salt intake & Obesity
41
Appendix 2
Expression of interest
Children’s Health, Dietary Preference, Snack Food intake, Salt intake & Obesity
42
Appendix 3
Questionnaires used this study
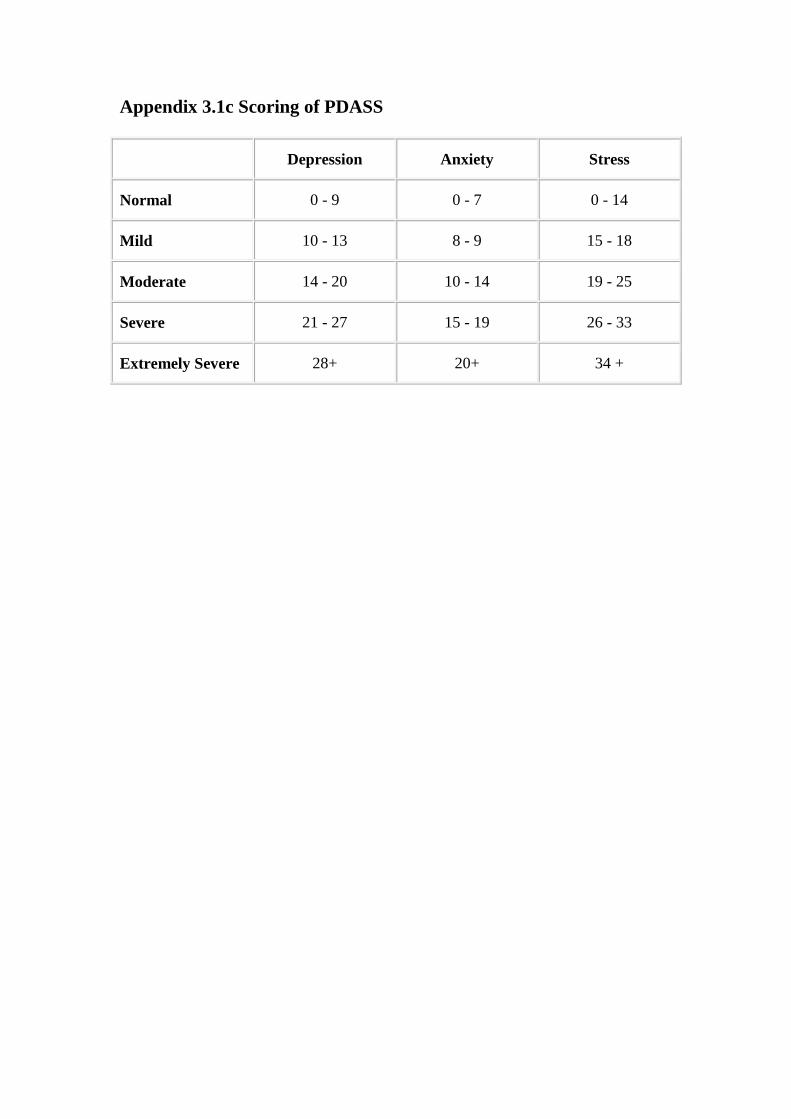
Appendix 3.1c Scoring of PDASS
Depression Anxiety Stress
Normal 0 - 9 0 - 7 0 - 14
Mild 10 - 13 8 - 9 15 - 18
Moderate 14 - 20 10 - 14 19 - 25
Severe 21 - 27 15 - 19 26 - 33
Extremely Severe 28+ 20+ 34 +
Appendix 3.1b Scoring template for PDASS
Children’s Health, Dietary Preference, Snack Food intake, Salt intake & Obesity
43
Appendix 4
Four Day Food Intake Diary
Children’s Health, Dietary Preference, Snack Food intake, Salt intake & Obesity
44
Appendix 5
Classification of core and noncore foods
Children’s Health, Dietary Preference, Snack Food intake, Salt intake & Obesity
45
Appendix 6
Energy and nutrients intake of fussy
and
non-fussy eaters
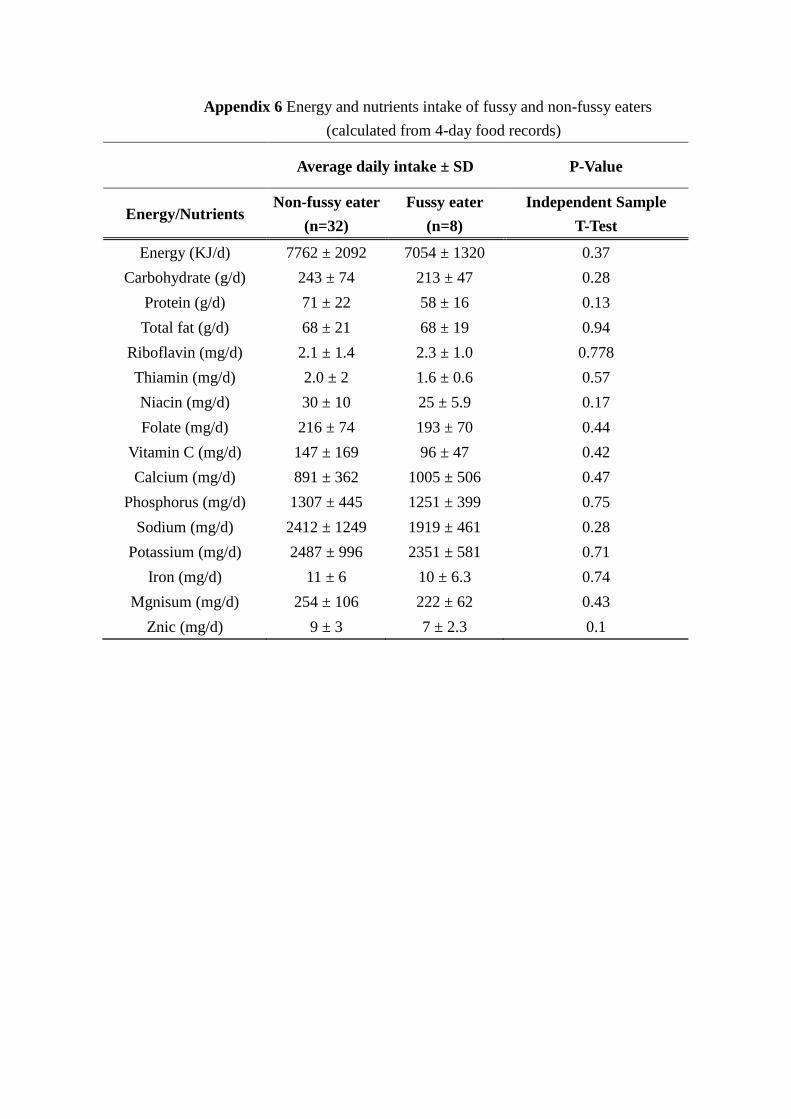
Appendix 6 Energy and nutrients intake of fussy and non-fussy eaters
(calculated from 4-day food records)
Average daily intake ± SD P-Value
Energy/Nutrients Non-fussy eater
(n=32)
Fussy eater
(n=8)
Independent Sample
T-Test
Energy (KJ/d) 7762 ± 2092 7054 ± 1320 0.37
Carbohydrate (g/d) 243 ± 74 213 ± 47 0.28
Protein (g/d) 71 ± 22 58 ± 16 0.13
Total fat (g/d) 68 ± 21 68 ± 19 0.94
Riboflavin (mg/d) 2.1 ± 1.4 2.3 ± 1.0 0.778
Thiamin (mg/d) 2.0 ± 2 1.6 ± 0.6 0.57
Niacin (mg/d) 30 ± 10 25 ± 5.9 0.17
Folate (mg/d) 216 ± 74 193 ± 70 0.44
Vitamin C (mg/d) 147 ± 169 96 ± 47 0.42
Calcium (mg/d) 891 ± 362 1005 ± 506 0.47
Phosphorus (mg/d) 1307 ± 445 1251 ± 399 0.75
Sodium (mg/d) 2412 ± 1249 1919 ± 461 0.28
Potassium (mg/d) 2487 ± 996 2351 ± 581 0.71
Iron (mg/d) 11 ± 6 10 ± 6.3 0.74
Mgnisum (mg/d) 254 ± 106 222 ± 62 0.43
Znic (mg/d) 9 ± 3 7 ± 2.3 0.1

Children’s Health, Dietary Preference, Snack Food intake, Salt intake & Obesity
46
Appendix 7
Major food group and nutrient intakes
of
healthy weight and overweight subjects
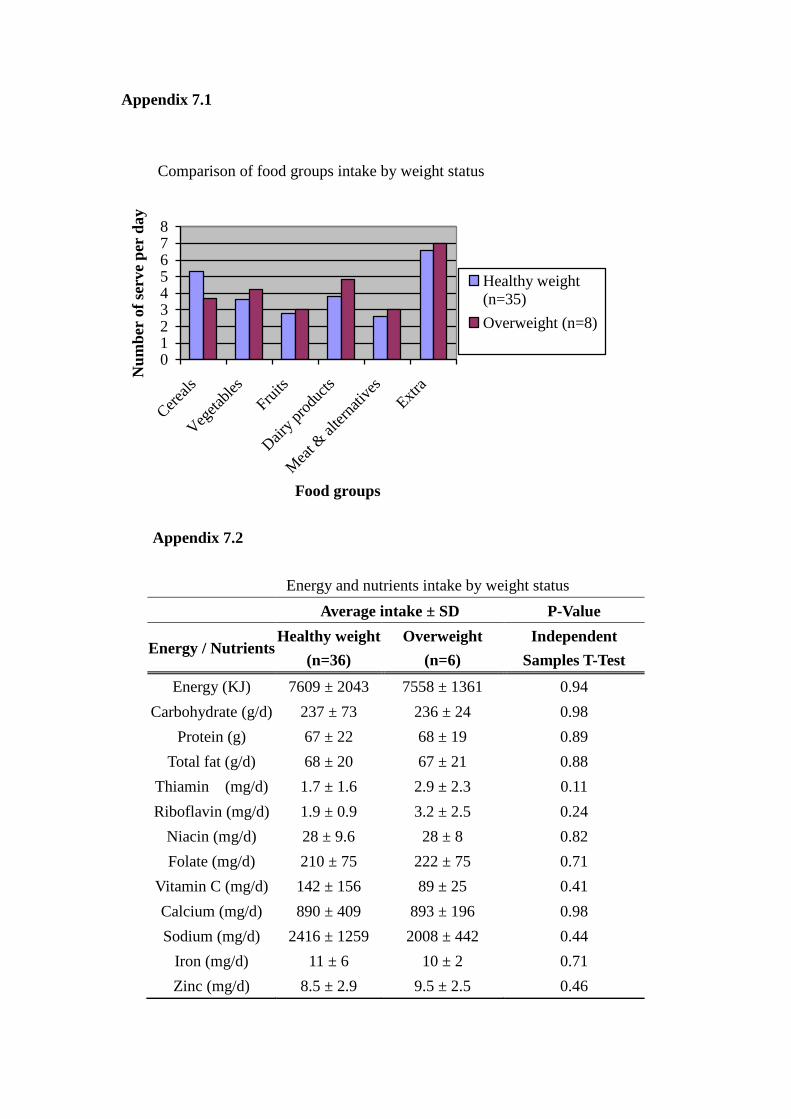
012345678
Cer
eals
Veg
etab
les
Fruits
Dai
ry p
rodu
cts
Mea
t & alte
rnat
ives
Extra
Food groups
Nu
mb
er o
f se
rve
per
day
Healthy weight
(n=35)
Overweight (n=8)
Appendix 7.2
Energy and nutrients intake by weight status
Average intake ± SD P-Value
Energy / Nutrients Healthy weight
(n=36)
Overweight
(n=6)
Independent
Samples T-Test
Energy (KJ) 7609 ± 2043 7558 ± 1361 0.94
Carbohydrate (g/d) 237 ± 73 236 ± 24 0.98
Protein (g) 67 ± 22 68 ± 19 0.89
Total fat (g/d) 68 ± 20 67 ± 21 0.88
Thiamin (mg/d) 1.7 ± 1.6 2.9 ± 2.3 0.11
Riboflavin (mg/d) 1.9 ± 0.9 3.2 ± 2.5 0.24
Niacin (mg/d) 28 ± 9.6 28 ± 8 0.82
Folate (mg/d) 210 ± 75 222 ± 75 0.71
Vitamin C (mg/d) 142 ± 156 89 ± 25 0.41
Calcium (mg/d) 890 ± 409 893 ± 196 0.98
Sodium (mg/d) 2416 ± 1259 2008 ± 442 0.44
Iron (mg/d) 11 ± 6 10 ± 2 0.71
Zinc (mg/d) 8.5 ± 2.9 9.5 ± 2.5 0.46
Appendix 7.1
Comparison of food groups intake by weight status