Embed Size (px)
Citation preview

Children’s Allowances: Their Size and in Five Countries
CHILDREN’S ALLOWANCES-primarily cash benefits to families with children-are found in about half the countries of the world, including all the industrial nations except Japan and the United States.l All of the programs in the West- ern World are, in effect, universal in coverage for families with specified numbers of children. In some countries, however, a degree of selectivity appears to arise from the fact that employers (and the self-employed) are the only contributors to children’s allowances. Thus, in theory, the right to an allowance is tied to the occupational activity of the family breadwinner. But even in these countries, when the covered person stops working because of disability, unemployment, or death, payments under the children’s allowances pro- gram continue.
Unlike the old-age, invalidity, and survivor in- surance programs, children’s allowances programs generally lack any mechanism for regular adjust- ment of benefits to cost-of-living or wage in- creases. The allowances are usually modest in amount since there are often long delays in making ad hoc adjustments-delays sometimes attributed to the political climate. Nevertheless, concern with the need to update allowance rates more frequently seems to be growing in some countries, perhaps because of renewed interest in the problems of poverty.
This article discusses children’s allowances programs in five countries-Canada, France, Sweden, the United Kingdom, and the Federal Republic of Germany. The countries selected rep- resent different approaches to such programs in the following areas: (1) Reasons for introducing
* Office of Research and Statistics, International Staff. 1 Sixty-two nations now have children’s allowances pro-
grams : All European countries except Malta ; 20 African countries (South Africa and the 19 French-speaking coun- tries) ; five countries in Oceania and Southeast Asia (Australia, New Zealand, Nauru, Cambodia, and South Vietnam) ; Lebanon, Iran, and Israel in the Middle East ; six countries in South America; and Canada in North America.
BULLETIN, MAY 1972
Structure
by LEIF HAANES-OLSEN*
the program, (2) benefit patterns, (3) actual and relative size of payments, (4) financing, and (5) solution of problems encountered in striving toward original program goals.
BACKGROUND
Early Developments
Historically, the rationale for children’s allow- ances has gone full circle, in a sense returning to its point of origin after almost a century- the idea of helping the poor. Assistance based on family burden began first in France on a small scale about 1870 and next in Germany at the end of World War I, when employers decided to assist workers with children in meeting their family responsibilities. Within individual coun- tries, however, evolution has sometimes taken a different path. France’s initial humanitarian ap- proach, for example, has since been replaced by one stressing population policy, and Sweden’s early population approach (1920%-1930’s) has evolved into a humanitarian or social rights program.
Children’s allowances in Canada, France, Sweden, the United Kingdom, and the Federal Republic of Germany represent different approaches to such pro- grams in the following areas: reasons for introducing the program, benefit patterns, actual and relative size of payments, financing, and problem solving in working toward program goals. This article gives the historical picture of program developments from the beginning to the present and highlights changes in the approach to children’s allowances on the part of individual countries. It briefly examines the long-range effects on birth rates and notes that one of the most striking developments in these programs is the acceptance of general revenue financing in many Western countries, since it implies that the population in general has accepted a share of the responsibility’ of bringing up children.
17

Developments After World War I
Conditions arising from World War I had a strong effect on children’s allowances in both France and Germany. Allowances in France re- ceived a boost from such war-related conditions as severe manpower losses and rapid increases in the cost of living. Because inflation and labor shortages exerted pressure for ever-higher wages, more and more employers turned to children’s allowances-a fringe benefit for workers with families-as an alternative to more expensive wage increases for all. Until the end of the war, employers themselves had paid allowances directly to their employees. In a move to streamline the administration of these fringe benefits and dis- tribute the cost burden, the first local “equaliza- tion funds” were established and financed by employer groups in 1918, disbursing allowances to eligible employees.
In Germany, on the other hand, economic con- ditions immediately following World War I steadily deteriorated, and virtually all benefit funds were wiped out during the inflationary period of the 1920’s. There, too, the tendency at first was to regard children’s allowances as an alternative to higher wages, though not for the same reason as in France. The program called for depositing the contributions from employers and the self -employed in funds established within each occupational group. It attempted to minimize the economic advantage enjoyed by single persons or married persons without children in disposing of their income.*
The birth rate probZeem.-During the 1920’s and 1930’s, French lawmakers, concerned about lag- ging birthrates, believed that a system of chil- dren’s allowances would serve as a convenient vehicle to reverse this situation. It has been argued in France that the children’s allowances system for wage earners in industry, made compulsory by 1932 legislation, was based on a need to achieve equality among wage earners3 Even then, how- ever, the French Government remained disturbed
2 Ubereich t tiber die eoziale Sicherung in der Bunderr- republik Deutechlnnd, der Bundesminister fiir Arbeit und Sozialordnung, January 1967, pages 113-114.
3 Nicole Questiaux, “Family Allowances in France,” Children’8 Allowance8 und the Econbmic Welfare of Chil- dren, Citizen’s Committee for Children of New York, Inc., 1868.
about both the wartime losses and the continually declining birth rate. This situation led to the general application of children’s allowances as a demographic tool through the Family Code in 1939.
In the United Kingdom and Sweden, similar concern over lagging or falling birth rates has been reflected in debates extending back to the mid-1920’s and the 1930’s. Among the British, proposals for a children’s allowances program to remedy their population problem were well sup- ported, but the economic and political ’ climate preceding World War II prevented specific action. In Sweden, prolonged debates extending into the period of World War II likewise pre- vented early acceptance.
The change toward a population policy ap- proach was also briefly evident in Germany where the National Socialist regime launched a chil- dren’s allowances program in 1935 with the specific goal of increasing the birth rate.
The humanitarian approach.-During the late 1930’s and early war years, demographic consid- erations in the United Kingdom and Sweden were noticeably pushed aside in favor of a greater con- cern for the welfare of children and their families. In Sweden this concern, due in no small part to the participation of such social scientists as the Myrdals in public debates, was to produce after the war an allowances program that looked pri- marily to the welfare of families.’
In the United Kingdom, a similar trend was revealed in three important documents that ap- peared during JVorld War II: A 1942 memoran- dum by the Chancellor of the Exchequer sum- marizing the main points brought out by the supporters of children’s allowances ; the Beveridge Report, published in November 1942 ; and a white paper issued in September 1944.
One point in the memorandum dealt with child malnutrition and what a children’s allowances program’ might do to lessen this risk. Another point focused on compensation to large families to combat increases in living costs. A variation of the negative income tax was also advanced. To help poor families, it was suggested that parents with incomes too low to be taxable should receive benefits similar to the tax allowances extended to the well-to-do. Two obstacles blocked the way for this proposal : (1) The government did not
10 SOCIAL SECURITY
favor a means test and (2) a program based on income tax assessment was considered too difficult to administer. Finally, the argument was made that children’s allowances might also encourage parenthood and counteract the declining birth rate.
Children’s allowances, preferably financed through general revenues, were regarded by Sir William Beveridge as a necessary part of a com- prehensive social security system. He felt that without these benefits no adequate protection could be provided to large families when earnings were interrupted. He believed, on the other hand, that in general wages were sufficient to provide for a one-child family and thus recommended against children’s allowances for the first child. He wanted to abolish the means test for economic as well as humanitarian reasons: In a means- tested program, administrative costs would be large enough to make overall savings negligible, and eliminating income as a basis for eligibility would remove the stigma of a means test.
The White Paper of September 1944 explicitly stated that the children’s allowances program was intended to contribute to the needs of families with children, not to provide full maintenance for each child. Thus, the recommended level of allowances was considerably lower than that esti- mated by Beveridge as necessary for meeting sub- sistence needs. As in the Beveridge proposals, the first child in a family was to be exempt, but the allowances were to be supplemented by free meals and milk for all school children.
The Family Allowances Act, adopted in June 1945, incorporated proposals from all three sources-including ineligibilty of the first child, universality, and general revenue financing. The program of free school meals never became operative.
Developments After World War II
Canada.-The publication of the Beveridge Report in 1942 evoked much interest in Canada and resulted in the appearance of a Canadian version (the Marsh Report) the following year. A family allowance law became effective July 1, 1945. The original broad objective of the Cana- dian program was to help correct the imbalance
between family income and family need and to make an investment in the nation’s children. The program aimed at a redistribution of income in favor of low-income families and regions.
Yet views on what children’s allowances might accomplish differed widely. The Canadian Na- tional Labor Board, for example, was impressed with the program as an alternative to raising the general level of wages (reminiscent of the early French and German programs) and gave its sup- port on that basis. To counter the severe economic conditions foreseen for the postwar years, chil- dren’s allowances were expected to make two re- lated contributions: to increase aggregate de- mand and help in maintaining high employment and income levels. Under this interpretation, the program would channel significant amounts into the spending stream by increasing the purchasing power of the needy. It would, in addition, tend to stabilize purchasing power since payments would be continuous and nonseasonal. And children’s allowances paid during periods of unemployment and illness would help to ensure a steady income for social insurance and assistance recipients with large families. Finally, the allowances would aid employment by contributing to a higher level of aggregate demand.
Meanwhile, social objectives of the program were discussed in terms similar to the Swedish concept of social rights: The burden of raising the next generation ought to be shared by the population in general instead of being borne by a small segment of the working population.*
3%znce.-Children’s allowances were included in a comprehensive social security plan in 1946. Interest in these allowances as a demographic tool has been maintained, however, throughout the post-World War II era, and efforts of the French Government to influence the birth rate through children’s allowances have continued to the present. According to the Minister of Social Affairs, for example, the express aim of the 1969 increases in children’s allowances was to halt the
4 During the debate in the House of Commons preced- ing the adoption of the children’s allowances program, it was pointed out that S4 percent of all Canadian children under age 18 were dependent on only 19 percent of the gainfully employed. See Joseph Willard, “Family Allow- ances in Canada,” in Children’s .&ZOwU?xe8 and the Em- nomio WeZfare oi Chid&-en, Citizen’s Committee for Chil- dren of New York, Inc., 196S.
BULLETIN, MAY 1972 19

declining birth rate. That increase was regarded as a first step in a program to encourage popula- tion growth, as the birth rate had dropped from 18.1 per 1,000 in 1964 to 16.8 per 1,000 in 1967 and was expected to range around 16.6-16.8 per 1,000 in 1968.
Germany, Federal Republic.--In its method of financing and its humanitarian approach, the children’s allowances program introduced in the Federal Republic (West Germany) in 1954 re- sembled the original German program set up after World War I. It was to be funded by pri- vate means and-since it was aimed at the largest (and presumably the most needy) families of those who worked in private industry-it was basically humanitarian in concept. The benefits, together with tax exemptions, were intended to cover only part of the cost of child support. Ac- cording to this reasoning, German tax exemptions would go far in covering the cost of rearing the first two children in the family and benefits would be provided only from the third child on.s Chil- dren’s allowances were thus looked upon as earn- ings supplements for families with heavy financial burdens. The extension of benefits in 1961 to the second child in low-income families with three or more children was consistent with this policy. Ten years after its introduction, however, the pro- gram had evolved toward a view similar to the British and Swedish, emphasizinng social rights, when the Federal Government in 1964 took over the burden of financing the entire program.
Sweden.-A system of tax deductions for chil- dren was abolished with the introduction of non- contributory children’s allowances on January 1, 1948. When the program became effective, the improvement in the standard of living for fami- lies with children was stressed. There was thus a national acknowledgement that the economic burden of raising children belonged to some ex- tent to society in general, not wholly to the in- dividual household. No basic change has been made in the program since its introduction. The benefit rates have been adjusted upward, however, and are now at a considerably higher level in terms of purchasing power than they were when the program began.
6 Klaus Steinmender, “Das Kindergeld,” in the series, SaziaZpoZitik in Deutschland (No. 30)) 1963.
United Kingdom.-Unlike Sweden, Britain still has a dual system of children’s allowances and tax deductions for children. Tax deductions be- come more significant as income rises, and for many families in the middle and upper income brackets the deductions are much more substan- tial than children’s allowances.
Less attention seems to have been paid to these allowances in the United Kingdom than in the other four countries studied. In the past, benefit rates were constant over long periods of time, and it is only rather recently that they have risen to a substantial degree, mainly perhaps in re- sponse to agitation by civic organizations such as the Child Poverty Action Group.
SIZE AND COMPOSITION OF BENEFITS
Structure and Eligibility Requirements
In the countries studied, the benefit structure of children’s allowances programs varies with social policy. Canada and Sweden pay allowances beginning with the first child (table 1). As noted earlier, the Canadian aim was to provide a family income supplement of general scope. In Sweden the universality of coverage, together with the view that the burden of raising a family should be shared, led to allowances beginning with the first child.
Other countries start allowances with the sec- ond, third, or fourth child. West Germany, for example, pays allowances beginning with the third child, with a means-tested benefit available for the second. Some systems have rates that rise with each additional child; others feature rates that decline as the number of children rises.
Benefits are generally paid up to school-leaving age. The basic age limit in the five countries studied ranges from age 14 in the United King- dom to age 17 in West Germany. The application of the limit may be deferred for further school- ing, apprenticeship, or vocational training-from 2 years (Canada) to 7 years (West Germany). Age may also play a role in benefit size. This factor is particularly important in Canada and France, as later comparisons of the relative amounts paid in each country make clear.
As table 1 shows, the last years in which allow-
20 SOCIAL SECURITY
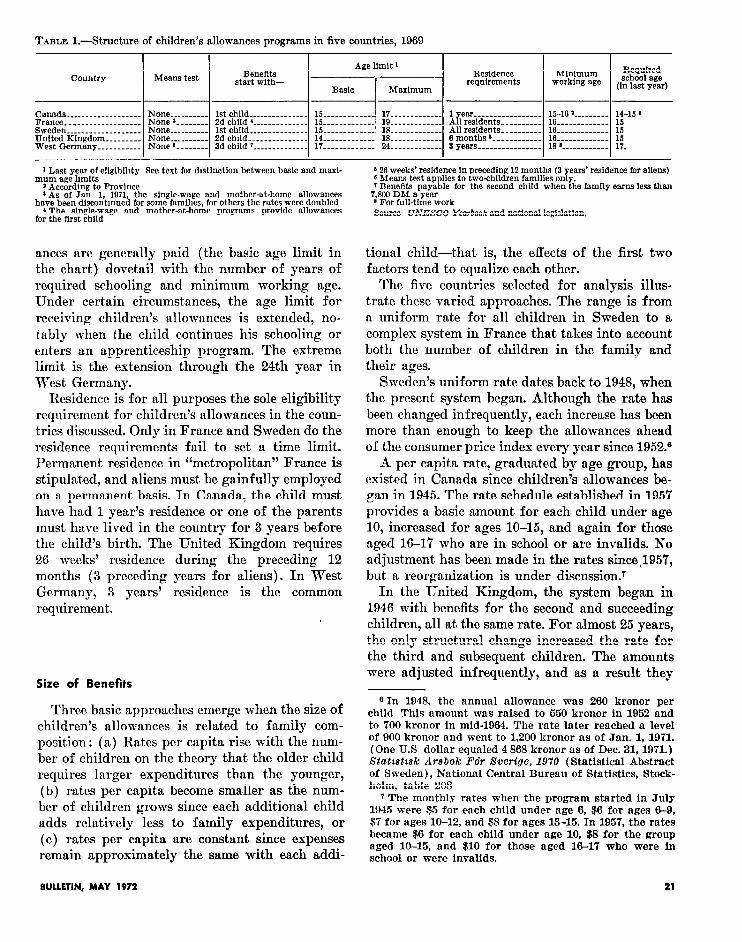
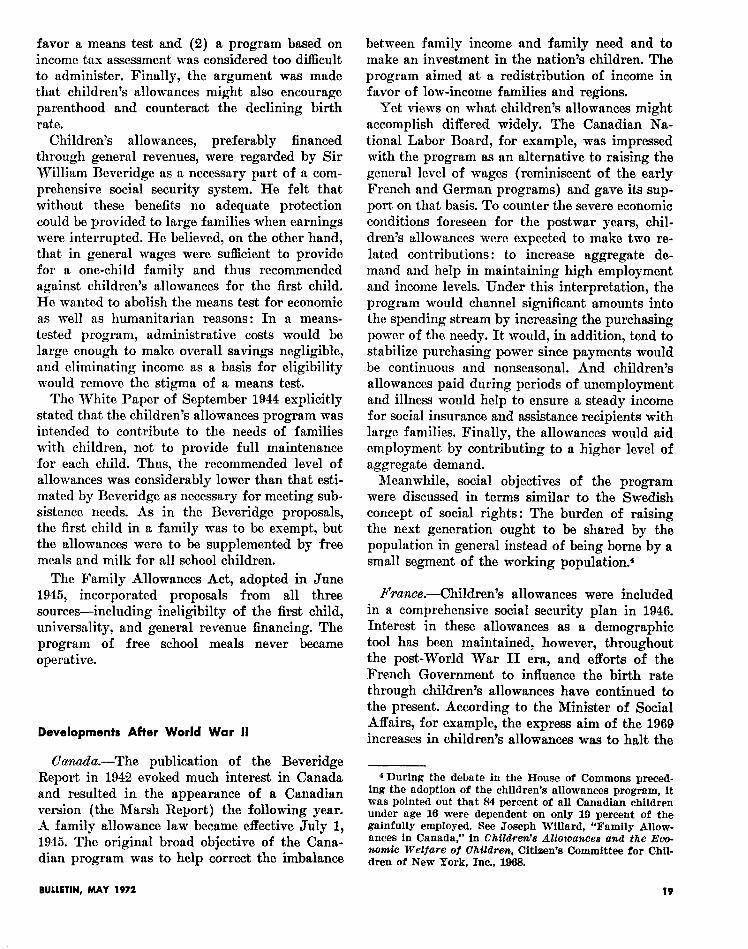
TABLE l.-Structure of children’s allowances programs in five countries, 1969
Country Means test BUEflt.3 start with-
Age limit 1 Residence
requirements Minimum Required
working age school age (In last year)
Canada ___________________ None.. ________ 1st child _______________ ear _________________ 15-16 3 _________ 14-15 z France ___________________ None * ________ 2d child 4 ______________ 15 _____________ Sweden ___________________ None---. ______ 1st child _______________ United Kingdom _________ None __________ 2d child _______________ 14 _____________ 18 _____________ 6 months s ____________ 16 _____________ 15 West C3ermeny ___________ None 6 ________ 3d child 7 ______________
1 Last year of eligIblhty See text for distinction between basic and maxi- mum age hmits
2 According to Province 1 As of Jan 1, 1971, the single-wage and mother-at-home allowances
have been discontmued for some famihes, for others the rates were doubled 4 The single-wage and mother-at-home programs provide allowances
for the flrst child
antes are generally paid (the basic age limit in the chart) dovetail with the number of years of required schooling and minimum working age. Under certain circumstances, the age limit for receiving children’s allowances is extended, no- tably when the child continues his schooling or enters an apprenticeship program. The extreme limit is the extension through the 24th year in West Germany.
Residence is for all purposes the sole eligibility requirement for children’s allowances in the coun- tries discussed. Only in France and Sweden do the residence requirements fail to set a time limit. Permanent residence in “metropolitan” France is stipulated, and aliens must be gainfully employed on a permanent basis. In Canada, the child must have had 1 year’s residence or one of the parents must have lived in the country for 3 years before the child’s birth. The United Kingdom requires 26 weeks’ residence during the preceding 12 months (3 preceding years for aliens). In West Germany, 3 years’ residence is the common requirement.
Size of Benefits
Three basic approaches emerge when the size of children’s allowances is related to family com- position : (a) Rates per capita rise with the num- ber of children on the theory that the older child requires larger expenditures than the younger, (b) rates per capita become smaller as the num- ber of children grows since each additional child adds relatively less to family expenditures, or (c) rates per capita are constant since expenses remain approximately the same with each addi-
s 26 weeks’ residence in preceding 12 months (3 years’ residence for aliens) 6 Means test applies to two-children familfes only. r Benefits payable for the second child when the family earns less than 7.8(M DM a year * For full-time work
6ource UNESCO Yearbook and national leglslstlon.
tional child-that is, the effects of the first two factors tend to equalize each other.
The five countries selected for analysis illus- trate these varied approaches. The range is from a uniform rate for all children in Sweden to a complex system in France that takes into account both the number of children in the family and their ages.
Sweden’s uniform rate dates back to 1948, when the present system began. Although the rate has been changed infrequently, each increase has been more than enough to keep the allowances ahead of the consumer price index every year since 1952.O
A per capita rate, graduated by age group, has existed in Canada since children’s allowances be- gan in 1945. The rate schedule established in 1957 provides a basic amount for each child under age 10, increased for ages 10-15, and again for those aged 16-17 who are in school or are invalids. No adjustment has been made in the rates since,1957, but a reorganization is under discussion.7
In the United Kingdom, the system began in 1946 with benefits for the second and succeeding children, all at the same rate. For almost 25 years, the only structural change increased the rate for the third and subsequent children. The amounts were adjusted infrequently, and as a result they
6 In 1948, the annual allowance was 260 kronor per child This amount was raised to 650 kronor in 1952 and to 700 kronor in mid-1964. The rate later reached a level of 900 kronor and went to 1,200 kronor as of Jan. 1, 1971. (One U.S dollar equaled 4 868 kronor as of Dec. 31, 1971.) Statzatzsk Arabolc Fdr Sverige, 1970 (Statistical Abstract of Sweden), Eationai Central Bureau of Statistics, Stock- holm, table 208
’ The monthly rates when the program started in July 1945 were $5 for each child under age 6, $6 for ages 6-9, $7 for ages 10-12, and $8 for ages 13-15. In 1957, the rates became $6 for each child under age 10, $8 for the group aged 10-15, and $10 for those aged 16-17 who were in school or were invalids.
BULLETIN, MAY 1972 21

often trailed the consumer price index for long periods of time. The price index, for example, climbed by about 70 percentage points during 1956-66 (with 1945 as a base year), while the allowances remained fixed. Subsequent increases in 1967 and 1969 have kept the allowances ahead of the rise in prices.8
In 1971, the United Kingdom introduced a family supplement program-in addition to its children’s allowances program-that is designed to aid workers at the lowest income level. The basic income level is $15 a week for a family with one child ; the level rises by $2 a week for each additional child up to a maximum of $25 per week with six or more children. When a family’s income is below the statutory minimum for its size, the Government makes up one-half the difference up to a maximum of g3.
In the program that emerged in West Germany after World War II, coverage started with the third child. In 1961, coverage was extended to the second child in families with yearly incomes below 7,200 Deutsche marks with this part of the program financed from general Federal revenue. Under 1964 legislation the Federal Government assumed the entire burden of financing the pro- gram. The income limit for the two-child family was raised to 7,80ODM, and an increasing benefit rate was made applicable for the third to the fifth chi1d.O In 1965, families with three or more chil- dren became eligible for the lower-rate, second- child allowance, regardless of the amount of the family’s income.
The French children’s allowances program- considerably more complex than that of most countries-has three main components : basic children’s allowances, single-wage allowances (saZaire ur@ue for wage or salary earners), and mother-at-home allowances (m&e au foyer for the
8 The Family Allowances Act of 1945 (effective August 1946) provided 5 shillings per child a week, starting with the second child-in the family. The amount was increased to 8s. in 1952 and to 10s for the third and subsequent children in 1956. In 1967, the benetlts were raised to 15s. for the second and 17s. for the third and subsequent chil- dren; and in late 1969 they were increased to 18s. and 2Os., respectively. (As of December 31, 1971, one U.S. dollar equaled 3.916 pounds.)
Q In 1961, monthly rates had been 25DM for the second child (when eligible) and 40DM for the third and sub- sequent children. The rates were increased in 1964 to 60, 60, and 70DM for the third, fourth, and Afth and each sebsequent child, respectively; the rate for the second child remained unchanged. (As of December 31, 1971, one U.S. dollar equaled 3 260 Deutsche marks )
self-employed). The nonbasic allowances are both designed to encourage mothers to stay home and aid in their children’s upb;inging. Originally re- lated to regional monthly average wages, the basic allowances were later made a percentage of the hourly minimum wage of manual workers in the metals industry. This amount has been adjusted periodically by decree. All three types of benefits are fixed for five cost-of-living zones in France.l”
Under the French basic program, benefits start with the second child at the rate of 22 percent of the base wage. The rate is 37 percent for the third and fourth children and drops to 33 percent for the fifth and subsequent chi1dren.l’ These rates, in turn, are increased by 9 percent of the base wage when the child reaches age 10 and by 16 per- cent at age 16, except for the two youngest chil- dren in the family.12
In 1969, France discontinued the practice, be- gun in 1951, of granting young childless couples an allowance under the single salary program. Instead, the allowance to children under age 2 was raised to 50 percent of the base wage (97.25 francs in 1969) under both the single-wage and mother-at-home programs, and having a young child was thus more attractive.13 Since January 1, 1971, these allowances have been abolished for families with monthly income above 5,550 francs and the rates have been doubled for families with
10 The base wage for basic allowances in Paris (the highest cost-of-living area) is now 377 francs a month, that for the single-wage or mother-at-home allowances, 194 50 francs. (On December 31, 1971, one U.S dollar equaled 5 22 francs )
l1 In the basic program, a 1953 law established the rate of 22 percent of the base wage for the second child and 33 percent for the third and later children, increased from the previous rates of 20 percent and 30 percent, respec- tively. For changes in benefit levels and laws, see Jean- Jacques Dupeyroux, SBcurit~? Soctale (3d edition), Dalloz, 1969, pages 455 and 481. For pre-1954 rates, see also “Le dgime gbnbrnl de la 8bcuritP so&ale” in the series La documentation frangabe; note8 et etude8 documentaires, September 1949. For history of changes in the mother-at- home and single-wage allowances, see Journal Oflciel de la Rdpubligue Franqahe, Dec. 12, 1956, page 11872.
l2 Journal Oflciel . . . Aug. 8, 1957, page 7811. Law of Aug. 7, 1957.
l3 A family is limited to total allowances of 50 percent of the base amount under either of the two programs, re- gardless of the number of children in the family. For children aged 2 or older, the rates are: Under the single- wage program, 20 percent of the base for one child, 40 percent for two children, and 50 percent for three or more children; under the mother-at-home program, 10 percent for two dependent children, with an increase of 10 per- centage points for each additional child, and up to 50 percent for six or more children.
SOCIAL SECURITY

monthly income below 1,300 francs. The allowance rates remain unchanged between these two income limits. With average monthly earnings approxi- mating 950 francs, in pract,ice the single-wage and mother-at-home allowances have doubled for most families and the upper limitation has become al- most academic.
RELATIONSHIP TO EARNINGS AND OTHER MEASURES
Because of variations in currency values, a multicountry assessment of the relative size of children’s allowances must be made in terms com- mon to all. In this study, therefore, comparisons have been developed on the basis of individual in- come, consumer prices, and the gross national product (GNP) of each country. Comparing al- lowances with average monthly earnings in manu- facturing provides a measure of the benefit paid to the individual family. Even when comparable figures are thus arrived at, the method of financ- ing may be important because of possible income redistribution effects. Relating benefits to the GNP measures the relative cost to each country, and comparison with the consumer price index, of course, indicates whether the allowances have re- tained their relative value.
Average Earnings
Table 2 presents for each of the five countries the relationship between children’s allowances (in families with l-5 children) and monthly average earnings in manufacturing. For simplification, the allowances for Canada and France are shown at the minimum levels and increases based on age are omitted. The ratios of allowances to average earn- ings range from 1.3 percent for one Canadian child to 50.8 percent for five children in France (about 61.5 percent when the most advantageous age combination is used).
Generally, France has the “highest” allowances under any family combination (except that, for a family with one child aged 2 or blder, the Swedish allowance is slightly higher). Sweden ranks next to France in all other family combinations indi-
TABLE 2.-Children’s allowances as ercent of average monthly earnings in manufacturing, i y size of family, five countries, 1969
country Number of children
One ) Two 1 Three 1 Four 1 Five
Canada 1_____________ 13 France 2 ______________ (3 e2: 5: :
Sweden ’ ______________ 57 11 4 United Kingdom 6 ____ __________ 7: 8” 2
14 6 t”B t West Qermany 6 ______ __________ 12 0 19 7
1 Percentages relate to beneflts for children under age 10 and are based on average weekly wages in January-June 1959. For children aged E-15, add 0 4 percentage points, for children aged 16-17, add 0 9 percentage points
2 Percentages overstated to the extent that 1969 benefit rates are applied to 1968 average earnmgs For families with more than 1 child add 10 8 if 1 of more of the chddren are under age 2.8 6 if there are 2 dependent children aged 2 or older, and 10 8 if there are 3 or more dependent children regardless of age In addition, add 3 6 for each dependent child aged 10-14 and 6 0 for each dependent child aged 15 or older
8 Percentage is 10 8 for child under age 2, it is 4 3 for child aged 2 or older 4 Percentages overstated to the extent that expected 1970 beneflt rates are
applied to average earnings in January-June 1969 6 Based on average weekly earnings as reported in April 1969 Income data
for men and women are reported separately, they have therefore been weighted on the basis of the number of men and women reported in total employment to obtain comparability with data for other countries
6 Percentages overstated to the extent that 1969 beneflt rates are applied to 1968 average earnings
7 Second child eligible for basic allowance if family earnings are less than 7,SOODhI a year, otherwise, allowances start with third child.
Source Canada--The Labour &zrcttc, December 1969, table C-6, p 771: France and Germany-Bureau of Labor Statistics, U 6 Department of Labcr, Sweden-Allmiin M&ad8statt8tikk, 1968-9~ United Kingdom- Monthly Digest of Stnttatrcs, December 1969, table 15. p 17, and Emplogmeti and Productmty &We, January 1970, table 122, p. 76
cated in table 2. With respect to families with two, three, and four children, the United Kingdom ranks behind France and Sweden but ahead of West Germany, although the two rates converge as the family grows and draw even with five children in the family. Canada ranks last. Note that the gap between that country and the others grows with the size of the family, since Canadian allowances are increased at a much slower rate. Although Sweden’s rate is considerably higher than the United Kingdom’s or West Germany’s through the whole family range, these countries draw closer as family size increases. With three children, the Swedish rate is almost twice as high as that of the United Kingdom ; with five children it is only 50 percent larger.
, When the age factor is considered with the number of children, the French program stands out even *more than the figures in the table indicate.14 In a French family with three children aged 8, 10, and 12, children’s allowances would amount to 40.8 percent of average earnings in
I4 For a different approach, used in a 1967 study re- lating the significance of family allowances in terms of average total income to the size of the family, see Les Condztions de Vie de8 Families, Paris, March 1967. Lack of data prevent a similar approach for an intercountry study.
BULLETIN, MAY 1972 22
manufacturing-that is, the basic rate of 22.8 percent plus 10.8 percent for three children plus an additional 3.6 percent for each of the two children in the lo-14 age group--or more than twice as much as the next highest country, Sweden.
Other Measures
Table 3 provides a comparison of the expendi- tures for children’s allowances in terms of both total social security expenditures and the GNP in each of the five countries under consideration. The definitions set forth in a 1967 study15 by the International Labor Organization (ILO) were used to update the expenditures for 1966, 1967, and 1968 as far as possible.
In 1968, the results relate favorably to the data in table 2. France is well ahead of the other coun- tries with about one-fourth of all social security outlays going to children’s allowances. Except for Canada, the other countries rank in the same order as they did in relation to average earnings: Sweden, the United Kingdom, and West Germany.
For Canada, the proportion of total social security expenditures directed toward children’s allowances-9.3 percent-indicates relatively low total expenditures rather than high children’s allowances. This point is borne out by the GNP figure, which is considerably lower for Canada than for the other countries. Still, expenditures have risen substantially with the maturing of the Canada and Quebec pension plans and the lower- ing of the retirement age year by year.
Except for the United Kingdom, national out- lays for children’s allowances account for a de- clining proportion of total social security expendi- tures as defined and calculated by the ILO. These allowances have been increasing at a slower rate than other social security expenditures. With the ad hoc method of adjustment, the allowances have tended to remain at a given benefit level longer than other social security benefits, which are often tied to a consumer price index or an earnings ratio.la And rapid expansion in other social security programs may have adversely affected
l5 International Labor Organization, The Cost of BociaZ fJecurzty, Geneva, 1967.
16 In Canada, Sweden, the United Kingdom, and West Germany, the rates of children’s allowances are de- termined by legislation.
TABLE 3.-Expenditures for children’s allowances as a percent of total social security expenditures and of gross natlonal product, five countries, 1966-68
I Expenditures for children’s allowances
As percent of total social As percent of gross security expenditures f national product
1966 ( 1997 / 1968 1966
I I
1967 1968
I I I I I I
1 Social security expenditures include administrative expendhres but generally exclude those for government employee programs, lndustrlsl oc- cupational pension plans, and beneAts under prwate medical care insurance plans The data used here, except as otherwise noted, are de5ned as ln The Cost of Socznl Secarrty (International Labor Organization), 1997
r Children’s allowances Include family allowances and youth allowances but exclude the schooling allowances of the Provmce of Quebec Socral security expenditures exclude housing, education, and agricultural price support programs
s Children’s allowances for 1997 estimated
Source Data for chrldren’s allowances Canada-Department of National Health and Welfare, Annual Report, Fmal Year Endmq hfwch St, 1966, pp 127-128, France-Minlstere de 1’Economle et des Flnance~, Stattsttguea et Etude8 Fznanet~res, pp 496-417. Sweden-1966 from &era2 Secwttg rn the Nordzc Countries, fW6 (Statlstlcal Reports of the Nordic Countnes, No 15, Copenhagen, X269), and 1968 from the Swedlsb Embassy, WashIngton. D C , United Kingdom-Annaa Abstract of Sfatrsttc8, 1969. West Germany -Der Bundesminister f(lr Arbeit und Soslalordnung, Arbezts und Sorml- atatutwche MXte~Zunqen, July 1969, pp 2U9-211
Data for aoctal securtty czpendztures Canada-Department of Natronal Health and Welfare. Soera Securtty In Canada, 1969, p 77. France-same as children’s allowances, Sweden-1996 and 1967 from Soctal-iVytt, No 6. X%9, p 17, and 1868 from the Swedish Embassy In Washington, D C.; United Kingdom-Annual Abatracf 01 Statutm, 1969, West Cermany- same as children’s allowances
Data for gross nattonal product International Monetary Fund, Inter- nattonal Fmaneral Stotzatza, March 1970
the availability of funds for children’s allowances. In recent years, the United Kingdom’s renewed interest in child welfare caused a notable reversal in its spending share for children’s allowances. In 1968, payments of children’s allowances as a percentage of total social security expenditures rose markedly, reflecting the first benefit increase in such allowances since 1956.
As table 4 shows, the consumer price index out- paced the benefit rate index throughout the entire period in both Canada and France, before 1964 in West Germany, and before 1967 in the United Kingdom. Only in Sweden has the rate index been well ahead of the consumer price index since the early days of the program.
If the trend for this group of countries is indi- cative of developments in other countries with children’s allowances, benefit levels in most pro- grams have trailed the donsumer price index despite periodic adjustments. Relating children’s allowances to earnings would reveal an even more unfavorable picture, since in most of the advanced countries wages have increased more rapidly than prices.
24 SOCIAL SECURITY

TABLE 4.-Changes in children’s allowances rates and the consumer price index, five countries, by year of change
Year of change
Canada All children ________________________ Children under age 6 _______________ Children aged 6-Q 2 _________________ Children aged 10-12 ________________ Children aged 13-17 2 _______________
France France I I
All covered children. _______________ All covered children. _______________
Sweden Sweden I I
All covered children ________________ All covered children ________________
i i Unlted Kingdom Unlted Kingdom
Second child. ______________________ second child. ______________________
Third and additions1 children.-.-.. II I
West Germany All covered children ________________ Second child _______________________ Third child ________________________ Fourth child ______________ _ ________ Fifth and additional children-m.m..
1845 1957
E 1957 1970
:iz 1951 1957
E 1962
:E
!i!!
1949
El
E
1946 1952 1955 1987 1970
11 lQ67 1970
E IQ64 IQ64 1964 1970
- Index of allowance
rates
* Indexes have been recomputed to conform to base years 9 No change for any children.
FINANCING AND TAX POLICIES
Financing
As a rule, children’s allowances programs en- compassing the entire population are financed by the national government-that is, they are non- contributory.l’ Programs covering specific groups of the population, on the other hand, are com- monly contributory. France provides a third method of financing-that is, in some instances, contributions from one group finance the coverage of another (the agricultural fund is subsidized by the general fund). No country has a contributory children’s allowances program that covers the
17 The ‘programs 03 Finland, Luxembourg, and the Netherlands are among the exceptions to this rule. The employer also contributes to the allowances in these coun- tries. See Social Security Programe Throughout the World, 197f, R&search Report No. 40, Office of Research and Statistics, Social Security AdministratIon, 1972.
BULLETIN, MAY 1972 25
entire population. Where these programs exist, they cover only certain groups and tend to be fragmented with respect to both financing and administration. One advantage of general revenue financing is simplified administration. Further- more, the cost of the program is more easily predictable through demographic projections. These considerations undoubtedly contributed to the adoption of general revenue financing by many Western countries since World War II.
These patterns are evident for the countries under consideration. Children’s allowances pro- grams in Canada, Sweden, and the United King- dom are universal and financed through the na- tional budget. West Germany has separate pro- grams for public employees and for all other resi- dents, but both programs are similarly financed through general revenue.l*
In France, programs covering the eiployed and the self-employed are separate. Benefits for wage earners derive from employer contributions exclusively. Contributions by the self -eniployed are applied only toward the benefits to which this group is entitled. In 1968, employer contributions amounted to 13.5 percent of payroll. The self- employed contribute approximately 4 percent of income, according to an occupational scale. Maximum earnin& for contribution purposes were 1,200F a month. By comparison, average earnings in manufacturing amounted to approximately 855F a month.‘O
France has, ,in addition, separate occupational programs that cover the agricultural sector, pub- lic utilities, and civil servants. Under the law, the State and public authorities are considered as em- ployers and bear the cost bf family benefits for their employees .20 The agricultural sector, usually associated with’ low incomes and large families, has historically been unable to provide sufficient funds to support its family allowances program and has relied on subsidies by the national government.
I8 The public employee program provides for WDM per child a month when other income in support of one or more children does not exceed 125DM per month. See footnote 9 for rates under the regular children’s allow- ances program, where a special provision allows 25DM a month for the second child when monthly family earn- ings are below 650DM.
I0 In early 1971, employers contributed 10.5 percent of payroll up to 1,500F a month per employee.
?O ILO, LegisZatZue Series, France 10 (Part I, section 4, and Part IV, section 29).
lax Deductions
Tax exemptions for children are sometimes con- sidered a form of children’s allowances because they either add to available income for rearing a family by reducing the income tax or, for low earners with large families, eliminate any tax liability. This factor perhaps influenced the Swedish decision to eliminate tax exemptions for children when children’s allowances were intro- duced in 1948. In the other four countries studied here children’s allowances and tax exemptions exist side by side.
France uses a somewhat indirect method of tax deduction. The taxable income may be divided between all members of the family (with two children counted as one adult). The tax is then computed for each individual share and added in computing the total tax liability of the family. Since tax rates are progressive, taxes presumably become smaller as the individual share diminishes, and the result is smaller total tax payments for the family.
The Canadian law provides for a deduction of $300 for each child.*’ For a family with three children this would be equivalent to pay of an average worker in manufacturing for 71/s weeks.
The West German tax schedule has a deduction of 1,200DM for the first child, 1,680DM for the second, and 1,800DM for the third and each sub- sequent child, subject to the age limits for grant- ing children’s allowances.22 The deduction for three children would represent the pay of the average worker in manufacturing for about 18 WWkS.
In the United Kingdom, the tax deduction varies with the child’s age: $115 for each child under 11, ?Z140 from 11 through 16, and $165 for a child undergoing full-time education. This deduction can be claimed even when the student receives a full-cost maintenance grant from the government.23 The deduction for a family with three children would equal about 15 weeks’ pay for the average worker in manufacturing. Thus,
*l The Department of National Health and Wetfare in Relation to Poverty, Ottawa, 1970, pages 31-32.
22 These data were provided by the Embassy of the Federal Republic of Germany, Washington, D.C.
23 Tony Lynes, “Family Allowances in Great Britain,” in Chtldren’e Allowances and the Economic Welfare of ChGdren, Citizen’s Committee for Children of New York, Inc., 1963, pages 94-95.
for the average middle-class family, the value of tax deductions is considerably higher than the value of the children’s allowances. In the United Kingdom, alone among the four countries studied, children’s allowances are treated as taxable in- come. A part of the allowance is thereby recovered through the tax system.
IMPACT ON BIRTH RATES
There is no agreement among social scientists or policymakers as to whether children’s allow- ances programs have any effect on birth rates. The available evidence shows no clear relationship.
Chart 1 traces birth rates during 1948-69 in the five countries studied and the United States. Two general characteristics may be noted. One is the similarity in the development of birth rates in Canada and the United States despite the absence of children’s allowances in the latter country. The other is the contrast between these two countries as a group and the European coun- tries considered collectively.
In both Canada and the United States, in- creased birth rates in the late 1940’s and early 1950’s were followed by slight declines during the next 5 years and by sharper declines during the 1960 decade. A three-point spread maintained through the 1950’s started to narrow after 1960 as the Canadian rate decreased more rapidly. By 1969 the two rates had converged.
In the European countries, all rates were fall- ing during the early 1950’s. Between 1955 and 1960, however, this trend reversed itself in West Germany and the United Kingdom. The upward movement continued into the early 1960’s. Then the Swedish rate also turned up, and the French rate leveled off. Since 1965, rates for all four countries have been declining.
In analyzing the data for the individual coun- tries, one is struck by a steep increase in the Canadian birth rate during 1945-47 that might easily be attributed to the introduction of chil- dren’s allowances in 1945. Closer examination reveals that the rate had been increasing since the late 1930’s. A more satisfactory explanation is that the 1945-47 increases were the continua- tion of a-prevailing trend, buoyed by the military demobilization and high postwar expectations.
26 SOCIAL SECURITY
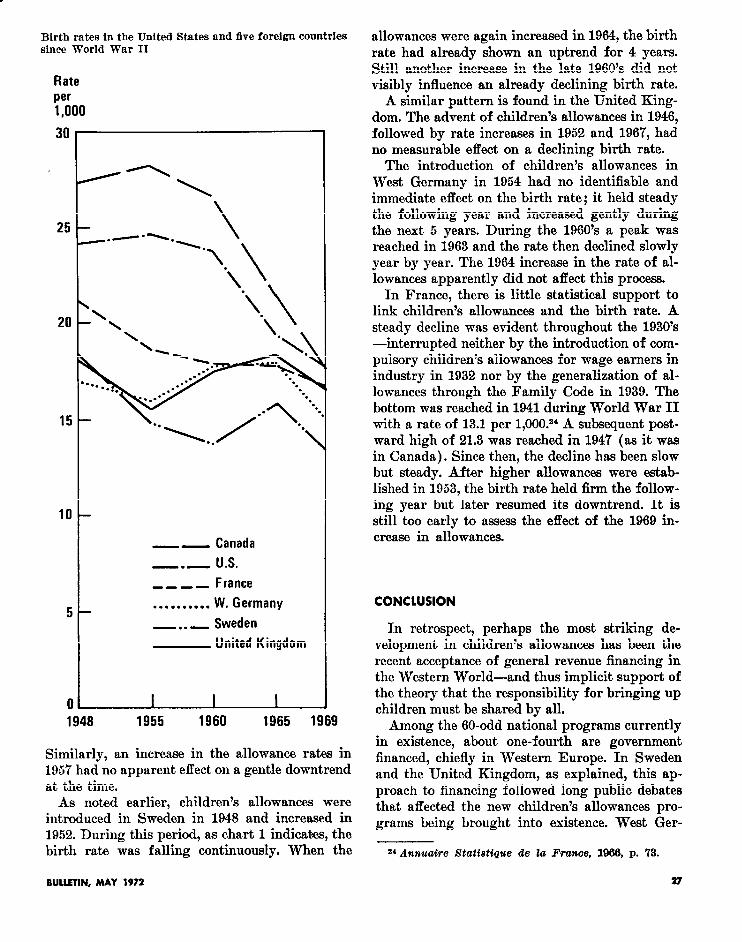
Birth rates in the United States and five foreign countries since World War II
Rate per 1,000
30
25
10
5
-- Canada
-.- U.S.
---- France
. . . . . . . . . . W. Germany
-..- Sweden
United Kingdom
0 1948 1955 1960 1965 1969
Similarly, an increase in the allowance rates in 1957 had no apparent effect on a gentle downtrend at the time.
As noted earlier, children’s allowances were introduced in Sweden in 1948 and increased in 1952. During this period, as chart 1 indicates, the birth rate was falling continuously. When the
BULLETIN, MAY 1972 27
allowances were again increased in 1964, the birth rate had already shown an uptrend for 4 years. Still another increase in the late 1960’s did not visibly influence an already declining birth rate.
A similar pattern is found in the United King- dom. The advent of children’s allowances in 1946, followed by rate increases in 1952 and 196’7, had no measurable effect on a declining birth rate.
The introduction of children’s allowances in West Germany in 1954 had no identifiable and immediate effect on the birth rate; it held steady the following year and increased gently during the next 5 years. During the 1960’s a peak was reached in 1963 and the rate then declined slowly year by year. The 1964 increase in the rate of al- lowances apparently did not affect this process.
In France, there is little statistical support to link children’s allowances and the birth rate. A steady decline was evident throughout the 1930’s -interrupted neither by the introduction of com- pulsory children’s allowances for wage earners in industry in 1932 nor by the generalization of al- lowances through the Family Code in 1939. The bottom was reached in 1941 during World War II with a rate of 13.1 per l,OOO.*” A subsequent post- ward high of 21.3 was reached in 1947 (as it was in Canada). Since then, the decline has been slow but steady. After higher allowances were estab- lished in 1953, the birth rate held firm the follow- ing year but later resumed its downtrend. It is still too early to assess the effect of the 1969 in- crease in allowances.
CONCLUSION
In retrospect, perhaps the most striking de- velopment in children’s allowances has been the recent acceptance of general revenue financing in the Western World-and thus implicit support of the theory that the responsibility for bringing up children must be shared by all.
Among the 60-odd national programs currently in existence, about one-fourth are government financed, chiefly in Western Europe. In Sweden and the United Kingdom, as explained, this ap- proach to financing followed long public debates that affected the new children’s allowances pro- grams being brought into existence. West Ger-
24 Annuaire b’tatietique de Za France, 1960, p. 73.
many was the only country to make a transition An examination of patterns in the five coun- from financing by employers to general revenue tries studied indicates that long-range trends in financing in an already esisting program. birth rates have not been affected by either the France, with programs predating World War II, introduction of children’s allowances or increases has retained employer financing. in allowance rates in existing programs.
Notes and Brief Reports Effect of Changing Technology on Hospital Costs*
For many years the hospital industry has been introducing new and improved medical services. The introduction of these services has been re- sponsible for a large part of the increase in hos- pital care costs. Such services arise largely from the availability of the new medical technology, procedures, and techniques. A simple example is the use of new and expensive drugs and medica- tions. A more dramatic example is the increased use of open-heart surgery, which can require specially equipped operating rooms and addi- tional supplies and materials, as well as skilled personnel for the surgical team. The result is growth in capital expenditures, operating es- penses, and wage payments.
Additional &vices-and subsequent increased expense&-may also involve services not directly related to medical care such as construction of new parking lots, renovation of waiting rooms, improvement in the quality of food served, and the installation of televisions and telephones.
The labor and capital involved in providing new and improved services, referred to .by eco- nomists as additional inputs (laboF and nqn- labor), repres.$nt added costs “to the hospitals This not,++c$es the rise in hospital cost by isolat- ing those: increases attributable to the additional inputs from the increases necessary solely to main- tain a constant level of hospital services. The latter increases are the raises in hospital employee wages and the growth in prices paid for other goods and services.
Because the data on inputs (and on prices and wages) are shown on the basis of co@ per patient day, they would not include costs attributable to
l Prepared by Saul Waldman, Divhdon of Health In- surance Studies. I a
28
additional hospital bed construction and utiliza- tion. The capital costs of new hospital beds are, however, usually higher than those of the older beds, even after adjustment for increased price levels, because the new beds are accompanied by more elaborate and costly equipment. This differ- ence in the average cost of old and new beds, after price adjustment, represents “new and improved services” and is therefore included in increased inputs. These additional inputs should be included in cost per patient day because they raise the average depreciation per bed (and per patient) that is a part of patient-day costs.
The rise in costs per patient day in short-term community hospitals, by source of increase, is shown in tables 2 and 3 for selected periods from 1951 (the first year for which data were avail- able) through 1970. (Table 1 provides the basic data on hospital costs.) Table 2 indicates the dollar amounts of increase in the various factors and their percentage distribution. In table 3, which gives the percentage increase for the vari- ous factors, each factor is shown separately; the total increase for wages and prices and the total for labor and nonlab& inputs represent the weighted average of the component factors.
INCREASES IN HOSPlTAL COSTS
TFe period 1966-70 was selected to show the in- creases in hospital costs since the Medicare and Medicaid programs began. It is clear that, during this period, hospitals greatly increased their in- puts, with the rise for nonlabor components especi&lly notable. Wages and prices rose at a substantially greater rate than in each of the earlier periods shown. This growth reflects in part the recent inflationary trends and the “catch up” raises granted to hospital employees (whose wage rates have generally lagged behind those prevailing in the economy).
The periods 1955-60 and 1960-65 show more moderate increases in inputs, although the rate of
SOCIAL SECURITY