Embed Size (px)
Citation preview
Traffic Safety Basic Facts 2013 - Main Figures
Traffic Safety Basic Facts 2015 Children (Aged <15)
Children
Traffic Safety Basic Facts 2015

Traffic Safety Basic Facts 2015 - Children
- 2 -
About 640 children died in road
accidents in 2013 in EU countries.
General In this Basic Fact Sheet, ‘children’ are defined as those who are aged below 15 years old. The age at which people are allowed to drive a motor vehicle varies across the EU, but 14 year olds appear, on the whole, to fit into this group rather than with ‘young people’. Children tend to be thought of as innocent victims of road accidents more often than is the case for adults. Figure 1 shows the number of road fatalities in 2013 by single year of age, calculated across the EU member states with CARE data (listed in Table 1). It also shows the number of road fatalities per million population. The figure shows that 14 is the age at which the risk of death in a road accident begins to rise steeply. Figure 1: Number of road fatalities and rates per million population by age and gender, EU, 2013 or latest available year
Source: CARE database (EUROSTAT for population data), data available in May 2015
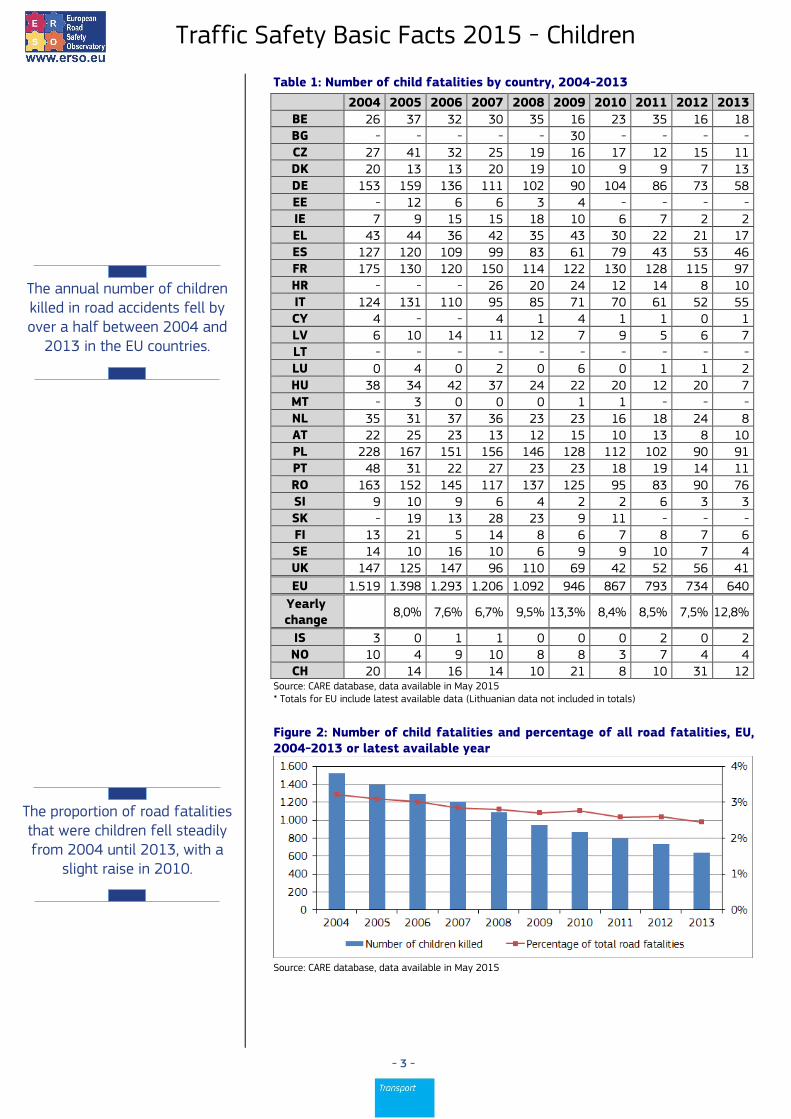
Table 1 presents the number of children killed in each country for the time period 2004-2013, whilst the EU total is presented in Figure 2. The number of children killed in road accidents fell from 1.519 in 2004 to 640 in 2013, a fall of 58%.
Traffic Safety Basic Facts 2015 - Children
- 3 -
The annual number of children killed in road accidents fell by over a half between 2004 and
2013 in the EU countries.
The proportion of road fatalities that were children fell steadily from 2004 until 2013, with a
slight raise in 2010.
Table 1: Number of child fatalities by country, 2004-2013
Source: CARE database, data available in May 2015 * Totals for EU include latest available data (Lithuanian data not included in totals) Figure 2: Number of child fatalities and percentage of all road fatalities, EU, 2004-2013 or latest available year
Source: CARE database, data available in May 2015
2004 2005 2006 2007 2008 2009 2010 2011 2012 2013
BE 26 37 32 30 35 16 23 35 16 18 BG - - - - - 30 - - - - CZ 27 41 32 25 19 16 17 12 15 11 DK 20 13 13 20 19 10 9 9 7 13 DE 153 159 136 111 102 90 104 86 73 58 EE - 12 6 6 3 4 - - - - IE 7 9 15 15 18 10 6 7 2 2 EL 43 44 36 42 35 43 30 22 21 17 ES 127 120 109 99 83 61 79 43 53 46 FR 175 130 120 150 114 122 130 128 115 97 HR - - - 26 20 24 12 14 8 10 IT 124 131 110 95 85 71 70 61 52 55 CY 4 - - 4 1 4 1 1 0 1 LV 6 10 14 11 12 7 9 5 6 7 LT - - - - - - - - - - LU 0 4 0 2 0 6 0 1 1 2 HU 38 34 42 37 24 22 20 12 20 7 MT - 3 0 0 0 1 1 - - - NL 35 31 37 36 23 23 16 18 24 8 AT 22 25 23 13 12 15 10 13 8 10 PL 228 167 151 156 146 128 112 102 90 91 PT 48 31 22 27 23 23 18 19 14 11 RO 163 152 145 117 137 125 95 83 90 76 SI 9 10 9 6 4 2 2 6 3 3 SK - 19 13 28 23 9 11 - - - FI 13 21 5 14 8 6 7 8 7 6 SE 14 10 16 10 6 9 9 10 7 4 UK 147 125 147 96 110 69 42 52 56 41
EU 1.519 1.398 1.293 1.206 1.092 946 867 793 734 640
Yearly change
8,0% 7,6% 6,7% 9,5% 13,3% 8,4% 8,5% 7,5% 12,8%
IS 3 0 1 1 0 0 0 2 0 2 NO 10 4 9 10 8 8 3 7 4 4 CH 20 14 16 14 10 21 8 10 31 12

Traffic Safety Basic Facts 2015 - Children
- 4 -
Children are, on average, at less
than one sixth of the risk of dying in a road accident
compared to the average person.
In most EU countries, children
are at less than a quarter of the risk of dying in a road accident
compared to the average person.
In the following tables and figures, the CARE data for 2013 are analysed in greater detail. It should be noted that the latest available data are used, meaning 2009 data for BG and EE, 2010 data for MT and SK, and 2012 data for IE. The relative fatality rate allows the comparison of the child fatality rate to the rate of the total population (Table 2).
relative fatality rate = fatality rate aged below 15
fatality rate all ages
where fatality rate = fatalities
population (millions) Table 2: Child and total fatality rates per million population and relative child fatality rate by country, 2013 or latest available year
Fatality rate: Relative child
Child fatalities/ population
(1)
Total fatalities/ population
(2)
fatality rate (=1/2)
BE 9 65 0,15 BG 30 124 0,24 CZ 7 62 0,11 DK 13 34 0,39 DE 5 41 0,13 EE 19 74 0,26 IE 2 35 0,06 EL 10 79 0,13 ES 6 36 0,18 FR 8 51 0,16 HR 16 86 0,18 IT 7 57 0,12 CY 7 51 0,14 LV 24 88 0,27 LT - - - LU 22 84 0,26 HU 5 60 0,08 MT 16 31 0,53 NL 3 28 0,10 AT 8 54 0,15 PL 16 88 0,18 PT 7 61 0,12 RO 24 93 0,26 SI 10 61 0,17 SK 13 69 0,19 FI 7 48 0,14 SE 2 27 0,09 UK 4 28 0,13
EU 8 52 0,16
IS 2 47 0,04 NO 2 37 0,06 CH 3 33 0,10
Source: CARE database (EUROSTAT for population data), data available in May 2015
Traffic Safety Basic Facts 2015 - Children
- 5 -
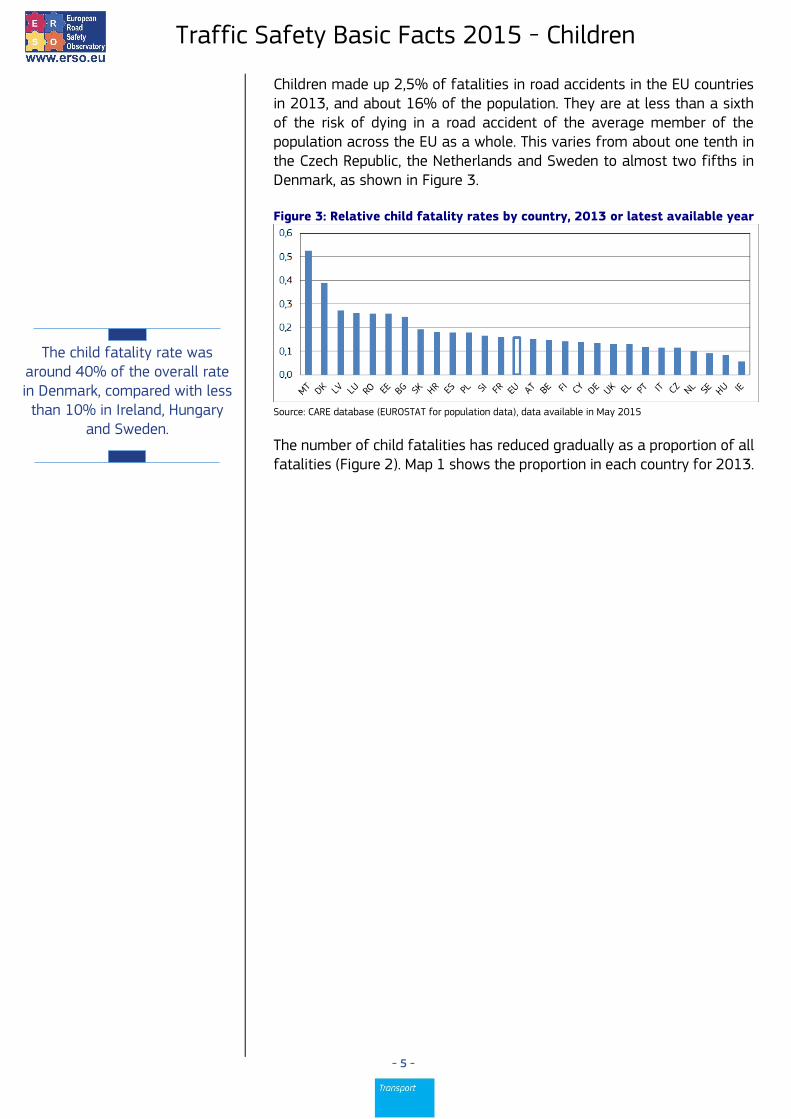
The child fatality rate was
around 40% of the overall rate in Denmark, compared with less than 10% in Ireland, Hungary
and Sweden.
Children made up 2,5% of fatalities in road accidents in the EU countries in 2013, and about 16% of the population. They are at less than a sixth of the risk of dying in a road accident of the average member of the population across the EU as a whole. This varies from about one tenth in the Czech Republic, the Netherlands and Sweden to almost two fifths in Denmark, as shown in Figure 3. Figure 3: Relative child fatality rates by country, 2013 or latest available year
Source: CARE database (EUROSTAT for population data), data available in May 2015
The number of child fatalities has reduced gradually as a proportion of all fatalities (Figure 2). Map 1 shows the proportion in each country for 2013.

Traffic Safety Basic Facts 2015 - Children
- 6 -
Map 1: Percentage of child fatalities of all fatalities by country, 2013 or latest available year
Traffic Safety Basic Facts 2015 - Children
- 7 -
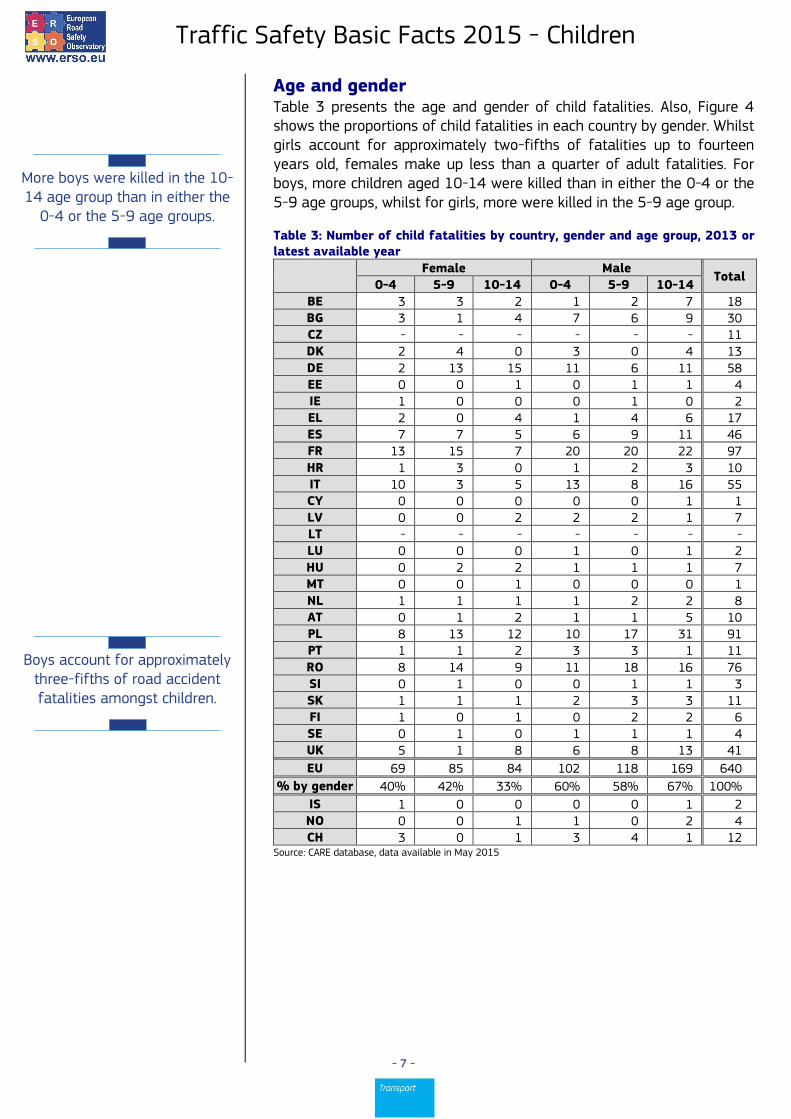
More boys were killed in the 10-14 age group than in either the
0-4 or the 5-9 age groups.
Boys account for approximately
three-fifths of road accident fatalities amongst children.
Age and gender Table 3 presents the age and gender of child fatalities. Also, Figure 4 shows the proportions of child fatalities in each country by gender. Whilst girls account for approximately two-fifths of fatalities up to fourteen years old, females make up less than a quarter of adult fatalities. For boys, more children aged 10-14 were killed than in either the 0-4 or the 5-9 age groups, whilst for girls, more were killed in the 5-9 age group.
Table 3: Number of child fatalities by country, gender and age group, 2013 or latest available year
Female Male Total
0-4 5-9 10-14 0-4 5-9 10-14
BE 3 3 2 1 2 7 18 BG 3 1 4 7 6 9 30 CZ - - - - - - 11 DK 2 4 0 3 0 4 13 DE 2 13 15 11 6 11 58 EE 0 0 1 0 1 1 4 IE 1 0 0 0 1 0 2 EL 2 0 4 1 4 6 17 ES 7 7 5 6 9 11 46 FR 13 15 7 20 20 22 97 HR 1 3 0 1 2 3 10 IT 10 3 5 13 8 16 55 CY 0 0 0 0 0 1 1 LV 0 0 2 2 2 1 7 LT - - - - - - - LU 0 0 0 1 0 1 2 HU 0 2 2 1 1 1 7 MT 0 0 1 0 0 0 1 NL 1 1 1 1 2 2 8 AT 0 1 2 1 1 5 10 PL 8 13 12 10 17 31 91 PT 1 1 2 3 3 1 11 RO 8 14 9 11 18 16 76 SI 0 1 0 0 1 1 3 SK 1 1 1 2 3 3 11 FI 1 0 1 0 2 2 6 SE 0 1 0 1 1 1 4 UK 5 1 8 6 8 13 41
EU 69 85 84 102 118 169 640
% by gender 40% 42% 33% 60% 58% 67% 100%
IS 1 0 0 0 0 1 2 NO 0 0 1 1 0 2 4 CH 3 0 1 3 4 1 12
Source: CARE database, data available in May 2015

Traffic Safety Basic Facts 2015 - Children
- 8 -
41% of children who died were travelling by car or taxi, whilst
38% were pedestrians.
Figure 4: Distribution of child fatalities by country and gender, 2013 or latest available year
Source: CARE database, data available in May 2015
Mode of Transport
Table 4: Total number and distribution of child fatalities by country and mode of transport, 2013 or latest available year
Source: CARE database, data available in May 2015
Car/ Taxi
Moped Motor cycle
Pedestrian Pedal cycle
Bus or coach
Other Total
BE 28% 0% 0% 33% 33% 6% 0% 18 BG 67% 0% 3% 20% 3% 0% 7% 30 CZ 27% 0% 0% 45% 27% 0% 0% 11 DK 54% 0% 0% 15% 23% 0% 8% 13 DE 43% 0% 0% 40% 14% 2% 2% 58 EE 25% 0% 0% 75% 0% 0% 0% 4 IE 0% 0% 0% 100% 0% 0% 0% 2 EL 18% 0% 24% 41% 6% 0% 12% 17 ES 50% 0% 0% 32% 11% 0% 7% 46 FR 56% 3% 2% 25% 10% 0% 4% 97 HR 50% 0% 0% 50% 0% 0% 0% 10 IT 53% 11% 0% 29% 7% 0% 0% 55 CY 0% 0% 0% 0% 100% 0% 0% 1 LV 29% 14% 14% 43% 0% 0% 0% 7 LT - - - - - - - - LU 50% 0% 0% 50% 0% 0% 0% 2 HU 71% 0% 0% 14% 14% 0% 0% 7 MT 100% 0% 0% 0% 0% 0% 0% 1 NL 0% 0% 0% 38% 50% 0% 13% 8 AT 40% 10% 10% 30% 10% 0% 0% 10 PL 37% 3% 1% 33% 16% 5% 3% 91 PT 18% 0% 9% 64% 0% 0% 9% 11 RO 21% 0% 0% 64% 9% 0% 5% 76 SI 0% 0% 0% 67% 33% 0% 0% 3 SK 55% 0% 0% 36% 9% 0% 0% 11 FI 17% 0% 0% 17% 50% 0% 17% 6 SE 50% 0% 0% 25% 0% 0% 25% 4 UK 29% 0% 2% 56% 10% 0% 2% 41
EU 41% 2% 2% 38% 12% 1% 4% 640
IS 50% 0% 0% 0% 0% 0% 50% 2 NO 0% 0% 0% 50% 25% 0% 25% 4 CH 50% 0% 0% 33% 8% 0% 8% 12

Traffic Safety Basic Facts 2015 - Children
- 9 -
Table 4 shows the distribution of child fatalities by mode of transport in 2013. 41% of child fatalities were car or taxi occupants and 38% were pedestrians. Figure 5 examines the variation of child road fatalities per mode of transport, age and gender. The percentage per mode varies with age and gender, presumably reflecting the changing travel choices of boys and girls as they grow older. Figure 5: Distribution of child fatalities by age, gender and mode of transport, EU, 2013 or latest available year
Source: CARE database, data available in May 2015
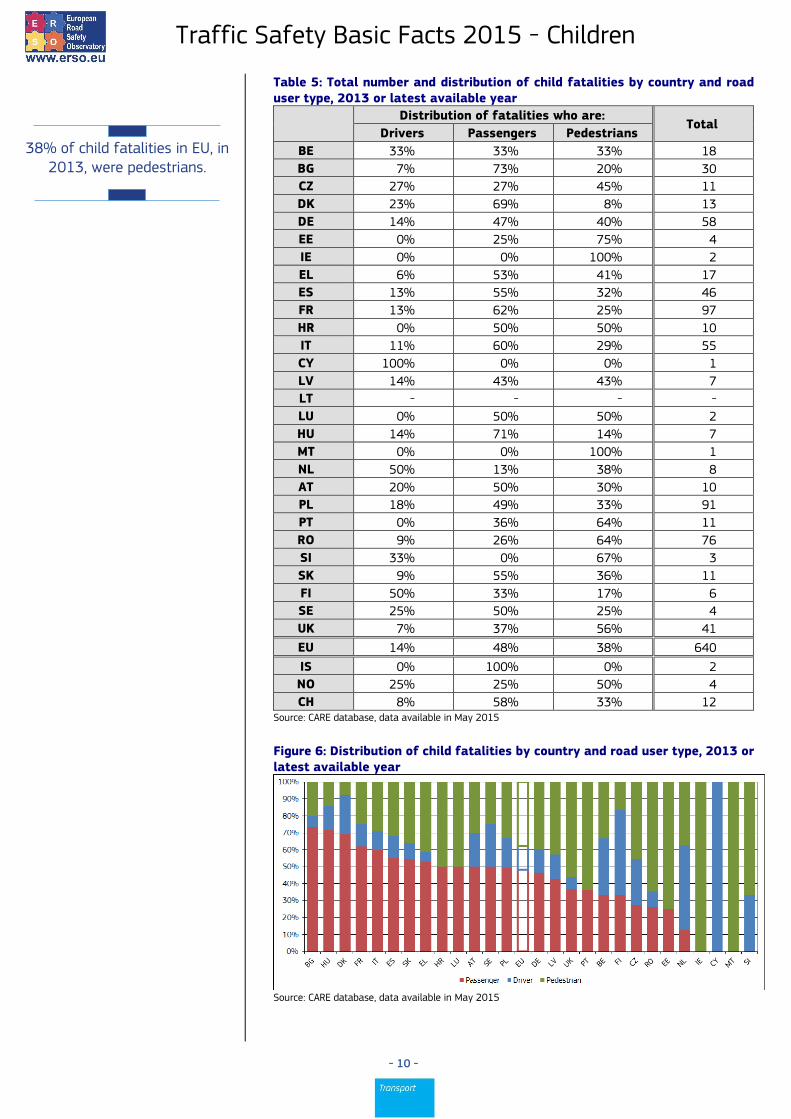
Table 5 and Figure 6 show that almost half of child fatalities were passengers in 2013, whilst almost two fifths were pedestrians and about one seventh of child fatalities was a ‘driver’.
Traffic Safety Basic Facts 2015 - Children
- 10 -
38% of child fatalities in EU, in
2013, were pedestrians.
Table 5: Total number and distribution of child fatalities by country and road user type, 2013 or latest available year
Distribution of fatalities who are:
Total Drivers Passengers Pedestrians
BE 33% 33% 33% 18
BG 7% 73% 20% 30
CZ 27% 27% 45% 11
DK 23% 69% 8% 13
DE 14% 47% 40% 58
EE 0% 25% 75% 4
IE 0% 0% 100% 2
EL 6% 53% 41% 17
ES 13% 55% 32% 46
FR 13% 62% 25% 97
HR 0% 50% 50% 10
IT 11% 60% 29% 55
CY 100% 0% 0% 1
LV 14% 43% 43% 7
LT - - - -
LU 0% 50% 50% 2
HU 14% 71% 14% 7
MT 0% 0% 100% 1
NL 50% 13% 38% 8
AT 20% 50% 30% 10
PL 18% 49% 33% 91
PT 0% 36% 64% 11
RO 9% 26% 64% 76
SI 33% 0% 67% 3
SK 9% 55% 36% 11
FI 50% 33% 17% 6
SE 25% 50% 25% 4
UK 7% 37% 56% 41
EU 14% 48% 38% 640
IS 0% 100% 0% 2
NO 25% 25% 50% 4
CH 8% 58% 33% 12 Source: CARE database, data available in May 2015
Figure 6: Distribution of child fatalities by country and road user type, 2013 or latest available year
Source: CARE database, data available in May 2015

Traffic Safety Basic Facts 2015 - Children
- 11 -
Area and Type of Road The CARE data show whether an accident occurred on a motorway or not, and, if not, whether it occurred in an urban or a rural area. Table 6 shows this distribution of child fatalities in each country. Fewer than one in ten child fatalities occurred on a motorway, whilst almost half of the total child road fatalities were recorded in urban areas. Table 6: Total number and distribution of child fatalities by country and road type, 2013 or latest available year
Source: CARE database, data available in May 2015 *Rural and urban roads do not include motorways.
Motorway Rural* Urban* Not known Total
BE 6% 56% 39% - 18
BG 10% 57% 33% - 30
CZ 9% 27% 64% - 11
DK 0% 77% 23% - 13
DE 12% 38% 50% - 58
EE - 50% 50% - 4
IE 0% 50% 50% - 2
EL 12% 24% 65% - 17
ES 20% 48% 32% - 46
FR 11% 51% 38% - 97
HR 10% 40% 50% - 10
IT 11% 53% 36% - 55
CY - 0% 100% - 1
LV - 86% 14% - 7
LT - - - - -
LU 0% 50% 50% - 2
HU 14% 57% 29% - 7
MT - - 100% - 1
NL 0% 38% 63% - 8
AT 0% 70% 30% - 10
PL 0% 49% 51% - 91
PT 0% 9% 91% - 11
RO 3% 18% 79% - 76
SI 0% 0% 100% - 3
SK 0% 36% 64% - 11
FI 0% 83% 17% - 6
SE 0% 75% 0% 25% 4
UK 2% 41% 56% - 41
EU 7% 44% 49% 0% 640
IS - 100% 0% - 2
NO - 75% 25% - 4
CH 17% 25% 58% - 12

Traffic Safety Basic Facts 2015 - Children
- 12 -
Fewer than one in ten child
fatalities in EU, in 2013, occurred on motorways. Almost half of the total child fatalities
occurred in urban areas.
Figure 7: Distribution of child fatalities by country and road type, 2013 or latest available year
Source: CARE database, data available in May 2015
Time of the day
Table 7: Total number and distribution of child fatalities by country and time of the day, 2013 or latest available year
0.00-3.59
4.00-7.59
8.00-11.59
12.00-15.59
16.00-19.59
20.00-23.59
Total
BE 0% 11% 6% 33% 44% 6% 18 BG 10% 10% 13% 30% 27% 10% 30 CZ 0% 0% 18% 64% 18% 0% 11 DK 0% 0% 54% 8% 31% 8% 13 DE 3% 16% 9% 31% 34% 7% 58 EE 0% 0% 0% 50% 50% 0% 4 IE 0% 0% 0% 50% 50% 0% 2 EL 6% 12% 6% 35% 29% 12% 17 ES 0% 7% 12% 25% 36% 20% 46 FR 5% 7% 16% 19% 40% 12% 97 HR 10% 20% 0% 20% 50% 0% 10 IT 5% 2% 13% 24% 25% 31% 55 CY 0% 0% 0% 100% 0% 0% 1 LV 0% 0% 0% 29% 71% 0% 7 LT - - - - - - - LU 0% 0% 0% 50% 50% 0% 2 HU 14% 29% 14% 0% 29% 14% 7 MT 0% 0% 100% 0% 0% 0% 1 NL 0% 0% 38% 50% 13% 0% 8 AT 0% 0% 0% 50% 50% 0% 10 PL 2% 9% 10% 30% 46% 3% 91 PT 0% 0% 27% 18% 36% 18% 11 RO 3% 4% 8% 25% 47% 13% 76 SI 0% 0% 0% 33% 67% 0% 3 SK 0% 0% 18% 27% 55% 0% 11 FI 0% 17% 17% 50% 17% 0% 6 SE 0% 0% 50% 50% 0% 0% 4 UK 5% 2% 12% 27% 44% 10% 41
EU 3% 7% 13% 27% 39% 11% 640
IS 0% 0% 0% 100% 0% 0% 2 NO 25% 0% 25% 0% 50% 0% 4 CH 0% 25% 17% 25% 33% 0% 12
Source: CARE database, data available in May 2015

Traffic Safety Basic Facts 2015 - Children
- 13 -
Two fifths of child fatalities in
EU, in 2013, occurred between 4 and 8pm.
The peak period for child
fatalities was between 4 and 6pm.
As shown in Table 7, the day has been divided into six four-hour periods beginning at midnight in order to examine the distribution of child fatalities by time of the day. Across the EU, almost 40% of the fatalities occurred between 4pm and 8pm, over 25% occurred between noon and 4pm and 13% occurred between 8am and noon. Figure 8 compares the distributions of child fatalities and all fatalities by hour of the day. By comparison with the overall distribution, there are relatively many child fatalities between noon and 8 pm, and relatively few between 9pm and 8am.
Figure 8: Distribution of total and child fatalities by hour, EU, 2013 or latest available year
Source: CARE database, data available in May 2015
Day of the Week Table 8 shows the distribution of child fatalities by day of the week. On average in the EU, Tuesday has the most fatalities followed by weekends. Also, Figure 9 compares the distributions of child fatalities and all road fatalities by day of the week. By comparison with the overall distribution, there are relatively few child fatalities on Thursdays and relatively many on Tuesdays and at weekends.

Traffic Safety Basic Facts 2015 - Children
- 14 -
Tuesday is the day of the week with the most child fatalities,
followed by weekends.
Table 8: Total number and distribution of child fatalities by country and day of the week, 2013 or latest available year
Source: CARE database, data available in May 2015
Figure 9: Distribution of total and child fatalities by day of the week, EU, 2013 or latest available year
Source: CARE database, data available in May 2015
Mon Tue Wed Thu Fri Sat Sun Total
BE 11% 6% 22% 17% 17% 6% 22% 18 BG 7% 23% 13% 10% 20% 13% 13% 30 CZ 9% 18% 27% 9% 18% 0% 18% 11 DK 23% 31% 0% 0% 15% 8% 23% 13 DE 17% 17% 14% 9% 17% 16% 10% 58 EE 50% 0% 0% 0% 0% 0% 50% 4 IE 0% 0% 50% 0% 0% 0% 50% 2 EL 29% 6% 12% 18% 18% 12% 6% 17 ES 16% 20% 5% 7% 10% 16% 26% 46 FR 14% 20% 14% 14% 11% 15% 10% 97 HR 20% 20% 10% 10% 10% 10% 20% 10 IT 15% 15% 11% 7% 13% 16% 24% 55 CY 100% 0% 0% 0% 0% 0% 0% 1 LV 14% 0% 29% 0% 0% 43% 14% 7 LT - - - - - - - - LU 0% 50% 0% 0% 0% 50% 0% 2 HU 14% 0% 29% 14% 0% 29% 14% 7 MT 0% 0% 0% 0% 0% 0% 100% 1 NL 0% 25% 13% 25% 25% 0% 13% 8 AT 40% 20% 0% 20% 20% 0% 0% 10 PL 10% 14% 11% 16% 16% 24% 8% 91 PT 9% 27% 18% 18% 9% 9% 9% 11 RO 8% 9% 20% 16% 16% 17% 14% 76 SI 0% 67% 0% 0% 0% 0% 33% 3 SK 27% 27% 0% 27% 9% 0% 9% 11 FI 17% 50% 0% 17% 17% 0% 0% 6 SE 0% 0% 0% 25% 50% 25% 0% 4 UK 22% 24% 15% 0% 24% 2% 12% 41
EU 14% 17% 13% 12% 15% 15% 14% 640
IS 0% 0% 0% 0% 50% 0% 50% 2 NO 0% 0% 0% 25% 25% 0% 50% 4 CH 8% 0% 8% 17% 25% 8% 33% 12

Traffic Safety Basic Facts 2015 - Children
- 15 -
The number of fatalities
amongst children is highest in August, almost twice the January-March average.
Seasonality Table 9 shows the distribution of child fatalities through the year, using pairs of months. The peak period for the EU as a whole is July/August, with fewest fatalities in the period between November and February.
Table 9: Total number and distribution of child fatalities by country and month, 2013 or latest available year
Source: CARE database, data available in May 2015
The monthly distribution of child fatalities is displayed in Figure 10. By comparison with the overall distribution, there are relatively many child fatalities between March and May and in August, whilst relatively few between September and December and in February.
Jan/Feb Mar/Apr May/Jun Jul/Aug Sep/Oct Nov/Dec Total
BE 6% 22% 28% 11% 11% 22% 18
BG 7% 17% 10% 20% 37% 10% 30
CZ 9% 0% 45% 9% 27% 9% 11
DK 23% 15% 15% 23% 15% 8% 13
DE 14% 19% 31% 10% 16% 10% 58
EE 50% 25% 25% 0% 0% 0% 4
IE 0% 50% 0% 0% 50% 0% 2
EL 24% 24% 12% 41% 0% 0% 17
ES 22% 16% 12% 22% 9% 18% 46
FR 19% 18% 14% 26% 7% 16% 97
HR 20% 20% 20% 20% 10% 10% 10
IT 11% 15% 20% 20% 22% 13% 55
CY 0% 0% 0% 100% 0% 0% 1
LV 0% 0% 0% 71% 14% 14% 7
LT - - - - - - -
LU 0% 0% 50% 50% 0% 0% 2
HU 14% 0% 14% 57% 14% 0% 7
MT 0% 0% 0% 100% 0% 0% 1
NL 0% 13% 25% 0% 50% 13% 8
AT 0% 30% 20% 10% 20% 20% 10
PL 5% 11% 26% 29% 19% 10% 91
PT 27% 0% 36% 18% 0% 18% 11
RO 8% 20% 17% 30% 12% 13% 76
SI 0% 0% 33% 0% 33% 33% 3
SK 27% 18% 9% 18% 18% 9% 11
FI 0% 0% 0% 33% 50% 17% 6
SE 25% 25% 25% 0% 25% 0% 4
UK 12% 15% 15% 15% 17% 27% 41
EU 13% 16% 19% 23% 16% 13% 640
IS 0% 100% 0% 0% 0% 0% 2
NO 75% 25% 0% 0% 0% 0% 4
CH 0% 17% 17% 42% 17% 8% 12

Traffic Safety Basic Facts 2015 - Children
- 16 -
By 2012, thirteen member
states routinely collected data in a sample of hospitals and contributed them to the EU
Injury Database.
Figure 10: Distribution of total and child fatalities by month, EU, 2013 or latest available year
Source: CARE database, data available in May 2015
Road Accident Health Indicators Injury data can be obtained from a wide range of sources, such as police and ambulance reports, national insurance schemes, and hospital records, each of which provides a specific but yet incomplete picture of the injuries suffered in road accidents. In order to obtain a comprehensive view of these injuries, the EU Council issued a Recommendation that urges member states to use synergies between existing data sources and to develop national injury surveillance systems rooted in the health sector. At present, thirteen member states are routinely collecting injury data in a sample of hospitals and delivering these data to the Commission. This system is called the EU Injury Database (EU IDB).
Within the EU IDB “transport module” injuries suffered in road accidents are recorded by “mode of transport”, “role of injured person” and “counterpart”. These variables can complement information from police records, in particular for injury patterns and the improved assessment of injury severity. The indicators used include the percentage of casualties attending hospital who are admitted to hospital, the mean length of stay of hospital admissions, the nature and type of body part injured, and potentially also long term consequences of injuries.

Traffic Safety Basic Facts 2015 - Children
- 17 -
According to estimates based on
the EU IDB more than four million people are injured
annually in road accidents, one million of whom have to be
admitted to a hospital.
20% of the child casualties who
attended a hospital were admitted to the hospital; their
average stay in hospital was six days.
Figure 11: Distribution of non-fatal road accident casualties attending hospital by mode of transport
EU Injury Database (EU IDB AI) - hospital treated patients. IDB AI Transport module and place of occurrence (code 6.n [public road]); n-all = 73.600: n-admitted = 23.568 (DE, DK, LV, MT, AT, NL, SE, SI, CY, years 2005-2008).
Figure 11 is based on IDB data from nine countries for accidents that occurred between 2005 and 2008. Vulnerable road users (pedestrians, cyclists, motorcycles and mopeds) accounted for almost two thirds (63%) of road accident casualties attending hospital, and for over half of casualties admitted to the hospital (56%).
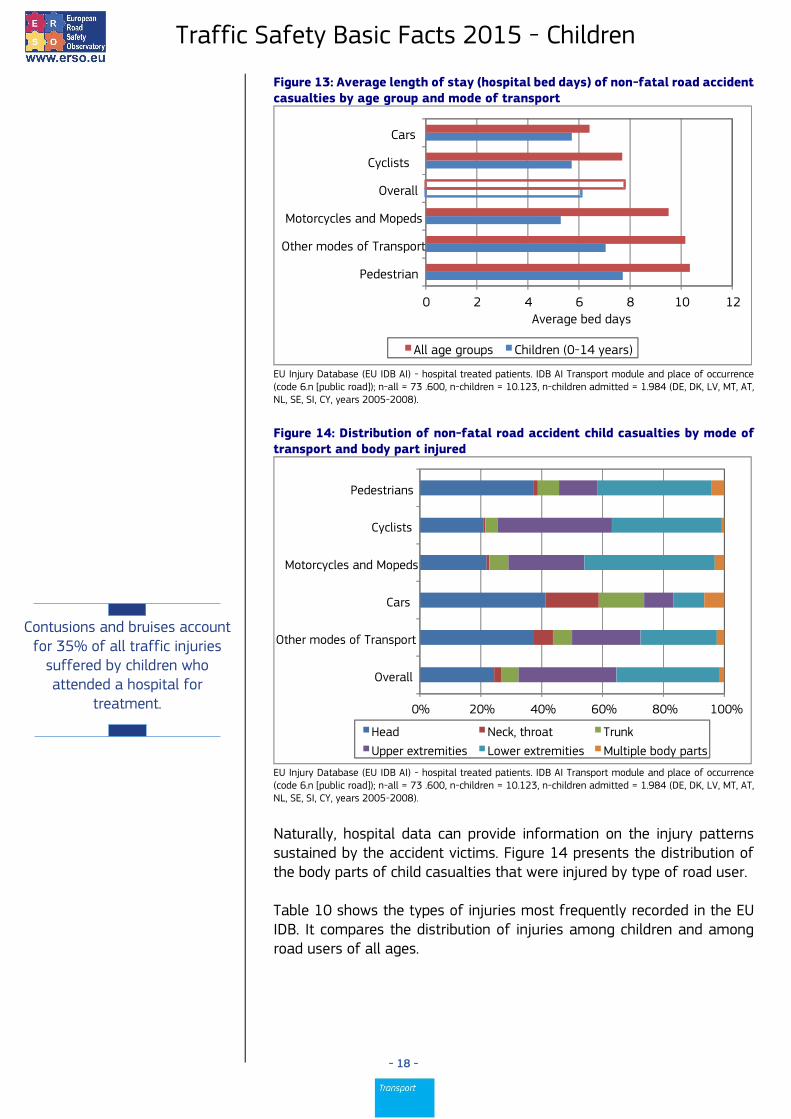
Figure 12 shows that overall 32% of road accident casualties recorded in
the IDB were admitted to hospital, compared with 20% for children. Figure
13 shows that the overall average length of stay of eight days, compared
with six days for children.
Figure 12: Percentage of non-fatal road accident casualties who were admitted to hospital by age group and mode of transport
EU Injury Database (EU IDB AI) - hospital treated patients. IDB AI Transport module and place of occurrence (code 6.n [public road]); n-all = 73 .600, n-children = 10.123, n-children admitted = 1.984 (DE, DK, LV, MT, AT, NL, SE, SI, CY, years 2005-2008).
0% 20% 40% 60% 80% 100%
Admitted patients
All patients
Pedestrian Cyclists
Motorcycles and Mopeds Cars
Other modes of Transport
0%
10%
20%
30%
40%
50%
Pedestrian Other modes of Transport
Motorcycles and Mopeds
Overall Cyclists Cars
All age groups Childre (0 - 14 years)
Per
centa
ge
of
pati
ents
adm
itte
d
Traffic Safety Basic Facts 2015 - Children
- 18 -
Contusions and bruises account
for 35% of all traffic injuries suffered by children who attended a hospital for
treatment.
Figure 13: Average length of stay (hospital bed days) of non-fatal road accident casualties by age group and mode of transport
EU Injury Database (EU IDB AI) - hospital treated patients. IDB AI Transport module and place of occurrence (code 6.n [public road]); n-all = 73 .600, n-children = 10.123, n-children admitted = 1.984 (DE, DK, LV, MT, AT, NL, SE, SI, CY, years 2005-2008).
Figure 14: Distribution of non-fatal road accident child casualties by mode of transport and body part injured
EU Injury Database (EU IDB AI) - hospital treated patients. IDB AI Transport module and place of occurrence (code 6.n [public road]); n-all = 73 .600, n-children = 10.123, n-children admitted = 1.984 (DE, DK, LV, MT, AT, NL, SE, SI, CY, years 2005-2008).
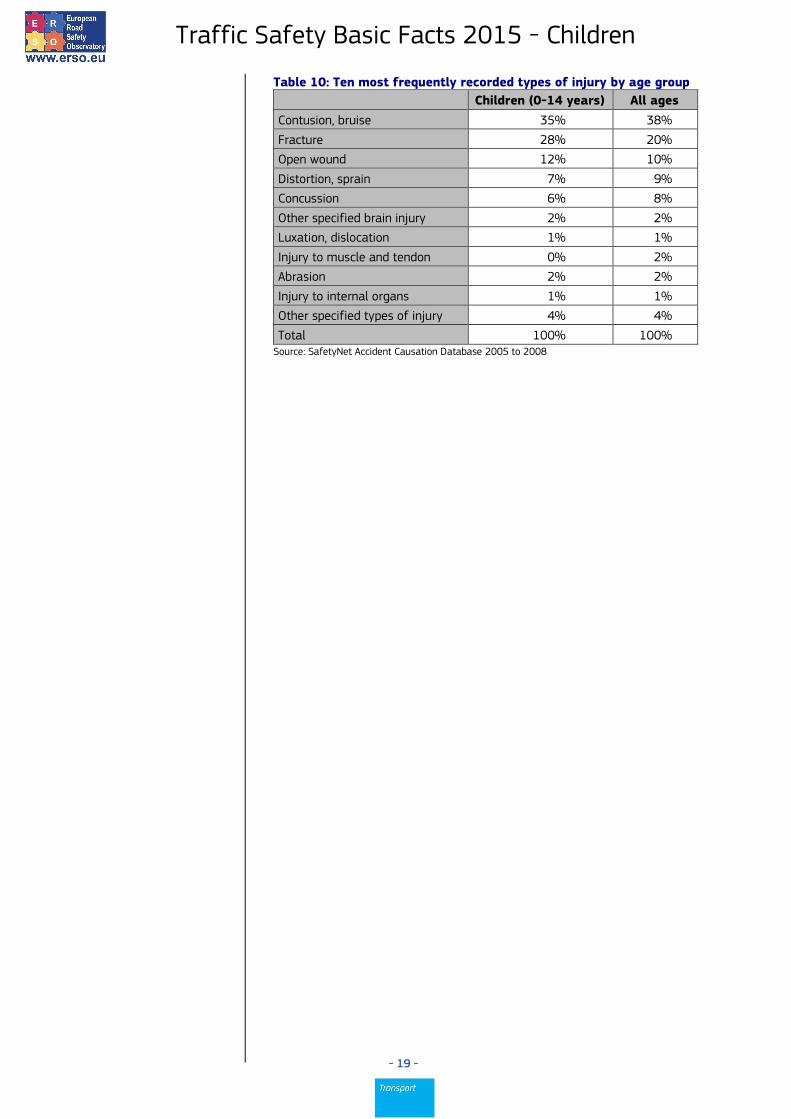
Naturally, hospital data can provide information on the injury patterns sustained by the accident victims. Figure 14 presents the distribution of the body parts of child casualties that were injured by type of road user. Table 10 shows the types of injuries most frequently recorded in the EU IDB. It compares the distribution of injuries among children and among road users of all ages.
0 2 4 6 8 10 12
Pedestrian
Other modes of Transport
Motorcycles and Mopeds
Overall
Cyclists
Cars
Average bed days
All age groups Children (0-14 years)
0% 20% 40% 60% 80% 100%
Pedestrians
Cyclists
Motorcycles and Mopeds
Cars
Other modes of Transport
Overall
Head Neck, throat Trunk
Upper extremities Lower extremities Multiple body parts
Traffic Safety Basic Facts 2015 - Children
- 19 -
Table 10: Ten most frequently recorded types of injury by age group
Children (0-14 years) All ages
Contusion, bruise 35% 38%
Fracture 28% 20%
Open wound 12% 10%
Distortion, sprain 7% 9%
Concussion 6% 8%
Other specified brain injury 2% 2%
Luxation, dislocation 1% 1%
Injury to muscle and tendon 0% 2%
Abrasion 2% 2%
Injury to internal organs 1% 1%
Other specified types of injury 4% 4%
Total 100% 100% Source: SafetyNet Accident Causation Database 2005 to 2008

Traffic Safety Basic Facts 2015 - Children
- 20 -
Notes
1. Country abbreviations
Belgium BE Italy IT Romania RO
Bulgaria BG Cyprus CY Slovenia SI
Czech Republic CZ Latvia LV Slovakia SK
Denmark DK Lithuania LT Finland FI
Germany DE Luxembourg LU Sweden SE
Estonia EE Hungary HU United Kingdom UK
Ireland IE Malta MT
Greece EL Netherlands NL Iceland IS
Spain ES Austria AT Liechtenstein LI
France FR Poland PL Norway NO
Croatia HR Portugal PT Switzerland CH
2. Sources: CARE (Community database on road accidents). The full glossary of definitions of variables used in this Report is available at: http://ec.europa.eu/transport/road_safety/pdf/statistics/cadas_glossary.pdf 3. Data available in May 2015. 4. Data refer to 2013 and when not available the latest available data are used (2009 data for BG and EE, 2010 data for MT and SK, and 2012 data for IE). Totals and related average percentages for EU also include latest available data. 5. Lithuanian data not included in the totals. 6. Data for 2013 for Italy have been modified after the publication of the 2015 edition of Traffic Safety Basic Facts. 7. This 2015 edition of Traffic Safety Basic Facts updates the previous versions produced within the EU co-funded research projects SafetyNet and DaCoTA. 8. Disclaimer This report has been produced by the National Technical University of Athens (NTUA), the Austrian Road Safety Board (KFV) and the European Union Road Federation (ERF) under a contract with the European Commission. Whilst every effort has been made to ensure that the matter presented in this report is relevant, accurate and up-to-date, the Partners cannot accept any liability for any error or omission, or reliance on part or all of the content in another context. Any information and views set out in this report are those of the author(s) and do not necessarily reflect the official opinion of the Commission. The Commission does not guarantee the accuracy of the data included in this study. Neither the Commission nor any person acting on the Commission’s behalf may be held responsible for the use that may be made of the information contained therein. 9. Please refer to this Report as follows: European Commission, Traffic Safety Basic Facts on Children, European Commission, Directorate General for Transport, June 2015.