Embed Size (px)
Citation preview

1
Child Survival in Urban BangladeshChild Survival in Urban Bangladesh::Are the urban migrants and poor Are the urban migrants and poor
disadvantaged?disadvantaged?
M. M. MazharulMazharul IslamIslamUniversity of Dhaka, BangladeshUniversity of Dhaka, Bangladesh
andandK M K M AbulAbul KalamKalam AzadAzad
Independent University, BangladeshIndependent University, Bangladesh

2
BackgroundBackgroundBangladesh is predominantly a rural countryBangladesh is predominantly a rural country
In recent years it has been experiencing rapid In recent years it has been experiencing rapid urbanization urbanization
In 1974, only 9 percent of the population was In 1974, only 9 percent of the population was urbanized, which increased to 23 percent in 2001urbanized, which increased to 23 percent in 2001
Have one of the highest rate of growth of urban Have one of the highest rate of growth of urban population: 5.6 percentpopulation: 5.6 percent
Increased number of garment industries in urban areas Increased number of garment industries in urban areas add a new dimension not only in the economy of the add a new dimension not only in the economy of the country but also urbanization processcountry but also urbanization process

3
RuralRural--Urban Migration in Bangladesh Urban Migration in Bangladesh
Globally, urban areas are growing, and the poor of Globally, urban areas are growing, and the poor of the world are increasingly urban.the world are increasingly urban.
A large number of rural poor migrates to urban A large number of rural poor migrates to urban areas in search of employment and income areas in search of employment and income
In Bangladesh, unplanned urbanization In Bangladesh, unplanned urbanization mushrooming slums and squattersmushrooming slums and squatters
This pattern of ruralThis pattern of rural--urban migration may have urban migration may have implication for health and survival of the implication for health and survival of the migrantmigrant’’s childrens children

4
Objectives of the studyObjectives of the study
To analyze child survival status in urban To analyze child survival status in urban BangladeshBangladesh
To examine the implications of ruralTo examine the implications of rural--urban migration on child survival of the urban migration on child survival of the migrants and their economic development migrants and their economic development
To identify the determinants of child To identify the determinants of child survival in urban Bangladeshsurvival in urban Bangladesh

5
Data and MethodData and Method
Data come from the 1999Data come from the 1999--2000 BDHS 2000 BDHS
Covered nationally representative sample of Covered nationally representative sample of 10,544 ever10,544 ever--married women of age 10married women of age 10--4949
2400 or 23% were rural to urban migrants 2400 or 23% were rural to urban migrants
BDHS Collected information on childhood BDHS Collected information on childhood residence, current place of residence, no. of years residence, current place of residence, no. of years spent in the current place and types of residence spent in the current place and types of residence prior to the most recent migration prior to the most recent migration

6
Data and Method (cont..)Data and Method (cont..)
A woman who has reported her childhood and pervious A woman who has reported her childhood and pervious residences as rural and currently living in urban residences as rural and currently living in urban residence, is classified as rural to urban migrant. residence, is classified as rural to urban migrant.
Estimates of childhood mortality (i.e. probability of Estimates of childhood mortality (i.e. probability of death) are obtained by using conventional lifedeath) are obtained by using conventional life--table table approachapproach
The analysis is restricted to children born in last five The analysis is restricted to children born in last five yearsyears
Proportional hazard model is used to estimate the Proportional hazard model is used to estimate the relative risk of childhood mortalityrelative risk of childhood mortality

7
Trends in Infant and childhood Trends in Infant and childhood mortality: 1989mortality: 1989--20032003
87
50
133
82
37
116
66
30
94
65
24
88
Infant Mortality Child Mortality Underfive Mortality
1989-1993 1992-1996 1995-1999 1999-2003

8
Levels and Trends in U5 mortalityLevels and Trends in U5 mortality
020406080
100120140160180
1993/94 1996/97 1999/00 2003/04
Urban Rural
U5 mortality rate U5 mortality rate declined by 20% in urban declined by 20% in urban area, and 36% in rural area, and 36% in rural areaarea
Rural/urban differential Rural/urban differential in childhood in childhood
mortality diminishing, mortality diminishing, Why?Why?

9
IMR by migration status: IMR by migration status: Are the migrants disadvantaged?Are the migrants disadvantaged?
72.2
86.1
81.7
50.6
75.6
0 20 40 60 80 100
R-U migrnat (10+yrs.)
R-U migrant (<10yrs.)
R-U migrant
Urban native
Rural Native

10
UnderUnder--five mortality before and after five mortality before and after migrationmigration
116.9
98.5
Before migration After migration

11
ANC Visit to doctor by Migration ANC Visit to doctor by Migration status status
43.9
39.4
42.5
61.7
16.7
0 10 20 30 40 50 60 70
R-U migrnat(10+yrs.)
R-U migrant(<10yrs.)
R-U migrant
Urban native
Rural Native

12
Delivery in health facility by Delivery in health facility by migration statusmigration status
16.3
20.3
19.1
33.2
4
0 5 10 15 20 25 30 35
R-U migrnat (10+yrs.)
R-U migrant (<10yrs.)
R-U migrant
Urban native
Rural Native

13
Coverage of Measles Vaccine by Coverage of Measles Vaccine by migration statusmigration status
78.2
70.7
76.4
86.7
67.5
0 20 40 60 80 100
R-U migrnat (10+yrs.)
R-U migrant (<10yrs.)
R-U migrant
Urban native
Rural Native
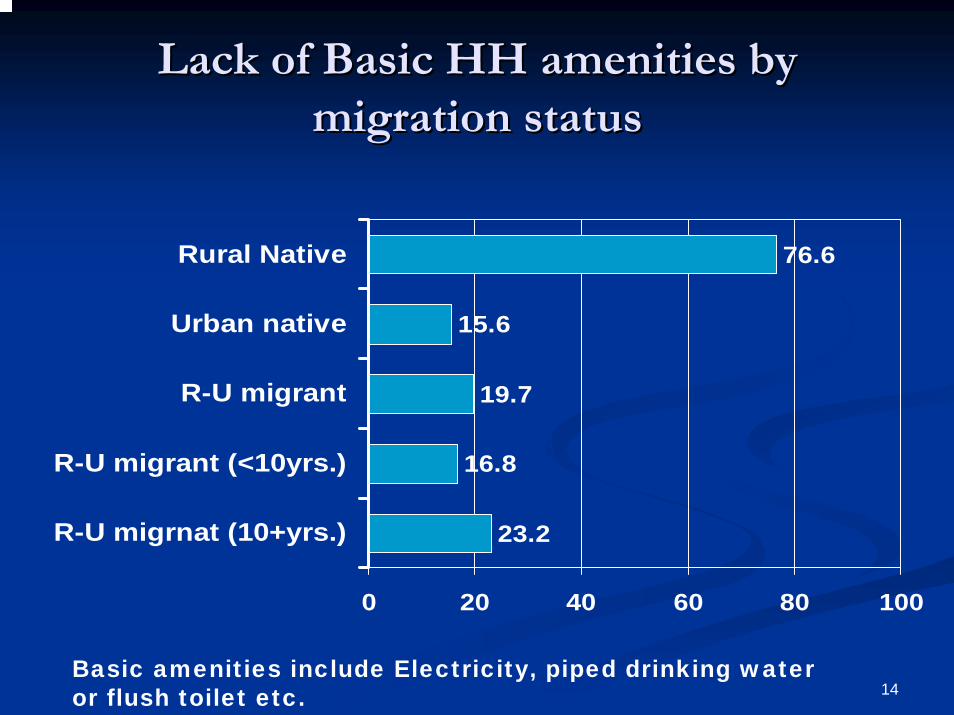
14
Lack of Basic HH amenities by Lack of Basic HH amenities by migration statusmigration status
23.2
16.8
19.7
15.6
76.6
0 20 40 60 80 100
R-U migrnat (10+yrs.)
R-U migrant (<10yrs.)
R-U migrant
Urban native
Rural Native
Basic amenities include Electricity, piped drinking water or flush toilet etc.

15
Ownership of no major consumer durables by Ownership of no major consumer durables by migration statusmigration status
20.9
17.8
19.3
13.2
39.1
0 10 20 30 40 50
R-U migration (10+ yrs.)
R-U Migration (<10 yrs.)
R-U migration
Urban Native
Rural Ntive
Consumer durables include: Radio, TV, watch, wardrobe etc.

16
IMR among Poor and NonIMR among Poor and Non--poor by migration statuspoor by migration status
108.5
90.5
102.1
85.7
68.8
60.6
42.2
55.8
42.9
47.8
R-U migrnat (10+yrs.)
R-U migrant (<10yrs.)
R-U migrant
Urban native
Rural Native
Poor Non-poor

17
U5 mortality by wealth quintile and U5 mortality by wealth quintile and Migration StatusMigration Status
102.1
78.3 73.566.3
120.2
137.8
96.9105.4
47.6
128.8
147.7
129119.9
62.8
119.3
0
20
40
60
80
100
120
140
160
Poorest Q2 Q3 Q4 RichestRural Urban R-U migrant

18
Unadjusted Relative Risk of U5 mortality Unadjusted Relative Risk of U5 mortality (ref. = urban native)(ref. = urban native)
87%
122%
27%
0%
20%
40%
60%
80%
100%
120%
140%
Rural Native R-U migrant (<10yrs.) R-U migrant (10+yrs.)
77%
3%0%
10%20%30%40%50%60%70%80%90%
R-U migrant(<10yrs.)
R-U migrant(10+yrs.)
Total sample Urban sample

19
Adjusted Relative Risk of U5 mortality among Adjusted Relative Risk of U5 mortality among children born in urban areachildren born in urban area
68%
-40% -36%
25%
114%
48%
-21%-3%
-9%
18%
R-U m
igrant <10
yrs.R-U
migrant 1
0+yrs.
Male ch
ildSec
ondary+
Parity
HH head
Work st
atus
Poorest
Age at b
irth <2
0 mWhite
colla
r job

20
Relative risk of U5 mortality
Covariates Covariates RRRRMigration statusMigration status
Urban native (ref.)Urban native (ref.)RR--U migrants (<10yrs.) U migrants (<10yrs.) RR--U migrants (10+yrs.)U migrants (10+yrs.)
1.001.001.68***1.68***0.91**0.91**
Sex of childSex of childMaleMaleFemale (ref.)Female (ref.)
1.18**1.18**1.001.00
EducationEducationNo education (ref.)No education (ref.)PrimaryPrimarySecondary+Secondary+
1.001.001.011.010.84***0.84***
ParityParity 0.91**0.91**HH headHH head
Father (ref.)Father (ref.)MotherMotherOtherOther
1.001.000.64**0.64**1.11**1.11**
MotherMother’’s work statuss work statusYesYesNo (ref.)No (ref.)
1.25**1.25**1.001.00
HH economic statusHH economic statusPoorestPoorestQ2Q2Q3Q3Q4Q4Richest Richest
2.14***2.14***1.57***1.57***1.45**1.45**1.32**1.32**1.001.00
FatherFather’’s Professions ProfessionWhite collar job White collar job Others (ref.) Others (ref.)
0.790.791.001.00
MotherMother’’s age at child Births age at child Birth<20<202020--35 (ref.)35 (ref.)36+ 36+
1.48**1.48**1.001.001.13**1.13**
Note: * p< 0.05, ** p< 0.01, *** p< 0.001

21
Conclusion Conclusion This study documents a sharp differentials in childhood This study documents a sharp differentials in childhood mortality between migrants and nonmortality between migrants and non--migrants within urban areasmigrants within urban areas
Urban migrants have significantly higher childhood mortality Urban migrants have significantly higher childhood mortality than urban natives but lower than rural nativesthan urban natives but lower than rural natives
RR--U migration promote child survivalU migration promote child survival
Mortality before age five is 1.6 times higher among children borMortality before age five is 1.6 times higher among children born n to urban migrants compared to the children born to lifelong to urban migrants compared to the children born to lifelong urban natives urban natives

22
Conclusion Conclusion RR--U migrants are less likely to receive maternal and child health U migrants are less likely to receive maternal and child health care servicescare services
Poor/nonPoor/non--poor differential in child survival is higher in urban poor differential in child survival is higher in urban area than in rural areaarea than in rural area
Child survival status is worse among RChild survival status is worse among R--U migrant poor than U migrant poor than average urban pooraverage urban poor
Housing condition, access to safe drinking water and hygienic Housing condition, access to safe drinking water and hygienic toilet appeared as the most critical determinants of child survitoilet appeared as the most critical determinants of child survivalval
The study underscores the importance of motherThe study underscores the importance of mother’’s education s education beyond primary to improve the child survivalbeyond primary to improve the child survival

23
ConclusionConclusion
The underlying efforts to improve child health in urban The underlying efforts to improve child health in urban Bangladesh, thus, is that of urban poor and the urban migrants, Bangladesh, thus, is that of urban poor and the urban migrants, who are growing rapidlywho are growing rapidly
The study results highlight the need to target migrant groups anThe study results highlight the need to target migrant groups and d urban poor within urban areas in the provision of health care urban poor within urban areas in the provision of health care servicesservices
Further research is needed to understand the health care needs Further research is needed to understand the health care needs of migrants in urban areas in order to develop the appropriate of migrants in urban areas in order to develop the appropriate health policy and planninghealth policy and planning