Embed Size (px)
Citation preview
Child Support, Pensions andSocial Security Act 2000
Report by the Government Actuary on the cost of uprating the basicretirement pension in line with the general level of earnings
Presented to Parliament by the Secretary of State for Social Security by Command of Her MajestyNovember 2000
Cm 4920 £7.30
published by The Stationery Office
Report on the cost of uprating the basic retirement pension in line with the general level of earnings
Contents
CONTENTS
Terms of Reference
List of Tables and Figures
Appendices - List of tables
1. Summary
2. Introduction
3. Methods and assumptions used for the projections
4. Projected balance in the National Insurance Fund on Assumption 1
5. Projected balance in the National Insurance Fund on Assumption 2
6. Effects on the longer-term finances of the National Insurance Fund
7. Effects of variations in assumptions
8. Comparison of estimates in this report with previous estimates
APPENDICES
A1. Details of methods used for the projections
A2. Details of economic assumptions used for the projections
A3. Projected contribution income, by class of contribution - Assumption 1
A4. Projected benefit expenditure, by benefit type - Assumption 1
A5. Projected contribution income, by class of contribution - Assumption 2
A6. Projected benefit expenditure, by benefit type - Assumption 2
We welcome your comments on this site.

Report on the cost of uprating the basic retirement pension in line with the general level of earnings
To: The Right Hon. Alistair Darling MP, Secretary of State for Social Security
Sir,
I attach a report on the likely effects on the National Insurance Fund of increasing annually the rate of basic retirementpension by the percentage increase in the general level of earnings.
The report considers projections of the balance in the National Insurance Fund if the basic retirement pension continues to beuprated in line with prices or, alternatively, is increased from now on in line with the general level of earnings.
The report further considers the effect on the National Insurance Fund of the higher rates of basic retirement pension whichthe government is proposing will take effect from April 2001 and April 2002 and examines the impact of either prices orearnings upratings thereafter.
This report is made in accordance with section 36 of the Child Support, Pensions and Social Security Act 2000.
I am, Sir,
Your obedient Servant,
Christopher Daykin, CB FIA
Government ActuaryNovember 2000
Prepared 11 December 2000

Report on the cost of uprating the basic retirement pension in line with the general level of earnings
LIST OF TABLES AND FIGURES
Table 1.1 - projected balance in the National Insurance Fund at the end of 2005-06, in cash terms and as a percentage ofannual benefit expenditure
Table 4.1 - estimated income and expenditure, and projected balance, of the National Insurance Fund on Assumption 1 -price upratings
Table 4.2 - estimated income and expenditure, and projected balance, of the National Insurance Fund on Assumption 1 -earnings upratings
Figure 4.1 - excess balance at end of year, over minimum recommended level, as a percentage of benefit expenditure - 2000-01 to 2005-06 - Assumption 1
Table 5.1 - estimated income and expenditure, and projected balance, of the National Insurance Fund on Assumption 2 -price upratings
Table 5.2 - estimated income and expenditure, and projected balance, of the National Insurance Fund on Assumption 2 -earnings upratings
Figure 5.1 - excess balance at end of year, over minimum recommended level, as a percentage of benefit expenditure - 2000-01 to 2005-06 - Assumption 2
Figure 6.1 - excess balance at end of year, over minimum recommended level, as a percentage of benefit expenditure - 2000-01 to 2010-11 - Assumption 1
Figure 6.2 - excess balance at end of year, over minimum recommended level, as a percentage of benefit expenditure - 2000-01 to 2010-11 - Assumption 2
Figure 6.3 - estimated Class 1 contribution rates required to balance income and expenditure in the long-term
Table 7.1 - effect on projected balance in the National Insurance Fund at March 2006 of varying assumptions, as apercentage of annual benefit expenditure - price upratings
Table 7.2 - effect on projected balance in the National Insurance Fund at March 2006 of varying assumptions, as apercentage of annual benefit expenditure - earnings upratings
Table 8.1 - comparison of estimates for 2000-01 shown in Sections 4 and 5 with estimates shown in Cm 4587
We welcome your comments on this site.
Report on the cost of uprating the basic retirement pension in line with the general level of earnings
APPENDICES - LIST OF TABLESTable A2.1 - assumed future uprating factors and resulting rates of basic retirement pension - price and earnings upratingbases
Table A2.2 - assumed level of employment, number of self-employed, and annual growth in average earnings
Table A2.3 - assumed future JSA uprating factors and average number of unemployed
Table A3.1 - estimated National Insurance Fund contribution income, split by class of contribution - price upratings,Assumption 1
Table A3.2 - estimated National Insurance Fund contribution income, split by class of contribution - earnings upratings,Assumption 1
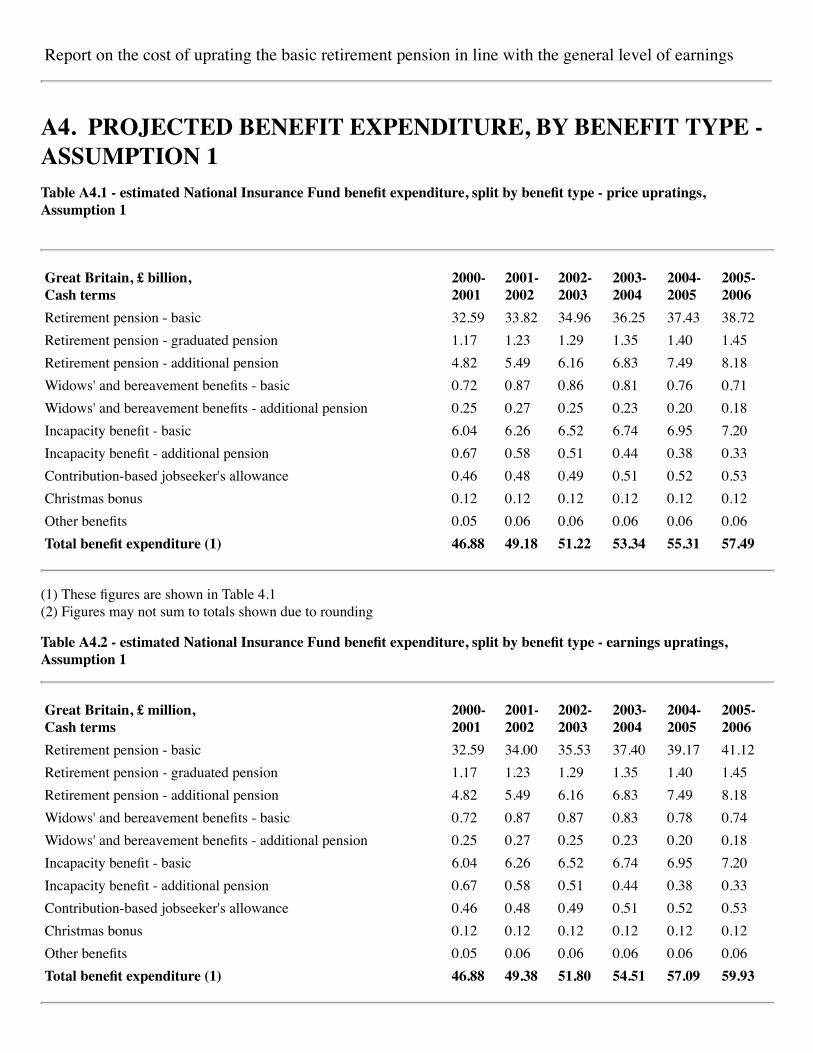
Table A4.1 - estimated National Insurance Fund benefit expenditure, split by benefit type - price upratings, Assumption 1
Table A4.2 - estimated National Insurance Fund benefit expenditure, split by benefit type - earnings upratings, Assumption 1
Table A5.1 - estimated National Insurance Fund contribution income, split by class of contribution - price upratings,Assumption 2
Table A5.2 - estimated National Insurance Fund contribution income, split by class of contribution - earnings upratings,Assumption 2
Table A6.1 - estimated National Insurance Fund benefit expenditure, split by benefit type - price upratings, Assumption 2
Table A6.2 - estimated National Insurance Fund benefit expenditure, split by benefit type - earnings upratings, Assumption 2
We welcome your comments on this site.
Report on the cost of uprating the basic retirement pension in line with the general level of earnings
1. SUMMARY1.1 This report contains projections of the balance in the Great Britain National Insurance Fund in each year up to andincluding 2005-06, with the rate of basic retirement pension being uprated annually either in line with price inflation, or inline with earnings growth. Projections are shown both with and without allowance for the proposal to increase the rate ofbasic retirement pension to £72.50 per week and £75.50 per week from April 2001 and April 2002 respectively, asannounced in the November 2000 Pre-Budget Report.
1.2 Table 1.1 below shows the projected balance in the Fund at the end of 2005-06, both in absolute terms and as apercentage of annual benefit expenditure. These figures are taken from the results shown in Sections 4 and 5 of the report.
Table 1.1 - projected balance in the National Insurance Fund at the end of 2005-06, in cash terms and as a percentageof annual benefit expenditure
Great Britain Cash terms £ billion %Based on current rate of basic pensionPrice upratings from April 2001 29.9 52%Earnings upratings from April 2001 23.6 39%With allowance for the Pre-Budget Report proposalPrice upratings from April 2003 20.2 34%Earnings upratings from April 2003 16.7 27%
1.3 For the projections allowing for the Pre-Budget Report proposal, although the balance in the Fund at March 2006 isabove the minimum recommended level of 17% of benefit expenditure, the balance in the Fund is falling by this point. Itwould be expected that the balance would continue to fall after March 2006, and that either contribution rates would need tobe increased, or a Treasury Grant paid into the Fund, before the end of the decade on both the price and earnings upratingbases. This would need to occur earlier with earnings upratings than with price upratings. This is considered in Section 6.
1.4 Section 6 also shows the National Insurance contribution rates which would be required in order to balance income toand outgo from the National Insurance Fund in the longer-term under both price and earnings upratings. The requiredcontribution rate in 2030-31 is 8% higher with earnings upratings than with price upratings, and by 2060-61 this differencehas increased to 12%.
1.5 The estimates are dependent on many assumptions. Due to the sensitivity of the results to variations in the assumptions,it is important to consider the possible effects on the finances of the Fund of actual experience deviating from theassumptions which have been used for the projections. This is considered in Section 7 of the report.
We welcome your comments on this site.
Report on the cost of uprating the basic retirement pension in line with the general level of earnings
2. INTRODUCTION
2.1 Section 150 of the Social Security Administration Act 1992 requires the Secretary of State for Social Security to reviewthe rates of National Insurance benefits in each tax year. If the general level of prices has risen over the period under review,the Secretary of State must lay a draft order before parliament which increases the benefit rates by at least the increase in thegeneral level of prices.
2.2 Between 1974 and 1980, the rates of flat-rate National Insurance benefits were increased by the greater of the increase inthe general level of prices, and the increase in the general level of earnings. Before 1974, benefit rates had been increased onan ad hoc basis although they remained broadly constant relative to earnings over long time periods. Since 1980, benefit rateshave been increased in line with increases in the general level of prices, with an additional increase of 50 pence per week tothe rate of basic retirement pension in April 1994, to compensate for the extension of VAT to fuel costs.
2.3 Section 36 of the Child Support, Pensions and Social Security Act 2000 requires the Government Actuary, or the DeputyGovernment Actuary, to report to the Secretary of State for Social Security "his opinion on the effect on the level of theNational Insurance Fund, and the effect which might be expected on the rates of contributions, in each year up to andincluding 2005-06 of annual increases in the basic pension by the percentage increase in the general level of earnings…"
2.4 The government has stated its intention to increase the rate of basic retirement pension by £5 per week from April 2001,to £72.50 per week, and by a further £3 per week from April 2002, to £75.50 per week. This report also considers the effectsof these proposals, with both price and earnings upratings from April 2003 onwards.
2.5 The Great Britain National Insurance Scheme is financed on the pay-as-you-go principle, with current rates of NationalInsurance contributions set to produce the income needed to meet current expenditure on benefits and the costs ofadministration, as well as maintaining a reasonable working balance in the Fund. My recommendation is that a level of one-sixth of benefit payments is the minimum level needed to ensure the maintenance of a reasonable working balance in theFund.
2.6 Because the Fund's income and expenditure is not known exactly until the end of each year, and in order to avoidfrequent fluctuations in the rates of contribution, the balance in the Fund at the end of the year will usually exceed theminimum recommended level. If the balance in the Fund falls below the minimum recommended level, legislation providesfor a limited Treasury Grant to be paid into the Fund. Any surplus in the Fund, above the minimum recommended level,could be retained in order to protect the Fund against future adverse experience, or to delay the need for any future increasesin the rates of contribution. Alternatively, it may be considered appropriate to increase the rates of benefit, or to reduce therates of contributions, in order to reduce the surplus in the Fund.
2.7 The approach adopted for this report is to project the future balance in the National Insurance Fund for each year up toand including 2005-06, assuming that contribution rates remain at their current levels (but see paragraph 3.7). Projectionshave been calculated on the following assumptions:
(i) Assumption 1 is that the current rate of basic retirement pension of £67.50 per week is uprated either
· annually in line with increases in the general level of prices from the April 2001 uprating onwards, or
· annually in line with increases in the general level of earnings from the April 2001 uprating onwards.
(ii) Assumption 2 allows for the proposal to increase the rate of basic retirement pension to £72.50 per week and£75.50 per week from April 2001 and April 2002 respectively, as announced in the November 2000 Pre-BudgetReport, with this increased rate being uprated either
· annually in line with increases in the general level of prices from the April 2003 uprating onwards, or
· annually in line with increases in the general level of earnings from the April 2003 uprating onwards.
2.8 The differences between the projected Fund balances on the two different bases indicate, for each assumption, the effecton the National Insurance Fund until 2005-06 of increasing the rate of basic retirement pension in line with the growth in

average earnings rather than in line with price inflation. The results of these projections are shown in Sections 4 and 5 of thisreport. Section 6 considers the longer term effects of increasing the rate of basic retirement pension in line with the growth inaverage earnings. Section 7 considers the effect of variations in the assumptions which have been used for the projections.Section 8 compares the results shown in this report with previous estimates.
We welcome your comments on this site.
Report on the cost of uprating the basic retirement pension in line with the general level of earnings
3. METHODS AND ASSUMPTIONS USED FOR THE PROJECTIONS
3.1 A description of the methods used to project the future income and expenditure of the National Insurance Fund, andhence the balance in the Fund, is given in Appendix A1. Further detail can be found in Appendix D of the latestQuinquennial Review, published as Cm 4406 in July 1999. All of the figures in this report are shown in cash terms, ie not inconstant price terms as in the Quinquennial Review.
3.2 Details of the economic assumptions which have been used in the projections are given in Appendix A2. Comments onother assumptions, and on the details of the structure of National Insurance Contributions and Benefits which have beenassumed to apply in the future are given in the following paragraphs.
3.3 For the projections on the price uprating basis, it has been assumed that the rate of basic retirement pension would beincreased in line with increases in the Retail Price Index (RPI) from the April 2001 or April 2003 uprating onwards, forAssumptions 1 and 2 respectively. The percentage increase in the rate of benefit at each April is assumed to be calculatedusing the annual percentage increase in the RPI to the September of the preceding year.
3.4 For the projections on the earnings uprating basis, it has been assumed that the rate of basic retirement pension would beincreased in line with the growth in average earnings from the April 2001 or April 2003 uprating onwards, for Assumptions1 and 2 respectively. The percentage increase in the rate of benefit at each April is assumed to be calculated by using theaverage of the annual percentage increases in the average earnings index to the May, June and July of the preceding year.This is the basis which is normally used for increasing the Minimum Income Guarantee.
3.5 It has been assumed that if the rate of basic retirement pension were to be uprated in line with the growth in averageearnings, this would apply not only to the personal rates of basic retirement pension but also to increases for adultdependants. For the projections on the earnings uprating basis, it has been assumed that the rates of widows' andbereavement benefits would also be uprated in line with earnings. The rates of widows' and bereavement benefits are linkedto the rate of basic retirement pension in legislation. All other National Insurance Fund benefits, including SERPS, the StateSecond Pension and incapacity benefit are assumed to be uprated in line with current practice, which for most benefits is inline with price inflation.
3.6 For Assumption 2, allowance has been made for the fact that the increases to the rate of basic retirement pension at April2001 and April 2002 will also apply to increases for adult dependants and to bereavement benefits, but not to long-termincapacity benefit.
3.7 It has been assumed that National Insurance contribution rates will remain at the rates which apply in 2000-01, withallowance for the reductions in the rate of secondary (employer) Class 1 contributions to 11.9% from April 2001 and to11.8% from April 2002. These changes were announced in the November 1999 Pre-Budget Report and the March 2000Budget respectively. The rate of Class 3 contributions is assumed to be uprated annually in line with increases in the lowerearnings limit.
3.8 For the projections on the price uprating basis, it has been assumed that contribution limits (such as the lower and upperearnings limits, the lower and upper profits limits, and the primary and secondary thresholds) will be increased annually inline with price inflation.
3.9 For the projections on the earnings uprating basis, it has been assumed that the lower earnings limit and the rate of Class3 contributions will be increased annually in line with the growth in average earnings. The lower earnings limit is fixedrelative to the rate of the basic retirement pension in legislation. However, it has been assumed that all other contributionlimits would continue to be increased annually in line with price inflation. This is because the present government has statedits intention to align the primary and secondary thresholds, and the lower profits limit, to the level of the single person's taxallowance, which is assumed to increase in line with price inflation. The upper earnings limit is linked to the level of theprimary threshold in legislation. These assumptions would result in the lower earnings limit eventually exceeding theprimary and secondary thresholds on the earnings uprating basis, but this would not happen in the period covered by thisreport on the assumptions which have been used.
3.10 For Assumption 2, allowance has been made for the consequential increases to the lower earnings limit as a result of

increasing the rate of basic retirement pension from April 2001 and April 2002.
3.11 The rates of contracted-out rebates to apply from April 2002 until April 2007 have yet to be finalised. I have issued aconsultative note on the assumptions to be used in calculating these rebate rates. This consultative note also specifies therebate rates which would apply from 2002-03 to 2006-07 if the proposed assumptions were to be adopted. For the purposesof this report, I have assumed that these rebate rates will apply. The effects on the projected Fund balance if other rebate rateswere to be adopted are shown in Section 7.
3.12 The changes to widows' benefits and incapacity benefit and the introduction of Stakeholder Pensions resulting from theWelfare Reform and Pensions Act 1999 have been allowed for in the estimates. The assumed additional level of contractingout following the introduction of Stakeholder Pensions is 0.5 million people in 2001-02, increasing by 0.25 million each yearuntil 2005-06, all of whom are assumed to be under age 50 in 2001-02, 51 in 2002-03, etc. These numbers are in addition toany people who are currently contracted out through an Appropriate Personal Pension but who may switch to beingcontracted out through a Stakeholder Pension after April 2001. The effects on the projected Fund balance of varying theassumed level of additional contracting out are shown in Section 7. It has been assumed that the State Second Pension (S2P),as introduced by the Child Support, Pensions and Social Security Act 2000, will apply for accruals from 2002-03 onwards.
3.13 Section 39 of the Child Support, Pensions and Social Security Act 2000 specifies that, where a spouse dies on or before5th October 2002, surviving widows or widowers will inherit 100% of their deceased spouse's SERPS. Where a spouse dieson or after 6th October 2002, surviving widows or widowers will inherit 50% of their deceased spouse's SERPS or S2P.However, a compensation scheme will be introduced in order to compensate couples who were wrongly advised of thereduction to inherited SERPS. For the purposes of this report, it has been assumed that in 30% of the cases where a spousedies on or after 6th October 2002, surviving widows or widowers will be able to inherit 100% of the deceased spouse'sSERPS, for SERPS accrued before April 2002, as a result of a successful compensation claim, and that these amounts will bepaid from the National Insurance Fund.
We welcome your comments on this site.

Report on the cost of uprating the basic retirement pension in line with the general level of earnings
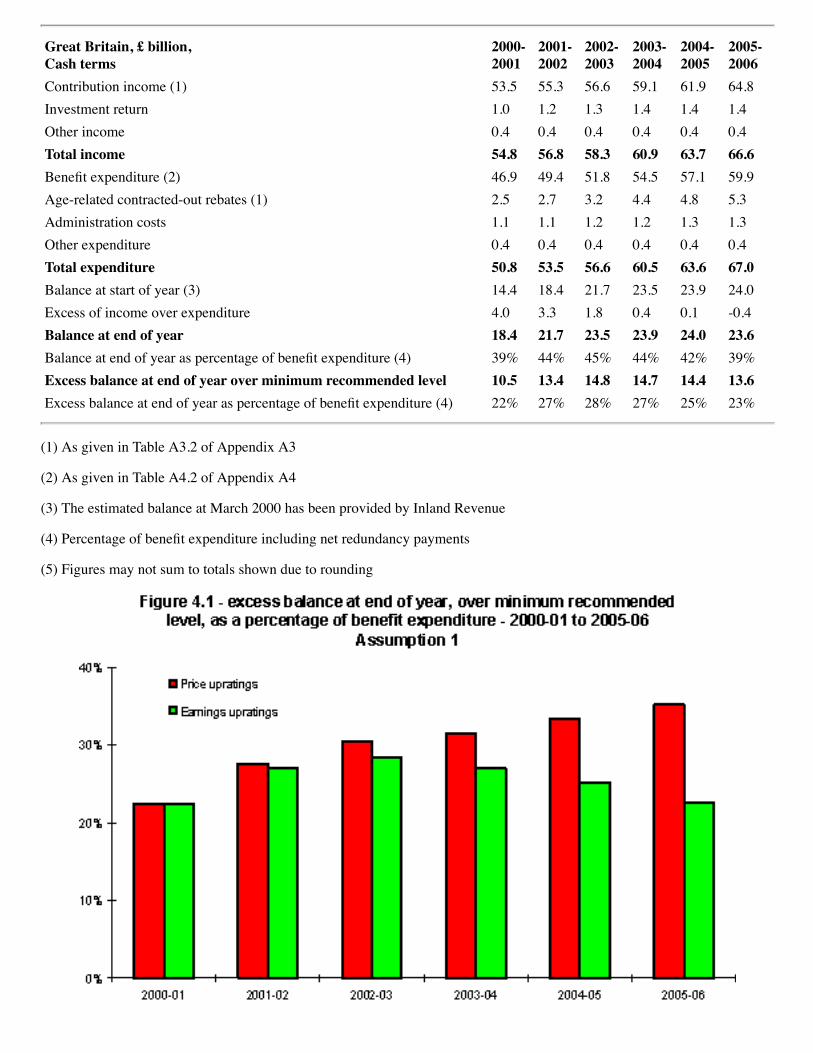
4. PROJECTED BALANCE IN THE NATIONAL INSURANCEFUND ON ASSUMPTION 14.1 Tables 4.1 and 4.2 below show the projected income and expenditure of the National Insurance Fund in each year from2000-01 to 2005-06, and the estimated balance in the Fund at the start and end of each year, on Assumption 1. Assumption 1is that the current rate of the basic retirement pension, £67.50 per week, is uprated annually in line with either prices orearnings from April 2001 onwards. Table 4.1 assumes that the rate of basic retirement pension is increased annually in linewith price inflation. Table 4.2 below shows the equivalent table, assuming that the rate of basic retirement pension isincreased annually in line with the growth in average earnings. The projected excess balances in the Fund over the minimumrecommended level, on both the price uprating and earnings uprating bases, are also shown in Figure 4.1. Appendices A3and A4 contain further details of the projected contribution income and benefit expenditure respectively.
Table 4.1 - estimated income and expenditure, and projected balance, of the National Insurance Fund on Assumption1 - price upratings
Great Britain, £ billion,
Cash terms
2000- 2001
2001- 2002
2002- 2003
2003- 2004
2004- 2005
2005- 2006
Contribution income (1) 53.5 55.3 56.6 59.1 61.9 64.7Investment return 1.0 1.2 1.3 1.5 1.6 1.7Other income 0.4 0.4 0.4 0.4 0.4 0.4Total income 54.8 56.8 58.3 60.9 63.8 66.8Benefit expenditure (2) 46.9 49.2 51.2 53.3 55.3 57.5Age-related contracted-out rebates (1) 2.5 2.7 3.2 4.4 4.9 5.4Administration costs 1.1 1.1 1.2 1.2 1.3 1.3Other expenditure 0.4 0.4 0.4 0.4 0.4 0.4Total expenditure 50.8 53.3 56.0 59.3 61.9 64.6Balance at start of year (3) 14.4 18.4 21.9 24.2 25.8 27.7Excess of income over expenditure 4.0 3.5 2.3 1.6 1.9 2.2Balance at end of year 18.4 21.9 24.2 25.8 27.7 29.9Balance at end of year as percentage of benefit expenditure (4) 39% 44% 47% 48% 50% 52%Excess balance at end of year over minimum recommended level 10.5 13.6 15.6 16.9 18.5 20.3Excess balance at end of year as percentage of benefit expenditure (4) 22% 28% 30% 32% 33% 35%
(1) As given in Table A3.1 of Appendix A3
(2) As given in Table A4.1 of Appendix A4
(3) The estimated balance at March 2000 has been provided by Inland Revenue
(4) Percentage of benefit expenditure including net redundancy payments
(5) Figures may not sum to totals shown due to rounding
Table 4.2 - estimated income and expenditure, and projected balance, of the National Insurance Fund on Assumption1 - earnings upratings
Great Britain, £ billion, Cash terms
2000- 2001
2001- 2002
2002- 2003
2003- 2004
2004- 2005
2005- 2006
Contribution income (1) 53.5 55.3 56.6 59.1 61.9 64.8Investment return 1.0 1.2 1.3 1.4 1.4 1.4Other income 0.4 0.4 0.4 0.4 0.4 0.4Total income 54.8 56.8 58.3 60.9 63.7 66.6Benefit expenditure (2) 46.9 49.4 51.8 54.5 57.1 59.9Age-related contracted-out rebates (1) 2.5 2.7 3.2 4.4 4.8 5.3Administration costs 1.1 1.1 1.2 1.2 1.3 1.3Other expenditure 0.4 0.4 0.4 0.4 0.4 0.4Total expenditure 50.8 53.5 56.6 60.5 63.6 67.0Balance at start of year (3) 14.4 18.4 21.7 23.5 23.9 24.0Excess of income over expenditure 4.0 3.3 1.8 0.4 0.1 -0.4Balance at end of year 18.4 21.7 23.5 23.9 24.0 23.6Balance at end of year as percentage of benefit expenditure (4) 39% 44% 45% 44% 42% 39%Excess balance at end of year over minimum recommended level 10.5 13.4 14.8 14.7 14.4 13.6Excess balance at end of year as percentage of benefit expenditure (4) 22% 27% 28% 27% 25% 23%
(1) As given in Table A3.2 of Appendix A3
(2) As given in Table A4.2 of Appendix A4
(3) The estimated balance at March 2000 has been provided by Inland Revenue
(4) Percentage of benefit expenditure including net redundancy payments
(5) Figures may not sum to totals shown due to rounding

4.2 The results for 2000-01 are the same in both Tables 4.1 and 4.2, since the contribution limits and benefit rates havealready been specified for this year. It has been assumed that if the rate of basic retirement pension were to be uprated in linewith the growth in average earnings, this would apply from the April 2001 uprating onwards.
4.3 The results for 2000-01 can be compared with the projections shown in the report on the April 2000 up-rating and re-rating orders, published as Cm 4587 in January 2000. A comparison of the two sets of results is given in Section 8 of thisreport.
4.4 Table 4.1 shows that the estimated balance in the National Insurance Fund at the end of the current year, 2000-01, is£18.4 billion, or 39% of annual benefit expenditure. Between March 2001 and March 2006, this is projected to increase to£29.9 billion, or 52% of annual benefit expenditure, on the price uprating basis. The reasons for this projected increase in thebalance of the Fund are:
· In 2000-01, income exceeds expenditure by £4.0 billion.
· Between 2000-01 and 2005-06, contribution income increases broadly in line with the assumed growth in averageearnings.
· Between 2000-01 and 2005-06, benefit expenditure also increases broadly in line with the assumed growth inaverage earnings, at a greater rate than the assumed increases to the rate of basic retirement pension. The two mainreasons for this are the maturing of SERPS, and the increase in the number of pensioners.
· Expenditure on age-related rebates increases significantly over the period, due to the introduction of S2P, theassumed increase in contracting out resulting from the introduction of Stakeholder Pensions in 2001-02, and theassumed increase in rebates rates applying from April 2002.
· Investment return increases over the period due to the increasing balance in the Fund.
· The combination of all of these factors means that the excess of income over expenditure in each year is projectedto fall to £1.6 billion in 2003-04 before increasing again to £2.2 billion in 2005-06. Therefore, the projected balancein the Fund increases by between £1.6 billion and £4.0 billion each year.
4.5 Table 4.2 shows that the balance in the National Insurance Fund is projected to increase from £18.4 billion at March2001 to £24.0 billion at March 2005, before falling to £23.6 billion at March 2006, on the earnings uprating basis. Thebalance as a percentage of annual benefit expenditure is projected to increase from 39% in March 2001 to 45% in March2003, before falling to 39% in March 2006. The excess of income over expenditure falls from £4.0 billion in 2000-01 to £0.1billion in 2004-05, before becoming negative in 2005-06. If the projections were extended beyond 2005-06, it is likely thatthe balance in the Fund as a percentage of annual benefit expenditure would continue to fall. This is considered further inSection 6.
4.6 The results from Tables 4.1 and 4.2 indicate that the projected balance in the Fund at the end of 2005-06 on Assumption1, assuming that contribution rates remain at their current levels, is significantly greater than the minimum recommendedlevel of one-sixth (17%) of annual benefit expenditure. This is the case whether the rate of basic retirement pension isuprated in line with either price inflation or earnings growth.
4.7 The assumed weekly rate of the basic retirement pension in 2005-06, as given in Table A2.1 of Appendix A2, is £77.30on the price uprating basis, and £82.15 on the earnings uprating basis. Expenditure on income-related benefits, such as theMinimum Income Guarantee, would be lower with earnings upratings of the basic retirement pension than with priceupratings. Since income-related benefits are not paid out of the National Insurance Fund, these consequential savings havenot been considered in this report. Increased income tax revenues which would result from increasing the rate of basicretirement pension in line with average earnings growth have not been considered in this report either as they do not affectthe finances of the National Insurance Fund.
4.8 The results shown in Tables 4.1 and 4.2 are dependent on many assumptions which have been made. The projectedbalance in the Fund is very sensitive to even small changes in these assumptions. The excess of income over expenditure ineach year is the difference between two very large numbers: the Fund's income and the Fund's expenditure. A smallpercentage change in the projected income or expenditure in any year can result in a large percentage change in the excess ofincome over expenditure.

4.9 It is therefore important to consider the effects on the results of variations in the assumptions in order to be aware of thepotential consequences on the finances of the National Insurance Fund if actual experience does not follow the assumptionsmade for this report. The effects on the projections of varying the most important assumptions are shown in Section 7.
We welcome your comments on this site.
Report on the cost of uprating the basic retirement pension in line with the general level of earnings
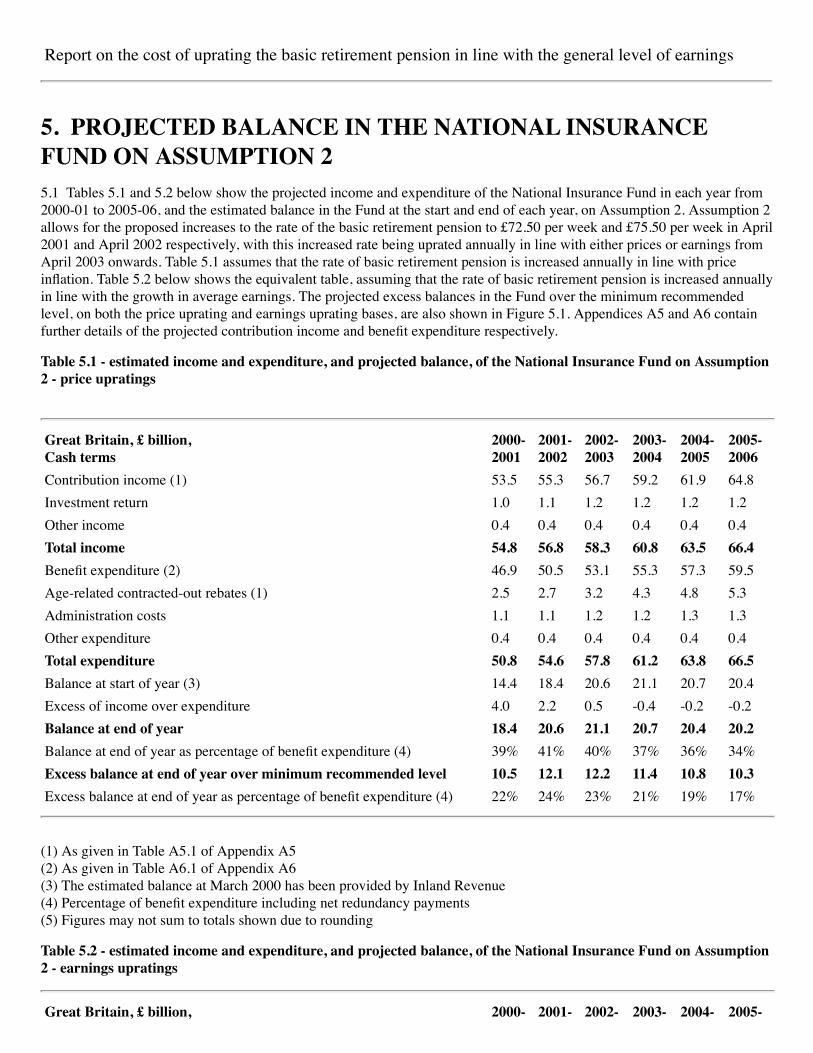
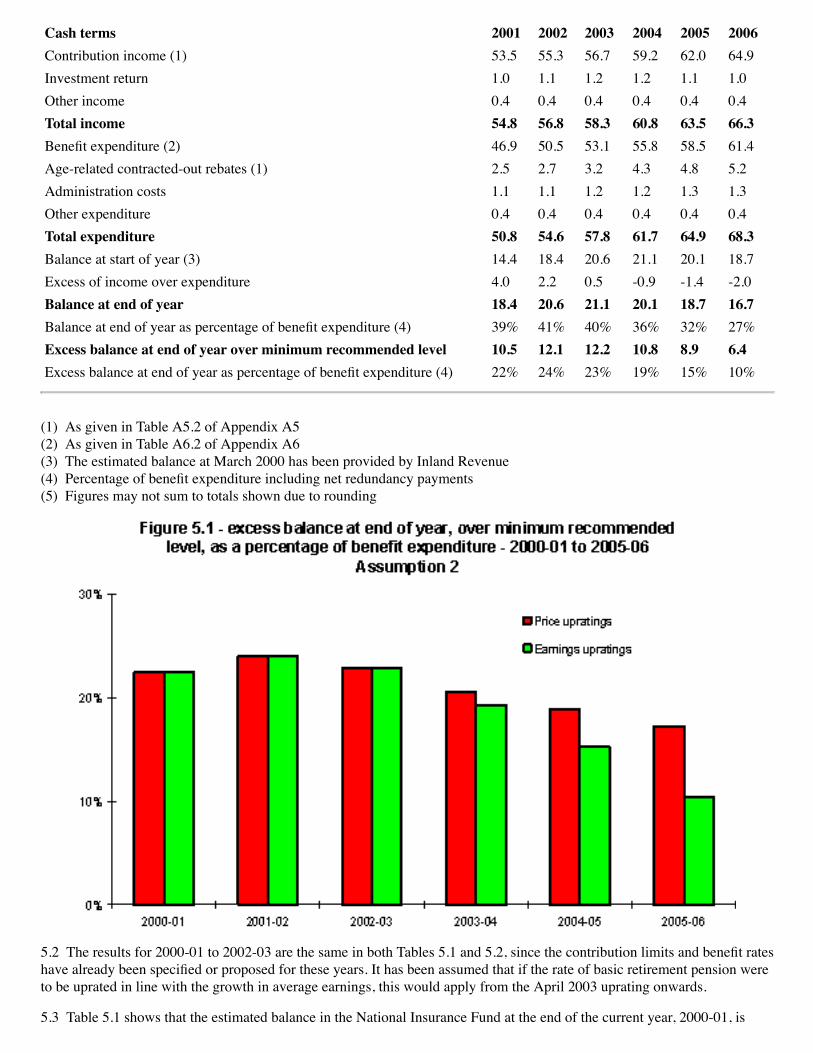
5. PROJECTED BALANCE IN THE NATIONAL INSURANCEFUND ON ASSUMPTION 25.1 Tables 5.1 and 5.2 below show the projected income and expenditure of the National Insurance Fund in each year from2000-01 to 2005-06, and the estimated balance in the Fund at the start and end of each year, on Assumption 2. Assumption 2allows for the proposed increases to the rate of the basic retirement pension to £72.50 per week and £75.50 per week in April2001 and April 2002 respectively, with this increased rate being uprated annually in line with either prices or earnings fromApril 2003 onwards. Table 5.1 assumes that the rate of basic retirement pension is increased annually in line with priceinflation. Table 5.2 below shows the equivalent table, assuming that the rate of basic retirement pension is increased annuallyin line with the growth in average earnings. The projected excess balances in the Fund over the minimum recommendedlevel, on both the price uprating and earnings uprating bases, are also shown in Figure 5.1. Appendices A5 and A6 containfurther details of the projected contribution income and benefit expenditure respectively.
Table 5.1 - estimated income and expenditure, and projected balance, of the National Insurance Fund on Assumption2 - price upratings
Great Britain, £ billion, Cash terms
2000- 2001
2001- 2002
2002- 2003
2003- 2004
2004- 2005
2005- 2006
Contribution income (1) 53.5 55.3 56.7 59.2 61.9 64.8Investment return 1.0 1.1 1.2 1.2 1.2 1.2Other income 0.4 0.4 0.4 0.4 0.4 0.4Total income 54.8 56.8 58.3 60.8 63.5 66.4Benefit expenditure (2) 46.9 50.5 53.1 55.3 57.3 59.5Age-related contracted-out rebates (1) 2.5 2.7 3.2 4.3 4.8 5.3Administration costs 1.1 1.1 1.2 1.2 1.3 1.3Other expenditure 0.4 0.4 0.4 0.4 0.4 0.4Total expenditure 50.8 54.6 57.8 61.2 63.8 66.5Balance at start of year (3) 14.4 18.4 20.6 21.1 20.7 20.4Excess of income over expenditure 4.0 2.2 0.5 -0.4 -0.2 -0.2Balance at end of year 18.4 20.6 21.1 20.7 20.4 20.2Balance at end of year as percentage of benefit expenditure (4) 39% 41% 40% 37% 36% 34%Excess balance at end of year over minimum recommended level 10.5 12.1 12.2 11.4 10.8 10.3Excess balance at end of year as percentage of benefit expenditure (4) 22% 24% 23% 21% 19% 17%
(1) As given in Table A5.1 of Appendix A5 (2) As given in Table A6.1 of Appendix A6 (3) The estimated balance at March 2000 has been provided by Inland Revenue (4) Percentage of benefit expenditure including net redundancy payments (5) Figures may not sum to totals shown due to rounding
Table 5.2 - estimated income and expenditure, and projected balance, of the National Insurance Fund on Assumption2 - earnings upratings
Great Britain, £ billion, 2000- 2001- 2002- 2003- 2004- 2005-
Cash terms 2001 2002 2003 2004 2005 2006Contribution income (1) 53.5 55.3 56.7 59.2 62.0 64.9Investment return 1.0 1.1 1.2 1.2 1.1 1.0Other income 0.4 0.4 0.4 0.4 0.4 0.4Total income 54.8 56.8 58.3 60.8 63.5 66.3Benefit expenditure (2) 46.9 50.5 53.1 55.8 58.5 61.4Age-related contracted-out rebates (1) 2.5 2.7 3.2 4.3 4.8 5.2Administration costs 1.1 1.1 1.2 1.2 1.3 1.3Other expenditure 0.4 0.4 0.4 0.4 0.4 0.4Total expenditure 50.8 54.6 57.8 61.7 64.9 68.3Balance at start of year (3) 14.4 18.4 20.6 21.1 20.1 18.7Excess of income over expenditure 4.0 2.2 0.5 -0.9 -1.4 -2.0Balance at end of year 18.4 20.6 21.1 20.1 18.7 16.7Balance at end of year as percentage of benefit expenditure (4) 39% 41% 40% 36% 32% 27%Excess balance at end of year over minimum recommended level 10.5 12.1 12.2 10.8 8.9 6.4Excess balance at end of year as percentage of benefit expenditure (4) 22% 24% 23% 19% 15% 10%
(1) As given in Table A5.2 of Appendix A5 (2) As given in Table A6.2 of Appendix A6 (3) The estimated balance at March 2000 has been provided by Inland Revenue (4) Percentage of benefit expenditure including net redundancy payments (5) Figures may not sum to totals shown due to rounding
5.2 The results for 2000-01 to 2002-03 are the same in both Tables 5.1 and 5.2, since the contribution limits and benefit rateshave already been specified or proposed for these years. It has been assumed that if the rate of basic retirement pension wereto be uprated in line with the growth in average earnings, this would apply from the April 2003 uprating onwards.
5.3 Table 5.1 shows that the estimated balance in the National Insurance Fund at the end of the current year, 2000-01, is
£18.4 billion. This is projected to increase to £21.1 billion by March 2003 before falling to £20.2 billion by March 2006. Asa percentage of annual benefit expenditure, the estimated balance in the Fund is projected to increase from 39% at the end ofthe current year to 41% at the end of next year, 2001-02, before falling to 34% by March 2006.
5.4 Comparing these results with those shown for Assumption 1 in Table 4.1, benefit expenditure is between £1.3 billion and£2.0 billion higher in Table 5.1 than in Table 4.1, as a result of the proposed extra increases to the rate of basic retirementpension from April 2001 and April 2002. Contribution income is also slightly higher on Assumption 2, as the higher rate ofbasic retirement pension means that the lower earnings limit for contributions is also higher. This reduces contracted outrebates without reducing the main contribution income, leading to a small increase in net contribution income.
5.5 Table 5.2 shows that the balance in the National Insurance Fund is projected to increase from £18.4 billion at March2001 to £21.1 billion at March 2003, before falling to £16.7 billion at March 2006, on the earnings uprating basis. Thebalance as a percentage of annual benefit expenditure is projected to increase from 39% in March 2001 to 41% in March2002, before falling to 27% in March 2006.
5.6 Comparing these results with those shown for Assumption 1 in Table 4.2, benefit expenditure is between £1.1 billion and£1.5 billion higher in Table 5.2 than in Table 4.2, as a result of the proposed extra increases to the rate of basic retirementpension from April 2001 and April 2002. Contribution income is also slightly higher on Assumption 2, for the same reasonsas those given in paragraph 5.4.
5.7 For Assumption 2, on both the price and earnings upratings bases, if the projections were extended beyond 2005-06, it islikely that the balance in the Fund, both in absolute terms and as a percentage of annual benefit expenditure, would continueto fall. This is considered further in Section 6.
5.8 The results from Tables 5.1 and 5.2 indicate that the projected balance in the Fund at the end of 2005-06 on Assumption2, assuming that contribution rates remain at their current levels, is significantly greater than the minimum recommendedlevel of one-sixth (17%) of annual benefit expenditure. This is the case whether the rate of basic retirement pension isuprated in line with either price inflation or earnings growth.
5.9 The assumed weekly rate of the basic retirement pension in 2005-06, as given in Table A2.1 of Appendix A2, is £81.35on the price uprating basis, and £85.00 on the earnings uprating basis.
5.10 The comments made in paragraphs 4.7 to 4.9 above on Assumption 1 apply equally to Assumption 2.
We welcome your comments on this site.

Report on the cost of uprating the basic retirement pension in line with the general level of earnings
6. EFFECTS ON THE LONGER-TERM FINANCES OF THENATIONAL INSURANCE FUND6.1 If the rate of basic retirement pension were to be uprated every year in line with the growth in average earnings ratherthan in line with price inflation, there would be consequential effects on the longer-term financial position of the NationalInsurance Fund. This would occur whether or not the higher rates of basic retirement pension proposed by the government totake effect in April 2001 and April 2002 were to be implemented.
6.2 Figures 6.1 and 6.2 below show the projected excess balance in the National Insurance Fund, over the minimumrecommended level, at the end of each year from 2000-01 to 2010-11 for Assumptions 1 and 2 respectively, based on currentcontribution rates. Figure 6.1 is an extension of Figure 4.1, assuming that the current rate of basic retirement pension isuprated in line with either prices or earnings from the April 2001 uprating onwards, and Figure 6.2 is an extension of Figure5.1, allowing for the proposal to increase the rate of basic retirement pension to £72.50 from April 2001 and to £75.50 fromApril 2002, with either price or earnings upratings from April 2003 onwards.

6.3 Considering first the projections on the price uprating basis, Figure 6.1 shows that if the projections on Assumption 1, asshown in Table 4.1, were to be extended beyond 2005-06 on the same assumptions, it is likely that the projected balance inthe Fund as a percentage of annual benefit expenditure would start to fall before the end of the decade. The projected balanceat March 2011 would be significantly above the minimum recommended level. Figure 6.2 shows that if the projections onAssumption 2, as shown in Table 5.1, were to be extended beyond 2005-06 on the same assumptions, it is likely that theprojected balance in the Fund as a percentage of annual benefit expenditure would continue to fall. It is likely thatcontribution rates would need to be increased, or a Treasury Grant paid into the Fund, from around 2009-10, in order toprevent the balance in the Fund from falling below the minimum recommended level.
6.4 If the projections on the earnings uprating basis, as shown in Tables 4.2 and 5.2, were to be extended beyond 2005-06 onthe same assumptions, the projected balance in the Fund, both in absolute terms and as a percentage of annual benefitexpenditure, would be likely to continue to decrease, on both Assumptions 1 and 2. It would be expected that NationalInsurance contribution rates would need to be increased, or a Treasury Grant paid into the Fund, in every year from somefuture year, in order to prevent the balance in the Fund from falling below the minimum recommended level. On Assumption1 the first year in which an increase would be likely is 2009-10, and on Assumption 2 it is 2007-08.
6.5 The precise point at which contribution rates would need to be increased, and the amount by which they would have torise, are subject to considerable uncertainty. Projections of the finances of the National Insurance Fund become moreuncertain the further into the future they go. In addition, the finances of the Fund in the second half of this decade willdepend heavily on the date at which the State Second Pension moves to a flat-rate structure under Stage 2, and on the rates ofcontracted-out rebates which will apply from April 2007 onwards.
6.6 Long-term financial estimates of the National Insurance Fund which were published in the latest Quinquennial Review,published as Cm 4406 in July 1999, and in my report on the Child Support, Pensions and Social Security Bill 1999,published as Cm 4573 in January 2000, can be used in order to consider the long-term effects on the finances of the NationalInsurance Fund of annually uprating flat-rate benefits in line with earnings.
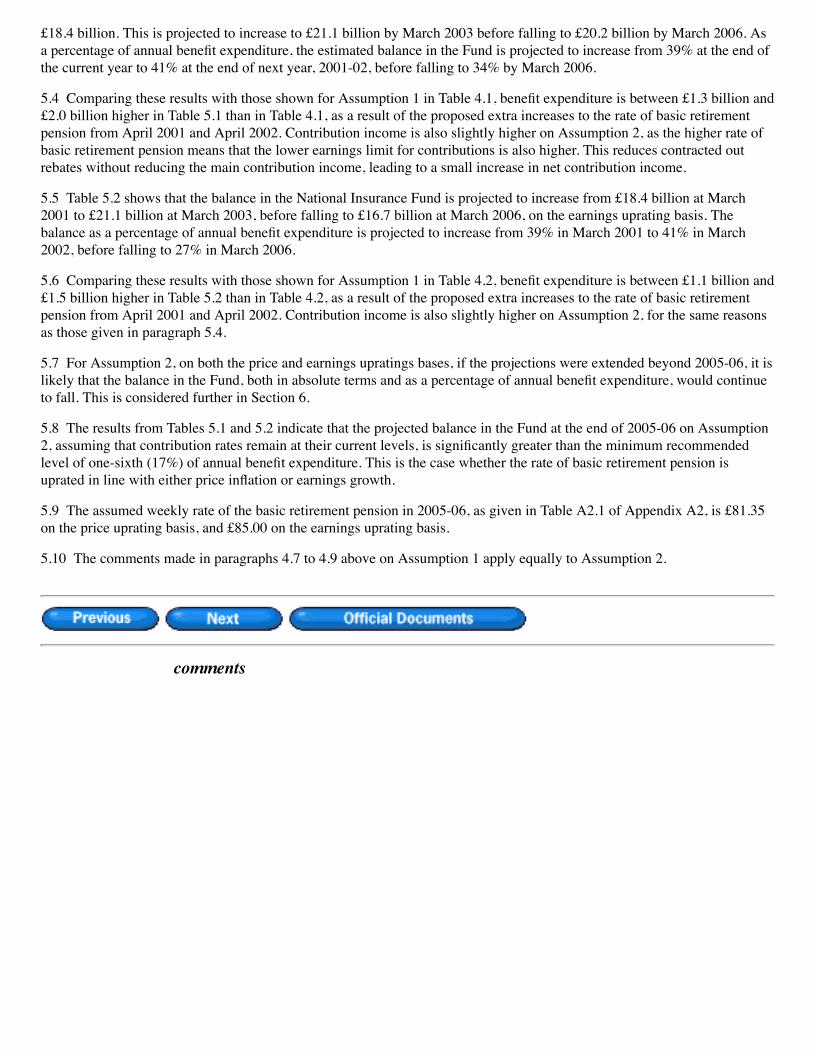
6.7 Figure 6.3 below shows the estimated joint employee and employer Class 1 contribution rates which would be requiredin the future in order to balance income and expenditure of the National Insurance Fund, under both price and earningsupratings. These contribution rates are before any deductions for contracting out, and exclude the part of contributions whichis allocated to the National Health Service. They can be compared with a current contribution rate in 2000-01 of 20.25%,comprising 10% total primary (employee) contribution rate, plus 12.2% total secondary (employer) contribution rate, less1.95% of contributions allocated to the National Health Service.
6.8 The contribution rates which are shown for price upratings in Figure 6.3 are taken from the last column of Table 3.3 inthe Report on the Child Support, Pensions and Social Security Bill 1999. The latest Quinquennial Review contains estimatesof contribution rates required in the future on both price uprating and earnings uprating bases. However, the estimates in thatreport do not allow for the effects of the Welfare Reform and Pensions Act 1999 or the Child Support, Pensions and SocialSecurity Act 2000. The contribution rates which are shown for earnings upratings in Figure 6.3 have been calculated byadjusting the results in the Quinquennial Review to allow for these legislative changes, to be consistent with the priceupratings figures.
6.9 The projections shown in Figure 6.3 assume that the State Second Pension moves to a flat-rate Stage 2 structure in 2006-07, at which point all employees earning above the low earnings threshold, who would not otherwise be contracted out, willcontract out into Stakeholder Pensions. Further details on the other assumptions and methods used for these projections aregiven in the Quinquennial Review and the Report on the Child Support, Pensions and Social Security Bill 1999.
6.10 The results shown in Figure 6.3 were calculated on different assumptions to those underlying the results in Sections 4and 5, and are therefore not directly comparable. However, this does not affect the broad conclusions which can be drawnfrom Figure 6.3.
6.11 On the price uprating basis, the estimated required joint employee and employer contribution rates remain at aroundtheir current levels until 2040-41, before falling to 17.4% by 2060-61. This occurs despite a projected 35% increase in theprojected number of pensioners per contributor over this period. If flat-rate benefit rates were to be uprated in every futureyear in line with the growth in average earnings, the estimated required joint employee and employer contribution ratesincrease to 22.7% by 2010-11, and to 29.6% by 2060-61. These increases should be viewed in light of the expected increasesin the standard of living over the next 60 years which would result from real earnings growth of 1.5% per annum. Even withhigher contribution rates, real net income would still be significantly higher in 2060 than it is now.
6.12 The contribution rates in Figure 6.3 reflect Assumption 1. For Assumption 2, in the longer term, the contribution rateswould be approximately 0.5% higher for price uprating and 0.75% higher for earnings uprating.
6.13 The rate of the basic retirement pension in 2060-61, if flat-rate benefit rates were to be uprated in line with priceinflation, is estimated to be approximately £28 per week in current earnings terms. This compares with the current rate of£67.50 per week.
6.14 When considering these long-term estimates, it is important to consider the uncertainties involved, and the sensitivitiesof the results to changes in the assumptions. A detailed sensitivity analysis is given in Section 8 of the Quinquennial Review,

although this does not allow for the effects of the Welfare Reform and Pensions Act 1999 or the Child Support, Pensions andSocial Security Act 2000. As a broad indication, the effect on the estimated required contribution rates in 2060-61 of using apopulation projection with lower mortality and lower fertility assumptions would be an increase of around 3.5% on the priceuprating basis, or an increase of around 6.0% on the earnings uprating basis.
We welcome your comments on this site.

Report on the cost of uprating the basic retirement pension in line with the general level of earnings
7. EFFECTS OF VARIATIONS IN ASSUMPTIONS 7.1 The projections of the balance in the National Insurance Fund which are shown in Sections 4 and 5 depend on manyassumptions. The assumptions used are detailed in Section 3 and Appendix A2, and include:
· Economic assumptions, including the rates of price inflation and average earnings growth, the levels ofemployment and unemployment, and the rate of investment return.
· Demographic assumptions, including mortality and disability rates, the age structure of the working population,and the number of pensioners.
· Legislative assumptions, such as rates of contracted-out rebates to apply from April 2002, and the earnings limitsfor National Insurance Contributions which would apply if benefit rates were to be uprated in line with the growthin average earnings.
· Behavioural assumptions, such as the rate of successful claims under the inherited SERPS compensation scheme,and the level of contracting out, especially any increase in the number of people contracting out after April 2001which may result from the introduction of Stakeholder Pensions.
7.2 As noted in paragraph 4.8, the projected balance in the Fund is very sensitive to even small changes in the assumptions.A small percentage change in the projected income or expenditure in any year can result in a large percentage change in theexcess of income over expenditure, and hence in the projected balance in the Fund.
7.3 The results shown in Sections 4 and 5 should not be considered to be a certain prediction of the future balances in theFund. Instead, they should be regarded as an indication of the likely future balances in the Fund, if experience were to followthe assumptions made. When studying the results shown in this report, it is important to consider the potential effects on thefinances of the Fund if actual experience differs from the assumptions which have been made for the projections.
7.4 Table 7.1 below shows the approximate effects of varying the principal assumptions on the projected balance in the Fundat March 2006 as a percentage of benefit expenditure, assuming that the rate of basic retirement pension is uprated in linewith price inflation. The results shown in Table 7.1 can be used to adjust the results of the main projections on the priceuprating basis which are shown in Tables 4.1 and 5.1 to illustrate the effect of different assumptions. These results have beencalculated on the basis of Assumption 1, although it may be expected that the effects on the projections on Assumption 2 ofvarying the assumptions would be broadly similar.
Table 7.1 - effect on projected balance in the National Insurance Fund at March 2006 of varying assumptions, as apercentage of annual benefit expenditure - price upratings
Great Britain March2006
Increase or decrease in projected balance arising from:Real earnings growth + 0.5% from April 2002 +8%Price inflation + 0.5% pa from the April 2002 uprating onwards, with 1.5% pa real earnings growth +2%Price inflation - 0.5% pa from the April 2002 uprating onwards, with 1.5% pa real earnings growth -1%Employment 0.25m higher in 2001-02 and 0.5m higher from 2002-03 onwards +10%Employment 0.25m lower in 2001-02 and 0.5m lower from 2002-03 onwards -10%Contracted-out rebate rates 5% higher from April 2002 onwards -4%Contracted-out rebate rates 5% lower from April 2002 onwards +4%

Assumed additional contracting out following the introduction of Stakeholder Pensions being 3 million eachyear
-17%
No assumed additional contracting out following the introduction of Stakeholder Pensions +7%Investment return 1% higher from 2001-02 onwards +2%Investment return 1% lower from 2001-02 onwards -2%
7.5 Table 7.2 below shows the approximate effects of varying the principal assumptions on the projected balance in the Fundat March 2006 as a percentage of benefit expenditure, assuming that the rate of basic retirement pension is uprated in linewith earnings inflation. The results shown in Table 7.2 can be used to adjust the results of the main projections on theearnings uprating basis which are shown in Tables 4.2 and 5.2 to illustrate the effect of different assumptions. These resultshave been calculated on the basis of Assumption 1, although it may be expected that the effects on the projections onAssumption 2 of varying the assumptions would be broadly similar.
Table 7.2 - effect on projected balance in the National Insurance Fund at March 2006 of varying assumptions, as apercentage of annual benefit expenditure - earnings upratings
Great Britain March2006
Increase or decrease in projected balance arising from:Real earnings growth + 0.5% from April 2002 +4%Price inflation + 0.5% pa from the April 2002 uprating onwards, with 1.5% pa real earnings growth +2%Price inflation - 0.5% pa from the April 2002 uprating onwards, with 1.5% pa real earnings growth -1%Employment 0.25m higher in 2001-02 and 0.5m higher from 2002-03 onwards +9%Employment 0.25m lower in 2001-02 and 0.5m lower from 2002-03 onwards -9%Contracted-out rebate rates 5% higher from April 2002 onwards -4%Contracted-out rebate rates 5% lower from April 2002 onwards +4%Assumed additional contracting out following the introduction of Stakeholder Pensions being 3 million eachyear
-16%
No assumed additional contracting out following the introduction of Stakeholder Pensions +7%Investment return 1% higher from 2001-02 onwards +2%Investment return 1% lower from 2001-02 onwards -2%
7.6 The effects shown in Tables 7.1 and 7.2 are considered in isolation, varying one assumption at a time. Combinations ofchanges in assumptions would lead to results which are even higher or lower than those which are shown in the two tables.As a first approximation, the effects of a combination of changes to different assumptions could be considered to be broadlyadditive. The assumptions which have been considered are those to which the results are expected to be most sensitive.However, the variations which are illustrated, and the effects which they have on the results, cannot be considered to beminimum or maximum limits. More extreme results are possible.
We welcome your comments on this site.

Report on the cost of uprating the basic retirement pension in line with the general level of earnings
8. COMPARISON OF ESTIMATES IN THIS REPORT WITHPREVIOUS ESTIMATES8.1 The projected income and expenditure of the National Insurance Fund in 2000-01, and the estimated balance in the Fundat March 2001, which are shown in this report, can be compared with the estimates which were shown in the report on theApril 2000 up-rating and re-rating orders, published as Cm 4587 in January 2000. Table 8.1 below shows a comparison ofthese two sets of results.
Table 8.1 - comparison of estimates for 2000-01 shown in Sections 4 and 5 with estimates shown in Cm 4587
Great Britain, £ billion, Cash terms
2000-01 estimates in this report (1) 2000-01 estimates in Cm 4587
Contribution income (2) 53.5 52.8Investment return 1.0 0.9Other income 0.4 0.4Total income 54.8 54.0Benefit expenditure 46.9 47.0Age-related contracted-out rebates 2.5 2.7Administration costs 1.1 1.1Other expenditure 0.4 0.4Total expenditure 50.8 51.2Balance at start of year 14.4 13.8Excess of income over expenditure 4.0 2.9Balance at end of year 18.4 16.7
(1) As given in Table 4.1 (2) In Cm 4587, this figure is the sum of net contribution receipts and compensation from the Consolidated Fund for SSP,SMP and NIC holidays (3) Figures may not sum to totals shown due to rounding
8.2 The current estimate of contribution income is £0.7 billion higher than that shown in the report on the April 2000 up-rating and re-rating orders. Almost all of this increase arises from an increase in the estimate of Class 1 contributions. This ispartly due to data on Class 1 receipts during 1999-2000 showing higher receipts than had previously been estimated, withestimates for future years being adjusted to take account of this. The remainder of the difference arises due to changes in theeconomic assumptions used, with an increased number of employees now being assumed.
8.3 Estimates of other classes of contribution are similar to those shown in Cm 4587. Class 1A receipts are now estimated tobe slightly lower than previous estimates, due to revised estimates having been received from the Inland Revenue regardingthe taxable value of benefits in kind. Estimates of Class 4 contributions have been reduced slightly in order to take account ofmore recent data that has been received regarding collections of Class 4 contributions.
8.4 Estimates of investment return and other receipts to the National Insurance Fund are little changed from those shown inCm 4587.
8.5 The current estimate of benefit expenditure is £0.1 billion lower than the estimate shown in Cm 4587. This is mainly dueto a reduction in estimated expenditure on basic incapacity benefit, since recent data shows lower awards of benefit than

were previously being assumed. Estimated expenditure on contribution-based jobseeker's allowance has also been reducedslightly, due to a reduction in the assumed level of unemployment.
8.6 Payments of minimum contributions to appropriate personal pension providers in 2000-01 are now estimated to be £0.2billion lower than the previous estimates. Data on payments of rebates, and in particular on the delay to payments in 1998-99, has been scarcer than would usually be the case, due to the introduction of NIRS2. However, the data which has recentlybeen received suggests that payments have been lower than previously estimated.
8.7 Estimates of administration costs and other expenditure are little changed from those shown in Cm 4587.
8.8 The provisional balance in the Fund at March 2000, as provided by Inland Revenue for the current estimates, is £0.6billion higher than the estimated balance from the report on the April 2000 up-rating and re-rating orders. As noted inparagraph A1.19 of Appendix A1, the figure for the balance in the Fund at March 2000 is provisional, and may be revisedbefore the National Insurance Fund accounts for 1999-2000 are published.
8.9 The projected finances of the National Insurance Fund in this report can also be compared with the long-term financialestimates which were published in the latest Quinquennial Review and in my report on the Child Support, Pensions andSocial Security Bill 1999. The long-term estimates show that a joint employee and employer Class 1 contribution rate of20.2%, excluding the part of contributions which is allocated to the National Health Service, is required in 2000-01 in orderfor contribution income to meet benefit expenditure and administration costs.
8.10 The projections which are shown for 2000-01 in this report indicate that with the current joint employee and employerClass 1 contribution rate of 20.25%, income will exceed expenditure by £4.0 billion in 2000-01. This surplus is larger thanwould be expected from a 0.05% difference in the contribution rate. There are two principal reasons for this.
8.11 Firstly, the economic assumptions which have been used differ between the two sets of estimates. In the long-termestimates, it was assumed that the rate of real earnings growth, being the excess of earnings growth over price inflation,would be 1.5% between 1999-2000 and 2000-01 and for all future years. This assumption is critical for the projections inthat it affects the rate at which contribution income would broadly be expected to increase relative to flat-rate benefitexpenditure, when benefits are uprated in line with price inflation. Flat-rate benefit rates were increased by 1.1% at April2000, whereas the growth in average earnings over the year to 2000-01 is expected to be 4.0%, as shown in Table A2.2 ofAppendix 2. This results in real earnings growth of 2.9% between 1999-2000 and 2000-01 being used for the currentestimates.
8.12 Secondly, the methodology used differs between the two sets of estimates. In the results for the year 2000-01 in thisreport, the investment return of £1.0 billion comprises around 25% of the excess of income over expenditure in 2000-01.However, the calculated contribution rate in the long-term estimates is that which would be required solely for contributionincome in the year to equal benefit expenditure and administration costs in the same year. Investment return is assumed onlyto cover the increase in the minimum recommended balance in the Fund from year to year, and the level of the openingbalance in the Fund does not affect the calculated required contribution rate.
We welcome your comments on this site.

Report on the cost of uprating the basic retirement pension in line with the general level of earnings
APPENDICES
A1. DETAILS OF METHODS USED FOR THE PROJECTIONS
Contribution income
A1.1 Contributions are estimated separately for each class. Actual known receipts in recent years are used to adjustmodelled estimates for future years.
A1.2 Estimates of Class 1 contributions are made separately for gross contributions and amounts of contracted-out rebates.Estimates of gross contributions are made using an earnings distribution based on the New Earnings Survey, projected in linewith the earnings increases shown in Table A2.2 of Appendix A2. The gross contribution results are scaled in line with theassumed number of workforce jobs which are also given in Table A2.2. The estimates of amounts of contracted-out rebatesfor COSRS, COMPS and APPs are made in a similar way, using an assumption of the numbers contracted out which allowsfor the continuation of the trend in the proportions of employees contracted out into occupational schemes observed in recentyears. At the moment there is more uncertainty than normal about the level of contracting out through different routes, due toa lack of recent data on the numbers contracting out. Therefore the estimates of contracted-out rebates are more uncertainthan would usually be the case. The assumed level of additional contracting out from 2001-02 onwards resulting from theintroduction of Stakeholder Pensions is given in paragraph 3.12. These people are all assumed to earn above the low earningsthreshold in the particular year, and are assumed to have the same earnings distribution as all employees who would becontracted-in were it not for the introduction of Stakeholder Pensions.
A1.3 Other classes of contributions are estimated using simpler models. Class 1A contributions are estimated using dataprovided by the Inland Revenue and information on Class 1A contributions paid in previous years. Class 1B contributionsare estimated using data provided by the Inland Revenue. Estimates of Class 2 and Class 4 contributions are estimated usingdata on the earnings of the self-employed received from the Inland Revenue, adjusted for earnings increases. This data iscombined with information on contributions received in the past, the assumed numbers of self-employed in the future (asshown in Table A2.2 of Appendix A2), and the rates of Class 2 and Class 4 in order to estimate the contributions paid. Class3 contributions are estimated by adjusting the contributions paid in earlier years for the changes in the contribution rate.
A1.4 Statutory sick pay (SSP) and statutory maternity pay (SMP) recovered by employers are estimated by adjustingamounts recovered in the latest year for which data are available broadly in line with changes in numbers of employees, ratesof benefit, and, for earnings-related statutory maternity pay, the average earnings of women. The additional amount in excessof 100% of SMP paid which can be reclaimed by small employers (SMP abatement) is estimated in a similar way. A lack ofdata on actual amounts of SSP and SMP reclaimed by employers in recent years means that the estimates are more uncertainthan would usually be the case. The amount of the payment from the Consolidated Fund is estimated as the amounts of SSPand SMP recovered, with adjustments in the current year arising from revisions to estimates of amounts recovered in prioryears.
Investment return
A1.5 The investment return on the National Insurance Fund is estimated by applying an assumed rate of return, as specifiedin paragraph A2.4 of Appendix A2, to the average balance in the Fund during the year.
Other income
A1.6 Other income comprises mainly State Scheme Premiums and recoveries of damages in tort from benefit paid. Becauseof the relatively small amounts involved, this item was estimated by taking the latest available amounts, adjusted in line withassumed future price inflation.
Benefit expenditure
A1.7 Benefits are estimated separately for each of the contributory benefits, and separately for the basic (flat-rate) elementsand for additional pensions (SERPS and S2P).
A1.8 In general, for flat-rate benefits, numbers are estimated by taking the most recent data on beneficiaries and projectingthese with allowance for awards and cessations in future years based on past experience and taking into accountdemographic factors. The average rate of benefit is calculated, making allowance for dependency and average amounts ofbenefit, based on past data and observed trends.
A1.9 Estimates of basic retirement pension, by far the largest benefit, use the latest population projections (mid-1998 based)as a basis for the numbers over pension age. They allow for gradual changes in the proportion of that population receivingbasic retirement pension, as well as for an increasing trend in the numbers of overseas residents receiving pension.Allowance is also made for trends in the average amounts of benefit and the changing mix in categories of retirementpension for women arising from the increasing trend for women to have entitlement on their own contributions.
A1.10 Estimates of graduated retirement pension are based on the numbers of graduated units earned between 1961 andApril 1975. An estimated adjustment was made to allow for units of deceased men inherited by their widows who wereunder pension age at April 1975 and which would not come into payment until the widow reached pension age. The units atApril 1975 are survived using population mortality rates. Allowance is made for inheritance of graduated units by widowsand, from 1979, by widowers. Units in respect of people under pension age are assumed to be put into payment on reachingpension age. The appropriate graduated rate is applied to the survived units over pension age.
A1.11 Estimates of amounts of additional pension paid with retirement pension are derived from age-specific data on pastearnings. For future years, earnings factors are derived by adjusting these for earnings increases, for the introduction ofdifferent accrual rates on different bands of earnings in the State Second Pension (S2P), and for demographic and economicactivity rate changes under pension age. Allowance is also made for accruals of S2P credits from 2002-03 onwards. Accruedearnings are survived to pension age using adjusted population mortality rates. At pension age the accrued survived earningsare converted to amounts of additional pension awarded, and survived using the latest population mortality rates (mid-1998based). Paragraph 3.13 contains details of the assumptions which have been made regarding the amount of SERPS pensionswhich are inherited by widows and widowers. A similar method is used for guaranteed minimum pensions and contracted-out deductions, with adjustment to the mortality rates to allow for generally lighter mortality for those contracted-out.
A1.12 Estimates of widows' benefits and bereavement benefits are based on an awards and survivorship model. This modelis split between projecting the remaining pre-1988 widows who have full transitional protection and are subject to the pre-1988 rules for widows' benefit, projecting a build-up and run-off of widows widowed between 1988 and 2001, and projectinga build up of widows and widowers post 2001 who are subject to the rules for widows' benefits and bereavement benefitsintroduced by the Welfare Reform and Pensions Act 1999. Allowance is made for widowers with children who werewidowed before April 2001 and who will receive bereavement benefits from April 2001. Awards are based on recent dataand are projected using numbers of new widows and widowers from the latest marital conditions projection (mid-1998based); termination and transfer rates by single age and type of benefit are derived from recent data. For widowers, in theabsence of any actual data, assumptions are based on those for widows, with adjustments to allow approximately for agedifferentials and entitlement.
A1.13 Estimates of the amount of additional pension paid with widows' benefits and bereavement benefits are derived fromthe retirement pension additional pension model. Accrued additional pension to people dying under pension age, and actualadditional pension in payment to those dying over pension age are converted to give amounts of widows' and widowers'additional pension using assumptions on marital status and age of surviving spouse. Paragraph 3.13 contains details of theassumptions which have been made regarding the amount of SERPS pensions which are inherited by widows and widowers.The amount is split by type of benefit and survived using the main basic widows' benefit model. Allowance is made for thechanges which will apply from April 2001, under which additional pension will only be paid to widows and widowers underpension age who receive widowed parents allowance. Amounts of survived additional pension are transferred back to themain retirement pension model in respect of widows and widowers who reach pension age, including amounts which are notactually paid under pension age. A similar method is used for contracted-out deductions.
A1.14 Trends in awards and survival for incapacity benefit take account of experience since the introduction of the medicaltest for both post-1995 cases and those awarded invalidity benefit pre-1995. The estimates take account of incapacity benefitceasing at pension age and those on benefit converting to retirement pension; the existing cases over pension age in 1995 willhave entirely transferred to retirement pension by April 2000. All the main changes to incapacity benefit that took place in1995 are fully incorporated into the estimates. The estimates also allow for the changes that will be introduced from April2001 under the Welfare Reform and Pensions Act 1999. Additional pension with incapacity benefit ceased for new awardsfrom April 1995, although pre-1995 cases still retain the benefit at the existing rate. Short term lower rate incapacity benefitis modelled in a simpler way, based on recent data with adjustments for numbers economically active and unemployment,

and with allowance for the Welfare Reform Act changes from April 2001.
A1.15 The estimate of the cost of contribution-based jobseeker's allowance is based on the assumptions for the number ofunemployed shown in Table A2.3 of Appendix A2. It takes account of the estimated proportion of those unemployed whoare entitled to the contributory element of jobseeker's allowance. The proportion entitled is derived from recent data oncontributory jobseeker's allowance analysed by age and duration of unemployment. The data suggests that there has beenlittle change in the proportion entitled since the introduction of jobseeker's allowance, although there have been significantchanges at longer durations. The model takes recent data on age and duration-specific proportions entitled and applies theseto a durational split of the numbers unemployed based on durational profiles supplied by the Department for Education andEmployment.
A1.16 The underlying Government Actuary's Department estimates of payments for all benefits are aligned to recent data onencashments for 1999-2000 to ensure that account is taken of more recent changes in factors affecting benefit payments thanare incorporated in data on numbers of beneficiaries.
Administration costs
A1.17 The estimates of administration costs for the current year are provided by the Inland Revenue. Administration costsare assumed to increase in line with the growth in average earnings in the future.
Other expenditure
A1.18 Other expenditure comprises mainly redundancy payments, net of redundancy receipts, and transfers from the GreatBritain National Insurance Fund to the Northern Ireland and Isle of Man Funds. Because of the relatively small amountsinvolved, this item was estimated by taking the latest available amounts, adjusted in line with assumed future price inflation.
Balance in the Fund
A1.19 The estimated opening balance in the Fund at March 2000 has been provided by Inland Revenue. This figure iscurrently provisional, pending finalisation of the National Insurance Fund accounts for 1999-2000, and may be revised.
We welcome your comments on this site.
Report on the cost of uprating the basic retirement pension in line with the general level of earnings
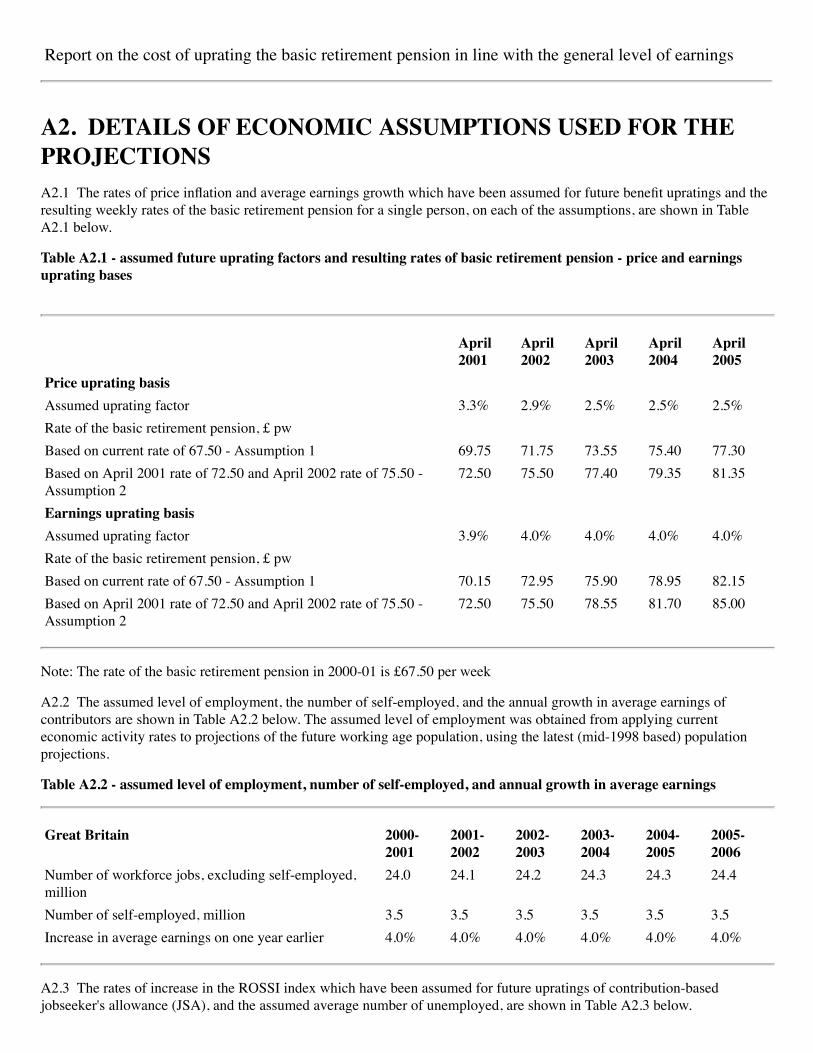
A2. DETAILS OF ECONOMIC ASSUMPTIONS USED FOR THEPROJECTIONSA2.1 The rates of price inflation and average earnings growth which have been assumed for future benefit upratings and theresulting weekly rates of the basic retirement pension for a single person, on each of the assumptions, are shown in TableA2.1 below.
Table A2.1 - assumed future uprating factors and resulting rates of basic retirement pension - price and earningsuprating bases
April2001
April2002
April2003
April2004
April2005
Price uprating basisAssumed uprating factor 3.3% 2.9% 2.5% 2.5% 2.5%Rate of the basic retirement pension, £ pwBased on current rate of 67.50 - Assumption 1 69.75 71.75 73.55 75.40 77.30Based on April 2001 rate of 72.50 and April 2002 rate of 75.50 -Assumption 2
72.50 75.50 77.40 79.35 81.35
Earnings uprating basisAssumed uprating factor 3.9% 4.0% 4.0% 4.0% 4.0%Rate of the basic retirement pension, £ pwBased on current rate of 67.50 - Assumption 1 70.15 72.95 75.90 78.95 82.15Based on April 2001 rate of 72.50 and April 2002 rate of 75.50 -Assumption 2
72.50 75.50 78.55 81.70 85.00
Note: The rate of the basic retirement pension in 2000-01 is £67.50 per week
A2.2 The assumed level of employment, the number of self-employed, and the annual growth in average earnings ofcontributors are shown in Table A2.2 below. The assumed level of employment was obtained from applying currenteconomic activity rates to projections of the future working age population, using the latest (mid-1998 based) populationprojections.
Table A2.2 - assumed level of employment, number of self-employed, and annual growth in average earnings
Great Britain 2000-2001
2001-2002
2002-2003
2003-2004
2004-2005
2005-2006
Number of workforce jobs, excluding self-employed,million
24.0 24.1 24.2 24.3 24.3 24.4
Number of self-employed, million 3.5 3.5 3.5 3.5 3.5 3.5Increase in average earnings on one year earlier 4.0% 4.0% 4.0% 4.0% 4.0% 4.0%
A2.3 The rates of increase in the ROSSI index which have been assumed for future upratings of contribution-basedjobseeker's allowance (JSA), and the assumed average number of unemployed, are shown in Table A2.3 below.
Table A2.3 - assumed future JSA uprating factors and average number of unemployed
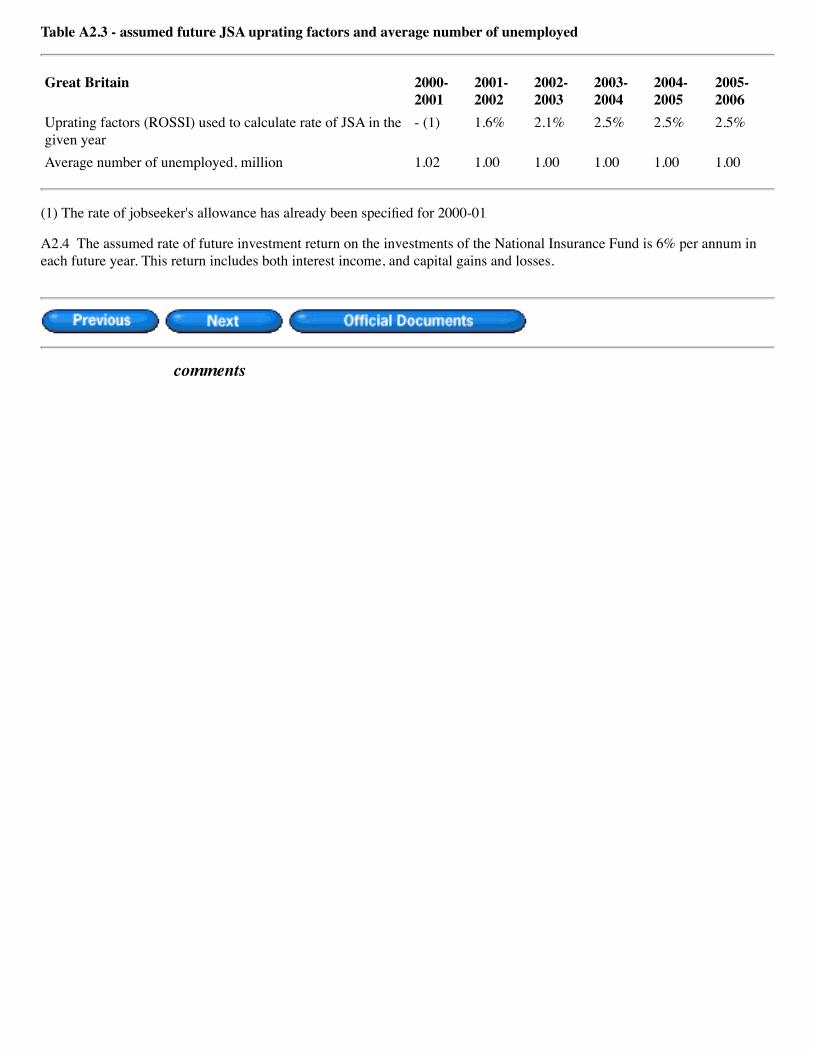
Table A2.3 - assumed future JSA uprating factors and average number of unemployed
Great Britain 2000-2001
2001-2002
2002-2003
2003-2004
2004-2005
2005-2006
Uprating factors (ROSSI) used to calculate rate of JSA in thegiven year
- (1) 1.6% 2.1% 2.5% 2.5% 2.5%
Average number of unemployed, million 1.02 1.00 1.00 1.00 1.00 1.00
(1) The rate of jobseeker's allowance has already been specified for 2000-01
A2.4 The assumed rate of future investment return on the investments of the National Insurance Fund is 6% per annum ineach future year. This return includes both interest income, and capital gains and losses.
We welcome your comments on this site.
Report on the cost of uprating the basic retirement pension in line with the general level of earnings
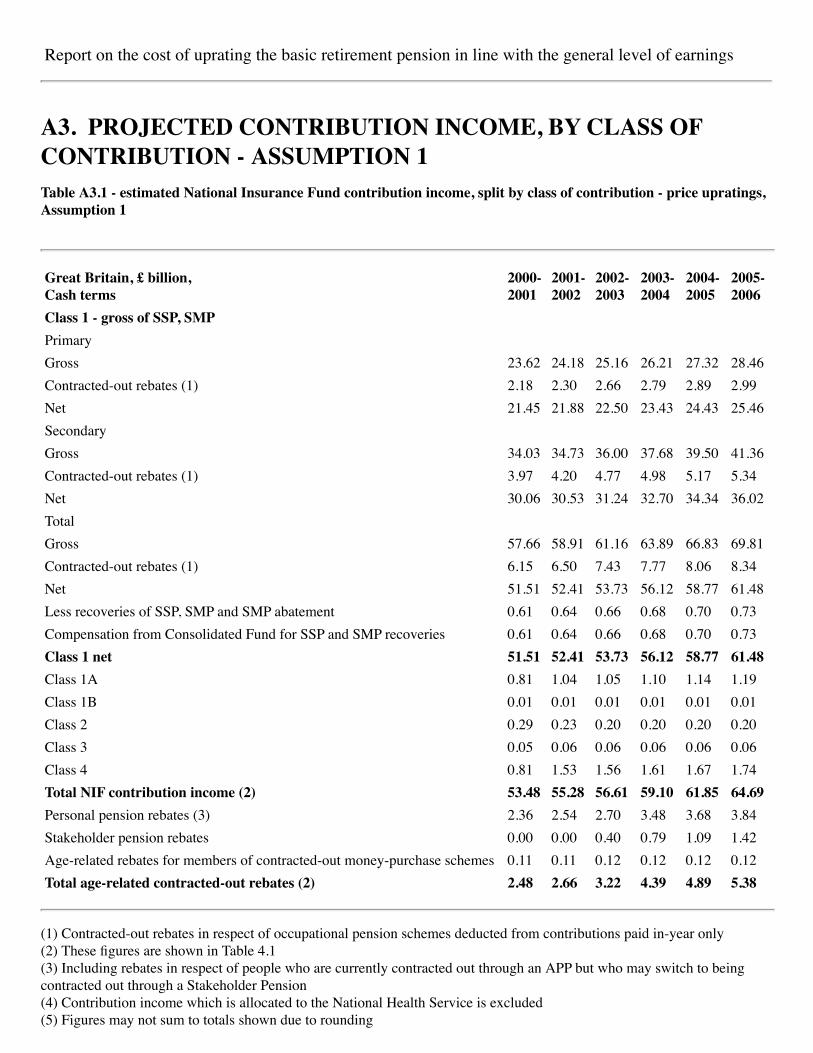
A3. PROJECTED CONTRIBUTION INCOME, BY CLASS OFCONTRIBUTION - ASSUMPTION 1Table A3.1 - estimated National Insurance Fund contribution income, split by class of contribution - price upratings,Assumption 1
Great Britain, £ billion, Cash terms
2000- 2001
2001- 2002
2002- 2003
2003- 2004
2004- 2005
2005- 2006
Class 1 - gross of SSP, SMPPrimaryGross 23.62 24.18 25.16 26.21 27.32 28.46Contracted-out rebates (1) 2.18 2.30 2.66 2.79 2.89 2.99Net 21.45 21.88 22.50 23.43 24.43 25.46SecondaryGross 34.03 34.73 36.00 37.68 39.50 41.36Contracted-out rebates (1) 3.97 4.20 4.77 4.98 5.17 5.34Net 30.06 30.53 31.24 32.70 34.34 36.02TotalGross 57.66 58.91 61.16 63.89 66.83 69.81Contracted-out rebates (1) 6.15 6.50 7.43 7.77 8.06 8.34Net 51.51 52.41 53.73 56.12 58.77 61.48Less recoveries of SSP, SMP and SMP abatement 0.61 0.64 0.66 0.68 0.70 0.73Compensation from Consolidated Fund for SSP and SMP recoveries 0.61 0.64 0.66 0.68 0.70 0.73Class 1 net 51.51 52.41 53.73 56.12 58.77 61.48Class 1A 0.81 1.04 1.05 1.10 1.14 1.19Class 1B 0.01 0.01 0.01 0.01 0.01 0.01Class 2 0.29 0.23 0.20 0.20 0.20 0.20Class 3 0.05 0.06 0.06 0.06 0.06 0.06Class 4 0.81 1.53 1.56 1.61 1.67 1.74Total NIF contribution income (2) 53.48 55.28 56.61 59.10 61.85 64.69Personal pension rebates (3) 2.36 2.54 2.70 3.48 3.68 3.84Stakeholder pension rebates 0.00 0.00 0.40 0.79 1.09 1.42Age-related rebates for members of contracted-out money-purchase schemes 0.11 0.11 0.12 0.12 0.12 0.12Total age-related contracted-out rebates (2) 2.48 2.66 3.22 4.39 4.89 5.38
(1) Contracted-out rebates in respect of occupational pension schemes deducted from contributions paid in-year only (2) These figures are shown in Table 4.1 (3) Including rebates in respect of people who are currently contracted out through an APP but who may switch to beingcontracted out through a Stakeholder Pension (4) Contribution income which is allocated to the National Health Service is excluded (5) Figures may not sum to totals shown due to rounding
(5) Figures may not sum to totals shown due to rounding
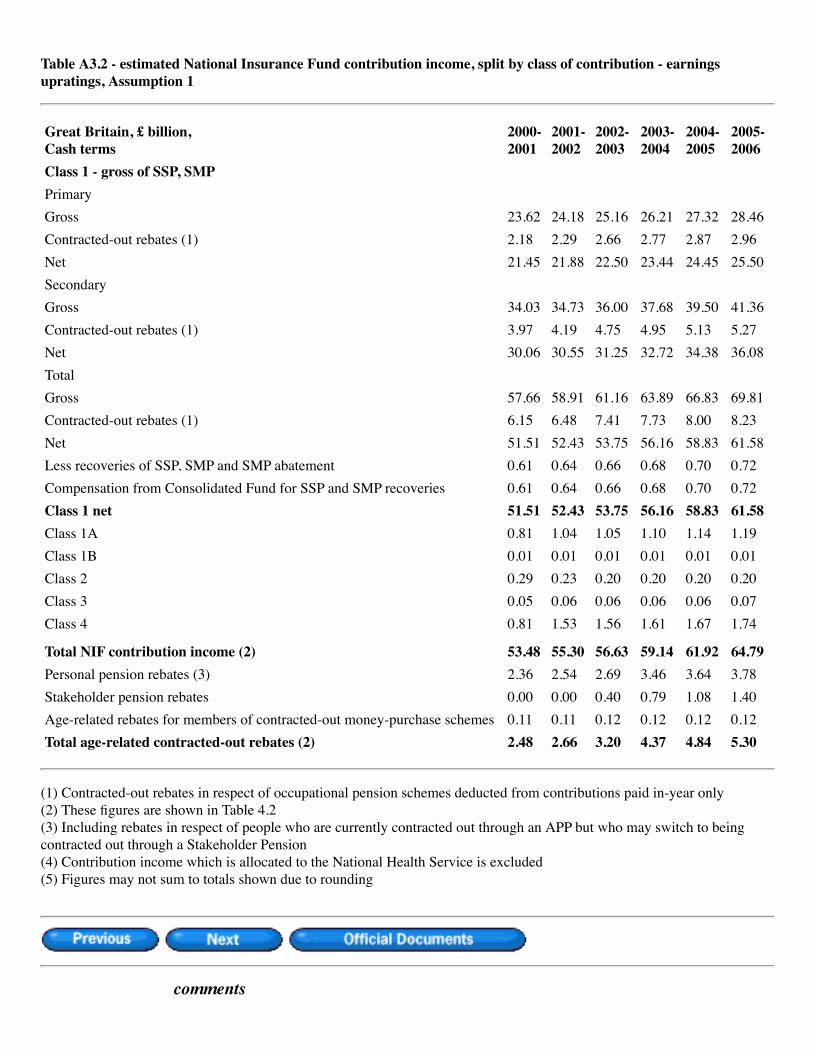
Table A3.2 - estimated National Insurance Fund contribution income, split by class of contribution - earningsupratings, Assumption 1
Great Britain, £ billion, Cash terms
2000- 2001
2001- 2002
2002- 2003
2003- 2004
2004- 2005
2005- 2006
Class 1 - gross of SSP, SMPPrimaryGross 23.62 24.18 25.16 26.21 27.32 28.46Contracted-out rebates (1) 2.18 2.29 2.66 2.77 2.87 2.96Net 21.45 21.88 22.50 23.44 24.45 25.50SecondaryGross 34.03 34.73 36.00 37.68 39.50 41.36Contracted-out rebates (1) 3.97 4.19 4.75 4.95 5.13 5.27Net 30.06 30.55 31.25 32.72 34.38 36.08TotalGross 57.66 58.91 61.16 63.89 66.83 69.81Contracted-out rebates (1) 6.15 6.48 7.41 7.73 8.00 8.23Net 51.51 52.43 53.75 56.16 58.83 61.58Less recoveries of SSP, SMP and SMP abatement 0.61 0.64 0.66 0.68 0.70 0.72Compensation from Consolidated Fund for SSP and SMP recoveries 0.61 0.64 0.66 0.68 0.70 0.72Class 1 net 51.51 52.43 53.75 56.16 58.83 61.58Class 1A 0.81 1.04 1.05 1.10 1.14 1.19Class 1B 0.01 0.01 0.01 0.01 0.01 0.01Class 2 0.29 0.23 0.20 0.20 0.20 0.20Class 3 0.05 0.06 0.06 0.06 0.06 0.07Class 4 0.81 1.53 1.56 1.61 1.67 1.74
Total NIF contribution income (2) 53.48 55.30 56.63 59.14 61.92 64.79Personal pension rebates (3) 2.36 2.54 2.69 3.46 3.64 3.78Stakeholder pension rebates 0.00 0.00 0.40 0.79 1.08 1.40Age-related rebates for members of contracted-out money-purchase schemes 0.11 0.11 0.12 0.12 0.12 0.12Total age-related contracted-out rebates (2) 2.48 2.66 3.20 4.37 4.84 5.30
(1) Contracted-out rebates in respect of occupational pension schemes deducted from contributions paid in-year only (2) These figures are shown in Table 4.2 (3) Including rebates in respect of people who are currently contracted out through an APP but who may switch to beingcontracted out through a Stakeholder Pension (4) Contribution income which is allocated to the National Health Service is excluded (5) Figures may not sum to totals shown due to rounding
We welcome your comments on this site.
Report on the cost of uprating the basic retirement pension in line with the general level of earnings
A4. PROJECTED BENEFIT EXPENDITURE, BY BENEFIT TYPE -ASSUMPTION 1Table A4.1 - estimated National Insurance Fund benefit expenditure, split by benefit type - price upratings,Assumption 1
Great Britain, £ billion, Cash terms
2000- 2001
2001- 2002
2002- 2003
2003- 2004
2004- 2005
2005- 2006
Retirement pension - basic 32.59 33.82 34.96 36.25 37.43 38.72Retirement pension - graduated pension 1.17 1.23 1.29 1.35 1.40 1.45Retirement pension - additional pension 4.82 5.49 6.16 6.83 7.49 8.18Widows' and bereavement benefits - basic 0.72 0.87 0.86 0.81 0.76 0.71Widows' and bereavement benefits - additional pension 0.25 0.27 0.25 0.23 0.20 0.18Incapacity benefit - basic 6.04 6.26 6.52 6.74 6.95 7.20Incapacity benefit - additional pension 0.67 0.58 0.51 0.44 0.38 0.33Contribution-based jobseeker's allowance 0.46 0.48 0.49 0.51 0.52 0.53Christmas bonus 0.12 0.12 0.12 0.12 0.12 0.12Other benefits 0.05 0.06 0.06 0.06 0.06 0.06Total benefit expenditure (1) 46.88 49.18 51.22 53.34 55.31 57.49
(1) These figures are shown in Table 4.1 (2) Figures may not sum to totals shown due to rounding
Table A4.2 - estimated National Insurance Fund benefit expenditure, split by benefit type - earnings upratings,Assumption 1
Great Britain, £ million, Cash terms
2000- 2001
2001- 2002
2002- 2003
2003- 2004
2004- 2005
2005- 2006
Retirement pension - basic 32.59 34.00 35.53 37.40 39.17 41.12Retirement pension - graduated pension 1.17 1.23 1.29 1.35 1.40 1.45Retirement pension - additional pension 4.82 5.49 6.16 6.83 7.49 8.18Widows' and bereavement benefits - basic 0.72 0.87 0.87 0.83 0.78 0.74Widows' and bereavement benefits - additional pension 0.25 0.27 0.25 0.23 0.20 0.18Incapacity benefit - basic 6.04 6.26 6.52 6.74 6.95 7.20Incapacity benefit - additional pension 0.67 0.58 0.51 0.44 0.38 0.33Contribution-based jobseeker's allowance 0.46 0.48 0.49 0.51 0.52 0.53Christmas bonus 0.12 0.12 0.12 0.12 0.12 0.12Other benefits 0.05 0.06 0.06 0.06 0.06 0.06Total benefit expenditure (1) 46.88 49.38 51.80 54.51 57.09 59.93

(1) These figures are shown in Table 4.2 (2) Figures may not sum to totals shown due to rounding
We welcome your comments on this site.

Report on the cost of uprating the basic retirement pension in line with the general level of earnings
A5. PROJECTED CONTRIBUTION INCOME, BY CLASS OFCONTRIBUTION - ASSUMPTION 2Table A5.1 - estimated National Insurance Fund contribution income, split by class of contribution - price upratings,Assumption 2
Great Britain, £ billion, Cash terms
2000- 2001
2001- 2002
2002- 2003
2003- 2004
2004- 2005
2005- 2006
Class 1 - gross of SSP, SMPPrimaryGross 23.62 24.18 25.16 26.21 27.32 28.46Contracted-out rebates (1) 2.18 2.28 2.63 2.76 2.86 2.96Net 21.45 21.90 22.53 23.46 24.46 25.49SecondaryGross 34.03 34.73 36.00 37.68 39.50 41.36Contracted-out rebates (1) 3.97 4.16 4.71 4.92 5.11 5.29Net 30.06 30.57 31.29 32.75 34.39 36.07TotalGross 57.66 58.91 61.16 63.89 66.83 69.81Contracted-out rebates (1) 6.15 6.44 7.35 7.68 7.97 8.25Net 51.51 52.47 53.82 56.21 58.85 61.57Less recoveries of SSP, SMP and SMP abatement 0.61 0.64 0.66 0.68 0.70 0.72Compensation from Consolidated Fund for SSP and SMP recoveries 0.61 0.64 0.66 0.68 0.70 0.72Class 1 net 51.51 52.47 53.82 56.21 58.85 61.57Class 1A 0.81 1.04 1.05 1.10 1.14 1.19Class 1B 0.01 0.01 0.01 0.01 0.01 0.01Class 2 0.29 0.23 0.20 0.20 0.20 0.20Class 3 0.05 0.06 0.06 0.06 0.06 0.07Class 4 0.81 1.53 1.56 1.61 1.67 1.74Total NIF contribution income (2) 53.48 55.33 56.70 59.19 61.94 64.77Personal pension rebates (3) 2.36 2.54 2.67 3.41 3.60 3.76Stakeholder pension rebates 0.00 0.00 0.40 0.77 1.07 1.39Age-related rebates for members of contracted-out money-purchase schemes 0.11 0.11 0.12 0.12 0.12 0.12Total age-related contracted-out rebates (2) 2.48 2.66 3.18 4.30 4.80 5.28
(1) Contracted-out rebates in respect of occupational pension schemes deducted from contributions paid in-year only (2) These figures are shown in Table 5.1 (3) Including rebates in respect of people who are currently contracted out through an APP but who may switch to beingcontracted out through a Stakeholder Pension (4) Contribution income which is allocated to the National Health Service is excluded (5) Figures may not sum to totals shown due to rounding

(5) Figures may not sum to totals shown due to rounding
Table A5.2 - estimated National Insurance Fund contribution income, split by class of contribution - earningsupratings, Assumption 2
Great Britain, £ billion, Cash terms
2000- 2001
2001- 2002
2002- 2003
2003- 2004
2004- 2005
2005- 2006
Class 1 - gross of SSP, SMPPrimaryGross 23.62 24.18 25.16 26.21 27.32 28.46Contracted-out rebates (1) 2.18 2.28 2.63 2.75 2.85 2.93Net 21.45 21.90 22.53 23.47 24.47 25.52SecondaryGross 34.03 34.73 36.00 37.68 39.50 41.36Contracted-out rebates (1) 3.97 4.16 4.71 4.91 5.08 5.23Net 30.06 30.57 31.29 32.77 34.42 36.13TotalGross 57.66 58.91 61.16 63.89 66.83 69.81Contracted-out rebates (1) 6.15 6.44 7.35 7.66 7.93 8.16Net 51.51 52.47 53.82 56.23 58.90 61.65Less recoveries of SSP, SMP and SMP abatement 0.61 0.64 0.66 0.68 0.70 0.72Compensation from Consolidated Fund for SSP and SMP recoveries 0.61 0.64 0.66 0.68 0.70 0.72Class 1 net 51.51 52.47 53.82 56.23 58.90 61.65Class 1A 0.81 1.04 1.05 1.10 1.14 1.19Class 1B 0.01 0.01 0.01 0.01 0.01 0.01Class 2 0.29 0.23 0.20 0.20 0.20 0.20Class 3 0.05 0.06 0.06 0.06 0.06 0.07Class 4 0.81 1.53 1.56 1.61 1.67 1.74Total NIF contribution income (2) 53.48 55.33 56.70 59.21 61.98 64.86Personal pension rebates (3) 2.36 2.54 2.67 3.41 3.58 3.73Stakeholder pension rebates 0.00 0.00 0.40 0.77 1.07 1.38Age-related rebates for members of contracted-out money-purchase schemes 0.11 0.11 0.12 0.12 0.12 0.12Total age-related contracted-out rebates (2) 2.48 2.66 3.18 4.30 4.77 5.23
(1) Contracted-out rebates in respect of occupational pension schemes deducted from contributions paid in-year only (2) These figures are shown in Table 5.2 (3) Including rebates in respect of people who are currently contracted out through an APP but who may switch to beingcontracted out through a Stakeholder Pension (4) Contribution income which is allocated to the National Health Service is excluded (5) Figures may not sum to totals shown due to rounding
We welcome your comments on this site.
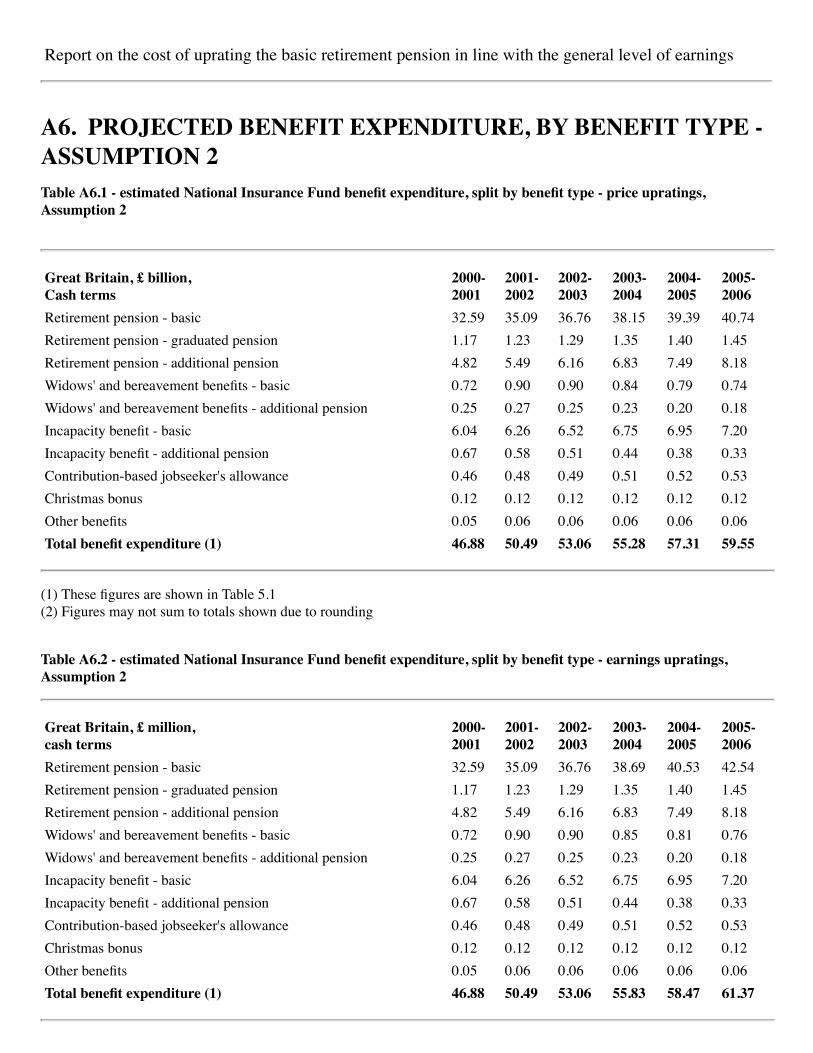
Report on the cost of uprating the basic retirement pension in line with the general level of earnings
A6. PROJECTED BENEFIT EXPENDITURE, BY BENEFIT TYPE -ASSUMPTION 2Table A6.1 - estimated National Insurance Fund benefit expenditure, split by benefit type - price upratings,Assumption 2
Great Britain, £ billion, Cash terms
2000- 2001
2001- 2002
2002- 2003
2003- 2004
2004- 2005
2005- 2006
Retirement pension - basic 32.59 35.09 36.76 38.15 39.39 40.74Retirement pension - graduated pension 1.17 1.23 1.29 1.35 1.40 1.45Retirement pension - additional pension 4.82 5.49 6.16 6.83 7.49 8.18Widows' and bereavement benefits - basic 0.72 0.90 0.90 0.84 0.79 0.74Widows' and bereavement benefits - additional pension 0.25 0.27 0.25 0.23 0.20 0.18Incapacity benefit - basic 6.04 6.26 6.52 6.75 6.95 7.20Incapacity benefit - additional pension 0.67 0.58 0.51 0.44 0.38 0.33Contribution-based jobseeker's allowance 0.46 0.48 0.49 0.51 0.52 0.53Christmas bonus 0.12 0.12 0.12 0.12 0.12 0.12Other benefits 0.05 0.06 0.06 0.06 0.06 0.06Total benefit expenditure (1) 46.88 50.49 53.06 55.28 57.31 59.55
(1) These figures are shown in Table 5.1 (2) Figures may not sum to totals shown due to rounding
Table A6.2 - estimated National Insurance Fund benefit expenditure, split by benefit type - earnings upratings,Assumption 2
Great Britain, £ million, cash terms
2000- 2001
2001- 2002
2002- 2003
2003- 2004
2004- 2005
2005- 2006
Retirement pension - basic 32.59 35.09 36.76 38.69 40.53 42.54Retirement pension - graduated pension 1.17 1.23 1.29 1.35 1.40 1.45Retirement pension - additional pension 4.82 5.49 6.16 6.83 7.49 8.18Widows' and bereavement benefits - basic 0.72 0.90 0.90 0.85 0.81 0.76Widows' and bereavement benefits - additional pension 0.25 0.27 0.25 0.23 0.20 0.18Incapacity benefit - basic 6.04 6.26 6.52 6.75 6.95 7.20Incapacity benefit - additional pension 0.67 0.58 0.51 0.44 0.38 0.33Contribution-based jobseeker's allowance 0.46 0.48 0.49 0.51 0.52 0.53Christmas bonus 0.12 0.12 0.12 0.12 0.12 0.12Other benefits 0.05 0.06 0.06 0.06 0.06 0.06Total benefit expenditure (1) 46.88 50.49 53.06 55.83 58.47 61.37

(1) These figures are shown in Table 5.2 (2) Figures may not sum to totals shown due to rounding
We welcome your comments on this site.


![Cap. 173] Pensions CHAPTER 173. PENSIONS. 173.pdf · Pensions, etc., to cease on bankruptcy. 14. Pensions, etc., may cease on sentence to term of imprisonment. 15. Pensions, etc.,](https://img.dokumen.tips/doc/110x75/5f32c41fe2aa25713c052446/cap-173-pensions-chapter-173-173pdf-pensions-etc-to-cease-on-bankruptcy.jpg)