Embed Size (px)
Citation preview
Child Poverty Map of the UK
February 2013

The child poverty map of the UK 2013 End Child Poverty Compilation and presentation of local data by Matt Padley and Donald Hirsch of the Centre for Research in Social Policy (CRSP), Loughborough University, for the Campaign to End Child Poverty.
Contents
Introduction and key messages ................................................................................................................. 5
Why child poverty matters .................................................................................................................. 5
Where child poverty is highest ............................................................................................................ 5
Where child poverty is lowest ........................................................................................................... 11
What can Local Authorities do about child poverty .......................................................................... 13
Regional child poverty figures .................................................................................................................. 19
East of England ........................................................................................................................................ 19
By Local Authority ................................................................................................................................ 19
By Parliamentary Constituency ........................................................................................................ 21
East Midlands ........................................................................................................................................... 22
By Local Authority ................................................................................................................................ 22
By Parliamentary Constituency ........................................................................................................ 23
London...................................................................................................................................................... 24
By Local Authority ................................................................................................................................ 24
By Parliamentary Constituency ............................................................................................................ 25
North East ................................................................................................................................................ 26
By Local Authority ................................................................................................................................ 26
By Parliamentary Constituency ............................................................................................................ 26
North West ............................................................................................................................................... 28
By Local Authority ................................................................................................................................ 28
By Parliamentary Constituency ............................................................................................................ 29
South East ................................................................................................................................................ 30
By Local Authority ................................................................................................................................ 30
By Parliamentary Constituency ................................................................................ 30_Toc348974472
South West ............................................................................................................................................... 32
By Local Authority ................................................................................................................................ 32
By Parliamentary Constituency ............................................................................................................ 32
West Midlands .......................................................................................................................................... 34
By Local Authority ................................................................................................................................ 34
By Parliamentary Constituency ............................................................................................................ 35
Yorkshire and the Humber ....................................................................................................................... 36
By Local Authority ................................................................................................................................ 36
By Parliamentary Constituency ............................................................................................................ 36
Northern Ireland ....................................................................................................................................... 38
By local authority .................................................................................................................................. 38
By Parliamentary Constituency ............................................................................................................ 39

Scotland.................................................................................................................................................... 40
By local authority .................................................................................................................................. 40
By Parliamentary constituency ............................................................................................................ 40
Wales........................................................................................................................................................ 42
By local authority .................................................................................................................................. 42
By parliamentary constituency ............................................................................................................. 42
Introduction and key messages
Why child poverty matters
The End Child Poverty campaign is a coalition of over 100 charities committed to ending child poverty in the UK. This report provides a localised map of child poverty on the closest possible measure to that used nationally by the government. The figures presented are for mid 2012. They show the scale of the challenge to achieve this goal, especially in some local areas. In 69 wards throughout the UK, the majority of children (50% and above) remain in poverty. Child Poverty damages children’s experiences of childhood and harms their future life chances. We know from research earlier this year by Save the Children that:
well over half of parents in poverty (61%) say they have cut back on food and over a quarter (26%) say they have skipped meals in the past year.
around 1 in 5 parents in poverty (19%) say their children have to go without new shoes when they need them.
a large number of children in poverty say they are missing out on things that many other children take for granted, such as going on school trips (19%) and having a warm coat in winter (14%).
only 1 in 5 parents in poverty (20%) say they have not had to borrow money to pay for essentials, such as food and clothes, in the past year.1
End Child Poverty believes that we need action at the national, regional and local level to meet the goal embedded in the Child Poverty Act 2010 to end child poverty by 2020. At a national level, the signs for child poverty are worrying. Even though the latest available national figures showed a fall in relative poverty up until early 2011, because unlike median incomes, benefits were not falling in real terms, this improvement is now reversing. The Institute for Fiscal Studies predicts a growth in child poverty of 400,000 between 2011 and 2015, and a total of 800,000 by 2020.2 This prediction came before recent announcements about benefits uprating: the Welfare Uprating Bill currently being debated in Parliament is expected to push another 200,000 children into poverty.3 We’re calling on the UK Government to set out how it will meet its commitment in the Child Poverty Act to end child poverty by 2020. But action at a local level can also make a difference, and levels of child poverty vary widely across the country. With the UK Government devolving more decisions about how families are supported to a local level, it’s all the more important that we pay attention to local child poverty levels.
Where child poverty is highest
On average throughout the UK, one in five (20.2%) children are classified as below the poverty line (before housing costs). In some areas of large cities, this rises to over
1 Graham Whitham (2012) Child Poverty in 2012: It shouldn’t happen here Save the Children.
2 M Brewer, J Browne and R Joyce, Child and working age poverty from 2010 to 2020, Institute for
Fiscal Studies, October 2011 3 Response to Parliamentary Question from Chris Skidmore, Hansard, 15 Jan 2013 : Column 714W

40%, although in contrast to 2011 there are no parliamentary constituencies or local authorities where more than half of children are in poverty. There is one local authority (Tower Hamlets) and eight parliamentary constituencies where at least four in ten children are in poverty; in 2011 there were three local authorities and 19 parliamentary constituencies where at least four in ten children were in poverty. At a more local level, there are more significant concentrations of child poverty: in 69 local wards, between 50% and 68% of children face poverty. This represents a decrease since 2011 when there were 100 local wards with between 50% and 70% of children facing poverty (see the End Child Poverty website for full ward level data). This is not because of a substantial change in overall child poverty levels, but because of local improvements in the area where concentrations have been the highest – London. In particular, there are considerably fewer children in inner London Boroughs in out-of-work families than a year ago. On the other hand, in the Northeast, the situation has deteriorated. Table 1: Top 20 parliamentary constituencies with highest levels of child poverty across the UK:
Constituency % of
children in poverty 2011
% of children in
poverty 2012
1. Manchester Central 49% 47%
2. Belfast West 46% 43%
3. Glasgow North East 44% 43%
4. Birmingham, Ladywood 46% 42%
5. Bethnal Green and Bow 51% 42%
6. Liverpool, Riverside 46% 42%
7. Poplar and Limehouse 48% 41%
8. Middlesbrough* 38% 40%
9. Blackley and Broughton 41% 38%
10. Newcastle upon Tyne Central* 29% 38%
11. Leeds Central 40% 38%
12. Liverpool, Walton* 38% 37%
13. Glasgow Central* 39% 37%
14. Hackney South and Shoreditch 45% 37%
15. Manchester, Gorton 40% 37%
16. Birmingham, Hodge Hill 41% 37%
17. Islington South and Finsbury 46% 37%
18. Nottingham North 39% 37%
19. Edmonton* 39% 37%
20. Birkenhead* 39% 36%
* Not in Top 20 in 2011
10
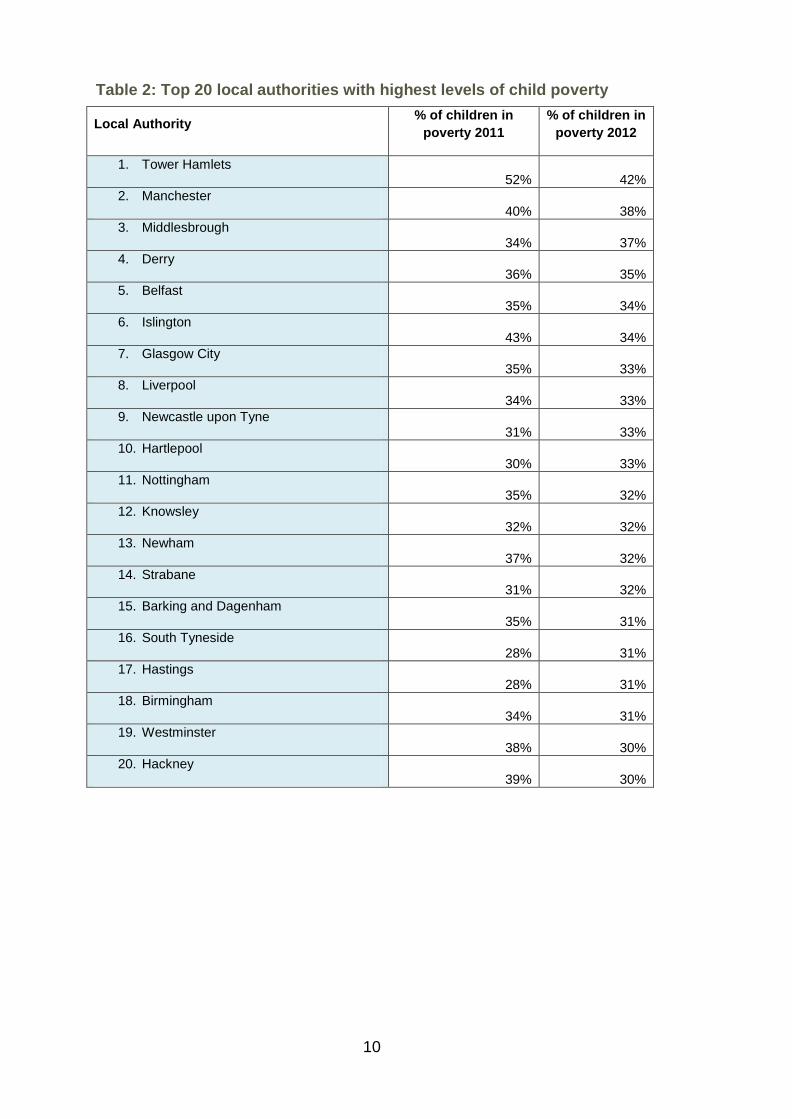
Table 2: Top 20 local authorities with highest levels of child poverty
Local Authority % of children in
poverty 2011
% of children in
poverty 2012
1. Tower Hamlets 52% 42%
2. Manchester 40% 38%
3. Middlesbrough 34% 37%
4. Derry 36% 35%
5. Belfast 35% 34%
6. Islington 43% 34%
7. Glasgow City 35% 33%
8. Liverpool 34% 33%
9. Newcastle upon Tyne 31% 33%
10. Hartlepool 30% 33%
11. Nottingham 35% 32%
12. Knowsley 32% 32%
13. Newham 37% 32%
14. Strabane 31% 32%
15. Barking and Dagenham 35% 31%
16. South Tyneside 28% 31%
17. Hastings 28% 31%
18. Birmingham 34% 31%
19. Westminster 38% 30%
20. Hackney 39% 30%

11
Where child poverty is lowest
The constituencies with the lowest levels of child poverty differ by a factor of almost ten compared to the highest. In these areas, child poverty is already well below the target level for 2020 contained in the Child Poverty Act.
Table 3: Top 20 parliamentary constituencies with lowest levels of child poverty
Constituency
% of children in poverty
2010
1. Sheffield Hallam Below 5%
2. Kenilworth and Southam 5%
3. South Northamptonshire 5%
4. Haltemprice and Howden 5%
5. Rushcliffe 5%
6. Wimbledon 6%
7. Skipton and Ripon 6%
8. Stone 6%
9. Beckenham 6%
10. South Leicestershire 6%
11. Bromsgrove 7%
12. Richmond Park 7%
13. Sutton Coldfield 7%
14. Rutland and Melton 7%
15. Twickenham 7%
16. Charnwood 7%
17. Stratford-on-Avon 7%
18. Wyre and Preston North 7%
19. Harrogate and Knaresborough 7%
20. Solihull 7%
12
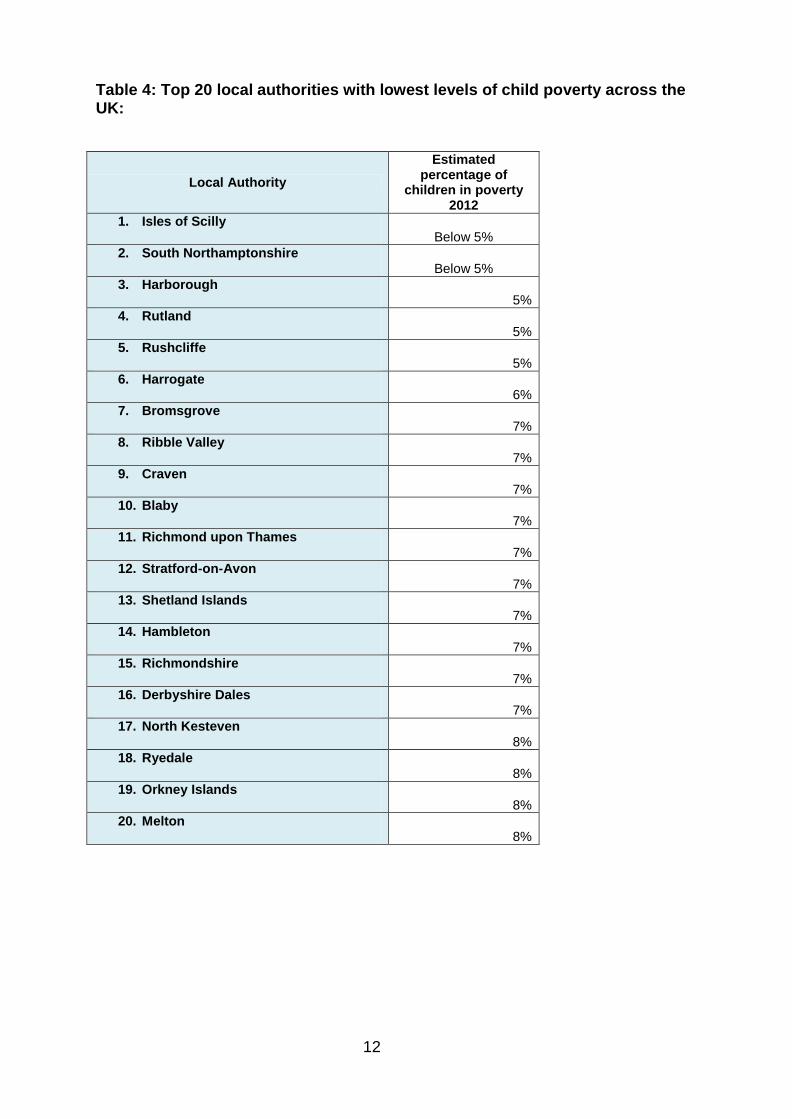
Table 4: Top 20 local authorities with lowest levels of child poverty across the UK:
Local Authority
Estimated percentage of
children in poverty 2012
1. Isles of Scilly
Below 5%
2. South Northamptonshire
Below 5%
3. Harborough 5%
4. Rutland
5%
5. Rushcliffe
5%
6. Harrogate 6%
7. Bromsgrove
7%
8. Ribble Valley
7%
9. Craven
7%
10. Blaby 7%
11. Richmond upon Thames
7%
12. Stratford-on-Avon
7%
13. Shetland Islands 7%
14. Hambleton
7%
15. Richmondshire
7%
16. Derbyshire Dales 7%
17. North Kesteven
8%
18. Ryedale
8%
19. Orkney Islands
8%
20. Melton 8%
13
What can Local Authorities do about child poverty
The wide variation in child poverty levels across the country is primarily a result of regional trends in employment, driven in part by national policy decisions. Local authorities have experienced significant cuts in the amount of support they receive from central Government, estimated by the LGA at over 33 per cent over the spending review period. Central Government needs to take into account both the level of child poverty in a local area, and the additional costs imposed on local services by high child poverty levels, when making decisions about funding. But there are many actions that Local Authorities can take that can help to tackle child poverty in their area. The campaign to End Child Poverty believe that there are three key areas in which Local Authorities should take action on child poverty:
1) Protect families with children in decisions about local benefits From April 2013, local authorities will have significantly increased discretion over the allocation of financial support for families, although in circumstances in which this support has been dramatically reduced. Local Authorities will be responsible for:
Providing support with the cost of essential items such as replacing cookers or fridges for families on a low income, as the Social Fund is replaced by schemes run by local authorities and in Scotland by the Scottish Welfare Fund administered by local authorities4.
Deciding who receives help with paying Council Tax, as Council Tax Benefit is replaced with local assistance schemes.5 The Resolution Foundation has found that low income families will see their council tax rise by up to £600 a year as a result of this change.6
Deciding who should receive support with housing costs. April 2013 will see the introduction of the £500 a week benefit cap, and the bedroom tax for families who live in social housing if the government believes they have a spare bedroom. Local Authorities have been allocated control over Discretionary Housing Payments, which they can use to help make up rent shortfalls for a small proportion of families affected by these changes.
End Child Poverty believes that Local Authorities should take a strategic decision to protect the poorest families with children when allocating these resources. We recognise that Local Authorities have not imposed these cuts, but they will have a significant influence over how they affect local residents.
4 http://www.scotland.gov.uk/Topics/People/welfarereform/socialfund
5 In Scotland a national council tax reduction scheme will replace council tax benefit
(http://www.legislation.gov.uk/ssi/2012/303/contents/). Families in Scotland should be protected by an agreement between Scottish Government and local authorities to invest £40m to cover the UK government’s 10% cut to council tax support. The Welsh government has also announced that it will provide £22m to protect Welsh claimants from cuts in council tax support (www.rightsnet.org.uk/news/story/welsh-government-to-protect-claimants-from-cut-in-council-tax-support-from-/). 6 Matthew Pennycook and Alex Hurrell (2013) No clear benefit Resolution Foundation, see:
http://www.resolutionfoundation.org/media/media/downloads/CTB_press_release_FINAL.pdf
14
2) Ensure that in England they are meeting their duties under the Child Poverty Act to publish a child poverty strategy
The Child Poverty Act 2010 requires local authorities to undertake a strategic needs assessment of child poverty in their local area, and to publish a strategy setting out how they will address it. End Child Poverty believes that it is vital that local authorities publish their strategies, and include within them how they are responding to changes in welfare reform. Appendix 2 of the report gives a list of those authorities where we have been unable to find a published child poverty strategy.
3) Ensure that child poverty is a priority for health and wellbeing boards in England.
Health and Wellbeing boards will be established in each locality in April 2013, bringing together local authorities, NHS and other partners. The Marmot review of health inequalities found that that child poverty has a severe impact on children’s health, and called for a strategy to give every child the best start in life. 7 As part of their strategic focus on health inequalities, local health and well being boards need to prioritise tackling the causes of child poverty and its impact on health outcomes. Their Joint Strategic Needs Assessments must include data on child poverty levels and align with the local Child Poverty Needs Assessment. Their joint health and well being strategies must set a clear expectation on local partners to take action. In Scotland, ECP members believe Local Authorities should ensure that tackling child poverty is a priority within new Single Outcome Agreements. They should review how they and their Community Planning Partners are contributing to implementing and monitoring progress against the aims and measures set out in the Child Poverty Strategy for Scotland. A recent review of local action to tackle child poverty in Scotland for Save the Children8 found “positive signs and grounds for optimism including a strong commitment to tackle child poverty at local level” and that “knowledge levels of the evidence and scale of the challenge have significantly improved. However only one half of council officers surveyed feel that child poverty is a political priority in their authority, only 16 per cent of local authorities had developed a local child poverty action plan, and only 5 per cent have established a child poverty development group or have undertaken a child poverty impact assessment. In Wales, ECP members believe Local Authorities should ensure that they are meeting their statutory duties under the Children and Families (Wales) Measure 2010 to prepare and publish a strategy for contributing to the eradication of child poverty in Wales. These duties can be satisfied through the publication of new Single Integrated Plans from April 2013 and we would expect action to tackle child poverty to be identified as a clear strategic priority within. Local authorities should ensure that they and their partners are contributing effectively to the Aims as outlined in the Children and Families (Wales) Measure 2010, that progress is monitored and appropriate services are in place which meets local need. Local Service Boards, as formulators and reviewers of the Plan, should
7 Fair Society, healthy lives: Report of the Marmot Review, published 2010.
8 http://www.savethechildren.org.uk/sites/default/files/images/Local-action-tackle-poverty-Scotland.pdf
15
prioritise actions which tackle the causes of child poverty in addition to actions which aim to mitigate the impact of child poverty, including in respect of responding to changes in welfare reform. In Northern Ireland, ECP members call on the NI Executive to introduce a Child Poverty Strategy for NI with a strategic and focused action plan, to include interim targets, measurable objectives and a targeted approach including the introduction of signature projects such as the Child Poverty Reduction Pilot study. There should also be an alignment of strategies across the Executive Departments to ensure coordinated action. An emphasis should also be placed on early intervention to address educational underachievement and the NI Child Care Strategy should be introduced as a matter of urgency. The NI Executive should also make it a priority to appoint representation to the UK Commission of Child Poverty and Social Mobility.
How child poverty is measured
The national targets:
There are four dimensions of poverty captured under the Child Poverty Act, each with a target to be met by 2020. They are:
• Relative low income poverty (below 60 per cent median household income) • Absolute low income poverty (below 60 per cent of median household
income held constant at 2010/11 level) • Persistent low income poverty (below 60 per cent of median household
income for three years or longer) • Material deprivation combined with relative low income (below 70 per cent
median household income and suffering from inability to afford essential spending needs)
Before housing costs, or after housing costs?
The most reported measure of child poverty is relative low income poverty, often referred to as the ‘headline measure’. The government target is tracked using figures before housing costs, which show a lower rate of poverty because the costs of housing are so high. The local figures given in this report also represent poverty levels before housing costs.
It is therefore important to note that the local figures given in this report would be significantly higher if measured after housing costs – especially in areas where housing is particularly expensive.
The Campaign to End Child Poverty always uses the after housing cost measure when referring to the total number of children living in poverty across the UK. The change in the number of children in the whole of the UK below the official poverty line in key years is shown below both before housing costs and after housing costs.

16
Table 1: UK child poverty 1998/99 2009/10 2010/11 Children in poverty before housing costs
3.4 million 2.6 million 2.3 million
Children in poverty after housing costs
4.4 million 3.8 million 3.6 million
Source: DWP Households Below Average Income series.

17
The local indicators in this report:
The figures presented in this report use tax credit data to give the percentage of children on low incomes in local authorities, parliamentary constituencies and wards across the UK. They also use regional trends in worklessness to estimate recent changes in the number of children who are in poverty because their parents have lost their jobs, to update the local tax credit data which is more than two years old.
This is not a direct measure of exactly how many children are in poverty on the official definition, but is the closest to an equivalent measure we have of local levels of child poverty (these data should therefore not be used for direct comparisons with official national and regional figures). The figures are estimates for mid-2012.
In the figures presented below, children are classified as being in poverty if they live in families in receipt of out of work benefits or in receipt of in-work tax credits where their reported income is less than 60 per cent of median income. The measure is of income before housing costs, and therefore replicates the more modest, official estimate of how many children are in poverty, not taking account of the impact of high rent or mortgage payments.
This indicator, compiled officially as a local estimate of child poverty, has been reported for August 2010 by HMRC. However, survey data reported only at a national and regional level show trends in the number of children in out of work families (who comprise the great majority of children in poverty on this indicator), through to the second quarter of 2012. These regional changes have been combined with the 2010 local data to estimate how many more children were in poverty locally by mid 2012.
Advantages of this methodology are that:
• It presents an estimate of child poverty as recently as mid 2012, whereas the most recent official data are for April 2010 to March 2011.
• It is based in part on data showing households where their reported income is less than 60 per cent of median income; in this, it corresponds with the official measure of poverty (though these data should not be directly compared).
• It provides local figures, including local authorities and parliamentary constituencies (in this report) and wards (see the spreadsheets available on the End Child Poverty website).

18
19
Regional child poverty figures
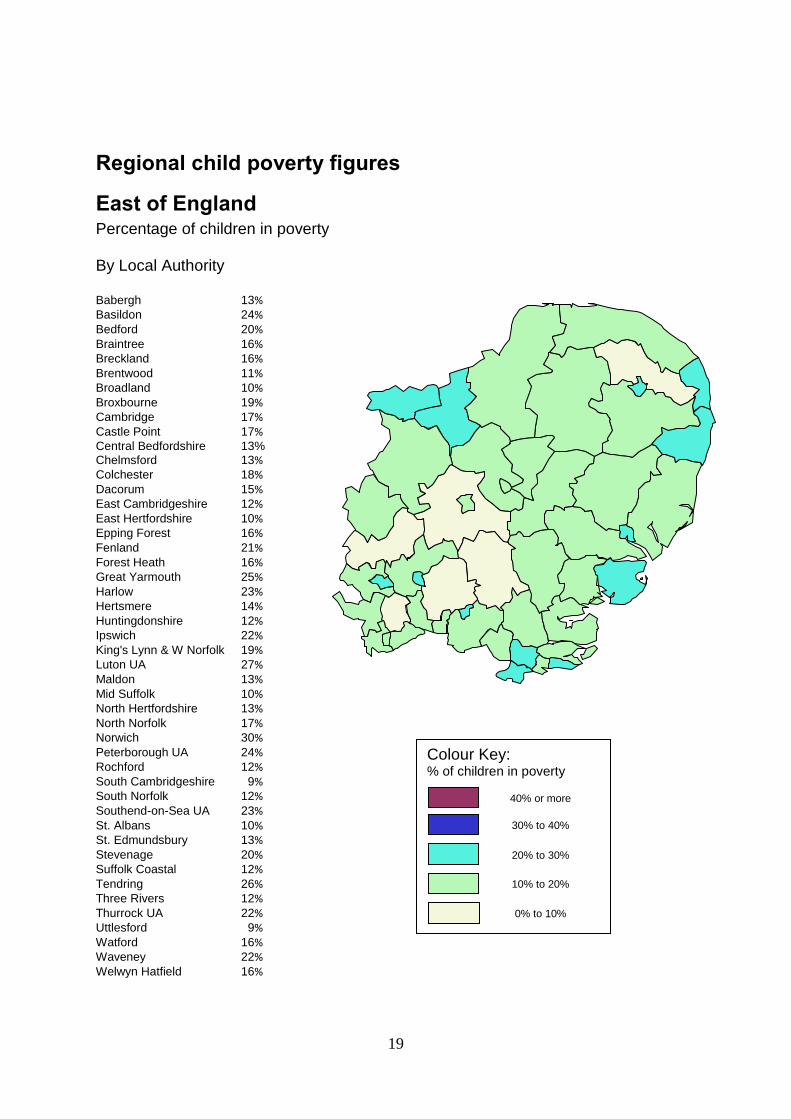
East of England Percentage of children in poverty
By Local Authority Babergh 13% Basildon 24% Bedford 20% Braintree 16% Breckland 16% Brentwood 11% Broadland 10% Broxbourne 19% Cambridge 17% Castle Point 17% Central Bedfordshire 13%
Chelmsford 13% Colchester 18% Dacorum 15% East Cambridgeshire 12% East Hertfordshire 10% Epping Forest 16% Fenland 21% Forest Heath 16% Great Yarmouth 25% Harlow 23% Hertsmere 14% Huntingdonshire 12% Ipswich 22% King's Lynn & W Norfolk 19% Luton UA 27% Maldon 13% Mid Suffolk 10% North Hertfordshire 13% North Norfolk 17% Norwich 30% Peterborough UA 24% Rochford 12% South Cambridgeshire 9% South Norfolk 12% Southend-on-Sea UA 23% St. Albans 10% St. Edmundsbury 13% Stevenage 20% Suffolk Coastal 12% Tendring 26% Three Rivers 12% Thurrock UA 22% Uttlesford 9% Watford 16% Waveney 22% Welwyn Hatfield 16%
Colour Key: % of children in poverty
40% or more
30% to 40%
20% to 30%
10% to 20%
0% to 10%

20

21
By Parliamentary Constituency
Basildon and Billericay 23% Bedford 24% Braintree 15% Brentwood and Ongar 12% Broadland 12% Broxbourne 19% Bury St Edmunds 12% Cambridge 18% Castle Point 17% Central Suffolk and North Ipswich 12% Chelmsford 15% Clacton 32% Colchester 21% Epping Forest 17% Great Yarmouth 25% Harlow 22% Harwich and North Essex 15% Hemel Hempstead 19% Hertford and Stortford 10% Hertsmere 14% Hitchin and Harpenden 9% Huntingdon 13% Ipswich 22% Luton North 25% Luton South 28% Maldon 12% Mid Bedfordshire 9% Mid Norfolk 14% North East Bedfordshire 11% North East Cambridgeshire 20% North East Hertfordshire 13% North Norfolk 17% North West Cambridgeshire 17% North West Norfolk 21% Norwich North 21% Norwich South 28% Peterborough 26% Rayleigh and Wickford 11% Rochford and Southend East 28% Saffron Walden 10% South Basildon and East Thurrock 24% South Cambridgeshire 9% South East Cambridgeshire 11% South Norfolk 12% South Suffolk 13% South West Bedfordshire 18% South West Hertfordshire 10% South West Norfolk 18% Southend West 17% St Albans 11% Stevenage 19% Suffolk Coastal 14% Thurrock 24% Watford 15% Waveney 23% Welwyn Hatfield 16% West Suffolk 14% Witham 14%

22
East Midlands
Percentage of children in poverty
By Local Authority Amber Valley 15% Ashfield 20% Bassetlaw 16% Blaby 7% Bolsover 20% Boston 16% Broxtowe 12% Charnwood 11% Chesterfield 18% Corby 18% Daventry 9% Derby UA 22% Derbyshire Dales 7% East Lindsey 19% East Northamptonshire 10% Erewash 16% Gedling 13% Harborough 5% High Peak 11% Hinckley and Bosworth 10% Kettering 13% Leicester UA 29% Lincoln 22% Mansfield 21% Melton 8% Newark and Sherwood 14% North East Derbyshire 13% North Kesteven 8% North West Leicestershire 11% Northampton 18% Nottingham UA 32% Oadby and Wigston 11% Rushcliffe 5% Rutland UA 5% South Derbyshire 11% South Holland 13% South Kesteven 11% South Northamptonshire Below 5% Wellingborough 16% West Lindsey 13%
Colour Key: % of children in poverty
40% or more
30% to 40%
20% to 30%
10% to 20%
0% to 10%

23
By Parliamentary Constituency
Amber Valley 18% Ashfield 21% Bassetlaw 16% Bolsover 20% Boston and Skegness 18% Bosworth 10% Broxtowe 11% Charnwood 7% Chesterfield 18% Corby 14% Daventry 9% Derby North 19% Derby South 27% Derbyshire Dales 7% Erewash 18% Gainsborough 13% Gedling 14% Grantham and Stamford 12% Harborough 8% High Peak 11% Kettering 13% Leicester East 24% Leicester South 28% Leicester West 34% Lincoln 19% Loughborough 14% Louth and Horncastle 17% Mansfield 21% Mid Derbyshire 8% Newark 11% North East Derbyshire 13% North West Leicestershire 11% Northampton North 20% Northampton South 22% Nottingham East 33% Nottingham North 37% Nottingham South 24% Rushcliffe 5% Rutland and Melton 7% Sherwood 16% Sleaford and North Hykeham 8% South Derbyshire 11% South Holland and The Deepings 12% South Leicestershire 6% South Northamptonshire 5% Wellingborough 15%
24
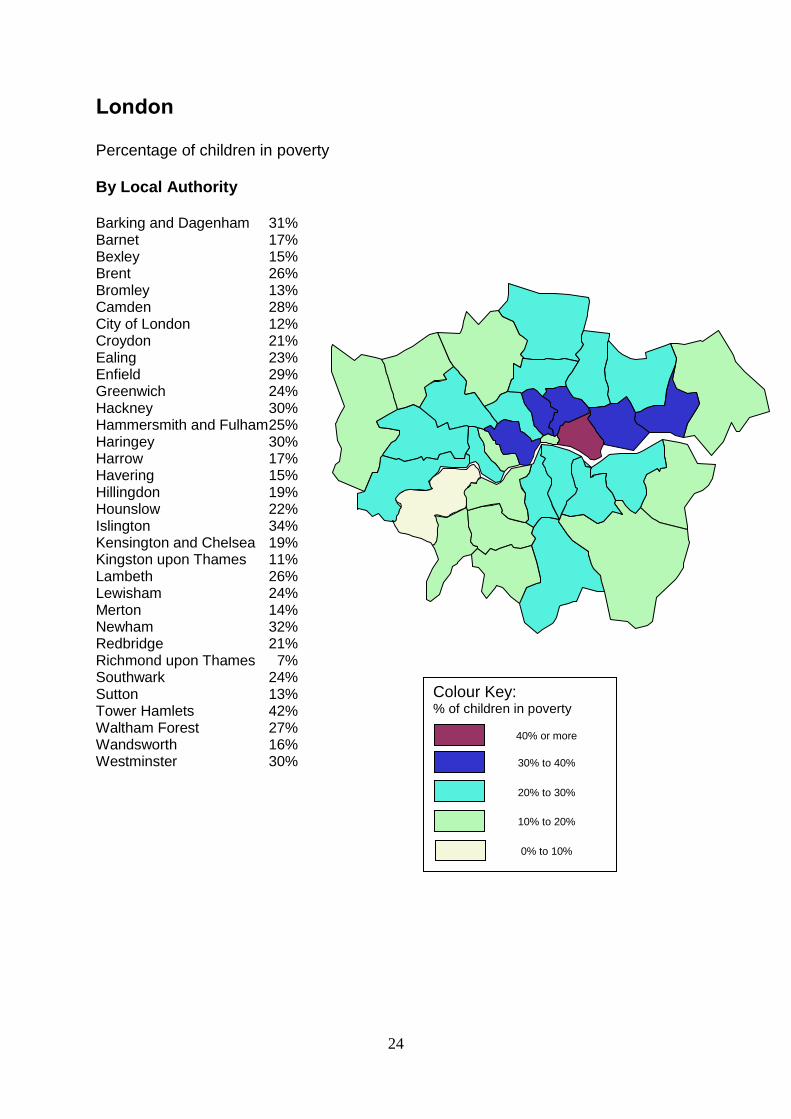
London Percentage of children in poverty By Local Authority Barking and Dagenham 31% Barnet 17% Bexley 15% Brent 26% Bromley 13% Camden 28% City of London 12% Croydon 21% Ealing 23% Enfield 29% Greenwich 24% Hackney 30% Hammersmith and Fulham 25% Haringey 30% Harrow 17% Havering 15% Hillingdon 19% Hounslow 22% Islington 34% Kensington and Chelsea 19% Kingston upon Thames 11% Lambeth 26% Lewisham 24% Merton 14% Newham 32% Redbridge 21% Richmond upon Thames 7% Southwark 24% Sutton 13% Tower Hamlets 42% Waltham Forest 27% Wandsworth 16% Westminster 30%
Colour Key: % of children in poverty
40% or more
30% to 40%
20% to 30%
10% to 20%
0% to 10%
25
By Parliamentary Constituency Barking 31% Battersea 16% Beckenham 6% Bermondsey and Old Southwark 28% Bethnal Green and Bow 42% Bexleyheath and Crayford 16% Brent Central 32% Brent North 19% Brentford and Isleworth 19% Bromley and Chislehurst 16% Camberwell and Peckham 26% Carshalton and Wallington 16% Chelsea and Fulham 16% Chingford and Woodford Green 18% Chipping Barnet 15% Cities of London and Westminster 20% Croydon Central 25% Croydon North 25% Croydon South 12% Dagenham and Rainham 26% Dulwich and West Norwood 20% Ealing Central and Acton 21% Ealing North 23% Ealing, Southall 23% East Ham 31% Edmonton 37% Eltham 18% Enfield North 31% Enfield, Southgate 16% Erith and Thamesmead 25% Feltham and Heston 24% Finchley and Golders Green 14% Greenwich and Woolwich 27% Hackney North and Stoke Newington 25% Hackney South and Shoreditch 37% Hammersmith 29% Hampstead and Kilburn 24%
Harrow East 18% Harrow West 19% Hayes and Harlington 27% Hendon 22% Holborn and St Pancras 33% Hornchurch and Upminster 14% Hornsey and Wood Green 21% Ilford North 18% Ilford South 27% Islington North 32% Islington South and Finsbury 37% Kensington 20% Kingston and Surbiton 12% Lewisham East 23% Lewisham West and Penge 25% Lewisham, Deptford 26% Leyton and Wanstead 24% Mitcham and Morden 21% Old Bexley and Sidcup 9% Orpington 11% Poplar and Limehouse 41% Putney 16% Richmond Park 7% Romford 14% Ruislip, Northwood and Pinner 8% Streatham 23% Sutton and Cheam 9% Tooting 16% Tottenham 36% Twickenham 7% Uxbridge and South Ruislip 16% Vauxhall 29% Walthamstow 29% West Ham 33% Westminster North 36% Wimbledon 6%
26
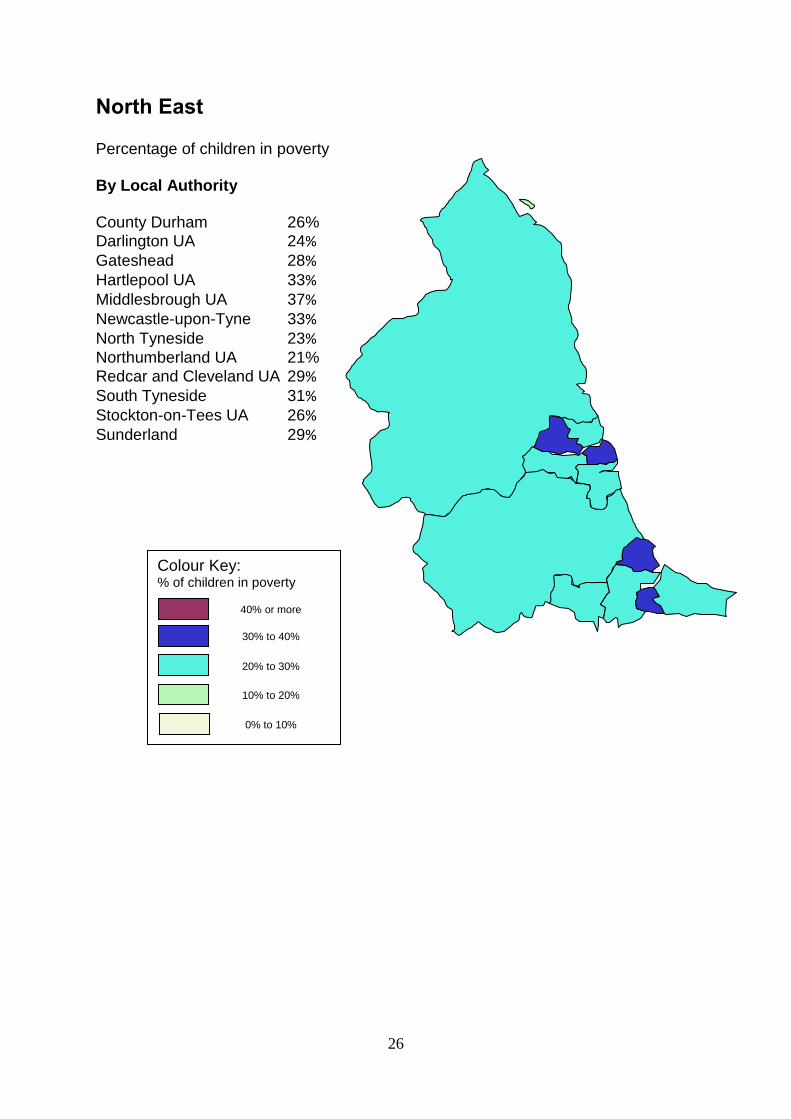
North East
Percentage of children in poverty By Local Authority
County Durham 26%
Darlington UA 24% Gateshead 28% Hartlepool UA 33% Middlesbrough UA 37% Newcastle-upon-Tyne 33% North Tyneside 23% Northumberland UA 21%
Redcar and Cleveland UA 29% South Tyneside 31% Stockton-on-Tees UA 26% Sunderland 29%
Colour Key: % of children in poverty
40% or more
30% to 40%
20% to 30%
10% to 20%
0% to 10%

27
By Parliamentary Constituency Berwick-upon-Tweed 18% Bishop Auckland 27% Blaydon 23% Blyth Valley 25% City of Durham 21% Darlington 26% Easington 31% Gateshead 33% Hartlepool 33% Hexham 13% Houghton and Sunderland South 27% Jarrow 27% Middlesbrough 40% Middlesbrough South and East Cleveland 28% Newcastle upon Tyne Central 38% Newcastle upon Tyne East 35% Newcastle upon Tyne North 26% North Durham 25% North Tyneside 27% North West Durham 23% Redcar 30% Sedgefield 25% South Shields 33% Stockton North 32% Stockton South 19% Sunderland Central 31% Tynemouth 20% Wansbeck 27% Washington and Sunderland West 30%
28
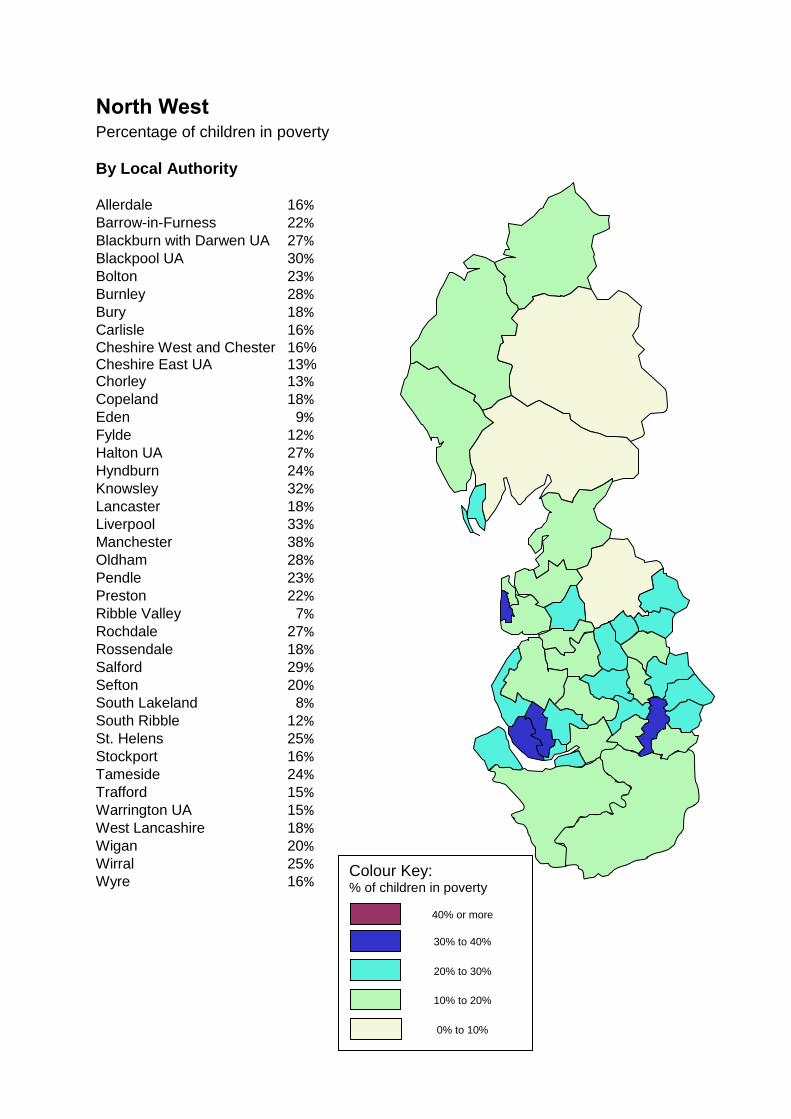
North West Percentage of children in poverty By Local Authority Allerdale 16% Barrow-in-Furness 22% Blackburn with Darwen UA 27% Blackpool UA 30% Bolton 23% Burnley 28% Bury 18% Carlisle 16% Cheshire West and Chester 16% Cheshire East UA 13% Chorley 13% Copeland 18% Eden 9% Fylde 12% Halton UA 27% Hyndburn 24% Knowsley 32% Lancaster 18% Liverpool 33% Manchester 38% Oldham 28% Pendle 23% Preston 22% Ribble Valley 7% Rochdale 27% Rossendale 18% Salford 29% Sefton 20% South Lakeland 8% South Ribble 12% St. Helens 25% Stockport 16% Tameside 24% Trafford 15% Warrington UA 15% West Lancashire 18% Wigan 20% Wirral 25% Wyre 16%
Colour Key: % of children in poverty
40% or more
30% to 40%
20% to 30%
10% to 20%
0% to 10%
29
By Parliamentary Constituency
Altrincham and Sale West 9% Ashton-under-Lyne 24% Barrow and Furness 20% Birkenhead 36% Blackburn 30% Blackley and Broughton 38% Blackpool North and Cleveleys 25% Blackpool South 32% Bolton North East 25% Bolton South East 28% Bolton West 17% Bootle 31% Burnley 28% Bury North 17% Bury South 19% Carlisle 18% Cheadle 8% Chorley 14% City of Chester 17% Congleton 11% Copeland 16% Crewe and Nantwich 18% Denton and Reddish 21% Eddisbury 15% Ellesmere Port and Neston 18% Fylde 12% Garston and Halewood 27% Halton 26% Hazel Grove 14% Heywood and Middleton 23% Hyndburn 23% Knowsley 35% Lancaster and Fleetwood 18% Leigh 20% Liverpool, Riverside 42% Liverpool, Walton 37% Liverpool, Wavertree 28% Liverpool, West Derby 32% Macclesfield 11% Makerfield 16% Manchester Central 47% Manchester, Gorton 37% Manchester, Withington 26% Morecambe and Lunesdale 21% Oldham East and Saddleworth 26% Oldham West and Royton 31% Pendle 23% Penrith and The Border 10% Preston 29% Ribble Valley 8% Rochdale 30% Rossendale and Darwen 18% Salford and Eccles 31% Sefton Central 10% South Ribble 12%
Southport 16% St Helens North 25% St Helens South and Whiston 26% Stalybridge and Hyde 24% Stockport 24% Stretford and Urmston 21% Tatton 10% Wallasey 28% Warrington North 18% Warrington South 11% Weaver Vale 19% West Lancashire 20% Westmorland and Lonsdale 8% Wigan 22% Wirral South 13% Wirral West 14% Workington 18% Worsley and Eccles South 27% Wyre and Preston North 7% Wythenshawe and Sale East 31%
30
South East
Percentage of children in poverty
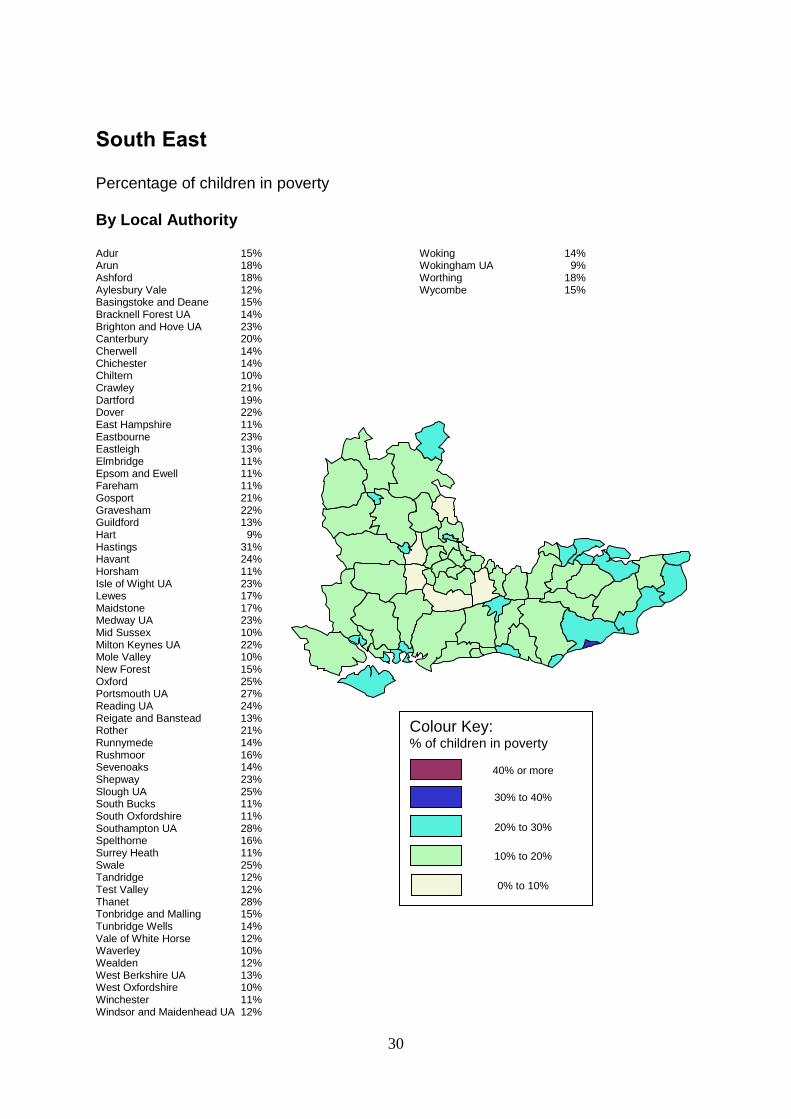
By Local Authority Adur 15% Arun 18% Ashford 18% Aylesbury Vale 12% Basingstoke and Deane 15% Bracknell Forest UA 14% Brighton and Hove UA 23% Canterbury 20% Cherwell 14% Chichester 14% Chiltern 10% Crawley 21% Dartford 19% Dover 22% East Hampshire 11% Eastbourne 23% Eastleigh 13% Elmbridge 11% Epsom and Ewell 11% Fareham 11% Gosport 21% Gravesham 22% Guildford 13% Hart 9% Hastings 31% Havant 24% Horsham 11% Isle of Wight UA 23% Lewes 17% Maidstone 17% Medway UA 23% Mid Sussex 10% Milton Keynes UA 22% Mole Valley 10% New Forest 15% Oxford 25% Portsmouth UA 27% Reading UA 24% Reigate and Banstead 13% Rother 21% Runnymede 14% Rushmoor 16% Sevenoaks 14% Shepway 23% Slough UA 25% South Bucks 11% South Oxfordshire 11% Southampton UA 28% Spelthorne 16% Surrey Heath 11% Swale 25% Tandridge 12% Test Valley 12% Thanet 28% Tonbridge and Malling 15% Tunbridge Wells 14% Vale of White Horse 12% Waverley 10% Wealden 12% West Berkshire UA 13% West Oxfordshire 10% Winchester 11% Windsor and Maidenhead UA 12%
Woking 14% Wokingham UA 9% Worthing 18% Wycombe 15%
r
Colour Key: % of children in poverty
40% or more
30% to 40%
20% to 30%
10% to 20%
0% to 10%
31
By Parliamentary Constituency
Aldershot 15% Arundel and South Downs 12% Ashford 19% Aylesbury 14% Banbury 15% Basingstoke 17% Beaconsfield 11% Bexhill and Battle 18% Bognor Regis and Littlehampton 21% Bracknell 14% Brighton, Kemptown 30% Brighton, Pavilion 19% Buckingham 9% Canterbury 20% Chatham and Aylesford 24% Chesham and Amersham 10% Chichester 14% Crawley 21% Dartford 19% Dover 23% East Hampshire 12% East Surrey 13% East Worthing and Shoreham 17% Eastbourne 22% Eastleigh 15% Epsom and Ewell 11% Esher and Walton 12% Fareham 12% Faversham and Mid Kent 19% Folkestone and Hythe 23% Gillingham and Rainham 23% Gosport 19% Gravesham 22% Guildford 13% Hastings and Rye 30% Havant 26% Henley 9% Horsham 11% Hove 19% Isle of Wight 23% Lewes 17% Maidenhead 11% Maidstone and The Weald 15% Meon Valley 13% Mid Sussex 10% Milton Keynes North 23% Milton Keynes South 22% Mole Valley 10% New Forest East 16% New Forest West 14% Newbury 14% North East Hampshire 9% North Thanet 25% North West Hampshire 13% Oxford East 27% Oxford West and Abingdon 12%
Portsmouth North 23% Portsmouth South 32% Reading East 19% Reading West 22% Reigate 13% Rochester and Strood 20% Romsey and Southampton North 14% Runnymede and Weybridge 13% Sevenoaks 14% Sittingbourne and Sheppey 26% Slough 25% South Thanet 26% South West Surrey 10% Southampton, Itchen 29% Southampton, Test 28% Spelthorne 16% Surrey Heath 12% Tonbridge and Malling 14% Tunbridge Wells 14% Wantage 12% Wealden 12% Winchester 10% Windsor 11% Witney 10% Woking 14% Wokingham 10% Worthing West 18% Wycombe 17%
32
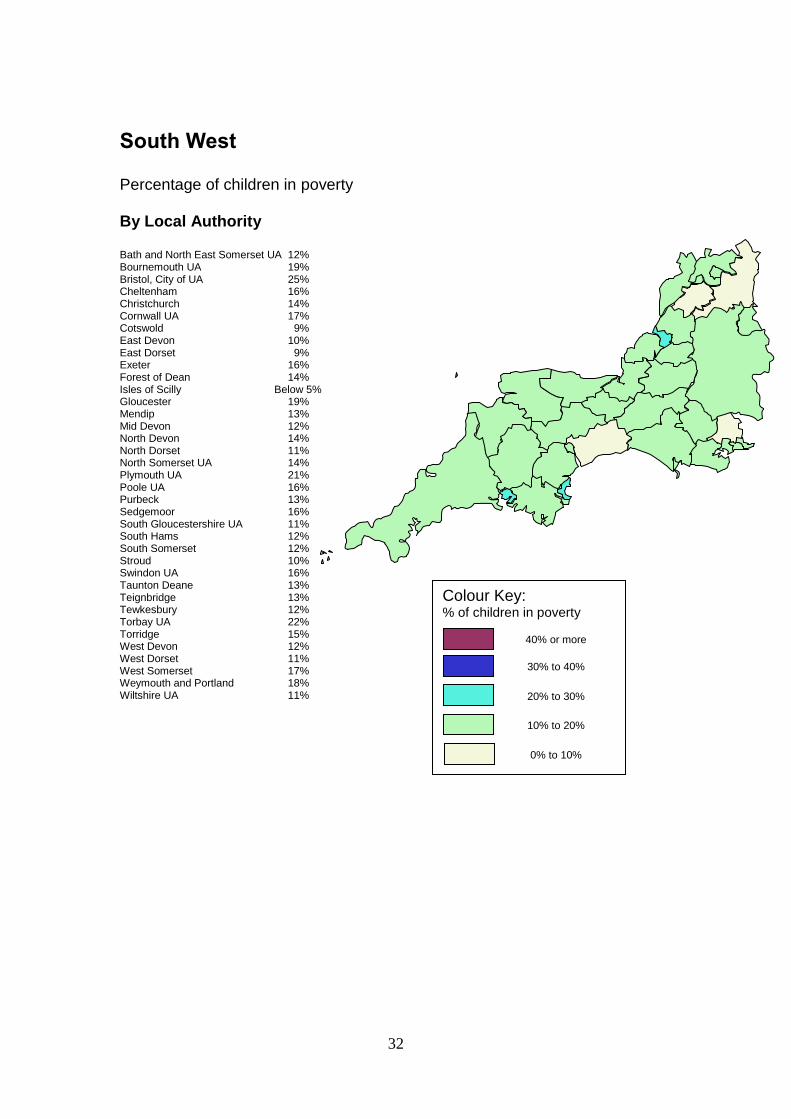
South West
Percentage of children in poverty
By Local Authority Bath and North East Somerset UA 12% Bournemouth UA 19% Bristol, City of UA 25% Cheltenham 16% Christchurch 14% Cornwall UA 17% Cotswold 9% East Devon 10% East Dorset 9% Exeter 16% Forest of Dean 14% Isles of Scilly Below 5% Gloucester 19% Mendip 13% Mid Devon 12% North Devon 14% North Dorset 11% North Somerset UA 14% Plymouth UA 21% Poole UA 16% Purbeck 13% Sedgemoor 16% South Gloucestershire UA 11% South Hams 12% South Somerset 12% Stroud 10% Swindon UA 16% Taunton Deane 13% Teignbridge 13% Tewkesbury 12% Torbay UA 22% Torridge 15% West Devon 12% West Dorset 11% West Somerset 17% Weymouth and Portland 18% Wiltshire UA 11%
C i t y
Colour Key: % of children in poverty
40% or more
30% to 40%
20% to 30%
10% to 20%
0% to 10%
33
By Parliamentary Constituency
Bath 14% Bournemouth East 18% Bournemouth West 22% Bridgwater and West Somerset 18% Bristol East 21% Bristol North West 23% Bristol South 29% Bristol West 25% Camborne and Redruth 20% Central Devon 11% Cheltenham 17% Chippenham 12% Christchurch 13% Devizes 9% East Devon 10% Exeter 17% Filton and Bradley Stoke 11% Forest of Dean 13% Gloucester 20% Kingswood 12% Mid Dorset and North Poole 10% Newton Abbot 15% North Cornwall 16% North Devon 14% North Dorset 10% North East Somerset 10% North Somerset 7% North Swindon 15% North Wiltshire 8% Plymouth, Moor View 25% Plymouth, Sutton and Devonport 25% Poole 16% Salisbury 10% Somerton and Frome 11% South Dorset 17% South East Cornwall 15% South Swindon 18% South West Devon 8% South West Wiltshire 14% St Austell and Newquay 18% St Ives 17% Stroud 11% Taunton Deane 13% Tewkesbury 12% The Cotswolds 8% Thornbury and Yate 9% Tiverton and Honiton 12% Torbay 22%
Torridge and West Devon 14% Totnes 18% Truro and Falmouth 15% Wells 12% West Dorset 11% Weston-Super-Mare 20% Yeovil 13%

34
West Midlands Percentage of children in poverty By Local Authority Birmingham 31% Bromsgrove 7% Cannock Chase 16% Coventry 23% Dudley 19% East Staffordshire 14% Herefordshire UA 11% Lichfield 10% Malvern Hills 11% Newcastle-under-Lyme 15% North Warwickshire 11% Nuneaton and Bedworth 17% Redditch 16% Rugby 11% Sandwell 27% Shropshire UA 10% Solihull 13% South Staffordshire 9% Stafford 9% Staffordshire Moorlands 9% Stoke-on-Trent UA 25% Stratford-on-Avon 7% Tamworth 17% Telford and Wrekin UA 22% Walsall 26% Warwick 9% Wolverhampton 28% Worcester 14% Wychavon 9% Wyre Forest 16%
Colour Key: % of children in poverty
40% or more
30% to 40%
20% to 30%
10% to 20%
0% to 10%

35
By Parliamentary Constituency
Aldridge-Brownhills 13% Birmingham, Edgbaston 27% Birmingham, Erdington 33% Birmingham, Hall Green 32% Birmingham, Hodge Hill 37% Birmingham, Ladywood 42% Birmingham, Northfield 32% Birmingham, Perry Barr 27% Birmingham, Selly Oak 25% Birmingham, Yardley 30% Bromsgrove 7% Burton 15% Cannock Chase 16% Coventry North East 28% Coventry North West 17% Coventry South 23% Dudley North 25% Dudley South 20% Halesowen and Rowley Regis 20% Hereford and South Herefordshire 12% Kenilworth and Southam 5% Lichfield 10% Ludlow 9% Meriden 17% Mid Worcestershire 10% Newcastle-under-Lyme 16% North Herefordshire 10% North Shropshire 10% North Warwickshire 13%
Nuneaton 17% Redditch 16% Rugby 11% Shrewsbury and Atcham 11% Solihull 7% South Staffordshire 9% Stafford 10% Staffordshire Moorlands 9% Stoke-on-Trent Central 26% Stoke-on-Trent North 25% Stoke-on-Trent South 21% Stone 6% Stourbridge 16% Stratford-on-Avon 7% Sutton Coldfield 7% Tamworth 16% Telford 26% The Wrekin 15% Walsall North 32% Walsall South 28% Warley 29% Warwick and Leamington 11% West Bromwich East 26% West Bromwich West 28% West Worcestershire 10% Wolverhampton North East 31% Wolverhampton South East 31% Wolverhampton South West 19% Worcester 14% Wyre Forest 16%

36
Yorkshire and the Humber
Percentage of children in poverty
By Local Authority Barnsley 22% Bradford 24% Calderdale 19% Craven 7% Doncaster 22% East Riding of Yorkshire UA 11% Hambleton 7% Harrogate 6% Kingston-upon-Hull, City of UA 30% Kirklees 18% Leeds 20% North East Lincolnshire UA 25% North Lincolnshire UA 18% Richmondshire 7% Rotherham 21% Ryedale 8% Scarborough 19% Selby 10% Sheffield 22% Wakefield 19% York UA 11%
Colour Key: % of children in poverty
40% or more
30% to 40%
20% to 30%
10% to 20%
0% to 10%
37
By Parliamentary Constituency
Barnsley Central 22% Barnsley East 24% Batley and Spen 18% Beverley and Holderness 11% Bradford East 30% Bradford South 27% Bradford West 28% Brigg and Goole 12% Calder Valley 13% Cleethorpes 17% Colne Valley 14% Dewsbury 19% Don Valley 20% Doncaster Central 22% Doncaster North 23% East Yorkshire 15% Elmet and Rothwell 9% Great Grimsby 30% Halifax 24% Haltemprice and Howden 5% Harrogate and Knaresborough 7% Hemsworth 19% Huddersfield 24% Keighley 17% Kingston upon Hull East 28% Kingston upon Hull North 32% Kingston upon Hull West and Hessle 26% Leeds Central 38% Leeds East 30% Leeds North East 15% Leeds North West 10% Leeds West 27% Morley and Outwood 10% Normanton, Pontefract and Castleford 21% Penistone and Stocksbridge 9% Pudsey 8% Richmond (Yorks) 7% Rother Valley 16% Rotherham 26% Scarborough and Whitby 19% Scunthorpe 22% Selby and Ainsty 9% Sheffield Central 29% Sheffield South East 20% Sheffield, Brightside and Hillsborough 34% Sheffield, Hallam Below 5% Sheffield, Heeley 24%
Shipley 11% Skipton and Ripon 6% Thirsk and Malton 9% Wakefield 20% Wentworth and Dearne 22% York Central 17% York Outer 5%

38
Northern Ireland By local authority
Percentage of children in poverty Antrim 14% Ards 15% Armagh 16% Ballymena 16% Ballymoney 20% Banbridge 14% Belfast 34% Carrickfergus 16% Castlereagh 13% Coleraine 21% Cookstown 20% Craigavon 21% Derry 35% Down 20% Dungannon 19% Fermanagh 19% Larne 17% Limavady 26% Lisburn 21% Magherafelt 17% Moyle 23% Newry and Mourne 25% Newtownabbey 17% North Down 13% Omagh 22% Strabane 32%
Colour Key: % of children in poverty
40% or more
30% to 40%
20% to 30%
10% to 20%
0% to 10%
39
By Parliamentary Constituency
Belfast East 21% Belfast North 36% Belfast South 18% Belfast West 43% East Antrim 15% East Londonderry 23% Fermanagh and South Tyrone 18% Foyle 36% Lagan Valley 13% Mid Ulster 20% Newry and Armagh 23% North Antrim 19% North Down 13% South Antrim 14% South Down 19% Strangford 15% Upper Bann 20% West Tyrone 26%
40
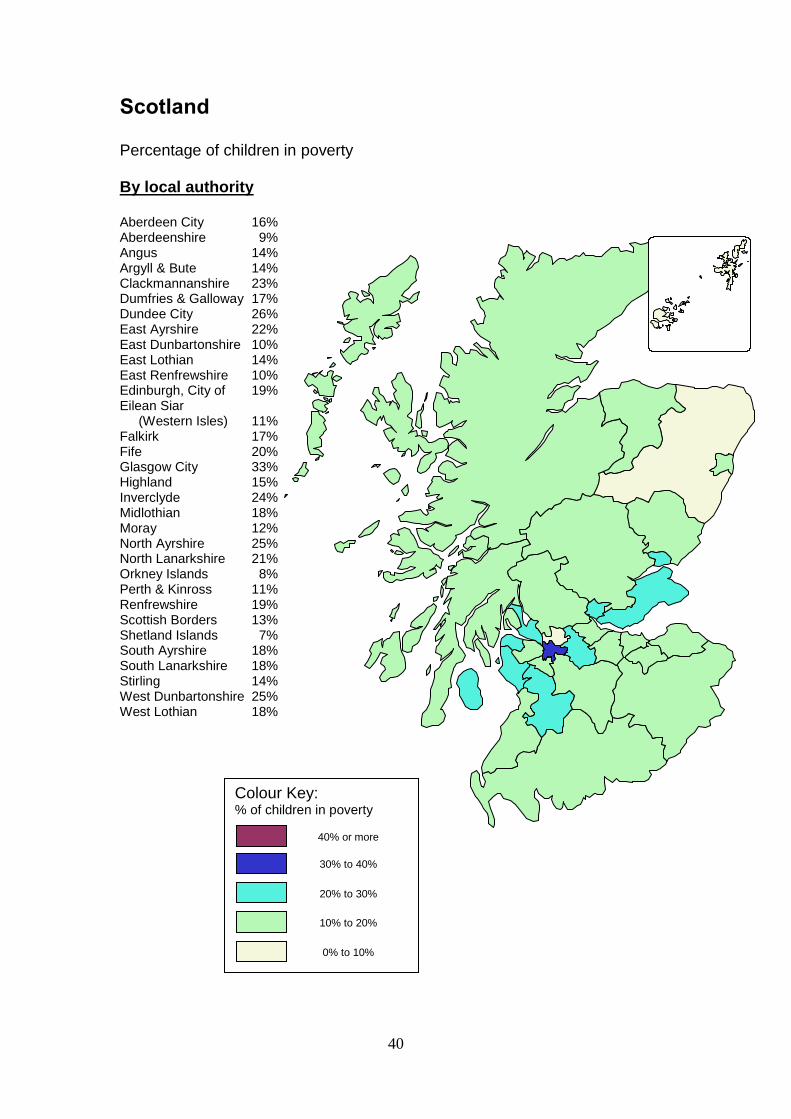
Scotland
Percentage of children in poverty
By local authority Aberdeen City 16% Aberdeenshire 9% Angus 14% Argyll & Bute 14% Clackmannanshire 23% Dumfries & Galloway 17% Dundee City 26% East Ayrshire 22% East Dunbartonshire 10% East Lothian 14% East Renfrewshire 10% Edinburgh, City of 19% Eilean Siar (Western Isles) 11% Falkirk 17% Fife 20% Glasgow City 33% Highland 15% Inverclyde 24% Midlothian 18% Moray 12% North Ayrshire 25% North Lanarkshire 21% Orkney Islands 8% Perth & Kinross 11% Renfrewshire 19% Scottish Borders 13% Shetland Islands 7% South Ayrshire 18% South Lanarkshire 18% Stirling 14% West Dunbartonshire 25% West Lothian 18%
Colour Key: % of children in poverty
40% or more
30% to 40%
20% to 30%
10% to 20%
0% to 10%

41
By Scottish parliamentary constituency
Aberdeen North 23% Aberdeen South 11% Airdrie and Shotts 24% Angus 17% Argyll and Bute 14% Ayr, Carrick and Cumnock 22% Banff and Buchan 13% Berwickshire, Roxburgh and Selkirk 14% Caithness, Sutherland and Easter Ross 19% Central Ayrshire 21% Coatbridge, Chryston and Bellshill 20% Cumbernauld, Kilsyth and Kirkintilloch East 18% Dumfries and Galloway 17% Dumfriesshire, Clydesdale and Tweeddale 14% Dundee East 20% Dundee West 26% Dunfermline and West Fife 16% East Dunbartonshire 8% East Kilbride, Strathaven and Lesmahagow 14% East Lothian 14% East Renfrewshire 10% Edinburgh East 24% Edinburgh North and Leith 22% Edinburgh South 15% Edinburgh South West 19% Edinburgh West 15% Falkirk 17% Glasgow Central 37% Glasgow East 35% Glasgow North 29% Glasgow North East 43% Glasgow North West 32% Glasgow South 26% Glasgow South West 31% Glenrothes 27% Gordon 7% Inverclyde 24% Inverness, Nairn, Badenoch and Strathspey 13% Kilmarnock and Loudoun 22% Kirkcaldy and Cowdenbeath 22% Lanark and Hamilton East 19% Linlithgow and East Falkirk 18% Livingston 18% Midlothian 18% Moray 12% Motherwell and Wishaw 24% Na h-Eileanan an Iar 11% North Ayrshire and Arran 24% North East Fife 12% Ochil and South Perthshire 16% Orkney and Shetland 8% Paisley and Renfrewshire North 17% Paisley and Renfrewshire South 21% Perth and North Perthshire 13% Ross, Skye and Lochaber 12% Rutherglen and Hamilton West 21% Stirling 14% West Aberdeenshire and Kincardine 6% West Dunbartonshire 25%
42
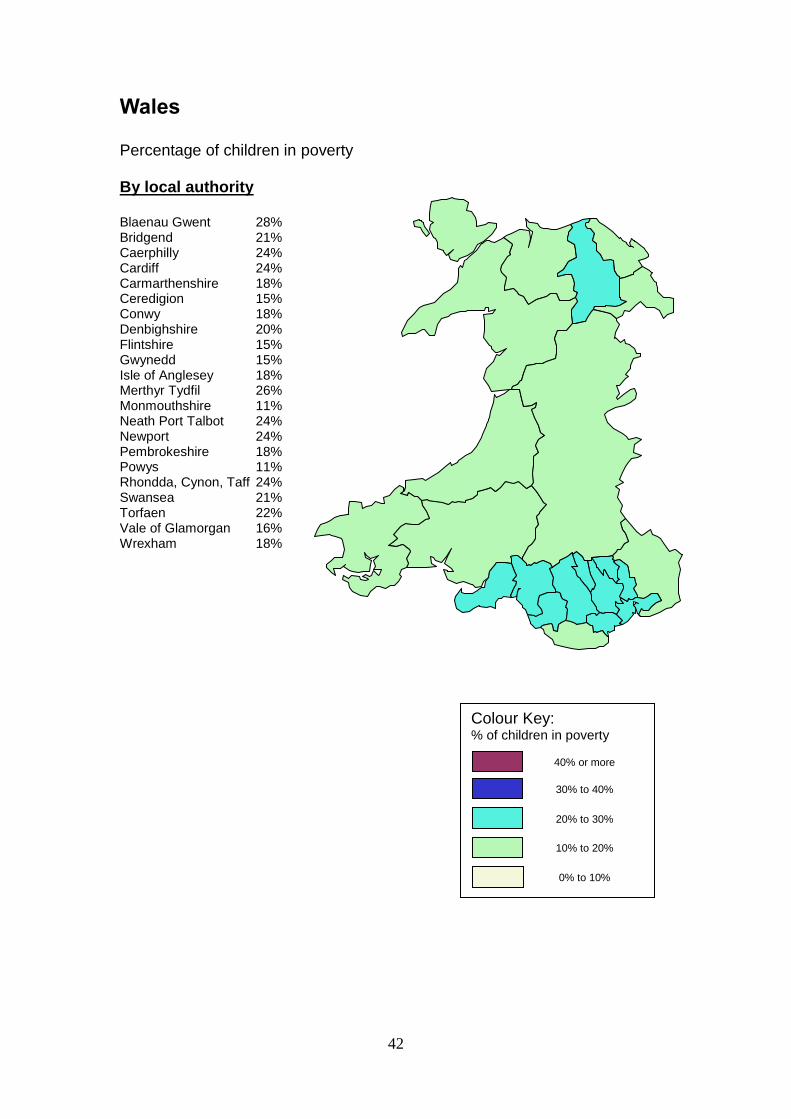
Wales Percentage of children in poverty By local authority Blaenau Gwent 28% Bridgend 21% Caerphilly 24% Cardiff 24% Carmarthenshire 18% Ceredigion 15% Conwy 18% Denbighshire 20% Flintshire 15% Gwynedd 15% Isle of Anglesey 18% Merthyr Tydfil 26% Monmouthshire 11% Neath Port Talbot 24% Newport 24% Pembrokeshire 18% Powys 11% Rhondda, Cynon, Taff 24% Swansea 21% Torfaen 22% Vale of Glamorgan 16% Wrexham 18%
Colour Key: % of children in poverty
40% or more
30% to 40%
20% to 30%
10% to 20%
0% to 10%

43
By parliamentary constituency Aberavon 28% Aberconwy 16% Alyn and Deeside 15% Arfon 17% Blaenau Gwent 28% Brecon and Radnorshire 11% Bridgend 18% Caerphilly 24% Cardiff Central 23% Cardiff North 11% Cardiff South and Penarth 30% Cardiff West 26% Carmarthen East and Dinefwr 15% Carmarthen West and South Pembrokeshire 17% Ceredigion 15% Clwyd South 18% Clwyd West 17% Cynon Valley 27% Delyn 15% Dwyfor Meirionnydd 13% Gower 12% Islwyn 22% Llanelli 22% Merthyr Tydfil and Rhymney 28% Monmouth 11% Montgomeryshire 12% Neath 21% Newport East 23% Newport West 21% Ogmore 24% Pontypridd 17% Preseli Pembrokeshire 17% Rhondda 29% Swansea East 28% Swansea West 22% Torfaen 23% Vale of Clwyd 23% Vale of Glamorgan 18% Wrexham 18% Ynys Môn 18%

44
Appendix 1: Note on method These data have been compiled using the revised local child poverty
indicator (formerly known as National Indicator 116), an official indicator of
child poverty at local level and considered the best current measure of
local levels of child poverty. A full description of the indicator can be found
at: http://www.hmrc.gov.uk/statistics/child-poverty/measure.pdf The local child poverty indicator tries as far as possible to use tax credit
data to replicate the official national indicator for child poverty, a measure
that is based on the Family Resources Survey (FRS) and reported in the
Households Below Average Income (HBAI) survey as children in households
with below 60% median income before housing costs. For children whose
parents do not work, the local child poverty indicator counts poverty as
being in a family in receipt of out of work benefits. This shows more
children as being in poverty than the FRS data, as a proportion of children
in families in receipt of out of work benefits have incomes above the 60 per
cent threshold. Conversely, the local indicator shows considerably less in-
work poverty than the HBAI data. This may be because the former only
considers families in receipt of tax credits, and also because they calculate
incomes at the family rather than the household level. The “family” does
not include, for example, non-dependent children. A family living in the
same household as one or more non-dependents will have a higher income
need for the “household” than for the “family”. If non-dependents are not
working, this can mean that the household income does not reach 60%
median, adjusted for household size, even though the family income is
enough to reach this threshold equivalised to take account of family size and
composition only. These two significant differences, however, balance out, and the revised
local indicator shows a similar number of children in poverty overall as in
national figures. At present, official local data are only available up to 31st August 2010.
However, the Centre for Research in Social Policy has estimated the change
in the number of children in each area in out of work households in mid-
2012 compared to the 2010 data, and added this number to the 2010
figures. It has based this change on regional data, from the Labour Force
Survey, on the percentage of children in workless families. The percentage
point change in this figure for the whole region is applied to the percentage
of children assumed to be in families in receipt of out of work benefits in
each local authority, constituency and ward in the region. The resulting
increase in the number of children in out of work households is taken as an

45
estimate of the rise in the number of out of work families. When added to
the 2010 figures this gives an estimate of child poverty for 2012. While this
method does not pick up differences in the change in levels of worklessness
among different local areas within one region, it does provide a more up-
to-date estimate of child poverty at a local level than the 2010 figures.
46
Appendix 2; Areas where we have been unable to find a published child poverty strategy
Birmingham city Council Blackburn with Darwen Borough Council
Blackpool Council
Bolton Council
Brent
Bromley
Bury
Camden
Cheshire West and Chester Council
City of London
City of Westminster
Coventry city council
Croydon
Derby City Council
Derbyshire
Doncaster
Dorset County Council Dudley Metropolitan Borough Council
East Riding of Yorkshire
East Sussex County Council
Greenwich
Hammersmith and Fulham
Harrow
Herefordshire County Council
Hounslow
Isle of Wight
Islington
Kensington and Chelsea
Leicestershire
Lewisham
London Borough of Sutton
Medway Towns
Milton Keynes
Norfolk County
North East Lincolnshire
Northamptonshire County Council
Northumberland County Council
Redcar and Cleveland
Shropshire
Solihull
Southampton
Southwark
Suffolk

47
Surrey County Council
Telford and Wrekin
Torbay
Warrington
West Sussex
Wiltshire Council Council
Windsor and Maidenhead
Wokingham
Wolverhampton
Worcestershire