Embed Size (px)
Citation preview

Child Nutrition in India
Vinod K. Mishra, Subrata Lahiri,
and Norman Y. Luther
National Family Health Survey Subject Reports
Number 14 • June 1999
International Institute for Population Sciences
Mumbai, India
East-West Center, Population and Health Studies
Honolulu, Hawaii, U.S.A.

Correspondence addresses:
International Institute for Population Sciences
Govandi Station Road, Deonar, Mumbai - 400 088, India
Fax: 91-22-556-3257 • E-mail: [email protected]
East-West Center, Population and Health Studies
1601 East-West Road, Honolulu, Hawaii 96848-1601, U.S.A.Fax: 1-808-944-7490 • E-mail: [email protected]
India’s National Family Health Survey (NFHS) was conducted in 1992–93 under the auspicesof the Ministry of Health and Family Welfare. The survey provides national and state-level
estimates of fertility, infant and child mortality, family planning practice, maternal and child
health, and the utilization of services available to mothers and children. The InternationalInstitute for Population Sciences, Mumbai, coordinated the project in cooperation with 18
population research centres throughout India, the East-West Center in Honolulu, Hawaii, and
Macro International in Calverton, Maryland. The United States Agency for InternationalDevelopment provided funding for the project.
ISSN 1026-4736
This publication may be reproduced for educational purposes.

Child Nutrition in India
Abstract. Malnutrition plagues a disproportionately large number of children in Indiacompared with most other countries. National-level data on child malnutrition in Indiahave, however, been scarce. Recognizing this gap, India’s 1992–93 National FamilyHealth Survey (NFHS) collected anthropometric data on the height and weight of chil-dren below four years of age. The NFHS is based on a large, nationally representativesample and therefore offers a unique opportunity to study the levels and determinantsof child malnutrition in the country. This report estimates levels of child malnutritionand effects of selected demographic and socioeconomic factors on child malnutrition.The analysis focuses primarily on the country as a whole, with some findings for indi-vidual states.
The results of the study indicate high levels of both chronic and acute malnutri-tion among Indian children. Fifty-two percent of all children below age four are stunted(as measured by height-for-age), 54 percent are underweight (as measured by weight-for-age), and 17 percent are wasted (as measured by weight-for-height). The extentof severe malnutrition is also substantial. Twenty-nine percent of the children are se-verely stunted, 22 percent are severely underweight, and 3 percent are severely wasted,according to internationally accepted definitions. The lower prevalence of wasting thanstunting or underweight indicates that chronic malnutrition is more prevalent in Indiathan acute malnutrition. Although less severe in percentage terms, the prevalence ofwasting in India is about 8 times and the prevalence of severe wasting is about 25times the prevalence in the international reference population that provides the basisfor comparison.
There is considerable variation in the prevalence of malnutrition by state. Amongthe states, Bihar and Kerala have the highest and lowest prevalence of malnutrition,respectively. Even in Kerala, which has the lowest prevalence, 27 percent of childrenbelow age four are stunted, 28 percent are underweight, and 12 percent are wasted.
A multivariate analysis of the effects of selected demographic and socioeco-nomic factors on child malnutrition indicates that the strongest predictors of child nutri-tion in India are child’s age, child’s birth order, mother’s education, and householdstandard of living. Older children and children of higher birth order are more likely tobe malnourished. Children whose mothers are more educated and children who livein households with a relatively high standard of living tend to be better nourished than

4
National Family Health Survey Subject Reports, No. 14
other children. Boys and girls have about the same levels of stunting and underweight,but boys are somewhat more likely than girls to be wasted. The disadvantage of boysin this regard is surprising in view of other evidence that girls tend to receive less carethan boys in India.
Vinod K. Mishra, Subrata Lahiri, and Norman Y. Luther
Vinod K. Mishra is a Fellow in Population and Health Studies at the East-West Cen-
ter, Subrata Lahiri is a Professor at the International Institute for Population Sci-
ences, Mumbai, and Norman Y. Luther is a former Senior Fellow in Population and
Health Studies at the East-West Center.
National Family Health Survey Subject Reports, Number 14 • June 1999

5
National Family Health Survey Subject Reports, No. 14
INTRODUCTION
Nutrition has major effects on health. Nutrition refers to the availability of energy
and nutrients to the body’s cells in relation to body requirements. Malnutrition refers
to any imbalance in satisfying nutrition requirements. Malnutrition among children
is often caused by the synergistic effects of inadequate or improper food intake, re-
peated episodes of parasitic or other childhood diseases such as diarrhoea, and im-
proper care during illness (Pelletier 1994; Ruzicka and Kane 1985).
Malnutrition is often cited as an important factor contributing to high morbidity
and mortality among children in developing countries (Sommer and Loewenstein
1975; Chen et al. 1980; Vella et al. 1992a; Vella et al. 1992b; Singh 1989;
Santhanakrishnan and Ramalingam 1987; Ruzicka and Kane 1985; Serdula 1988;
Katz et al. 1989; Briend et al. 1988). The relationship between nutritional status and
child mortality is not conclusive, however. Smedman and colleagues (1987) and the
Kasongo Project Team (1983) do not find a clear relationship between nutritional
status and child survival. A comprehensive review of studies of the relationship be-
tween malnutrition and child mortality in developing countries can be found in Pelletier
(1998).
Malnutrition during childhood can also affect growth potential and risk of mor-
bidity and mortality in later years of life. Malnourished children are more likely to
grow into malnourished adults who face heightened risks of disease and death. Poor
nutritional status of women has been associated with a higher age at menarche (Haq
1984; Roberts et al. 1986) and a lower age at secondary sterility (Karim et al. 1985).
A number of factors affect child nutrition, either directly or indirectly. The most
commonly cited factors are food availability and dietary intake, breastfeeding, preva-
lence of infectious and parasitic diseases, access to health care, immunization against
major childhood diseases, vitamin A supplementation, maternal care during preg-
nancy, water supply and sanitation, socioeconomic status, and health-seeking behav-
ior. Demographic characteristics such as the child’s age and sex, birth intervals (both
preceding and following), and mother’s age at childbirth are also associated with
child nutrition (Sommerfelt and Stewart 1994; Sommerfelt 1991; Vella et al. 1992a;
Vella et al. 1992b).
Several studies indicate that inadequate or improper food intake and repeated
episodes of infectious diseases adversely affect children’s nutritional status (Brown
et al. 1982; Sommerfelt and Stewart 1994). Lutter and colleagues (1989) found that
proper treatment of acute infectious diseases, especially diarrhoea, has beneficial
effects for children’s growth and nutritional status. Briend and colleagues (1988)
found that breast-feeding improves nutritional status and child survival. Esrey et al.
(1988) and Mertens et al. (1990) found that the presence of a clean water supply and
sanitary facilities have beneficial effects on child growth and nutrition. Vitamin A

6
National Family Health Survey Subject Reports, No. 14
supplementation has been shown to reduce morbidity (Ross et al. 1995; Daulaire et
al. 1992) and mortality (Rahmathullah et al. 1990; Daulaire et al. 1992; West et al.
1991; Zeger and Edelstein 1989). The evidence of beneficial effects of vitamin A
supplementation on morbidity and mortality in children is not conclusive, however
(Vijayaraghavan et al. 1990). Inasmuch as vitamin A supplementation reduces mor-
bidity in children, it may also improve their nutritional status.
Discrimination against girls in feeding and health care are often cited as reasons
for poorer nutrition and higher mortality among girls than boys in many developing
countries (Abeykoon 1995; Pebley and Amin 1991; Visaria 1987; Elfindri 1993; Bairagi
1986). However, most studies based on anthropometric data do not find a higher
prevalence of malnutrition among girls (Sommerfelt and Arnold 1998; Sommerfelt
and Stewart 1994; Basu 1993; Schoenbaum et al. 1995).
Many of the factors associated with child nutrition are also associated with each
other. Consequently, any apparent effect of one factor on child nutrition may be due
to the confounding effects of one or more of these other factors. Therefore, when
assessing the effects of any one factor on malnutrition, a multivariate analysis is
necessary to control for the effects of other potentially confounding factors.
Using data from India’s 1992–93 National Family Health Survey (NFHS), this
report analyzes the effects of selected demographic and socioeconomic factors on
various dimensions of malnutrition among children below age four, as indicated by
anthropometric measurements, after statistically controlling for a number of poten-
tially confounding variables. The report complements results presented in the origi-
nal NFHS national report, which, however, provides only simple cross-tabulations of
the prevalence of child malnutrition by selected demographic and socioeconomic
characteristics without controls.
DATA AND METHODS
The analysis is based on data from India’s 1992–93 National Family Health Survey
(NFHS). Data were collected from a probability sample of 89,777 ever-married women
age 13–49 residing in 88,562 households. The NFHS covered 24 states and the Na-
tional Capital Territory of Delhi, which has since attained statehood. The sample
represents 99 percent of India’s population.
Children are the units of analysis. The NFHS collected a complete birth history,
including sex and date of birth of each child, from each ever-married woman age 13–
49 in the sample. It also collected information on the height and weight of children
born since a cut-off date (approximately four years before the survey), as well as a
number of maternal variables relating to the care of each child. From the birth histo-
ries and information linked to them, we created a child data file, into which we also
merged selected household characteristics from the household data file. Thus, the

7
National Family Health Survey Subject Reports, No. 14
child data file contains selected characteristics of children below age four, selected
characteristics of their mothers, and selected characteristics of the households in which
the mothers and children reside.
The NFHS collected information on both the height and weight of each child
below age four in every state except Andhra Pradesh, Himachal Pradesh, Madhya
Pradesh, Tamil Nadu, and West Bengal (IIPS 1995). In these five states, weight was
measured but height was not because height-measuring boards were not available at
the time.1 Interviewers measured the weight of each child using a Salter scale, which
is a hanging spring balance. They measured the height of children under two years of
age with the child lying down on an adjustable measuring board, and the height of
children age two years or older with the child standing up. The training of interview-
ers on height and weight measurement followed United Nations (1986) guidelines.
Interviewers measured height to the nearest 0.1 centimetres and weight to the nearest
100 grams.
Our measures of child malnutrition are based on height-for-age, weight-for-
age, and weight-for-height. Each of these indices provides somewhat different infor-
mation about the nutritional status of children. The height-for-age index measures
linear growth retardation among children, primarily reflecting chronic malnutrition.
The weight-for-height index measures body mass in relation to body height, prima-
rily reflecting acute malnutrition. Weight-for-age reflects both chronic and acute
malnutrition.
The calculation of the three indices of child malnutrition involves comparison
with an international reference population as recommended by the World Health Or-
ganization (Dibley et al. 1987a; Dibley et al. 1987b). The justification for use of a
reference population is the empirical finding that well-nourished children in all popu-
lations follow very similar growth patterns (Habicht et al. 1974; Martorell and Habicht
1986). The Nutrition Foundation of India has concluded that the WHO standard is
applicable to Indian children (Agarwal et al. 1991).
The three indices of child malnutrition are expressed in terms of standard de-
viation units from the median in the international reference population. Children who
fall more than two standard deviations below the reference median are considered to
be malnourished, and those who fall more than three standard deviations below the
reference median are considered to be severely malnourished. Thus, children who are
more than two standard deviations below the median of the international reference
1. These five states cluster closely around the national estimate of the percentage of children who are
underweight, which is the only nutritional index that can be calculated for these states. It therefore
seems unlikely that the lack of height data for these states substantially biases our national estimates of
height-based measures of child nutrition.
8
National Family Health Survey Subject Reports, No. 14
population in terms of their height-for-age are defined as stunted, and those more
than three standard deviations below the reference median are defined as severely
stunted. The categories underweight, severely underweight (based on weight-for-age),
wasted, and severely wasted (based on weight-for-height) are similarly defined. Wast-
ing is usually associated with the failure to receive adequate nutrition in the period
immediately before the survey and may be the result of seasonal variations in food
supply or recent episodes of illness, especially diarrhoea.
Several factors affect the validity of these measures, including coverage of the
population of children and accuracy of the anthropometric measurements. In the NFHS,
about 16 percent of living children below age four were not weighed and measured
(see IIPS 1995, Appendix D, Table D.3), usually because the child was not at home or
because the mother refused to allow the measurements to be taken. These children
are excluded from the analysis. Also excluded from the analysis are children whose
month and year of birth were not reported by the mother and children with grossly
improbable weight or height measurements. Two of the three measures of child nutri-
tion (height-for-age and weight-for-age) are sensitive to accurate reporting of children’s
ages. Weight-for-height is the only measure that does not depend on accuracy of age
reporting. The weight-for-height measure is, however, sensitive to errors in the indi-
vidual component measures of weight and height, especially if the errors are in oppo-
site directions. Further details about the quality of anthropometric data in Demo-
graphic and Health Surveys can be found in Sommerfelt and Boerma (1993).
Our analysis of the effects of demographic and socioeconomic variables on the
three indices of child malnutrition is multivariate and employs logistic regression
models. The response (or dependent) variable in each model is a dummy (two-cat-
egory) variable that simply indicates whether a child is stunted, underweight, or wasted
(i.e., whether the child is more than two standard deviations below the median of the
international reference population in terms of height-for-age, weight-for-age, or
weight-for-height). Thirteen predictor variables are used in the analysis. All predictor
variables are categorical.
The predictor variables are: child’s age in months (<12, 12–23, 24–47); sex of
child (male, female); birth order of child (one, two or three, four or five, six or higher);
mother’s age at childbirth (13–24, 25–34, 35–49); residence (urban, rural); mother’s
education (illiterate, literate but less than middle school complete, middle school
complete or higher); religion2 (Hindu, Muslim, other); caste/tribe3 (SC/ST, other);
2. Other religions include Sikh, Christian, Jain, Buddhist, and others.
3. Scheduled castes (SC) and scheduled tribes (ST) are those castes and tribes identified by the Govern-
ment of India as socially and economically disadvantaged and in need of protection from social injustice
and exploitation.

9
National Family Health Survey Subject Reports, No. 14
exposure to electronic mass media4 (regularly exposed, not regularly exposed); house-
hold standard of living5 (low, medium, high); mother received iron and folic acid
tablets during pregnancy (yes, no); mother received two or more tetanus injections
during pregnancy (yes, no); and geographic region6 (North, Central, East, Northeast,
West, South). These variables are selected for analysis because they are known to be
associated with child nutrition (see, for example, Sommerfelt and Stewart 1994) and
because they are readily available from the NFHS.
Two additional predictor variables considered were ‘received any vaccination’
(yes, no) and ‘received vitamin A’ (yes, no). The analysis incorporating these two
variables excluded children below 12 months of age because vaccinations and vita-
min A supplementation are usually received during the first year of life. Neither of
these variables had a significant effect on any of the three indices of child malnutri-
tion, and their inclusion or exclusion from the regression models did not alter the
effects of any of the other 13 predictor variables. Results from the analysis that incor-
porated these two variables are therefore not shown in this report.
We estimate both unadjusted and adjusted effects of each of the 13 predictor
variables on stunting, underweight, and wasting. In this context, ‘adjusted’ means
that other selected demographic and socioeconomic variables are statistically con-
trolled by holding them constant at their mean values. We present effects in the form
of unadjusted and adjusted percentages malnourished for categories of each predic-
tor variable of interest. The unadjusted percentages for categories of a given predic-
tor variable are estimated from a separate logistic regression in which that predictor
variable is the only one considered. Because each underlying regression contains just
one predictor variable, the unadjusted percentages do not incorporate controls for
any other, potentially confounding, predictor variables. Whereas the unadjusted per-
centages are based on many logistic regressions, one for each predictor variable, the
adjusted percentages (for a particular response variable) are based on a single logistic
4. A woman is categorized as regularly exposed to electronic mass media if she listens to radio at least
once a week or watches television at least once a week or goes to a cinema hall or theatre to see a movie
at least once a month.
5. Standard of living is measured by a household assets scale that ranges from 0 to 27 (low 0, medium 1-
7, high 8-27). The household assets scale scores items as follows: automobile 4, refrigerator 3, television
3, VCR/VCP 3, motorcycle/scooter 3, sewing machine 2, sofa set 2, fan 2, radio/transistor 2, bicycle 2,
clock/watch 1.
6. The geographic region variable is as defined in the NFHS national report (IIPS 1995). North includes
Delhi, Haryana, Himachal Pradesh, Jammu region of Jammu and Kashmir, Punjab, and Rajasthan; Cen-
tral includes Madhya Pradesh and Uttar Pradesh; East includes Bihar, Orissa, and West Bengal; North-
east includes Arunachal Pradesh, Assam, Manipur, Meghalaya, Mizoram, Nagaland, and Tripura; West
includes Goa, Gujarat, and Maharashtra; and South includes Andhra Pradesh, Karnataka, Kerala, and
Tamil Nadu.

10
National Family Health Survey Subject Reports, No. 14
regression that includes all 13 predictor variables. In calculating adjusted percent-
ages for categories of any given predictor variable, the set of control variables con-
sists of all the other 12 predictor variables, which are controlled by setting them at
their mean values. This method of presenting results when controlling for potentially
confounding variables is called Multiple Classification Analysis, or MCA. In the
tables, we do not show the logistic regression coefficients but rather present our re-
sults in the simple cross-tabulation format of MCA tables. The reader is referred to
Retherford and Choe (1993) for further details regarding the use of MCA tables in
conjunction with logistic regression analysis.
In the logistic regression analyses, the estimation of significance levels takes
into account design effects due to clustering at the level of the primary sampling unit.
The regressions were estimated using the STATA statistical software package (Stata
Corporation 1997). Constant terms in the regressions are reset so that predicted per-
centages agree with observed percentages when all predictor variables in the regres-
sions are set to their mean values.
Because urban and rural environments in India are quite different, the factors
affecting child malnutrition may have different effects in urban and rural areas. And
because there is considerable discrimination against girls, especially in the northern
states of India, the factors affecting child malnutrition may have different effects for
boys and girls. For these reasons, the analyses of factors affecting child malnutrition
are also carried out separately for urban and rural areas and for boys and girls.
In some states the NFHS sample design is self-weighting, but in other states
certain sectors of the population, such as urban areas, are over-sampled, necessitating
the use of weights to restore the correct proportions. Some states are over-repre-
sented and others are under-represented in the sample, necessitating an additional set
of weights when aggregating to the national level. All results presented in this report
are based the on the weighted sample. The NFHS sample design is discussed in more
detail in the original survey report (IIPS 1995).
RESULTS
Table 1 presents the percentage of children below age four who are malnourished
according to height-for-age, weight-for-age, or weight-for-height for India as a whole
and for individual states. Fifty-two percent are stunted, 54 percent are underweight,
and 17 percent are wasted. The percentages who are severely malnourished accord-
ing to these two measures are also substantial. Twenty-nine percent are severely stunted,
22 percent are severely underweight, and 3 percent are severely wasted.
The lower prevalence of wasting than stunting or underweight indicates that
chronic malnutrition is more prevalent in India than acute malnutrition. Even so,
levels of wasting and severe wasting in India are many times higher than those in the

11
National Family Health Survey Subject Reports, No. 14
international reference population. The percentages of children who are wasted and
severely wasted in the international reference population are estimated to be 2.28
percent and 0.13 percent, respectively (Dibley et al. 1987a; Dibley et al. 1987b). This
implies that, in India, wasting is about 8 times and severe wasting about 25 times that
in the reference population.
Figure 1 additionally presents levels of stunting, underweight, and wasting by
urban/rural residence. The prevalences of stunting and underweight are considerably
Table 1 Among children age 0–47 months, the percentage classified as undernourished according to threeanthropometric indices of nutritional status, by state, India, 1992–93
Height-for-age Weight-for-age Weight-for-height
Severely Severely SeverelyStunted stunted Underweight underweight Wasted wasted
(percentage (percentage (percentage (percentage (percentage (percentageState below below below below below below
–2 SDa) –3 SD) –2 SDa) –3 SD) –2 SDa) –3 SD)
India 52 29 54 22 17 3NorthDelhi 43 19 41 12 12 3Haryana 47 19 38 9 6 1Himachal Pradesh U U 48 15 U UJammu region of 41 19 44 14 15 3 Jammu and KashmirPunjab 40 16 46 14 20 3Rajasthan 43 27 42 19 19 5
CentralMadhya Pradesh U U 61 29 U UUttar Pradesh 59 36 59 24 16 3
EastBihar 61 39 63 31 22 4Orissa 48 25 53 23 21 4West Bengal U U 58 22 U U
NortheastArunachal Pradesh 54 28 40 15 11 3Assam 52 26 50 18 11 2Manipur 33 16 30 7 9 1Meghalaya 51 38 45 17 19 5Mizoram 41 16 28 5 2 1Nagaland 32 13 29 8 13 2Tripura 46 21 49 19 17 1
WestGoa 32 11 35 9 15 2Gujarat 48 25 50 17 19 4Maharashtra 48 23 54 21 20 4
SouthAndhra Pradesh U U 51 20 U UKarnataka 47 22 54 19 17 3Kerala 27 9 28 6 12 1Tamil Nadu U U 49 15 U U
Note: Each of the indices is expressed in standard deviation units (SD) from the median of the international reference population. Figures in this
table and in subsequent tables differ slightly from those published in the original NFHS reports because this report uses a revised set of z-scores
for height-for-age, weight-for-age, and weight-for-height and because figures are for children born 0–47 months before the survey.
U: Not available because children’s height was not measured.
a. Includes the children who are below minus 3 standard deviations (SD) from the international reference population median.

12
National Family Health Survey Subject Reports, No. 14
higher in rural areas than in urban areas, as expected. The prevalence of wasting is
also somewhat higher in rural areas than in urban areas.
As mentioned earlier, data on height was not collected in the states of Andhra
Pradesh, Himachal Pradesh, Madhya Pradesh, Tamil Nadu, and West Bengal. Hence
height-for-age and weight-for-height are not available for children in those states.
There are large variations in the prevalence of malnutrition among the remaining
states. Bihar and Kerala have the highest and lowest levels of malnutrition in the
country, respectively (Figure 2). In Bihar, 61 percent of children below age four are
stunted, and 63 percent are underweight. Even in Kerala, which has the best nutrition
according to our anthropometric measures and the lowest infant and child mortality
in the country, 27 percent of young children are stunted, and 28 percent are under-
weight. Other states, beside Kerala, with relatively low levels of stunting and under-
weight are Manipur, Mizoram, Nagaland, and Goa.
The prevalence of wasting is 12 percent in Kerala and 22 percent in Bihar. The
problem of wasting is most evident in Bihar and Orissa, which not coincidently have,
among the states, some of the highest infant mortality rates in India. Surprisingly, the
prevalence of wasting is relatively low in Uttar Pradesh, which is a comparatively
poor state, and relatively high in Punjab, which is by far the economically most ad-
vanced state in the country. These anomalous findings may, in part, be due to the
effect of seasonality on wasting, since both diet and diarrhoeal diseases are subject to
Figure 1 Percentage of children under age four who are stunted, underweight, orwasted, by residence, India, 1992–93
45 46
16
5457
18
52 54
17
0
10
20
30
40
50
60
70
Stunted Under-weight
Wasted Stunted Under-weight
Wasted Stunted Under-weight
Wasted
Per
cent
age
Urban TotalRural

13
National Family Health Survey Subject Reports, No. 14
seasonal variation and since NFHS data for different states were collected in different
seasons. Since such anomalies are not observed in the case of proportion underweight,
which is also an indicator of acute malnutrition and should be similarly sensitive to
seasonal variation, there is need to use caution in interpreting results for wasting.
Seasonality should not affect the prevalence of stunting, which is an indicator of
chronic malnutrition.
Factors affecting nutritional status of children
We estimate the effects of the selected demographic and socioeconomic predictor
variables on child nutrition separately for each of the three nutrition indicators—
stunting, underweight, and wasting. Table 2 presents definitions and mean values of
the response and predictor variables, both for India as a whole and separately for
urban and rural areas and for boys and girls. Because all variables are categorical, the
mean value of a variable consists of the set of proportions of women falling in each
category of that variable. These proportions are expressed as percentages in the table.
We have already discussed the definitions of the three response variables—stunting,
underweight, and wasting—and their mean values for India and for urban and rural
areas. By sex of child, there is no difference in the prevalence of stunting or in the
prevalence of underweight, but, unexpectedly, the prevalence of wasting is somewhat
higher for boys than for girls.
Figure 2 Percentage of children under age four who are stunted, underweight, orwasted in Kerala and Bihar, 1992–93
27 28
12
61 63
22
0
10
20
30
40
50
60
70
Stunted Underweight Wasted Stunted Underweight Wasted
Per
cent
age
Kerala Bihar

14
National Family Health Survey Subject Reports, No. 14
Of the 49,006 children below age four in the sample, 52 percent are below age
two, 51 percent are boys, 31 percent are of birth order 4 or higher, 60 percent received
at least one vaccination, and 18 percent received vitamin A supplementation. Sixty-
one percent of the children were born to mothers 24 years or younger, and about two-
thirds have illiterate mothers. Twenty-three percent live in urban areas, 80 percent are
Hindu, and 23 percent belong to a scheduled caste or scheduled tribe. Forty-seven
percent have mothers who are regularly exposed to the electronic mass media. Twenty-
nine percent live in households with a low standard of living, 52 percent in house-
holds with a medium standard of living, and the remaining 19 percent in households
with a high standard of living. Mothers of 51 percent of these children received iron
and folic acid tablets when they were pregnant, and mothers of 54 percent of the
Table 2 Variable definitions and mean values for children born in the period 0–47 months before the NFHS, byurban/rural residence and by sex of child, India, 1992–93
Meana (percent)
Residence Sex of child
Variable Definition Total Urban Rural Boy Girl
Response variablesStunted Height-for-age is more than two standard 52 45 54 52 52
deviation units below the median of theinternational reference population(height-for-age < –2 SD)
Underweight Weight-for-age is more than two standard 54 46 57 54 54deviation units below the median of theinternational reference population(weight-for-age < –2 SD)
Wasted Weight-for-height is more than two standard 17 16 18 19 16deviation units below the median of theinternational reference population(weight-for-height < –2 SD)
Predictor variablesChild’s age 12–23 Child’s age is 12–23 months 26 25 26 26 26Child’s age 24–47 Child’s age is 24–47 months 48 49 48 48 48Sex of child Child is a boy 51 51 51 100 0Birth order two or three Child’s birth order is two or three 41 44 41 41 42Birth order four or five Child’s birth order is four or five 19 17 20 20 19Birth order six or higher Child’s birth order is six or higher 12 8 13 12 11Received any vaccination Child received any vaccination 60 76 56 62 59Received vitamin A Child received vitamin A 18 26 16 19 17Mother’s age 25–34 Mother’s age was 25–34 years at childbirth 34 37 33 34 34Mother’s age 35–49 Mother’s age was 35–49 years at childbirth 5 4 6 5 5Residence Residence is urban 23 100 0 23 23Mother’s education: Mother is literate with less than a middle- 17 20 15 16 17Literate, < middle complete school education
Mother’s education: Mother is literate with a middle-school or 17 38 11 17 17Middle complete or higher higher education
Muslim Child lives in a household whose head is 15 23 13 15 16Muslim
Other religion Child lives in a household whose head is 5 7 5 5 5neither Hindu nor Muslim

15
National Family Health Survey Subject Reports, No. 14
children received two or more tetanus injections during pregnancy. There are sharp
urban/rural differences in the mean values of most socioeconomic variables, but not
of the demographic variables. The mean values of most variables by sex of child are
close to those for both sexes combined.
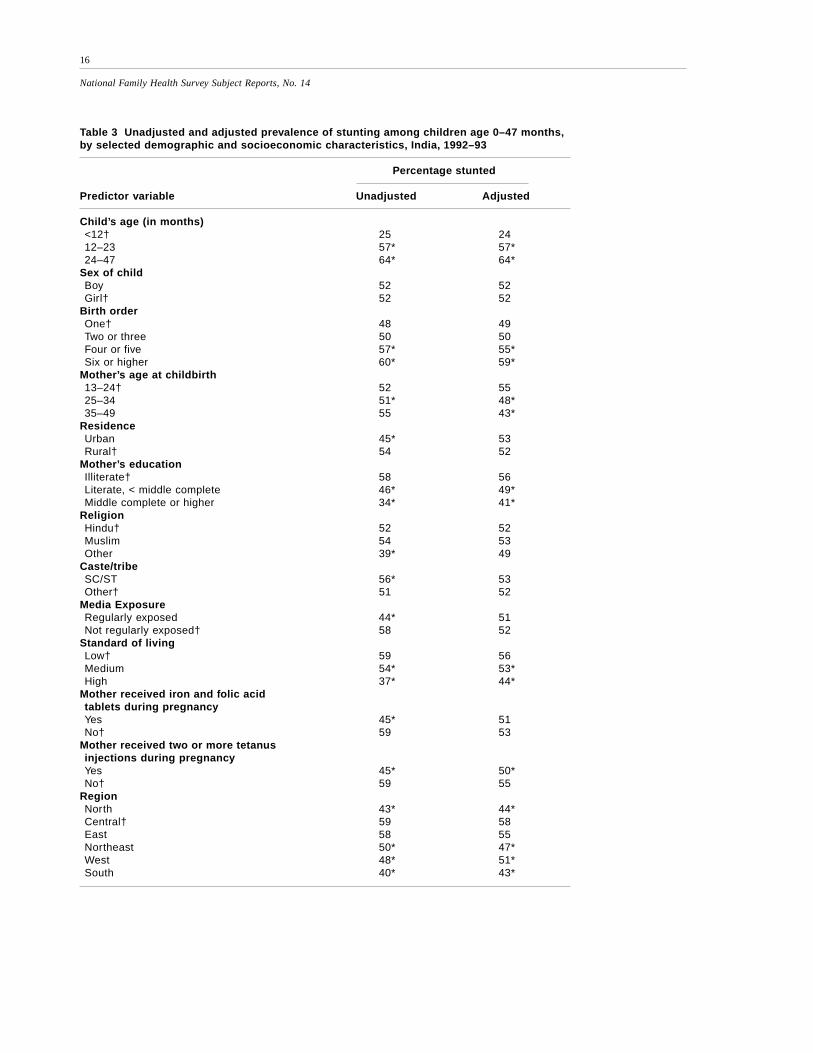
Stunting. Table 3 shows the effects of selected demographic and socioeconomic vari-
ables on the prevalence of stunting among children below age four. As mentioned
earlier, the effects are estimated using logistic regression and multiple classification
analysis.
As child’s age increases, there is a marked increase in stunting. In India as a
whole, children age 24–47 months are more than twice as likely as infants to be
Table 2, continued
Meana (percent)
Residence Sex of child
Variable Definition Total Urban Rural Boy Girl
Scheduled caste or Child lives in a household whose head 23 14 26 23 23scheduled tribe belongs to a scheduled caste (SC) or
scheduled tribe (ST)b
Media exposure Mother listens to radio or watches television 47 76 39 47 47at least once a week or visits a cinema atleast once a month
Standard of living: medium Child lives in a household with a medium 52 40 56 52 53standard of living
Standard of living: high Child lives in a household with a high 19 47 11 19 19standard of living
Mother received iron and Mother received iron and folic acid tablets 51 69 45 51 50folic acid tablets while pregnant with specified child
Mother received two or Mother received two or more tetanus 54 75 48 54 54more tetanus injections injections while pregnant with specified
childNorth Child lives in Delhi, Haryana, Himachal 12 13 11 12 11
Pradesh, Jammu Region of Jammu andKashmir, Punjab, or Rajasthan
East Child lives in Bihar, Orissa, or West Bengal 22 16 24 22 22Northeast Child lives in Arunachal Pradesh, Assam, 4 2 5 4 4
Manipur, Meghalaya, Mizoram, Nagaland,or Tripura
West Child lives in Goa, Gujarat, or Maharashtra 13 21 11 13 14South Child lives in Andhra Pradesh, Karnataka, 19 24 17 18 19
Kerala, or Tamil Nadu
Number of casesc Number of children born in the period 0–47months before the survey 49,006 11,137 37,869 25,033 23,973
a. Mean values are based on the weighted sample.
b. Scheduled castes (SC) and scheduled tribes (ST) are those castes and tribes identified by the Government of India as socially and
economically disadvantaged and in need of protection from social injustice and exploitation.
c. Actual sample size varies slightly for individual variables depending on the number of missing values.
16
National Family Health Survey Subject Reports, No. 14
Table 3 Unadjusted and adjusted prevalence of stunting among children age 0–47 months,by selected demographic and socioeconomic characteristics, India, 1992–93
Percentage stunted
Predictor variable Unadjusted Adjusted
Child’s age (in months)<12† 25 2412–23 57* 57*24–47 64* 64*
Sex of childBoy 52 52Girl† 52 52
Birth orderOne† 48 49Two or three 50 50Four or five 57* 55*Six or higher 60* 59*
Mother’s age at childbirth13–24† 52 5525–34 51* 48*35–49 55 43*
ResidenceUrban 45* 53Rural† 54 52
Mother’s educationIlliterate† 58 56Literate, < middle complete 46* 49*Middle complete or higher 34* 41*
ReligionHindu† 52 52Muslim 54 53Other 39* 49
Caste/tribeSC/ST 56* 53Other† 51 52
Media ExposureRegularly exposed 44* 51Not regularly exposed† 58 52
Standard of livingLow† 59 56Medium 54* 53*High 37* 44*
Mother received iron and folic acidtablets during pregnancyYes 45* 51No† 59 53
Mother received two or more tetanusinjections during pregnancyYes 45* 50*No† 59 55
RegionNorth 43* 44*Central† 59 58East 58 55Northeast 50* 47*West 48* 51*South 40* 43*

17
National Family Health Survey Subject Reports, No. 14
stunted. Twenty-five percent of infants and 64 percent of children age 24–47 months
are stunted. A somewhat more detailed breakdown by age in Figure 3 shows that
stunting is considerably less common in the first six months of life, when most babies
are fully breastfed, than at older ages. The prevalence of stunting increases rapidly up
to 12–23 months of age, after which it increases more slowly. The unadjusted and
adjusted percentages by child’s age are almost the same as shown in Table 3, indicat-
ing that the effect of child’s age on stunting operates independently of the effects of
the other predictor variables.
Interestingly, the prevalence of stunting is the same for boys and girls (Figure
4). This finding is somewhat surprising, inasmuch as there is widespread discrimina-
tion against girls in India (United Nations 1998). A separate analysis for Bihar and
Kerala, the states with the highest and lowest prevalence of malnutrition, indicates
that even in Bihar, in which the status of women is arguably the lowest of any state in
India, there is no significant difference in the prevalence of stunting between boys
and girls (results not shown). Some other studies have also observed the absence of
the expected gender differential in nutrition in India, as well as in other developing
countries with widespread discrimination against girls, but no concrete reasons for
this unexpected finding are suggested (Sommerfelt and Arnold 1998; Sommerfelt
and Stewart 1994; Basu 1993; Schoenbaum et al. 1995). Data from the NFHS are not
sufficiently detailed to permit a more in-depth investigation of possible reasons for
the unexpected absence of a gender differential in child nutrition favoring boys.
Because competition for nutrition increases as the number of children increases
within a family, one might expect that children of higher birth order would have a
greater risk of stunting than would children of lower birth order. Table 3 confirms this
expectation. Children of birth order 4 or higher are considerably more likely to be
stunted than are children of lower birth orders. Adjusting for the other 12 predictor
variables makes little difference to the effect of birth order on the risk of stunting.
Notes to Table 3:
Children from Andhra Pradesh, Himachal Pradesh, Madhya Pradesh, Tamil Nadu, and West Bengal are excluded
because height was not measured for children in those states. A child who is more than two standard deviations
below the median of the reference population in terms of height-for-age is defined as stunted. Both unadjusted and
adjusted values are estimated by logistic regression. Unadjusted values are based on a separate logistic regression
for each predictor variable, with that predictor variable as the only predictor variable in the regression. Adjusted
values are based on a single logistic regression that includes all of the predictor variables in the table. In calculating
adjusted values for categories of any given predictor variable, the set of control variables consists of all other
predictor variables in the table. Constant terms in the regressions are reset so that predicted percentages agree with
observed percentages when predictor variables are set to their mean values. Significance levels take design effects
due to clustering into account.
*The coefficient of the corresponding variable in the underlying logistic regression differs significantly from zero at the
5 percent level.
† Reference category in the underlying logistic regression.

18
National Family Health Survey Subject Reports, No. 14
Figure 4 Percentage of children under age four who are stunted, underweight, orwasted, by sex, India, 1992–93
Figure 3 Percentage of children under age four who are stunted, by age, India,1992–93
16
34
5660
67
0
10
20
30
40
50
60
70
<6 6-11 12-23 24-35 36-47
Age in months
Per
cent
age
stun
ted
52 52 54 54
1916
0
10
20
30
40
50
60
Boy Girl Boy Girl Boy Girl
Sex of child
Per
cent
age
Stunted WastedUnderweight

19
National Family Health Survey Subject Reports, No. 14
The prevalence of stunting also does not vary much by mother’s age at child-
birth. When the effects of the other predictor variables (including birth order) are
statistically controlled, however, children born to younger mothers have a higher
prevalence of stunting. Possibly this reflects improved expertise in childcare as par-
ents get older.
The unadjusted prevalence of stunting is considerably lower in urban areas than
in rural areas. However, once the other predictor variables are controlled, the rela-
tionship between residence and stunting slightly reverses and almost disappears. This
suggests that the effects of urban/rural residence are mostly indirect, through the
other predictor variables.
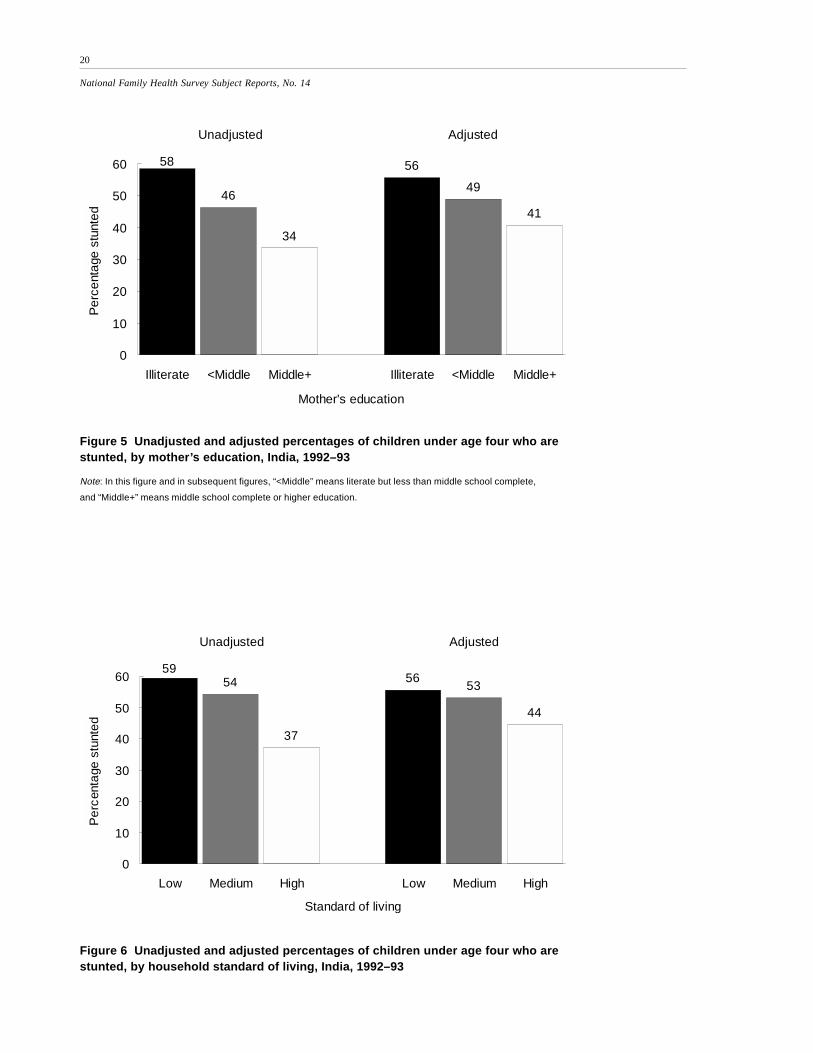
Table 3 and Figure 5 show that the differentials in stunting by mother’s educa-
tion are large. Even after the other predictor variables are controlled, 56 percent of
children of illiterate mothers are stunted, compared with 41 percent of mothers who
have completed middle school or higher. Thus mother’s education has large direct
effects on stunting as well as some indirect effects through some of the other predic-
tor variables.
Hindus and Muslims have about the same prevalence of stunting, but children
belonging to other religions have a considerably lower prevalence of stunting. Con-
trolling for the other predictor variables, however, explains away most of the effect of
religion, suggesting that the effects of religion stem mainly from the relatively high
socioeconomic status of families belonging to other religions. Similarly, children
belonging to scheduled castes or scheduled tribes have a significantly higher preva-
lence of stunting than do other children. Again, when the other predictor variables are
statistically controlled, the effect of caste/tribe on prevalence of stunting largely dis-
appears, suggesting that the unadjusted differences by caste/tribe stem mainly from
the relatively low socioeconomic status of families who belong to a scheduled caste
or scheduled tribe. Children of mothers who are regularly exposed to the electronic
mass media have a lower prevalence of stunting than do children whose mothers are
not regularly exposed. Controlling for the other predictor variables largely eliminates
the effect of mother’s media exposure, suggesting that media exposure has no inde-
pendent effect on stunting.
Table 3 and Figure 6 show that the standard of living of the household in which
the child resides has a strong effect on the prevalence of stunting, as expected. The
unadjusted prevalence of stunting among children in households with a low standard
of living is 59 percent, compared with 37 percent for children in households with a
high standard of living. This differential is reduced to 56 and 44 percent when the
other predictor variables are controlled, indicating a strong direct effect of standard
of living on prevalence of stunting.
Children of mothers who received iron and folic acid tablets when they were
pregnant have a lower prevalence of stunting than do children whose mothers did not
20
National Family Health Survey Subject Reports, No. 14
Figure 5 Unadjusted and adjusted percentages of children under age four who arestunted, by mother’s education, India, 1992–93
Note: In this figure and in subsequent figures, “<Middle” means literate but less than middle school complete,
and “Middle+” means middle school complete or higher education.
Figure 6 Unadjusted and adjusted percentages of children under age four who arestunted, by household standard of living, India, 1992–93
58
46
34
56
49
41
0
10
20
30
40
50
60
Illiterate <Middle Middle+ Illiterate <Middle Middle+
Mother's education
Per
cent
age
stun
ted
Unadjusted Adjusted
5954
37
5653
44
0
10
20
30
40
50
60
Low Medium High Low Medium High
Standard of living
Per
cent
age
stun
ted
Unadjusted Adjusted

21
National Family Health Survey Subject Reports, No. 14
receive iron and folic acid tablets during pregnancy. Controlling for the selected de-
mographic and socioeconomic variables, however, virtually eliminates this effect,
and it becomes statistically nonsignificant.
Children of mothers who received two or more tetanus injections when they
were pregnant have a significantly lower prevalence of stunting than do children whose
mothers did not receive tetanus injections during pregnancy. Controlling for the other
predictor variables substantially reduces this effect, but it remains statistically sig-
nificant. This finding is consistent with earlier evidence from the NFHS that a mother
having two or more tetanus injections during pregnancy is a good proxy for that
mother’s health-seeking behavior for her children (Luther 1998).
Table 3 also presents the prevalence of stunting by geographic region. Both the
unadjusted and adjusted prevalence of stunting are highest in the central region and
lowest in the south. Controlling for the other predictor variables does not make much
difference in these geographic differentials, indicating that geographic region exerts
a substantial independent effect on the prevalence of stunting. The reason for this
geographic effect is unclear. It may have something to do with variations among the
states in the availability and quality of health services, which are, for the most part,
offered through state-level departments of health and family welfare.
Table 4 shows the effects of the demographic and socioeconomic variables on
stunting, broken down by urban/rural residence and by sex of child. Only adjusted
effects are presented. In both urban and rural areas, the effects of most predictor
variables are similar to the effects for India as a whole. The exception is the effect of
caste/tribe. Children belonging to scheduled-caste or scheduled-tribe households
in urban areas have a significantly higher prevalence of stunting than do children
belonging to other castes, while in rural areas there is no difference in the preva-
lence of stunting by caste/tribe. The adjusted effects of all predictor variables
are similar for boys and girls considered separately or together, as shown in
Table 3.
Underweight. Table 5 shows the effects of the predictor variables on the proportion
of children who are underweight. The findings for underweight are mostly similar to
those for stunting.
Thirty-one percent of infants and more than 61 percent of children age 12–47
months are underweight. For reasons that are unclear, the proportion underweight
does not increase monotonically with age as it does in the case of stunting. Instead, it
peaks at age 12–23 months and then declines slightly at 24–47 months. Adjusting for
the control variables makes virtually no difference to the effect of age on the propor-
tion underweight.
There is no difference in the proportion underweight by sex of child, regardless
of whether the other predictor variables are controlled (see also Figure 4). The proportion

22
National Family Health Survey Subject Reports, No. 14
Table 4 Adjusted prevalence of stunting among children age 0–47 months, by selected demographic andsocioeconomic characteristics, by urban/rural residence, and by sex of child, India, 1992–93
Percentage stunted
Residence Sex of child
Predictor variable Urban Rural Boy Girl
Child’s age (in months)<12† 19 25 26 2212–23 49* 59* 58* 57*24–47 58* 66* 63* 66*
Sex of childBoy 45 54 NA NAGirl† 45 54 NA NA
Birth orderOne† 42 52 50 48Two or three 43 51 49 50Four or five 50* 57* 54* 56*Six or higher 52* 61* 63* 56*
Mother’s age at childbirth13–24† 48 57 56 5425–34 40* 50* 48* 48*35–49 38* 45* 42* 45*
ResidenceUrban NA NA 53 52Rural† NA NA 52 52
Mother’s educationIlliterate† 52 57 57 55Literate, < middle complete 45* 50* 48* 50*Middle complete or higher 36* 43* 40* 41*
ReligionHindu† 45 54 52 51Muslim 43 56 52 53Other 43 51 48* 50
Caste/tribeSC/ST 50* 54 54 51Other† 44 54 52 52
Media ExposureRegularly exposed 44 54 52 50Not regularly exposed† 46 54 52 52
Standard of livingLow† 51 57 56 55Medium 49 54* 54 52*High 39* 47* 43* 46*
Mother received iron and folic acidtablets during pregnancyYes 44 53 52 50No† 46 55 53 53
Mother received two or more tetanusinjections during pregnancyYes 43* 53 51 50*No† 52 56 55 55
RegionNorth 43* 44* 45* 43*Central† 55 60 58 58East 47 57 57 54*Northeast 34* 50* 50* 45*West 43* 53* 50* 51*South 34* 46* 42* 45*

23
National Family Health Survey Subject Reports, No. 14
of underweight children increases with birth order, again regardless of whether de-
mographic and socioeconomic variables are controlled. The unadjusted proportion
underweight varies irregularly by mother’s age at childbirth, but it declines mono-
tonically, as in the case of stunting, when the other predictor variables are controlled.
The proportion underweight is considerably lower among children living in
urban areas than in rural areas. When the other predictor variables are controlled,
however, the effect of urban residence on proportion underweight becomes small and
statistically nonsignificant. This finding indicates that the effects of urban/rural resi-
dence are felt indirectly through the other predictor variables, as in the case of
stunting.
Table 5 and Figure 7 show that mother’s education has a large effect on the
proportion of children who are underweight. The proportion underweight among chil-
dren of illiterate mothers is 60 percent, compared with 36 percent among children of
mothers who have completed middle school or higher. Adjusting for the other predic-
tor variables reduces the effect of mother's education on the proportion of children
underweight, but the effect remains large and statistically significant, indicating a
substantial direct effect as in the case of stunting. This finding suggests that efforts to
improve women’s education may contribute directly as well as indirectly to better
child nutrition. An important reason for the large direct effect may be that educated
women are more knowledgeable about proper nutrition and sanitation and make bet-
ter use of health services.
Hindu and Muslim children differ little in the proportion underweight, but a
much lower proportion of children of other religions are underweight. The adjusted
proportion underweight is about the same across religions, however, indicating that
the lower proportion underweight among children of other religions is primarily due
to their higher socioeconomic status. The proportion underweight is higher among
children belonging to a scheduled caste or scheduled tribe than among other children,
but the adjusted proportion underweight is about the same. This suggests that the
Notes to Table 4:
Children from Andhra Pradesh, Himachal Pradesh, Madhya Pradesh, Tamil Nadu, and West Bengal are excluded
because height was not measured for children in those states. A child who is more than two standard deviations
below the median of the reference population in terms of height-for-age is defined as stunted. Adjusted values in a
column are based on a single logistic regression that includes all of the predictor variables in the table. In calculating
adjusted values for categories of any given predictor variable, the set of control variables consists of all other
predictor variables in the table. Constant terms in the regressions are reset so that predicted percentages agree with
observed percentages when predictor variables are set to their mean values. Significance levels take design effects
due to clustering into account.
NA: Not applicable
*The coefficient of the corresponding variable in the underlying logistic regression differs significantly from zero at the
5 percent level.
† Reference category in the underlying logistic regression.

24
National Family Health Survey Subject Reports, No. 14
Table 5 Unadjusted and adjusted prevalence of underweight children age 0–47 months, byselected demographic and socioeconomic characteristics, India, 1992–93
Percentage underweight
Predictor variable Unadjusted Adjusted
Child’s age (in months)<12† 31 3012–23 64* 65*24–47 61* 61*
Sex of childBoy 54 54Girl† 54 54
Birth orderOne† 50 51Two or three 53* 53*Four or five 58* 57*Six or higher 60* 59*
Mother’s age at childbirth13–24† 55 5625–34 52* 50*35–49 57 48*
ResidenceUrban 46* 53Rural† 56 54
Mother’s educationIlliterate† 60 57Literate, < middle complete 51* 53*Middle complete or higher 36* 43*
ReligionHindu† 54 54Muslim 56 55Other 43* 53
Caste/tribeSC/ST 58* 55Other† 53 54
Media ExposureRegularly exposed 47* 54Not regularly exposed† 60 54
Standard of livingLow† 62 59Medium 56* 55*High 38* 45*
Mother received iron and folic acidtablets during pregnancyYes 49* 53No† 60 55
Mother received two or more tetanusinjections during pregnancyYes 49* 53No† 60 56
RegionNorth 42* 43*Central† 59 58East 60 58Northeast 47* 44*West 53* 55*South 48* 50*

25
National Family Health Survey Subject Reports, No. 14
higher proportion underweight among children belonging to a scheduled caste or
scheduled tribe is due primarily to their lower socioeconomic status, as in the case of
stunting.
A considerably lower proportion of children whose mothers are regularly ex-
posed to electronic mass media are underweight than the proportion among children
whose mothers are not regularly exposed. When the other predictor variables are
controlled, however, the effect of mother’s media exposure disappears, indicating
that mother’s media exposure has no independent effect on the proportion of children
underweight, as in the case of stunting.
Table 5 and Figure 8 show that household standard of living has a large negative
effect on the proportion of children who are underweight. Controlling for the other
Figure 7 Unadjusted and adjusted percentages of children under age four who areunderweight, by mother’s education, India, 1992–93
Notes to Table 5:
A child who is more than two standard deviations below the median of the reference population in terms of weight-
for-age is defined as underweight. Both unadjusted and adjusted values are estimated by logistic regression.
Unadjusted values are based on a separate logistic regression for each predictor variable, with that predictor variable
as the only predictor variable in the regression. Adjusted values are based on a single logistic regression that
includes all of the predictor variables in the table. In calculating adjusted values for categories of any given predictor
variable, the set of control variables consists of all other predictor variables in the table. Constant terms in the
regressions are reset so that predicted percentages agree with observed percentages when predictor variables are
set to their mean values. Significance levels take design effects due to clustering into account.
*The coefficient of the corresponding variable in the underlying logistic regression differs significantly from zero at the
5 percent level.
† Reference category in the underlying logistic regression.
60
51
36
5753
43
0
10
20
30
40
50
60
Illiterate <Middle Middle+ Illiterate <Middle Middle+
Mother's education
Per
cent
age
unde
rwei
ght
Unadjusted Adjusted

26
National Family Health Survey Subject Reports, No. 14
predictor variables somewhat reduces this effect, but it remains large and statistically
significant. The adjusted proportion underweight is 59 percent among children in
households with a low standard of living and 45 percent among children in house-
holds with a high standard of living, indicating that living standard has a large direct
effect on the prevalence of underweight, as in the case of stunting.
The proportion underweight is considerably lower among children whose moth-
ers received iron and folic acid tablets during pregnancy than among other children.
The adjusted effect of this variable is, however, greatly reduced and statistically non-
significant. The effect of mother’s tetanus injections during pregnancy on the propor-
tion of children underweight shows a similar pattern. These findings indicate that
neither iron and folic acid tablets nor tetanus injections for pregnant women has an
independent effect on the proportion of their children who are underweight.
The proportion of children who are underweight varies somewhat by geographic
region, with the central and eastern regions having the highest proportions under-
weight and the north and northeast regions having the lowest proportions. This re-
gional variability persists even after potentially confounding factors are controlled.
Separate analyses of the proportion of children who are underweight, broken
down by urban/rural residence and by sex of child, are presented in Table 6. Only
adjusted effects are shown. Among the demographic variables, child’s age, birth or-
der, and mother’s age at childbirth have significant effects on the proportion under-
weight. Among the socioeconomic variables, mother’s education and standard of
Figure 8 Unadjusted and adjusted percentages of children under age four who areunderweight, by household standard of living, India, 1992–93
6256
38
5955
45
0
10
20
30
40
50
60
70
Low Medium High Low Medium High
Standard of living
Per
cent
age
unde
rwei
ght
Unadjusted Adjusted

27
National Family Health Survey Subject Reports, No. 14
Table 6 Adjusted prevalence of underweight children age 0–47 months, by selected demographic andsocioeconomic characteristics, by urban/rural residence, and by sex of child, India, 1992–93
Percentage underweight
Residence Sex of child
Predictor variable Urban Rural Boy Girl
Child’s age (in months)<12† 24 32 30 2912–23 55* 68* 67* 63*24–47 54* 63* 60* 63*
Sex of childBoy 45 57 NA NAGirl† 47 56 NA NA
Birth orderOne† 42 54 51 50Two or three 45 55 53 53*Four or five 52* 59* 56* 58*Six or higher 53* 61* 61* 58*
Mother’s age at childbirth13–24† 49 59 57 5625–34 42* 53* 50* 50*35–49 37* 51* 45* 51*
ResidenceUrban NA NA 52 54Rural† NA NA 54 54
Mother’s educationIlliterate† 52 59 57 58Literate, < middle complete 47* 54* 53* 52*Middle complete or higher 39* 45* 45* 42*
ReligionHindu† 47 56 54 54Muslim 43 58 55 54Other 41* 57 52 54
Caste/tribeSC/ST 49 58 55 55Other† 45 56 54 54
Media ExposureRegularly exposed 46 56 54 53Not regularly exposed† 46 57 54 55
Standard of livingLow† 61 60 59 59Medium 52* 56* 55* 55*High 37* 50* 44* 46*
Mother received iron and folic acidtablets during pregnancyYes 46 56 53 54No† 46 57 55 54
Mother received two or more tetanusinjections during pregnancyYes 46 56 53 54No† 50 58 57 56
RegionNorth 41* 43* 43* 43*Central† 55 60 60 57East 46* 61 58 58Northeast 30* 47* 45* 43*West 46* 58 54* 57South 40* 54* 48* 52*

28
National Family Health Survey Subject Reports, No. 14
living have large and significant effects. The adjusted effects tend to be greater in
urban areas than in rural areas. The separate analysis by sex of child shows a rather
similar pattern. Effects of the various predictor variables included in the analysis are
quite similar for boys and girls.
Wasting. Table 7 shows unadjusted and adjusted effects of the predictor variables on
the prevalence of wasting among children below age four. The findings on wasting
differ somewhat from the findings on stunting and underweight, although the two
sets of findings are broadly similar. The effects of the predictor variables on wasting
tend to be smaller and, in some cases, less consistent with expectation than the effects
of the same variables on stunting and underweight.
Child’s age has an inverted U-shaped relationship with the prevalence of wast-
ing, with children age 12–23 months more likely to be wasted than infants or children
age 24–47 months. Controlling for the other predictor variables does not reduce this
effect, indicating that child’s age has an independent effect on the prevalence of wast-
ing. The lower prevalence of wasting among infants may stem mainly from the fact
that most infants in India are breastfed.
Boys are more subject to wasting than girls, unlike stunting and underweight,
which affect boys and girls equally (see also Figure 4). In light of the widespread
discrimination against girls in feeding and medical care in India, this finding is con-
trary to expectation. Controlling for the other predictor variables does not alter the
effect of gender on wasting, indicating that the higher prevalence of wasting among
boys cannot be explained by these other variables.
In contrast to the prevalence of stunting and underweight, the prevalence of
wasting does not vary much by birth order of child. Mother’s age at childbirth also
does not have much effect on wasting, except among children born to mothers age
35–49, who have a somewhat higher prevalence of wasting. The lack of an effect of
birth order may reflect the fact that wasting is primarily a result of acute malnutrition
rather than chronic malnutrition.
Notes to Table 6:
A child who is more than two standard deviations below the median in a column of the reference population in terms
of weight-for-age is defined as underweight. Adjusted values are based on a single logistic regression that includes
all of the predictor variables in the table. In calculating adjusted values for categories of any given predictor variable,
the set of control variables consists of all other predictor variables in the table. Constant terms in the regressions are
reset so that predicted percentages agree with observed percentages when predictor variables are set to their mean
values. Significance levels take design effects due to clustering into account.
NA: Not applicable.
*The coefficient of the corresponding variable in the underlying logistic regression differs significantly from zero at the
5 percent level.
† Reference category in the underlying logistic regression.

29
National Family Health Survey Subject Reports, No. 14
Table 7 Unadjusted and adjusted prevalence of wasting among children age 0–47 months,by selected demographic and socioeconomic characteristics, India, 1992–93
Percentage wasted
Predictor variable Unadjusted Adjusted
Child’s age (in months)<12† 13 1312–23 29* 29*24–47 15* 15
Sex of childBoy 19* 19*Girl† 16 16
Birth orderOne† 16 17Two or three 17 18Four or five 19* 18Six or higher 17 16
Mother’s age at childbirth13–24† 17 1725–34 17 1735–49 20 21*
ResidenceUrban 16* 17Rural† 18 17
Mother’s educationIlliterate† 19 18Literate, < middle complete 17* 17Middle complete or higher 13* 14*
ReligionHindu† 18 17Muslim 17 18Other 15* 18
Caste/tribeSC/ST 20* 19*Other† 17 17
Media ExposureRegularly exposed 16* 17Not regularly exposed† 19 18
Standard of livingLow† 20 19Medium 18* 17High 14* 16
Mother received iron and folic acidtablets during pregnancyYes 17* 18No† 18 17
Mother received two or more tetanusinjections during pregnancyYes 17* 18No† 18 17
RegionNorth 16 16Central† 16 16East 22* 21*Northeast 11* 11*West 20* 21*South 15 16

30
National Family Health Survey Subject Reports, No. 14
Children living in urban areas have slightly lower prevalence of wasting than
those living in rural areas. When the other predictor variables are controlled, how-
ever, the adjusted effect of urban/rural residence on wasting vanishes. This suggests
that the effect of residence is indirect through the other predictor variables.
As in the case of stunting and underweight, Table 7 and Figure 9 show that
mother’s education is among the strongest predictors of wasting in children. Although
the effects are reduced after adjusting for the effects of the other predictor variables,
the adjusted effects remain statistically significant.
Children belonging to religions other than Hindu or Muslim have a somewhat
lower prevalence of wasting, but religion has no effect on wasting once the other
predictor variables are controlled. This suggests that the lower proportion wasted
among children of other religions is primarily due to their relatively high socioeco-
nomic status, as in the case of stunting and underweight.
Children belonging to a scheduled caste or scheduled tribe have a somewhat
higher prevalence of wasting than do children belonging to other households, even
after adjusting for the effects of the other predictor variables. Thus, the effect of
caste/tribe on wasting is only partially explained by the other predictor variables,
unlike the cases of stunting and underweight, where the effect of caste/tribe is com-
pletely explained by the other variables.
Children of mothers regularly exposed to the electronic mass media have a lower
prevalence of wasting, as expected. But, as in the case of stunting and underweight,
this effect of media exposure becomes small and statistically nonsignificant once the
other demographic and socioeconomic variables are controlled.
Table 7 and Figure 10 show that household standard of living has a large unad-
justed effect on the prevalence of wasting. Unlike the effects on stunting and under-
weight, the introduction of controls considerably reduces the effect of living standard
on wasting, and the adjusted effect is no longer statistically significant.
Notes to Table 7:
Children from Andhra Pradesh, Himachal Pradesh, Madhya Pradesh, Tamil Nadu, and West Bengal are excluded
because height was not measured for children in those states. A child who is more than two standard deviations
below the median of the reference population in terms of weight-for-height is defined as wasted. Both unadjusted and
adjusted values are estimated by logistic regression. Unadjusted values are based on a separate logistic regression
for each predictor variable, with that predictor variable as the only predictor variable in the regression. Adjusted
values are based on a single logistic regression that includes all of the predictor variables in the table. In calculating
adjusted values for categories of any given predictor variable, the set of control variables consists of all other
predictor variables in the table. Constant terms in the regressions are reset so that predicted percentages agree with
observed percentages when predictor variables are set to their mean values. Significance levels take design effects
due to clustering into account.
*The coefficient of the corresponding variable in the underlying logistic regression differs significantly from zero at the
5 percent level.
† Reference category in the underlying logistic regression.

31
National Family Health Survey Subject Reports, No. 14
Figure 10 Unadjusted and adjusted percentages of children under age four who arewasted, by household standard of living, India, 1992–93
Figure 9 Unadjusted and adjusted percentages of children under age four who arewasted, by mother’s education, India, 1992–93
20
18
14
1917 16
0
5
10
15
20
25
Low Medium High Low Medium High
Standard of living
Per
cent
age
was
ted
Unadjusted Adjusted
19
17
13
1817
14
0
5
10
15
20
Illiterate <Middle Middle+ Illiterate <Middle Middle+
Mother's education
Per
cent
age
was
ted
Unadjusted Adjusted
32
National Family Health Survey Subject Reports, No. 14
Whether mothers received iron and folic acid tablets or two or more tetanus
injections during pregnancy has virtually no effect on the prevalence of wasting among
children. By geographic region, the east and the west regions have the highest preva-
lence of wasting, and the northeast region has the lowest.
Table 8 presents adjusted prevalence of wasting by selected demographic and
socioeconomic characteristics separately for urban and rural areas and for boys and
girls. The effects of child’s age on wasting, both by residence and by sex of child, are
similar to those for the sample as a whole, as shown earlier in Table 7. Boys have
considerably higher prevalence of wasting than girls in rural areas, but in urban areas
the gender difference is small and statistically nonsignificant. This finding is con-
trary to expectation, given that discrimination against girls tends to be more severe in
rural areas than in urban areas.
The effects of birth order and mother’s age at childbirth, as estimated separately
for urban and rural areas and for boys and girls, are similar to those for the sample as
a whole, as shown earlier in Table 7. The effects of mother's education, however, are
not similar. Mother’s education has a statistically significant effect on wasting among
children living in rural areas (but not urban areas) and among girls (but not boys).
The effects of religion are similar for boys and girls, but children belonging to reli-
gions other than Hindu or Muslim have the lowest prevalence of wasting in urban
areas and the highest prevalence of wasting in rural areas. The effects of caste/tribe
on wasting are similar for boys and girls and for urban and rural areas, but they are
not statistically significant for girls or for urban areas. Media exposure has a small
significant effect in the expected direction for girls, but not for boys.
Standard of living has a negative but statistically nonsignificant effect on wast-
ing for both boys and girls. It has virtually no effect on wasting in rural areas, but a
negative and statistically significant effect in urban areas. The two variables related
to mother’s health behavior during pregnancy have virtually no effect on wasting,
either by residence or by sex of child. The effects of geographic region by residence
and by sex of child resemble the effects of geographic region for the sample as a
whole.
CONCLUSION
India has disproportionately large numbers of malnourished and severely malnour-
ished children below four years of age according to anthropometric data on stunting
(height-for-age), underweight (weight-for-age), and wasting (weight-for-height) from
the 1992–93 National Family Health Survey (NFHS). Fifty-two percent of all chil-
dren below age four are stunted, and 29 percent are severely stunted. Fifty-four per-
cent are underweight, and 22 percent are severely underweight. Seventeen percent
are wasted, and 3 percent are severely wasted. The lower prevalence of wasting than

33
National Family Health Survey Subject Reports, No. 14
Table 8 Adjusted prevalence of wasting among children age 0–47 months, by selected demographic andsocioeconomic characteristics, by urban/rural residence, and by sex of child, India, 1992–93
Percentage wasted
Residence Sex of child
Predictor variable Urban Rural Boy Girl
Child’s age (in months)<12† 14 13 14 1212–23 27* 30* 32* 27*24–47 12 15* 15 14
Sex of childBoy 16 20* NA NAGirl† 15 16 NA NA
Birth orderOne† 15 18 18 16Two or three 15 18 19 16Four or five 19* 18 20 16Six or higher 16 16 17 15
Mother’s age at childbirth13–24† 17 17 19 1625–34 13* 18 19 1535–49 21 22* 20 22*
ResidenceUrban NA NA 18 17Rural† NA NA 19 16
Mother’s educationIlliterate† 16 19 19 18Literate, < middle complete 18 17 20 15*Middle complete or higher 15 14* 17 12*
ReligionHindu† 16 18 19 16Muslim 16 18 19 16Other 12* 21* 18 18
Caste/tribeSC/ST 18 20* 21* 18Other† 15 17 18 16
Media ExposureRegularly exposed 16 17 19 15*Not regularly exposed† 16 18 19 17
Standard of livingLow† 21 18 20 17Medium 17* 18 19 15High 14* 18 17 16
Mother received iron and folic acidtablets during pregnancyYes 16 18 19 16No† 15 18 19 16
Mother received two or more tetanusinjections during pregnancyYes 16 18 19 16No† 17 17 19 15
RegionNorth 16 15 16 15Central† 16 16 18 14East 16 23* 24* 18*Northeast 7* 12* 13* 9*West 18 22* 21* 21*South 15 17 17 17

34
National Family Health Survey Subject Reports, No. 14
of stunting or underweight indicates that chronic malnutrition is more prevalent in
India than acute malnutrition. However, the prevalence of wasting is about 8 times
and the prevalence of severe wasting is about 25 times the levels in the international
reference population.
There are considerable variations in the prevalence of malnutrition among states.
Bihar and Kerala are the states with the highest and lowest prevalence of malnutrition
in the country. Even in Kerala, which is also the state with the lowest infant and child
mortality rates, 27 percent of children below age four are stunted, 28 percent are
underweight, and 12 percent are wasted.
Multivariate analysis of the selected demographic and socioeconomic determi-
nants of child nutritional status indicates that the strongest predictors of child nutri-
tion in India, once other variables are controlled, are child’s age and birth order,
mother’s education level, and household standard of living. Older children and chil-
dren of higher birth order tend to have poorer nutritional status. Children whose mothers
are more educated and those who live in households with a relatively high standard of
living have better nutrition. Boys and girls have about the same level of stunting and
underweight, while wasting is somewhat higher among boys than among girls. In the
face of much evidence that girls receive inferior care in India, this finding that girls
fare at least as well if not better than boys in terms of nutrition is difficult to explain
and warrants further investigation.
The findings of this study should be interpreted cautiously because of the prob-
lem of age misreporting. Previous research indicates that some births that occurred
during the period 0–4 years before the NFHS tend to be erroneously reported as
having occurred during the period 5–9 years before the survey (Narasimhan et al.
1997). This means that some children below age four are reported as older than they
really are. To the extent that this kind of age exaggeration occurs, the estimates of
stunting and underweight, which are based on height-for-age and weight-for-age,
Notes to Table 8:
Children from Andhra Pradesh, Himachal Pradesh, Madhya Pradesh, Tamil Nadu, and West Bengal are excluded
because height was not measured for children in those states. A child who is more than two standard deviations
below the median of the reference population in terms of weight-for-height is defined as wasted. Adjusted values in a
column are based on a single logistic regression that includes all of the predictor variables in the table. In calculating
adjusted values for categories of any given predictor variable, the set of control variables consists of all other
predictor variables in the table. Constant terms in the regressions are reset so that predicted percentages agree with
observed percentages when predictor variables are set to their mean values. Significance levels take design effects
due to clustering into account.
NA: Not applicable.
*The coefficient of the corresponding variable in the underlying logistic regression differs significantly from zero at the
5 percent level.
† Reference category in the underlying logistic regression.

35
National Family Health Survey Subject Reports, No. 14
may exaggerate the extent of malnutrition. Moreover, to the extent that age exaggeration
is more pronounced among those with less education and lower socioeconomic sta-
tus, the age misreporting may exaggerate the estimated socioeconomic differentials
in stunting and underweight. On the other hand, the estimates of wasting, which are
based on weight-for-height, are not affected by age misreporting.
Despite this caveat, the findings of this study should be useful for identifying
categories of children who are at particularly high risk of malnutrition. The findings
also imply that the prevalence of malnutrition can be reduced by improving educa-
tional levels of mothers, by raising household living standards, and by reducing higher-
order births by means of family planning. Such efforts should be combined with
programmes that raise women’s awareness of the nutritional requirements of children.
ACKNOWLEDGMENTS
We thank Fred Arnold and Robert D. Retherford for helpful comments on an earlier
draft of this report, Gayle Yamashita and Noreen Tanouye for computer and research
assistance, Sidney B. Westley for editorial assistance, and O. P. Sharma for assistance
with printing and distribution.
REFERENCES
Abeykoon, A. T. P. L. 1995. Sex preference in South Asia: Sri Lanka an outlier. Asia-
Pacific Population Journal 10(3): 5–16.
Agarwal, K. N., D. K. Agarwal, D. G. Benakappa, S. M. Gupta, P. C. Khanduja, S. P.
Khatua, K. Ramachandran, P. M. Udani, and C. Gopalan. 1991. Growth
performance of affluent Indian children (under-fives): Growth standard for
Indian children. New Delhi: Nutrition Foundation of India.
Bairagi, R. 1986. Food crisis, nutrition, and female children in rural Bangladesh.Population and Development Review 12(2): 307–15.
Basu, A. M. 1993. How pervasive are sex differentials in childhood nutritional levels
in south Asia? Social Biology 40(1–2): 25–37.
Briend, A., B. Wojtyniak, and M. G. M. Rowland. 1988. Breast feeding, nutritional
status, and child survival in rural Bangladesh. British Medical Journal
296(6626): 879–82.
Brown, K. E., R. E. Black, and S. Becker. 1982. Seasonal changes in nutritional status
and the prevalence of malnutrition in a longitudinal study of young children
in rural Bangladesh. American Journal of Clinical Nutrition 36(2): 303–13.
Chen, L. C., A. K. M. A. Chowdhury, and S. L. Huffman. 1980. Anthropometric
assessment of energy-protein malnutrition and subsequent risk of mortality among
preschool aged children. American Journal of Clinical Nutrition 33(8): 1836–45.

36
National Family Health Survey Subject Reports, No. 14
Daulaire, N. M. P., E. S. Starbuck, R. M. Houston, M. S. Church, T. A. Stukel, and M.
R. Pandey. 1992. Childhood mortality after a high dose of vitamin A in a highrisk population. British Medical Journal 304(6821): 207–10.
Dibley, M. J., J. B. Goldsby, N. W. Staehling, and F. L. Trowbridge. 1987a.
Development of normalized curves for the international growth reference:Historical and technical considerations. American Journal of Clinical
Nutrition 46(5): 736–48.
Dibley, M. J., N. W. Staehling, P. Neiburg, and F. L. Trowbridge. 1987b. Interpretationof z-score anthropometric indicators derived from the international growth
reference. American Journal of Clinical Nutrition 46(5): 749–62.
Elfindri. 1993. Nutritional status of elementary school-age children in a ruralpopulation: Abstract. Indonesian Journal of Demography 20(39): 31–49.
Esrey, S. A., J. P. Habicht, and M. C. Latham. 1988. Drinking water source, diarrheal
morbidity, and child growth in villages with both traditional and improvedwater supplies in rural Lesotho, Southern Africa. American Journal of Public
Health 78(11): 1451–5.
Habicht, J. P., R. Martorell, C. Yarbrough, R. M. Malina, and R. E. Klein. 1974.Height and weight standard for preschool children: How relevant are ethnic
differences in growth potential? Lancet 1(7858): 611–4.
Haq, M. N. 1984. Age at menarche and the related issue: A pilot study on urbanschool girls. Journal of Youth and Adolescence 13(6): 559–67.
IIPS (International Institute for Population Sciences). 1995. National Family Health
Survey (MCH and Family Planning): India 1992–93. Bombay: InternationalInstitute for Population Sciences.
Karim, A., A. K. M. A. Chowdhury, and M. Kabir. 1985. Nutritional status and age at
secondary sterility in rural Bangladesh. Journal of Biosocial Science 17(4):497–502.
Kasongo Project Team. 1983. Anthropometric assessment of young children’s
nutritional status as an indicator of subsequent risk of dying. Journal of
Tropical Pediatrics 29(2): 69–75.
Katz, J., K. P. West, Jr., I. Tarwotjo, and A. Sommer. 1989. The importance of age in
evaluating anthropometric indices for predicting mortality. American Journal
of Epidemiology 130(6): 1219–26.
Luther, N. Y. 1998. Mother’s tetanus immunization is associated not only with lower
neonatal mortality but also with lower early-childhood mortality. NationalFamily Health Survey Bulletin, No. 10. Mumbai: International Institute for
Population Sciences; and Honolulu: East-West Center Program on Population.
Lutter, C. K., J. O. Mora, J. P. Habicht., K. M. Rasmussen, D. S. Robson, S. G. Sellers, C.M. Super, and M. G. Herrera. 1989. Nutritional supplementation: Effects on child
stunting because of diarrhea. American Journal of Clinical Nutrition 50(1): 1–8.

37
National Family Health Survey Subject Reports, No. 14
Martorell, R. and J. P. Habicht. 1986. Growth in early childhood in developing
countries. In Frank Falkner and J. M. Tanner, eds. Human growth: A
comprehensive treatise, Vol. 3, pp. 241–62. New York: Plenum Press.
Mertens, T. E., M. A. Fernando, S. N. Cousens, B. R. Kirkwood, T. F. Marshall, and R.
G. Feachem. 1990. Childhood diarrhoea in Sri Lanka: A case-control study ofthe impact of improved water sources. Tropical Medicine and Parasitology
41(1): 98–104.
Narasimhan, R. L., R. D. Retherford, V. Mishra, F. Arnold, and T. K. Roy. 1997.Comparison of fertility estimates from India’s Sample Registration System and
National Family Health Survey. National Family Health Survey Subject
Reports, No. 4. Mumbai: International Institute for Population Sciences; andHonolulu: East-West Center Program on Population.
Pebley, A. R. and S. Amin. 1991. The impact of a public-health intervention on sex
differentials in childhood mortality in rural Punjab, India. Health Transition
Review 1(2): 143–69.
Pelletier, D. L. 1994. The relationship between child anthropometry and mortality in
developing countries: Implications for policy, programs and future research.Journal of Nutrition Supplement 124(10S): 2047S–2081S.
Pelletier, D. L. 1998. Malnutrition, morbidity and child mortality in developing
countries. In United Nations, ed. Too young to die: Genes or gender?, pp.109–32. New York: Department of Economic and Social Affairs, Population
Division, United Nations.
Rahmathullah, L., B. A. Underwood, R. D. Thulasiraj, R. C. Milton, K. Ramaswamy,R. Rahmathullah, and G. Babu. 1990. Reduced mortality among children in
southern India receiving a small weekly dose of vitamin A. New England
Journal of Medicine 323(14): 929–35.
Retherford, R. D., and M. K. Choe. 1993. Statistical models for causal analysis. New
York: John Wiley and Sons.
Roberts, D. F., W. Wood, and S. Chinn. 1986. Menarcheal age in Cumbria. Annals of
Human Biology 13(2): 161–70.
Ross, D. A., B. R. Kirkwood, F. N. Binka, P. Arthur, N. Dollimore, S. S. Morris, R. P.
Shier, J. O. Gyapong, and P. G. Smith. 1995. Child morbidity and mortalityfollowing vitamin A supplementation in Ghana: Time since dosing, number of
doses, and time of year. American Journal of Public Health 85(9): 1246–51.
Ruzicka, L. T. and P. Kane. 1985. Nutrition and child survival in south Asia. In K.Srinivasan and S. Mukerji, eds. Dynamics of population and family welfare,
pp. 333–57. Bombay: Himalaya Publishing House.
Santhanakrishnan, B. R. and R. Ramalingam. 1987. Risk factors of mortality inchildren with diarrhoeal disease in Madras, India. Journal of Diarrhoeal
Disease Research 5(1): 36–9.
38
National Family Health Survey Subject Reports, No. 14
Schoenbaum, M., T. H. Tulchinsky, and Y. Abed. 1995. Gender differences in
nutritional status and feeding patterns among infants in the Gaza Strip.
American Journal of Public Health 85(7): 965–9.
Serdula, M. 1988. Diet, malnutrition in Sub-Saharan Africa: Abstract. Annales de
I’IFORD 12(2): 35–63.
Singh, K. P. 1989. Green revolution and child survival in the state of Punjab. InInternational Population Conference, New Delhi: Proceedings, Vol. 1, pp.
379–88. Liege, Belgium: International Union for the Scientific Study of
Population (IUSSP).
Smedman, L., G. Sterky, L. Mellander, and S. Wall. 1987. Anthropometry and
subsequent mortality in groups of children aged 6–59 months in Guinea-
Bissau. American Journal of Clinical Nutrition 46(2): 369–73.
Sommer, A. and M. S. Loewenstein. 1975. Nutritional status and mortality: A
prospective validation of the QUAC stick. American Journal of Clinical
Nutrition 28(3): 287–92.
Sommerfelt, A. E. 1991. Comparative analysis of the determinants of children’s
nutritional status. In Demographic and Health Surveys World Conference:
Proceedings, Vol. 2, pp. 981–98. Columbia, Maryland: Institute for ResourceDevelopment/Macro International, Demographic and Health Surveys (DHS).
Sommerfelt, A. E. and F. Arnold. 1998. Sex differentials in nutritional status of young
children. In United Nations, ed. Too young to die: Genes or gender?, pp. 133–53. New York: Department of Economic and Social Affairs, Population
Division, United Nations.
Sommerfelt, A. E. and J. T. Boerma. 1993. Anthropometric status of young children inDHS-I surveys: An assessment of data quality. In An assessment of the quality
of health data in DHS-I surveys, pp. 125–42. DHS Methodological Reports,
No. 2. Columbia, Maryland: Macro International, Inc.
Sommerfelt, A. E. and M. K. Stewart. 1994. Children’s nutritional status. DHS
Comparative Studies, No. 12. Calverton, Maryland: Macro International,
Demographic and Health Surveys (DHS).
Stata Corporation. 1997. Stata reference manual, Release 5. College Station, Texas:
Stata Press.
United Nations. 1986. How to weigh and measure children: Assessing the nutritional
status of young children in household surveys, New York: Department of
Technical Co-operation for Development and Statistical Office, United Nations.
United Nations. 1998. Too young to die: Genes or gender? New York: Department ofEconomic and Social Affairs, Population Division, United Nations.
Vella, V., A. Tomkins, A. Borghesi, G. B. Migliori, B. C. Adriko, and E. Crevatin.
1992a. Determinants of child nutrition and mortality in north-west Uganda.Bulletin of the World Health Organization 70(5): 637–43.

39
National Family Health Survey Subject Reports, No. 14
Vella, V., A. Tomkins, J. Nidku, and T. Marshall. 1992b. Determinants of child
mortality in south-west Uganda. Journal of Biosocial Science 24(1): 103–12.
Vijayaraghavan, K., G. Radhaiah, B. S. Prakasam, K. V. R. Sarma, and V. Reddy. 1990.
Effect of massive dose vitamin A on morbidity and mortality in Indian
children. Lancet 336(8727): 1342–45.
Visaria, L. 1987. Sex differentials in nutritional status in a rural area of Gujarat state:
An interim report. Working Paper, No. 7. Ahmedabad: Gujarat Institute of
Area Planning.
West, K. P., Jr., R. P. Pokhrel, J. Katz, S. C. LeClerq, S. K. Khatry, S. R. Shrestha, E.
K. Pradhan, J. M. Tielsch, M. R. Pandey, and A. Sommer. 1991. Efficacy of
vitamin A in reducing preschool child mortality in Nepal. Lancet 338(8759):67–71.
Zeger, S. L. and S. L. Edelstein. 1989. Poisson regression with a surrogate X: An
analysis of vitamin A and Indonesian children’s mortality. Journal of the
Royal Statistical Society 38 (2, Series C): 309–18.