Embed Size (px)
DESCRIPTION
The University of Chicago Medicine Comer Children's Hospital completed a Community Health Needs Assessment in order to improve the health of pediatric and adolescent residents in the medical center's service area.
Citation preview

2013 PRC
Child & Adolescent
Community Health
Needs Assessment
TOTAL SERVICE AREA
Sponsored by
University of Chicago Medicine Comer
Children’s Hospital
Professional Research Consultants, Inc. 11326 “P” Street Omaha, Illinois 68137-2316
(800) 428-7455 www.prconline.com 2012-1281-02 © PRC, 2013

2
Table Of Contents
INTRODUCTION 4
Project Overview ................................................................................................................... 5 Project Goals 5 Methodology 5
Summary of Areas of Opportunity for Children’s Health Improvement ................... 10 Areas of Opportunity 10 Summary Tables: Comparisons With Benchmark Data 11
PERCEPTIONS OF HEALTH ISSUES 23
Child Health Issues .............................................................................................................. 24
Adolescent Health Issues ................................................................................................... 25
HEALTH STATUS 26
Overall Health ...................................................................................................................... 27 Evaluations of Child’s Overall Health Status 27 Activity Limitations 28
Mental Health ...................................................................................................................... 30 Evaluation of Child’s Mental Health Status 30 Signs of Depression 32 Diagnosed Mental & Emotional Conditions 33 Diagnosed Cognitive & Behavioral Disorders 37 Awareness & Availability of Mental Health Services 41 Access to Mental Health Services 41
SPECIAL HEALTH NEEDS 43
Prevalence of Selected Medical Conditions .................................................................... 44 Speech & Language Problems 44 Allergies 46 Neurological Conditions 48 Bone, Joint & Muscle Problems 50 Sickle-Cell Anemia 51 Asthma 52 Diabetes 54
Managing Children’s Special Health Needs .................................................................... 56 Special Health Needs 56 Prescriptions & Special Therapy 57
PRENATAL & INFANT HEALTH 60
Prenatal Care ....................................................................................................................... 61
Low-Weight Births .............................................................................................................. 63

3
CHILD & ADOLESCENT MORTALITY 64
Mortality Rates .................................................................................................................... 65 Infant Mortality 65 Child & Adolescent Mortality 66
Leading Causes of Child Deaths ........................................................................................ 67
MODIFIABLE HEALTH RISKS 68
Nutrition ............................................................................................................................... 69 Fruit & Vegetable Consumption 70 Fast Food 71 Breastfeeding & Breast Milk 72
Physical Activity .................................................................................................................. 74 Recommended Physical Activity 74 Physical Activity Frequency & Duration 75 Screen Time 77
Body Weight ........................................................................................................................ 80 Childhood Overweight & Obesity 80 Perceptions of Overweight 82
Tobacco ................................................................................................................................ 84
Injury & Safety .................................................................................................................... 86 Injuries 86 Safety 89 Child Abuse 95
Sexual Activity ..................................................................................................................... 96 Chlamydia 96 Births to Teen Mothers 96
ACCESS TO HEALTHCARE SERVICES 98
Health Insurance Coverage ............................................................................................... 99 Type of Coverage 99 Lack of Coverage 99
Difficulties Accessing Healthcare .................................................................................. 102 Barriers to Healthcare Access 103 Access to Specialty Care 104
Primary Care Services ...................................................................................................... 106 Usual Source Care 106 Receipt of Routine Medical Care 107 Dental Care 109 Vision & Hearing 112
Emergency Room Services .............................................................................................. 116
HEALTH EDUCATION & OUTREACH 118
Health Education .............................................................................................................. 119 Healthcare Information Sources 119 Parenting Education 122

4
INTRODUCTION

5
Project Overview
Project Goals
The goal of this 2013 PRC Child & Adolescent Health Needs Assessment is to gather data
to assist in determining the health status, behaviors and needs of children and
adolescents in the service area of University of Chicago Medicine Comer Children’s
Hospital. This assessment was conducted on behalf of the hospital by Professional
Research Consultants, Inc. (PRC). PRC is a nationally-recognized healthcare consulting
firm with extensive experience conducting Community Health Needs Assessments in
hundreds of communities across the United States since 1994.
Methodology
This assessment incorporates data from quantitative sources, including primary research
(the 2013 PRC Child & Adolescent Health Survey) and secondary research (vital statistics
and other existing health-related data); these quantitative components allow for trending
and comparison to benchmark data at the state and national levels.
PRC Community Health Survey
Community Defined for This Assessment
The study area for the survey effort (referred to as the “Total Service Area” in this report)
includes each of the residential ZIP Codes comprising the hospital’s service area (60609,
60615, 60617, 60619, 60620, 60621, 60628, 60636, 60637, 60643, 60649, and 60653); this
community definition was determined by the sponsor of this study. A geographic
description is illustrated in the following map.
2013 PRC Child & Adolescent Community Health Needs Assessment
5
6
Survey Instrument
The final survey instrument used for this study was developed by University of Chicago
Medicine Comer Children’s Hospital in conjunction with PRC.
Sample Approach & Design
A precise and carefully executed methodology is critical in asserting the validity of the
results gathered in the PRC Child & Adolescent Health Survey. Thus, to ensure the best
representation of the population surveyed, a telephone interview methodology — one
that incorporates both landline and cell phone interviews — was employed. The primary
advantages of telephone interviewing are timeliness, efficiency and random-selection
capabilities. In addition, these telephone interviews were supplemented with surveys
among families in the Total Service Area requested to participate in the study via an
online questionnaire.
The sample design used for this effort consisted of a random sample of 400 parents with
children under 18 in the Total Service Area. All administration of the surveys, data
collection and data analysis was conducted by Professional Research Consultants, Inc.
(PRC).
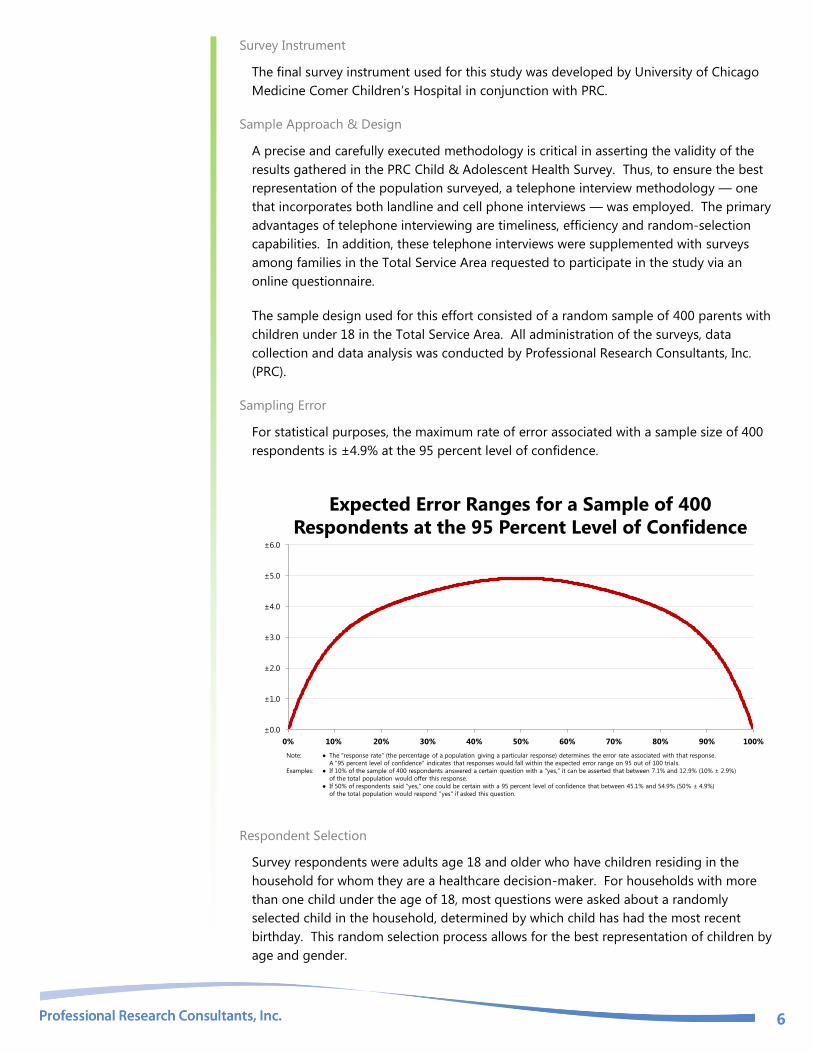
Sampling Error
For statistical purposes, the maximum rate of error associated with a sample size of 400
respondents is ±4.9% at the 95 percent level of confidence.
Expected Error Ranges for a Sample of 400
Respondents at the 95 Percent Level of Confidence
Note: ● The "response rate" (the percentage of a population giving a particular response) determines the error rate associated with that response.
A "95 percent level of confidence" indicates that responses would fall within the expected error range on 95 out of 100 trials.
Examples: ● If 10% of the sample of 400 respondents answered a certain question with a "yes," it can be asserted that between 7.1% and 12.9% (10% ± 2.9%)
of the total population would offer this response.
● If 50% of respondents said "yes," one could be certain with a 95 percent level of confidence that between 45.1% and 54.9% (50% ± 4.9%)
of the total population would respond "yes" if asked this question.
±0.0
±1.0
±2.0
±3.0
±4.0
±5.0
±6.0
0% 10% 20% 30% 40% 50% 60% 70% 80% 90% 100%
Respondent Selection
Survey respondents were adults age 18 and older who have children residing in the
household for whom they are a healthcare decision-maker. For households with more
than one child under the age of 18, most questions were asked about a randomly
selected child in the household, determined by which child has had the most recent
birthday. This random selection process allows for the best representation of children by
age and gender.

7
Sample Characteristics
To accurately represent the population studied (Total Service Area children and
adolescents), PRC strives to minimize bias through application of a proven telephone
methodology and random-selection techniques. And, while this random sampling of the
population produces a highly representative sample of Total Service Area children and
adolescents, it is a common and preferred practice to “weight” the raw data to improve
this representativeness even further. This is accomplished by adjusting the results of a
random sample to match the geographic distribution and demographic characteristics of
the population surveyed (poststratification), so as to eliminate any naturally occurring
bias. Specifically, once the raw data are gathered, respondents are examined by key
demographic characteristics (namely the child’s gender, age, race/ethnicity, and
household poverty status) and a statistical application package applies weighting
variables that produce a sample which more closely matches the population for these
characteristics. Thus, while the integrity of each individual’s responses is maintained, one
respondent’s responses may contribute to the whole the same weight as, for example, 1.1
respondents. Another respondent, whose demographic characteristics may have been
slightly oversampled, may contribute the same weight as 0.9 respondents.
The following chart outlines the characteristics of the Total Service Area sample for key
child/adolescent demographics, compared to actual population characteristics revealed in
census data.
50
.2%
49
.8%
30
.9%
32
.4%
36
.7%
78
.0%
22
.0%
50
.2%
49
.9%
50
.4%
49
.6%
28
.8%
33
.9%
37
.2%
76
.4%
23
.6%
50
.9%
49
.1%
0%
20%
40%
60%
80%
100%
Boys Girls Age
0-5
Age
6-11
Age
12-17
Black Non-Black <200%
FPL
200%+
FPL
Actual Population Weighted Survey Sample
Population & Sample Characteristics(Total Service Area, 2013)
Sources: ● Census 2000, Summary File 3 (SF 3). U.S. Census Bureau.
● 2009 Geolytics
● 2013 PRC Child & Adolescent Health Survey, Professional Research Consultants, Inc.
Further note that the poverty descriptions and segmentation used in this report are
based on administrative poverty thresholds determined by the US Department of Health
& Human Services. These guidelines define poverty status by household income level
and number of persons in the household (e.g., the 2012 guidelines place the poverty
threshold for a family of four at $23,050 annual household income or lower). In sample
segmentation: “low income” refers to community members living in a household with
defined poverty status or living just above the poverty level, earning up to twice the
poverty threshold; “mid/high income” refers to those households living on incomes
which are twice or more the federal poverty level.

8
The sample design and the quality control procedures used in the data collection ensure
that the sample is representative. Thus, the findings may be generalized to the total
population of Total Service Area children and adolescents with a high degree of
confidence.
Public Health, Vital Statistics & Other Data
A variety of existing (secondary) data sources was consulted to complement the research
quality of this Community Health Needs Assessment. Data for the Total Service Area (City
of Chicago data where available, Cook County data otherwise) were obtained from the
following sources (specific citations are included with the graphs throughout this report):
Illinois Department of Public Health
Illinois State Police
Centers for Disease Control & Prevention
GeoLytics Demographic Estimates & Projections
National Center for Health Statistics
US Census Bureau
US Department of Health and Human Services
Note that secondary data are compared to state and national data where available.
Benchmark Data
National Data
National survey data, which are also provided in comparison charts, are taken from the
2012 PRC National Child & Adolescent Health Survey; the methodological approach for
the national study is similar to that employed in this assessment, and these data may be
generalized to the population of American children and youth with a high degree of
confidence. National-level vital statistics are also provided for comparison of secondary
data indicators.
Healthy People 2020
Certain indicators in this assessment relate to national
disease prevention and health promotion goals established
by Healthy People 2020. Healthy People provides science-
based, 10-year national objectives for improving the health
of all Americans. The Healthy People initiative is grounded
in the principle that setting national objectives and monitoring progress can motivate
action. For three decades, Healthy People has established benchmarks and monitored
progress over time in order to:
Encourage collaborations across sectors.
Guide individuals toward making informed health decisions.
Measure the impact of prevention activities.
9
Healthy People 2020 is the product of an extensive stakeholder feedback process that is
unparalleled in government and health. It integrates input from public health and
prevention experts, a wide range of federal, state and local government officials, a
consortium of more than 2,000 organizations, and perhaps most importantly, the public.
More than 8,000 comments were considered in drafting a comprehensive set of Healthy
People 2020 objectives.
Information Gaps
While this assessment is quite comprehensive, it cannot measure all possible aspects of
child/adolescent health in the community, nor can it represent all possible populations of
interest. It must be recognized that these information gaps might in some ways limit
the ability to assess all of the community’s child health needs.
For example, certain population groups — such as the homeless, institutionalized
children, or children of parents who only speak a language other than English or Spanish
— are not represented in the survey data. Other population groups — for example,
undocumented residents, and children of certain racial/ethnic or immigrant groups —
might not be identifiable or might not be represented in numbers sufficient for
independent analyses.
In terms of content, this assessment was designed to provide a comprehensive and broad
picture of the health of children and adolescents in the overall community. However,
there are certainly a great number of medical conditions that are not specifically
addressed.

10
Summary of Areas of Opportunity
for Children’s Health Improvement
Areas of Opportunity
The following “health priorities” represent recommended areas of intervention, based on
the information gathered through this Child & Adolescent Community Health Needs
Assessment. From these data, opportunities for children’s health improvement exist in
the region with regard to the following health areas (see also the summary tables
presented in the following section). These areas of concern are subject to the discretion
of area providers, the steering committee, or other local organizations and community
leaders as to actionability and priority.
Areas of Opportunity Identified Through This Assessment
Access to Health Services
Difficulty Accessing Healthcare (Getting Appointments,
Inconvenient Office Hours, & Cost as a Barrier to
Prescriptions)
“Major/Moderate” Problem Getting Specialty Care
Usual Source for Care
Over-Use of the ER
Allergies Eczema/Skin Allergies
Asthma Asthma
Asthma-Related ER/Urgent Care Visits
Health Education Awareness of Local Parenting Programs
Injury & Safety
Use of Seat Belts/Safety Restraints
Use of Protective Helmets (Bicycle, Skateboard, etc.)
Perceptions of Neighborhood Safety
Schooldays Missed Due to Feeling Unsafe
Mental & Emotional Health Awareness of Local Resources
Mortality Teen Mortality Rate (Age 15-19)
Nutrition, Physical Activity & Weight
Fast Food Consumption
Physical Activity (Vigorous and Moderate Levels)
Television & Computers in the Bedroom
Overweight/Obesity
Oral Health Dental Sealants
Prenatal & Infant Health Low Birthweight
Infant Mortality
Sexual Activity Chlamydia Incidence
Teen Births
Tobacco Exposure to Smoke Inside the Home
Vision, Hearing & Speech Uncorrectable Vision Problems

11
Summary Tables: Comparisons With Benchmark Data
The following tables provide an overview of child and adolescent health indicators in the
Total Service Area of University of Chicago Medicine Comer Children’s Hospital.
Reading the Summary Tables
In the following charts, Total Service Area results are shown in the larger, blue column.
The columns to the right of the Total Service Area column provide comparisons
between the service area and any available national data or Healthy People 2020 targets.
Symbols indicate whether the Total Service Area compares favorably (B), unfavorably (h),
or comparably (d) to these external data.
Note that blank table cells signify that data are not available or are not reliable for that
area and/or for that indicator.

12
Total Service Area
Total Service Area vs. Benchmarks
Overall Health vs. US vs. HP2020
% [Age 0-17] Child's Overall Health Is "Fair/Poor" 6.9 d 4.9
% [Age 0-17] Child's Activities/Abilities Limited Due to Health Condition 9.9 d 8.9
% [Age 0-17] Child Has Special Health Needs 60.3 d 64.5
% [Age 0-17] Child Needs Rx for a Chronic Condition 24.1 d 20.9
% [Age 0-17] Child Needs Special Therapy for a Chronic Condition 6.5 d 7.0
% [Age 0-17] Child Needs Rx OR Special Therapy for a Chronic Condition 27.6 d 24.3
B d h
better similar worse
Total Service Area
Total Service Area vs. Benchmarks
Access to Health Services vs. US vs. HP2020
% [Age 0-17] Child Is Uninsured 4.2 d h 6.8 0.0
% [Insured Child] Child Went Without Insurance in Past Year 9.9 d 6.7
% [Age 0-17] Difficulties Accessing Child’s Healthcare (Composite) 37.8 h 30.3

13
Total Service Area
Total Service Area vs. Benchmarks
Access to Health Services (continued) vs. US vs. HP2020
% [Age 0-17] Difficulty Finding Physician for Child in Past Year 8.1 d 7.1
% [Age 0-17] Difficulty Getting Appointment for Child in Past Year 16.6 h 11.6
% [Age 0-17] Cost Prevented Child's Dr Visit in Past Year 6.8 d 8.5
% [Age 0-17] Transportation Hindered Child's Dr Visit in Past Year 8.8 d 6.8
% [Age 0-17] Inconvenient Hrs Prevented Child's Dr Visit in Past Year 23.0 h 15.7
% [Age 0-17] Cost Prevented Getting Child's Prescription in Past Year 10.9 h 6.7
% [Child Needing Care] "Major/Moderate" Problem Getting Specialty Care 38.7 h 22.2
% [Age 0-17] Child Has a Usual Source of Care 85.2 h h 89.6 100.0
% [Age 0-17] Child Has Had Routine Checkup in Past Year 91.5 B 82.0
% [Age 0-17] Child Has Had Hearing Tested in the Past 5 Years 87.7 d 85.0
% [Age 2-17] Child Has Had a Dental Visit in Past Year 84.6 d B 85.9 49.0
% [Age 6-17] Child Has Had Dental Sealants 35.1 h 48.8
% [Age 0-17] Child Has Had 2+ ER Visits in Past Year 14.6 h 8.8

14
Total Service Area
Total Service Area vs. Benchmarks
Alcohol, Tobacco & Drugs vs. US vs. HP2020
% [Age 0-17] Household Member Smokes Inside the Home 14.7 h 4.8
% [Age 0-17] Household Member Smokes Outside the Home 27.4 d 23.5
B d h
better similar worse
Total Service Area
Total Service Area vs. Benchmarks
Allergies vs. US vs. HP2020
% [Age 0-17] Child Has Respiratory Allergies 12.9 B 17.7
% [Age 0-17] Child Has Food/Digestive Allergies 8.9 d 11.1
% [Age 0-17] Child Has Eczema/Skin Allergies 26.7 h 21.0
B d h
better similar worse

15
Total Service Area
Total Service Area vs. Benchmarks
Asthma vs. US vs. HP2020
% [Age 0-17] Child Currently Has Asthma 17.3 h 12.0
% [Age 0-17 With Asthma] ER/Urgent Care for Child's Asthma in Past Year 58.7 h 42.1
% [Age 0-17 With Asthma] Child Hospitalized for Asthma in Past Year 16.0 d 10.6
% [Age 5-17 With Asthma] Child Missed School Due to Asthma in Past Year 57.7 d 54.9
% [Age 0-17 With Asthma] Parent Missed Work Due to Child's Asthma in Past Year
49.0 d 41.0
B d h
better similar worse
Total Service Area
Total Service Area vs. Benchmarks
Bone, Joint & Muscle Disorders vs. US vs. HP2020
% [Age 0-17] Child Has Bone/Joint/Muscle Problems 3.0 d 4.9
B d h
better similar worse

16
Total Service Area
Total Service Area vs. Benchmarks
Cognitive & Behavioral Disorders vs. US vs. HP2020
% [Age 5-17] Child Has Autism 3.7 d 4.1
% [Age 0-17] Child Has Learning Disability 7.3 B 12.1
% [Age 0-17] Child Has Developmental Delays 5.7 B 9.5
% [Age 0-17] Child Has ADD/ADHD 5.1 B 10.1
% [Age 5-17] Child Has Behavioral/Conduct Problems 3.4 d 4.9
B d h
better similar worse
Total Service Area
Total Service Area vs. Benchmarks
Diabetes vs. US vs. HP2020
% [Age 0-17] Child Has Diabetes/High Blood Sugar 1.2 d 0.9
d h
similar worse

17
Total Service Area
Total Service Area vs. Benchmarks
Health Education vs. US vs. HP2020
% [Age 0-17] Parent Aware of Local Parenting Education Programs 37.1 h 50.3
% [Age 0-17] Parent Has Used a Local Parenting Education Program 14.2 d 18.5
B d h
better similar worse
Total Service Area
Total Service Area vs. Benchmarks
Injury & Safety vs. US vs. HP2020
% [Age 0-17] Child Has Sustained Injury Requiring Treatment in Past Year 8.0 d 11.3
% [Age 0-17] Child "Always" Uses Seat Belt/Car Seat 92.9 h 96.6
% [Age 5-17] Child "Always" Wear a Bike Helmet 29.3 h 44.1
% [Age 5-17] Child "Always" Wear a Skateboard/Scooter/Rollerblade Helmet 18.7 h 37.5
% [Age 0-17] Neighborhood Is "Slightly" or "Not At All" Safe 62.9 h 9.1
% [Age 5-17] Child Missed School in Past Year Because Felt Unsafe 11.5 h 3.3
Child Abuse Offenses per 1,000 Children 21.9
B d h
better similar worse

18
Total Service Area
Total Service Area vs. Benchmarks
Mental & Emotional Health vs. US vs. HP2020
% [Age 5-17] Child's Mental Health Is "Fair/Poor" 9.7 d 10.2
% [Age 5-17] Parent Aware of Community Mental Health Resources 46.4 h 68.8
% [Age 5-17] Child Has Needed but not Received Mental Health Svcs in Past Year
11.3 d B 16.4 24.2
% [Age 5-17] Child Has Ever Taken Rx for Mental Health 4.4 B 8.0
% [Age 5-17] Child Worries A Lot 19.1 B 25.4
% [Age 5-17] Child Has Anxiety 4.3 B 9.5
% [Age 5-17] Child Has Difficulty Sleeping 11.8 d 13.5
% [Age 5-17] Child Had 2+ Weeks Feeling Sad/Hopeless in Past Year 6.0 d 6.0
% [Age 5-17] Child Has Depression 4.4 d 4.6
B d h
better similar worse

19
Total Service Area
Total Service Area vs. Benchmarks
Mortality vs. US vs. HP2020
[Age 1-4] Mortality Rate per 100,000 27.7 d h 27.7 25.7
[Age 5-9] Mortality Rate per 100,000 13.4 d h 12.8 12.3
[Age 10-14] Mortality Rate per 100,000 14.6 B d 16.1 15.2
[Age 15-19] Mortality Rate per 100,000 62.7 h h 57.7 55.7
B d h
better similar worse
Total Service Area
Total Service Area vs. Benchmarks
Neurological Disorders vs. US vs. HP2020
% [Age 0-17] Child Has Migraines/Severe Headaches 4.0 d 5.2
% [Age 0-17] Child Has Brain Injury/Concussion 1.6 B 4.0
% [Age 0-17] Child Has Epilepsy/Seizure Disorder 0.8 d 1.4
B d h
better similar worse

20
Total Service Area
Total Service Area vs. Benchmarks
Nutrition, Physical Activity & Weight vs. US vs. HP2020
% [Age 2-17] Child Has 5+ Servings of Fruits/Vegetables per Day 42.0 d 46.4
% [Age 2-17] Child Ate 3+ Fast Food Meals in Past Week 27.9 h 21.5
% [Age 0-17] Child Was Ever Breastfed 64.8 d h 69.8 81.9
% [Age 2-17] Child Was Physically Active One Hour/Day in Past Week 37.1 h 57.3
% [Age 2-17] Child Had 60+ Minutes of Vigorous Physical Activity in Past Week 56.4 h 72.2
% [Age 2-17] Child had 150+ Minutes of Moderate Physical Activity in Past Week
34.5 h 56.0
% [Age 5-17] Child Watches 3+ Hours of TV per Day 36.9 d 39.3
% [Age 5-17] Child Has a TV in Bedroom 58.1 h 45.9
% [Age 5-17] Child Has 3+ Hours of Computer Use per Day 19.0 d 15.0
% [Age 5-17] Child Has a Computer in Bedroom 39.0 h 25.6
% [Age 5-17] Child Has 3+ Hours of Total Screen Time per Day 54.3 d 54.7
% [Age 5-17] Child Is Overweight or Obese 40.1 h 30.7
% [Age 5-17] Child Is Obese 23.8 d h 18.0 14.6

21
Total Service Area
Total Service Area vs. Benchmarks
Prenatal & Infant Health vs. US vs. HP2020
% No Prenatal Care in First Trimester 23.6 h 22.1
% of Low Birthweight Births 9.7 h h 8.2 7.8
Infant Death Rate 7.4 h h 6.5 6.0
B d h
better similar worse
Total Service Area
Total Service Area vs. Benchmarks
Sexual Activity vs. US vs. HP2020
[All Ages] Chlamydia Incidence per 100,000 884.8 h 409.8
% Births to Teenagers 12.8 h 10.3
B d h
better similar worse

22
Total Service Area
Total Service Area vs. Benchmarks
Vision, Hearing & Speech vs. US vs. HP2020
% [Age 0-17] Child Has Vision Problems 4.7 h 1.9
% [Age 0-17] Child Has Hearing Problems 5.3 d 4.9
% [Age 0-17] Child Has Speech/Language Problems 8.8 B 13.7
% [Age 0-17] Child Has Had 3+ Ear Infections (Ever) 13.5 B 25.6
% [Age 0-17] Child Has Had an Eye Exam in the Past 3 Years 89.3 B 79.3
B d h
better similar worse

23
PERCEPTIONS OF HEALTH ISSUES
24
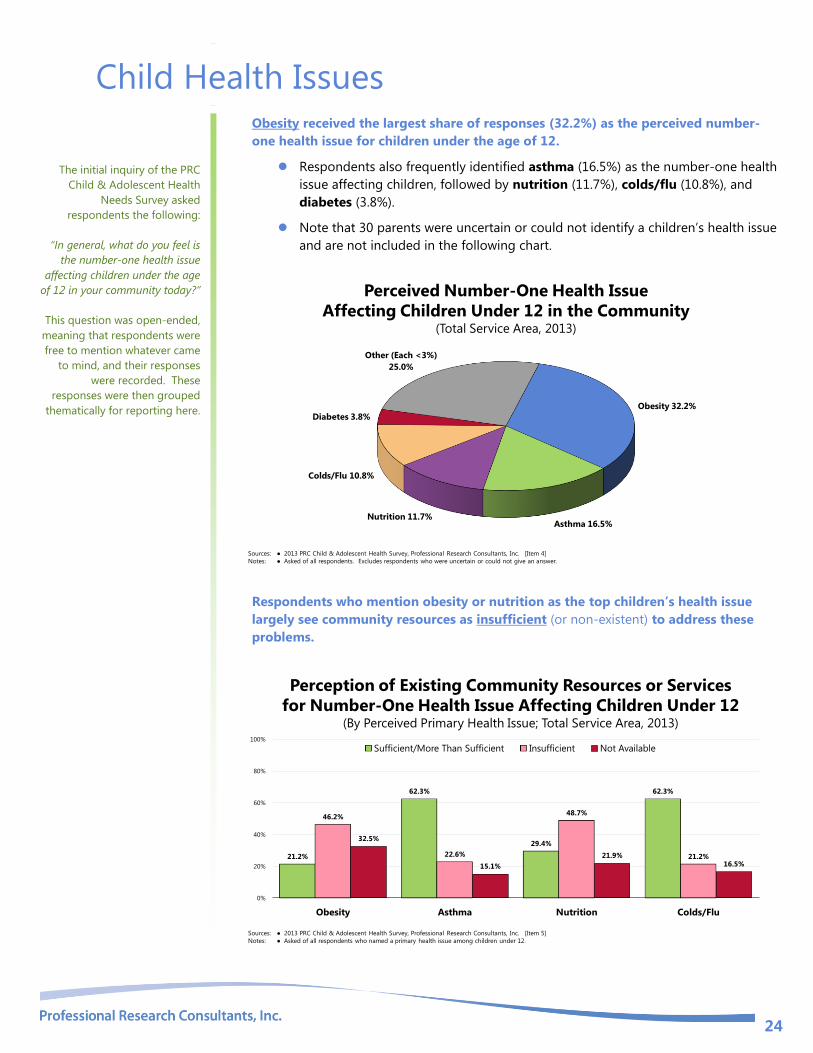
Child Health Issues Obesity received the largest share of responses (32.2%) as the perceived number-
one health issue for children under the age of 12.
Respondents also frequently identified asthma (16.5%) as the number-one health
issue affecting children, followed by nutrition (11.7%), colds/flu (10.8%), and
diabetes (3.8%).
Note that 30 parents were uncertain or could not identify a children’s health issue
and are not included in the following chart.
Perceived Number-One Health Issue
Affecting Children Under 12 in the Community(Total Service Area, 2013)
Sources: ● 2013 PRC Child & Adolescent Health Survey, Professional Research Consultants, Inc. [Item 4]
Notes: ● Asked of all respondents. Excludes respondents who were uncertain or could not give an answer.
Obesity 32.2%
Asthma 16.5%Nutrition 11.7%
Colds/Flu 10.8%
Diabetes 3.8%
Other (Each <3%)
25.0%
Respondents who mention obesity or nutrition as the top children’s health issue
largely see community resources as insufficient (or non-existent) to address these
problems.
21.2%
62.3%
29.4%
62.3%
46.2%
22.6%
48.7%
21.2%
32.5%
15.1%
21.9%
16.5%
0%
20%
40%
60%
80%
100%
Obesity Asthma Nutrition Colds/Flu
Sufficient/More Than Sufficient Insufficient Not Available
Perception of Existing Community Resources or Services
for Number-One Health Issue Affecting Children Under 12(By Perceived Primary Health Issue; Total Service Area, 2013)
Sources: ● 2013 PRC Child & Adolescent Health Survey, Professional Research Consultants, Inc. [Item 5]
Notes: ● Asked of all respondents who named a primary health issue among children under 12.
The initial inquiry of the PRC
Child & Adolescent Health
Needs Survey asked
respondents the following:
“In general, what do you feel is
the number-one health issue
affecting children under the age
of 12 in your community today?”
This question was open-ended,
meaning that respondents were
free to mention whatever came
to mind, and their responses
were recorded. These
responses were then grouped
thematically for reporting here.

25
Adolescent Health Issues Similarly, obesity received the largest share of responses (25.9%) when respondents
were asked to name the number-one health issue for adolescents.
Respondents also frequently identified STDs (mentioned by 11.1%), followed by
crime and violence (9.0%), asthma (7.3%), illegal drugs (6.7%), nutrition (5.2%),
mental health (4.7%) and diabetes (4.1%).
Note that 50 parents were uncertain or could not identify a health issue and are
not included in the following chart.
Perceived Number-One Health Issue
Affecting Teens (12-17) in the Community(Total Service Area, 2013)
Sources: ● 2013 PRC Child & Adolescent Health Survey, Professional Research Consultants, Inc. [Item 6]
Notes: ● Asked of all respondents. Does not include respondents who were uncertain or could not give an answer.
Obesity 25.9%
STDs 11.1%
Crime/Violence 9.0%Asthma 7.3%
Illegal Drugs 6.7%
Nutrition 5.2%
Mental Health 4.7%
Diabetes 4.1%
Other (Each <3%)
26.0%
A majority of respondents view community resources as insufficient (or nonexistent)
to address the top health issues affecting teens in the community (49.9% for STDs).
20.2%
50.1%
6.4%10.8%
52.4%
38.6%
65.1%61.4%
27.4%
11.3%
28.5% 27.7%
0%
20%
40%
60%
80%
100%
Obesity STDs Crime/Violence Illegal Drugs
Sufficient/More Than Sufficient Insufficient Not Available
Perception of Existing Community Resources or Services
for Number-One Health Issue Affecting Teens(By Perceived Primary Health Issue; Total Service Area, 2013)
Sources: ● 2013 PRC Child & Adolescent Health Survey, Professional Research Consultants, Inc. [Item 7]
Notes: ● Asked of all respondents who named a primary health issue among teens.

26
HEALTH STATUS

27
Overall Health
Evaluations of Child’s Overall Health Status
Most Total Service Area parents rate their child’s overall health as “excellent”
(44.4%) or “very good” (28.2%).
Another 20.6% gave “good” ratings of their child’s overall health.
Child’s Health Status(Total Service Area, 2013)
Sources: ● 2013 PRC Child & Adolescent Health Survey, Professional Research Consultants, Inc. [Item 12]
Notes: ● Asked of all respondents.
Excellent 44.4%
Very Good 28.2%
Good 20.6%
Fair 6.5%
Poor 0.4%
However, 6.9% of Total Service Area parents believe that their child’s overall health
is “fair” or “poor.”
Similar to national findings.
6.9% 4.9%
0%
20%
40%
60%
80%
100%
Total Service Area United States
Child Experiences “Fair” or “Poor” Overall Health
Sources: ● 2013 PRC Child & Adolescent Health Survey, Professional Research Consultants, Inc. [Item 12]
● 2012 PRC National Child & Adolescent Health Survey, Professional Research Consultants, Inc.
Notes: ● Asked of all respondents.
The remainder of survey
questions addressed in this
report reflect the health of a
particular, randomly-selected
child or adolescent in
the household.
“Would you say that, in
general, this child’s health
is excellent, very good,
good, fair or poor?”
NOTE:
● Differences noted in the
text represent
significant differences
determined through
statistical testing.
The terms “child” and
“children” are used
throughout this report
to refer to children and
adolescents of all ages
(0-17), unless otherwise
specified.
● Although survey
respondents are often
referred to as “parents”
throughout this report,
they may in fact be a
grandparent or other
guardian for a child in
the household.

28
When viewed by children’s demographic characteristics, note that the following segments
of children are more likely to be reported as having “fair/poor” health status:
Girls.
Children age 5 and older.
Other differences by demographic characteristics, as shown below, are not
statistically significant.
Child Experiences “Fair” or “Poor” Overall Health(Total Service Area, 2013)
Sources: ● 2013 PRC Child & Adolescent Health Survey, Professional Research Consultants, Inc. [Item 12]
Notes: ● Asked of all respondents.
● Hispanics can be of any race. Other race categories are non-Hispanic categorizations (e.g., “Black” reflects non-Hispanic Black respondents).
● Income categories reflect respondent's household income as a ratio to the federal poverty level (FPL) for their household size. “Low Income” includes households
with incomes up to 200% of the federal poverty level; “Mid/High Income” includes households with incomes at 200% or more of the federal poverty level.
3.3%
10.5%
2.1%7.4%
10.7%8.0% 7.1% 7.4%
3.6%6.9%
0%
20%
40%
60%
80%
100%
Boy Girl Age
0 to 4
Age
5 to 12
Age
13 to 17
Low
Income
Mid/High
Income
Black Non-Black TSA
Activity Limitations
According to Total Service Area parents, 9.9% of children in the community are
limited or prevented in some way in their ability to do things most children of the
same age can do because of a medical, behavioral, or other health condition.
Similar to what is found nationally.
Prevalence of Activity Limitations(Total Service Area, 2013)
Sources: ● 2013 PRC Child & Adolescent Health Survey, Professional Research Consultants, Inc. [Item 68]
● 2012 PRC National Child & Adolescent Survey, Professional Research Consultants, Inc.
Notes: ● Asked of all respondents.
● Child is limited in his/her ability to do things most children of the same age can do because of any medical, behavioral, or other health condition.
9.9% 8.9%
0%
20%
40%
60%
80%
100%
Total Service Area United States

29
Note that the following groups of children report a significantly higher prevalence of
activity limitations:
Children age 5 and older (note the positive correlation with age).
Children in low-income households.
Prevalence of Activity Limitations(Total Service Area, 2013)
Sources: ● 2013 PRC Child & Adolescent Health Survey, Professional Research Consultants, Inc. [Item 68]
Notes: ● Asked of all respondents.
● Hispanics can be of any race. Other race categories are non-Hispanic categorizations (e.g., “Black” reflects non-Hispanic Black respondents).
● Income categories reflect respondent's household income as a ratio to the federal poverty level (FPL) for their household size. “Low Income” includes households
with incomes up to 200% of the federal poverty level; “Mid/High Income” includes households with incomes at 200% or more of the federal poverty level.
● Child is limited in his/her ability to do things most children of the same age can do because of any medical, behavioral, or other health condition.
9.1% 10.7%
1.0%
10.1%
15.9% 15.2%
5.0%9.5%
12.0% 9.9%
0%
20%
40%
60%
80%
100%
Boy Girl Age
0 to 4
Age
5 to 12
Age
13 to 17
Low
Income
Mid/High
Income
Black Non-Black TSA
For those reporting activity limitations, the vast majority is due to a condition that has
lasted, or is expected to last, for a year or longer. Activity limitations are most often
attributed to asthma (30.3%), autism (12.9%), ADD/ADHD/OCD (8.0%), disabilities
(8.0%), depression (7.7%) and respiratory problems (6.8%).
Description of Activity Limitations(Among Children With Activity Limitations; Total Service Area, 2013)
Sources: ● 2013 PRC Child & Adolescent Health Survey, Professional Research Consultants, Inc. [Items 69-70]
Notes: ● Asked of all respondents for whom the randomly selected child in the household has some type of activity limitation.
Yes
93.8%
No
6.2%
Activity Limitation Is the
Result of a Long-Term Condition
30.3%
12.9%
8.0%
8.0%
7.7%
6.8%
3.8%
3.3%
19.2%
0% 20% 40% 60% 80% 100%
Asthma
Autism
ADD/ADHD/OCD
Disabled
Depression
Respiratory
Allergies
Problem Reading
Other (Each <3%)
Long-Term Condition That
Limits Child’s Activities Most

30
Mental Health The existing model for understanding mental health and mental disorders emphasizes the interaction of social,
environmental, and genetic factors throughout the lifespan. In behavioral health, researchers identify: risk
factors, which predispose individuals to mental illness; and protective factors, which protect them from
developing mental disorders. Researchers now know that the prevention of mental, emotional, and behavioral
(MEB) disorders is inherently interdisciplinary and draws on a variety of different strategies. Over the past 20
years, research on the prevention of mental disorders has progressed. The understanding of how the brain
functions under normal conditions and in response to stressors, combined with knowledge of how the brain
develops over time, has been essential to that progress. The major areas of progress include evidence that:
MEB disorders are common and begin early in life.
The greatest opportunity for prevention is among young people.
There are multiyear effects of multiple preventive interventions on reducing substance abuse, conduct
disorder, antisocial behavior, aggression, and child maltreatment.
The incidence of depression among pregnant women and adolescents can be reduced.
School-based violence prevention can reduce the base rate of aggressive problems in an average school
by 25 to 33%.
There are potential indicated preventive interventions for schizophrenia.
Improving family functioning and positive parenting can have positive outcomes on mental health and can
reduce poverty-related risk.
School-based preventive interventions aimed at improving social and emotional outcomes can also
improve academic outcomes.
Interventions targeting families dealing with adversities, such as parental depression or divorce, can be
effective in reducing risk for depression among children and increasing effective parenting.
Some preventive interventions have benefits that exceed costs, with the available evidence strongest for
early childhood interventions.
Implementation is complex, and it is important that interventions be relevant to the target audiences.
In addition to advancements in the prevention of mental disorders, there continues to be steady progress in
treating mental disorders as new drugs and stronger evidence-based outcomes become available.
– Healthy People 2020 (www.healthypeople.gov)
Evaluation of Child’s Mental Health Status
Most Total Service Area parents rate their (age 5-17) child’s mental health — which
includes stress, depression, and problems with emotions — as “excellent” (48.3%)
or “very good” (27.4%).
Another 14.6% gave “good” ratings of their child’s overall health.
“Now thinking about this
child's mental health, which
includes stress, depression, and
problems with emotions, would
you say that this child's mental
health is: excellent, very good,
good, fair or poor?”

31
Child’s Mental Health Status(Among Parents of Children Age 5-17; Total Service Area, 2013)
Sources: ● 2013 PRC Child & Adolescent Health Survey, Professional Research Consultants, Inc. [Item 82]
Notes: ● Asked of respondents for whom the randomly selected child in the household is between the ages of 5 and 17.
Excellent 48.3%
Very Good 27.4%
Good 14.6%
Fair 9.1%
Poor 0.6%
However, 9.7% of Total Service Area parents believe that their (age 5-17) child’s
mental health is “fair” or “poor.”
Statistically comparable to national findings.
9.7% 10.2%
0%
20%
40%
60%
80%
100%
Total Service Area United States
Child Experiences “Fair” or “Poor” Mental Health(Among Parents of Children Age 5-17)
Sources: ● 2013 PRC Child & Adolescent Health Survey, Professional Research Consultants, Inc. [Item 82]
● 2012 PRC National Child & Adolescent Health Survey, Professional Research Consultants, Inc.
Notes: ● Asked of respondents for whom the randomly selected child in the household is between the ages of 5 and 17.
“Fair/poor” mental health status is more often noted for:
Girls.
Teens.
Children in low-income households.

32
Child Experiences “Fair” or “Poor” Mental Health(Among Parents of Children Age 5-17; Total Service Area, 2013)
Sources: ● 2013 PRC Child & Adolescent Health Survey, Professional Research Consultants, Inc. [Item 82]
Notes: ● Asked of respondents for whom the randomly selected child in the household is between the ages of 5 and 17.
● Hispanics can be of any race. Other race categories are non-Hispanic categorizations (e.g., “Black” reflects non-Hispanic Black respondents).
● Income categories reflect respondent's household income as a ratio to the federal poverty level (FPL) for their household size. “Low Income” includes households
with incomes up to 200% of the federal poverty level; “Mid/High Income” includes households with incomes at 200% or more of the federal poverty level.
5.7%
13.4%
6.4%
14.0% 12.6%
6.2%9.2%
12.0%9.7%
0%
20%
40%
60%
80%
100%
Boy Girl Age
5 to 12
Age
13 to 17
Low
Income
Mid/High
Income
Black Non-Black TSA
Signs of Depression
A total of 6.0% of Total Service Area parents indicate that their school-age child felt
so sad or hopeless almost every day for two weeks or more in the past year that
he/she stopped doing some usual activities.
Identical to the national figure.
6.0% 6.0%
0%
20%
40%
60%
80%
100%
Total Service Area United States
Child Felt Sad or Hopeless for Two or More Weeks
in the Past Year and Stopped Performing Usual Activities(Among Parents of Children Ages 5-17)
Sources: ● 2013 PRC Child & Adolescent Health Survey, Professional Research Consultants, Inc. [Item 89]
● 2012 PRC National Child & Adolescent Health Survey, Professional Research Consultants, Inc.
Notes: ● Asked of respondents for whom the randomly selected child in the household is between the ages of 5 and 17.
Such signs of depression are notably higher among:
Girls.
Teens.
Children in lower-income households.
“During the past 12 months,
did this child ever feel so sad
or hopeless almost every day
for two weeks or more in a row
that he/she stopped doing
some usual activities?”

33
Child Felt Sad or Hopeless for Two or More Weeks
in the Past Year and Stopped Performing Usual Activities(Among Parents of Children Age 5-17; Total Service Area, 2013)
Sources: ● 2013 PRC Child & Adolescent Health Survey, Professional Research Consultants, Inc. [Item 89]
Notes: ● Asked of respondents for whom the randomly selected child in the household is between the ages of 5 and 17.
● Hispanics can be of any race. Other race categories are non-Hispanic categorizations (e.g., “Black” reflects non-Hispanic Black respondents).
● Income categories reflect respondent's household income as a ratio to the federal poverty level (FPL) for their household size. “Low Income” includes households
with incomes up to 200% of the federal poverty level; “Mid/High Income” includes households with incomes at 200% or more of the federal poverty level.
2.3%
9.7%
2.8%
10.5%8.1%
3.3%6.1% 6.2% 6.0%
0%
20%
40%
60%
80%
100%
Boy Girl Age
5 to 12
Age
13 to 17
Low
Income
Mid/High
Income
Black Non-Black TSA
Further note that, of the 15 surveyed parents reporting signs of depression in their child,
most (nearly 74%) report that they sought treatment for their child’s feelings of sadness
or hopelessness.
Sought Treatment for Child’s Feelings of Sadness/Hopelessness(Among Parents of Children Ages 5-17 Who Had Feelings of Sadness/Hopelessness;
Total Service Area, 2013)
Sources: ● 2013 PRC Child & Adolescent Health Survey, Professional Research Consultants, Inc. [Item 90]
Notes: ● Asked of respondents for whom the randomly selected child in the household is between the ages of 5 and 17 and who experienced 2+ weeks of feelings of
sadness/hopelessness in the past year and ceased performing their usual activities.
Yes 73.8%
No 26.2%
Diagnosed Mental & Emotional Conditions
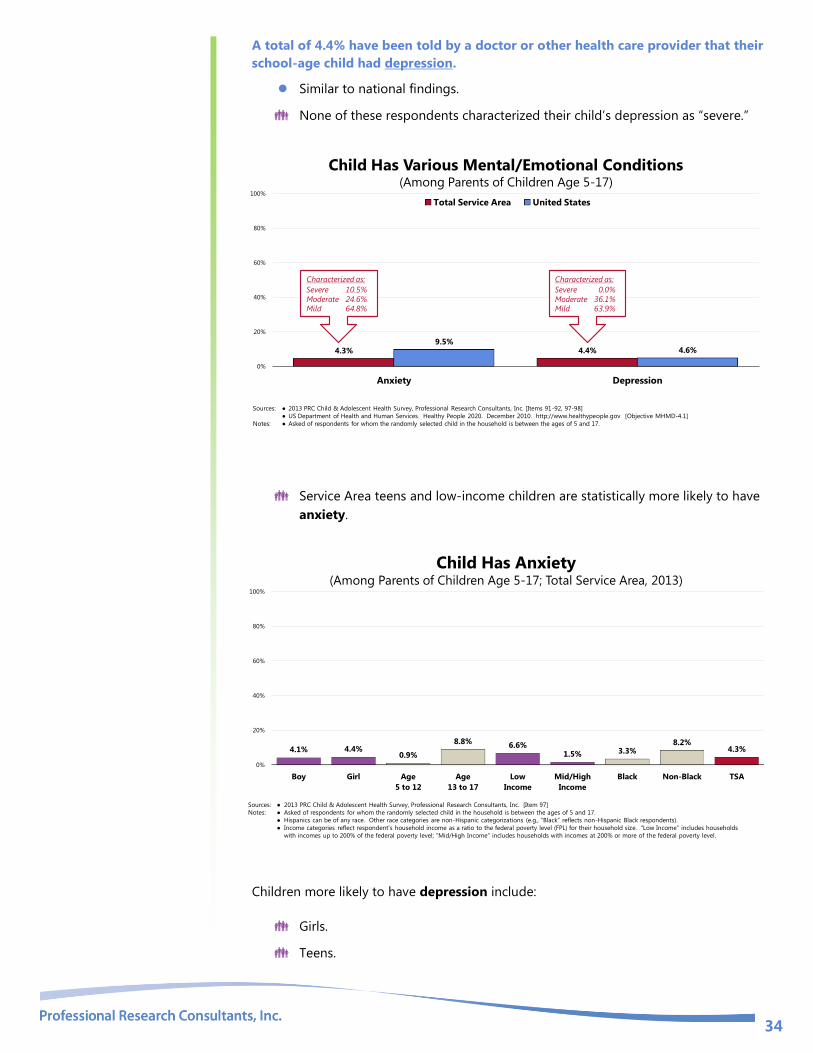
A total of 4.3% of Total Service Area parents report that they have been told by a
doctor or other health care provider that their school-age child had anxiety.
More favorable than national findings.
10.5% of these respondents characterized their child’s anxiety as “severe.”
34
A total of 4.4% have been told by a doctor or other health care provider that their
school-age child had depression.
Similar to national findings.
None of these respondents characterized their child’s depression as “severe.”
4.3% 4.4%9.5%
4.6%
0%
20%
40%
60%
80%
100%
Anxiety Depression
Total Service Area United States
Child Has Various Mental/Emotional Conditions (Among Parents of Children Age 5-17)
Sources: ● 2013 PRC Child & Adolescent Health Survey, Professional Research Consultants, Inc. [Items 91-92, 97-98]
● US Department of Health and Human Services. Healthy People 2020. December 2010. http://www.healthypeople.gov [Objective MHMD-4.1]
Notes: ● Asked of respondents for whom the randomly selected child in the household is between the ages of 5 and 17.
Characterized as:
Severe 10.5%
Moderate 24.6%Mild 64.8%
Characterized as:
Severe 0.0%
Moderate 36.1%Mild 63.9%
Service Area teens and low-income children are statistically more likely to have
anxiety.
Child Has Anxiety(Among Parents of Children Age 5-17; Total Service Area, 2013)
Sources: ● 2013 PRC Child & Adolescent Health Survey, Professional Research Consultants, Inc. [Item 97]
Notes: ● Asked of respondents for whom the randomly selected child in the household is between the ages of 5 and 17.
● Hispanics can be of any race. Other race categories are non-Hispanic categorizations (e.g., “Black” reflects non-Hispanic Black respondents).
● Income categories reflect respondent's household income as a ratio to the federal poverty level (FPL) for their household size. “Low Income” includes households
with incomes up to 200% of the federal poverty level; “Mid/High Income” includes households with incomes at 200% or more of the federal poverty level.
4.1% 4.4%0.9%
8.8%6.6%
1.5% 3.3%8.2%
4.3%
0%
20%
40%
60%
80%
100%
Boy Girl Age
5 to 12
Age
13 to 17
Low
Income
Mid/High
Income
Black Non-Black TSA
Children more likely to have depression include:
Girls.
Teens.

35
Child Has Depression(Among Parents of Children Age 5-17; Total Service Area, 2013)
Sources: ● 2013 PRC Child & Adolescent Health Survey, Professional Research Consultants, Inc. [Item 91]
Notes: ● Asked of respondents for whom the randomly selected child in the household is between the ages of 5 and 17.
● Hispanics can be of any race. Other race categories are non-Hispanic categorizations (e.g., “Black” reflects non-Hispanic Black respondents).
● Income categories reflect respondent's household income as a ratio to the federal poverty level (FPL) for their household size. “Low Income” includes households
with incomes up to 200% of the federal poverty level; “Mid/High Income” includes households with incomes at 200% or more of the federal poverty level.
1.6%
7.2%1.9%
7.8%5.2% 3.6% 4.1% 6.2% 4.4%
0%
20%
40%
60%
80%
100%
Boy Girl Age
5 to 12
Age
13 to 17
Low
Income
Mid/High
Income
Black Non-Black TSA
Prescriptions for Mental Health
A total of 4.4% of Total Service Area report that their child has ever taken
prescribed medication for their mental health.
Lower than the national figure.
Note the positive correlation with age among Total Service Area children.
Child Has Taken Prescribed Medications for Mental Health(Among Parents of Children Age 5-17)
Sources: ● 2013 PRC Child & Adolescent Health Survey, Professional Research Consultants, Inc. [Item 86]
● 2012 PRC National Child & Adolescent Health Survey, Professional Research Consultants, Inc.
Notes: ● Asked of all respondents about a randomly-selected child aged 5-17 in the household.
Yes 4.4%
No 95.6%
Age 5-12: 2.5%
Age 13-17: 7.0%
US: 8.0%
Worry
Nearly one in five (19.1%) area children age 5-17 reportedly worries a lot.
Lower than the US percentage.

36
19.1%
25.4%
0%
20%
40%
60%
80%
100%
Total Service Area United States
Child Worries a Lot(Total Service Area Children Ages 5-17, 2012)
Sources: ● 2013 PRC Child & Adolescent Health Survey, Professional Research Consultants, Inc. [Item 87]
● 2012 PRC National Child & Adolescent Health Survey, Professional Research Consultants, Inc.
Notes: ● Asked of all respondents about a randomly-selected child aged 5-17 in the household.
Service Area girls and teens are statistically more likely to worry a lot.
Child Worries a Lot(Total Service Area Children Ages 5-17, 2012)
Sources: ● 2013 PRC Child & Adolescent Health Survey, Professional Research Consultants, Inc. [Item 87]
Notes: ● Asked of all respondents about a randomly-selected child aged 5-17 in the household.
● Hispanics can be of any race. Other race categories are non-Hispanic categorizations (e.g., “Black” reflects non-Hispanic Black respondents).
● Income categories reflect respondent's household income as a ratio to the federal poverty level (FPL) for their household size. “Low Income” includes households
with incomes up to 200% of the federal poverty level; “Mid/High Income” includes households with incomes at 200% or more of the federal poverty level.
12.1%
26.0%
14.7%
25.2%20.1%
17.4%20.1%
14.9%19.1%
0%
20%
40%
60%
80%
100%
Boy Girl Age
5 to 12
Age
13 to 17
Low
Income
Mid/High
Income
Black Non-Black TSA
Sleep
According to parents of children age 5-17, 11.8% have trouble falling asleep or
sleeping through the night.
This is comparable to the US prevalence.

37
11.8% 13.5%
0%
20%
40%
60%
80%
100%
Total Service Area United States
Child Has Difficulties Falling
Asleep and/or Sleeping Through the Night(Total Service Area Children Ages 5-17, 2012)
Sources: ● 2013 PRC Child & Adolescent Health Survey, Professional Research Consultants, Inc. [Item 88]
● 2012 PRC National Child & Adolescent Health Survey, Professional Research Consultants, Inc.
Notes: ● Asked of all respondents about a randomly-selected child aged 5-17 in the household.
Area teens are statistically more likely to have sleep difficulties.
Child Has Difficulties Falling
Asleep and/or Sleeping Through the Night(Total Service Area Children Ages 5-17, 2012)
Sources: ● 2013 PRC Child & Adolescent Health Survey, Professional Research Consultants, Inc. [Item 88]
Notes: ● Asked of all respondents about a randomly-selected child in the household.
● Hispanics can be of any race. Other race categories are non-Hispanic categorizations (e.g., “Black” reflects non-Hispanic Black respondents).
● Income categories reflect respondent's household income as a ratio to the federal poverty level (FPL) for their household size. “Low Income” includes households
with incomes up to 200% of the federal poverty level; “Mid/High Income” includes households with incomes at 200% or more of the federal poverty level.
9.4%14.2%
8.5%
16.3%12.3%
10.1% 11.1% 13.1% 11.8%
0%
20%
40%
60%
80%
100%
Boy Girl Age
5 to 12
Age
13 to 17
Low
Income
Mid/High
Income
Black Non-Black TSA
Diagnosed Cognitive & Behavioral Disorders
A total of 7.3% of Total Service Area parents report that they have been told by a
doctor or other health care provider that their child (age 0-17) had a learning
disability.
More favorable than national findings.
15.5% of these respondents characterized their child’s learning disability as
“severe.”

38
A total of 5.1% have been told by a doctor or other health care provider that their
child (age 0-17) had ADD or ADHD (attention-deficit disorder or attention-deficit
hyperactivity disorder).
More favorable than the national figure.
30.3% of these respondents characterized their child’s ADD/ADHD as “severe.”
A total of 5.7% have been told by a doctor or other health care provider that their
child (age 0-17) had a developmental delay that affects his/her ability to learn.
Lower than the national prevalence.
20.9% of these respondents characterized their child’s developmental delay as
“severe.”
A total of 3.4% have been told by a doctor or other health care provider that their
school-age child (age 5-17) had behavioral or conduct problems, such as
oppositional defiant disorder or conduct disorder.
Similar to national findings.
7.4% of these respondents characterized their child’s disorder as “severe.”
A total of 3.7% have been told by a doctor or other health care provider that their
school-age child (age 5-17) had autism.
Similar to national findings.
11.9% of these respondents characterized their child’s autism as “severe.”
7.3
%
5.1
%
5.7
%
3.4
%
3.7
%12
.1%
10
.1%
9.5
%
4.9
%
4.1
%0%
20%
40%
60%
80%
100%
Learning Disability ADD/ADHD Developmental
Delays
Behavioral/Conduct
Disorder (Age 5-17)
Autism (Ages 5-17)
Total Service Area United States
Child Has Various Cognitive and Behavioral Disorders (Among Children Age 0-17)
Sources: ● 2013 PRC Child & Adolescent Health Survey, Professional Research Consultants, Inc. [Items 58-61, 64-65, 93-96]
Notes: ● Learning Disability, ADD/ADHD & Developmental Delays: asked of all respondents (children age 0-17);
Behavioral/Conduct Disorder & Autism: asked of respondents for whom the randomly selected child in the household is between the ages of 5 and 17.
Characterized as:
Severe 15.5%
Moderate 18.4%Mild 66.1%
Characterized as:
Severe 30.3%
Moderate 28.9%Mild 40.8%
Characterized as:
Severe 20.9%
Moderate 22.6%Mild 56.5%
Characterized as:
Severe 11.9%
Moderate 26.3%Mild 61.8%
Characterized as:
Severe 7.4%
Moderate 32.9%Mild 59.7%
Behavioral/Conduct Problems
Children more likely to have behavioral or conduct problems include:
Those in low-income households.

39
Child Has Behavioral/Conduct Problems(Among Parents of Children Age 5-17; Total Service Area, 2013)
Sources: ● 2013 PRC Child & Adolescent Health Survey, Professional Research Consultants, Inc. [Item 93]
Notes: ● Asked of respondents for whom the randomly selected child in the household is between the ages of 5 and 17.
● Hispanics can be of any race. Other race categories are non-Hispanic categorizations (e.g., “Black” reflects non-Hispanic Black respondents).
● Income categories reflect respondent's household income as a ratio to the federal poverty level (FPL) for their household size. “Low Income” includes households
with incomes up to 200% of the federal poverty level; “Mid/High Income” includes households with incomes at 200% or more of the federal poverty level.
2.9% 3.9% 2.4%4.8% 5.1%
0.8% 2.6%6.7%
3.4%
0%
20%
40%
60%
80%
100%
Boy Girl Age
5 to 12
Age
13 to 17
Low
Income
Mid/High
Income
Black Non-Black TSA
Learning Disabilities
Children more likely to have some type of learning disability include:
Teens (note the positive correlation with age).
Those in lower-income households.
Child Has a Learning Disability(Among Children Age 0-17; Total Service Area, 2013)
Sources: ● 2013 PRC Child & Adolescent Health Survey, Professional Research Consultants, Inc. [Item 58]
Notes: ● Asked of all respondents.
● Hispanics can be of any race. Other race categories are non-Hispanic categorizations (e.g., “Black” reflects non-Hispanic Black respondents).
● Income categories reflect respondent's household income as a ratio to the federal poverty level (FPL) for their household size. “Low Income” includes households
with incomes up to 200% of the federal poverty level; “Mid/High Income” includes households with incomes at 200% or more of the federal poverty level.
5.6%9.1%
0.0%
6.4%
13.4%11.1%
3.6%7.2% 8.5% 7.3%
0%
20%
40%
60%
80%
100%
Boy Girl Age
0 to 4
Age
5 to 12
Age
13 to 17
Low
Income
Mid/High
Income
Black Non-Black TSA
ADD/ADHD
The prevalence of ADD/ADHD in service area children is notably higher in boys
and those age 5-12.

40
Child Has ADD/ADHD(Among Children Age 0-17; Total Service Area, 2013)
Sources: ● 2013 PRC Child & Adolescent Health Survey, Professional Research Consultants, Inc. [Item 64]
Notes: ● Asked of all respondents.
● Hispanics can be of any race. Other race categories are non-Hispanic categorizations (e.g., “Black” reflects non-Hispanic Black respondents).
● Income categories reflect respondent's household income as a ratio to the federal poverty level (FPL) for their household size. “Low Income” includes households
with incomes up to 200% of the federal poverty level; “Mid/High Income” includes households with incomes at 200% or more of the federal poverty level.
7.7%2.5% 1.2%
6.2% 4.7% 6.6%3.6% 5.4% 4.6% 5.1%
0%
20%
40%
60%
80%
100%
Boy Girl Age
0 to 4
Age
5 to 12
Age
13 to 17
Low
Income
Mid/High
Income
Black Non-Black TSA
Developmental Delays
Children more likely to have developmental delays include:
Teens.
Children in low-income households.
Child Has Developmental Delays(Among Children Age 0-17; Total Service Area, 2013)
Sources: ● 2013 PRC Child & Adolescent Health Survey, Professional Research Consultants, Inc. [Item 60]
Notes: ● Asked of all respondents.
● Hispanics can be of any race. Other race categories are non-Hispanic categorizations (e.g., “Black” reflects non-Hispanic Black respondents).
● Income categories reflect respondent's household income as a ratio to the federal poverty level (FPL) for their household size. “Low Income” includes households
with incomes up to 200% of the federal poverty level; “Mid/High Income” includes households with incomes at 200% or more of the federal poverty level.
4.6%6.9%
1.8% 3.8%
10.7% 8.6%
2.4%4.7%
9.5%5.7%
0%
20%
40%
60%
80%
100%
Boy Girl Age
0 to 4
Age
5 to 12
Age
13 to 17
Low
Income
Mid/High
Income
Black Non-Black TSA
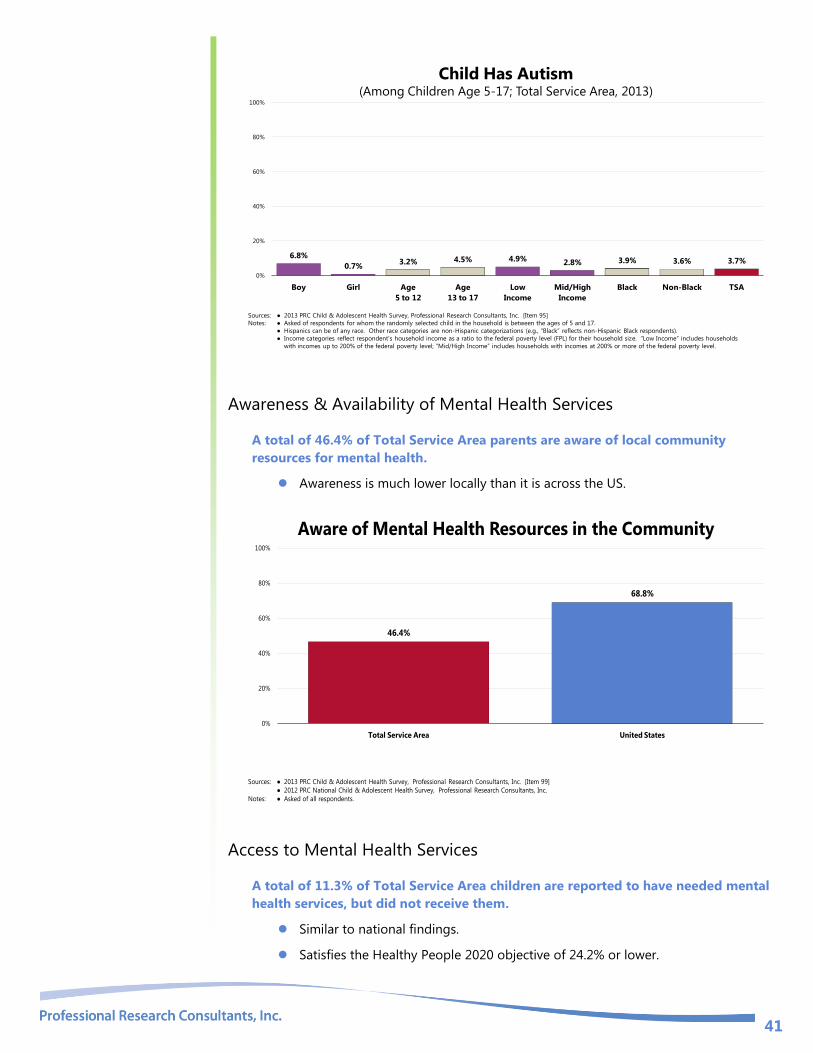
Autism
The prevalence of autism is statistically high among boys age 5-17 in the Total
Service Area.
41
Child Has Autism(Among Children Age 5-17; Total Service Area, 2013)
Sources: ● 2013 PRC Child & Adolescent Health Survey, Professional Research Consultants, Inc. [Item 95]
Notes: ● Asked of respondents for whom the randomly selected child in the household is between the ages of 5 and 17.
● Hispanics can be of any race. Other race categories are non-Hispanic categorizations (e.g., “Black” reflects non-Hispanic Black respondents).
● Income categories reflect respondent's household income as a ratio to the federal poverty level (FPL) for their household size. “Low Income” includes households
with incomes up to 200% of the federal poverty level; “Mid/High Income” includes households with incomes at 200% or more of the federal poverty level.
6.8%
0.7%3.2% 4.5% 4.9% 2.8% 3.9% 3.6% 3.7%
0%
20%
40%
60%
80%
100%
Boy Girl Age
5 to 12
Age
13 to 17
Low
Income
Mid/High
Income
Black Non-Black TSA
Awareness & Availability of Mental Health Services
A total of 46.4% of Total Service Area parents are aware of local community
resources for mental health.
Awareness is much lower locally than it is across the US.
46.4%
68.8%
0%
20%
40%
60%
80%
100%
Total Service Area United States
Aware of Mental Health Resources in the Community
Sources: ● 2013 PRC Child & Adolescent Health Survey, Professional Research Consultants, Inc. [Item 99]
● 2012 PRC National Child & Adolescent Health Survey, Professional Research Consultants, Inc.
Notes: ● Asked of all respondents.
Access to Mental Health Services
A total of 11.3% of Total Service Area children are reported to have needed mental
health services, but did not receive them.
Similar to national findings.
Satisfies the Healthy People 2020 objective of 24.2% or lower.

42
11.3%16.4%
0%
20%
40%
60%
80%
100%
Total Service Area United States
Healthy People 2020 Target = 24.2% or Lower
Child Needed Mental Health Services
But Did Not Receive Them in the Past Year(Among Parents of Children 5-17 Needing Mental Health Services; Total Service Area, 2013)
Sources: ● 2013 PRC Child & Adolescent Health Survey, Professional Research Consultants, Inc. [Item 84]
● 2012 PRC National Child & Adolescent Health Survey, Professional Research Consultants, Inc.
● US Department of Health and Human Services. Healthy People 2020. December 2010. http://www.healthypeople.gov [Objective MHMD-6]
Notes: ● Asked of respondents for whom the randomly selected child in the household is between the ages of 5 and 17 and has needed mental health services.
Among respondents reporting that their child did not receive the needed mental health
services, reasons most often related to cost or insurance, not knowing where to go,
and stigma (6.7% of these parents did not try to get services for their child).
Reason Child Did Not Receive the Needed Mental Health Services(Parents Whose Child Did Not Receive the Needed Mental Health Services;
Total Service Area, 2012)
Sources: ● 2012 PRC Child & Adolescent Health Survey, Professional Research Consultants, Inc. [Item 85]
Notes: ● Asked of respondents for whom the randomly selected child in the household is between the ages of 5 and 17 and whose child did not receive mental health
services for their child when needed.
Cost/Insurance 35.5%
Other 26.7%
Don't Know Who to
Call 19.2%
Uncertain 6.8%
Never Tried 6.7%
Stigma 5.1%

43
SPECIAL HEALTH NEEDS

44
Prevalence of Selected Medical Conditions
Speech & Language Problems
A total of 13.5% of Total Service Area parents report that their child has suffered
from or been diagnosed with three or more ear infections in his/her lifetime.
Much lower than national findings.
A total of 8.8% of area parents report that their child has suffered from or been
diagnosed with speech or language problems.
Lower than the national response.
13.8% of these respondents characterized their child’s problem as “severe.”
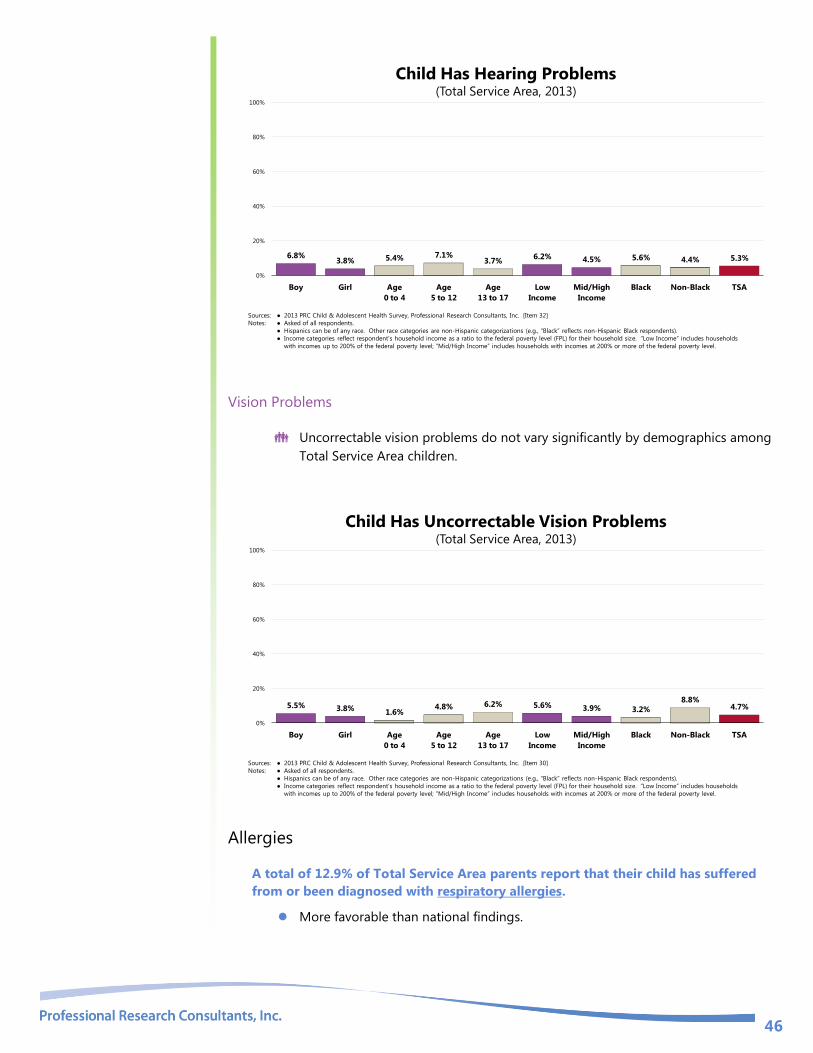
A total of 5.3% of Total Service Area parents report that their child has suffered
from or been diagnosed with hearing problems.
Similar to the nationwide prevalence.
A total of 4.7% of Total Service Area parents report that their child has suffered
from or been diagnosed with vision problems that cannot be corrected with glasses
or contact lenses.
Higher than the national prevalence.
13
.5%
8.8
%
5.3
%
4.7
%
25
.6%
13
.7%
4.9
%
1.9
%
0%
20%
40%
60%
80%
100%
3+ Ear Infections Speech/Language Problems Hearing Problems Uncorrectable Vision Problems
Total Service Area United States
Child Has Vision,
Hearing or Speech/Language Problems(Total Service Area, 2013)
Sources: ● 2013 PRC Child & Adolescent Health Survey, Professional Research Consultants, Inc. [Items 30, 32, 54, 62-63]
● 2012 PRC National Child & Adolescent Health Survey, Professional Research Consultants, Inc.
Note: ● Asked of all respondents.
Speech/Language
Problems Characterized as:
Severe 13.8%
Moderate 27.3%
Mild 58.9%
Ear Infections
Children more likely to have had three or more ear infections include:
Those age 5 and older.
Those living in middle/high-income households.
Respondents were asked to
report on the prevalence of a
number of different chronic
conditions and illnesses
afflicting children.
“Would you please tell me if
this child has ever suffered
from or been diagnosed with
any of the following medical
conditions ….”

45
Child Has Had 3+ Ear Infections (Ever)(Total Service Area, 2013)
Sources: ● 2013 PRC Child & Adolescent Health Survey, Professional Research Consultants, Inc. [Item 54]
Notes: ● Asked of all respondents.
● Hispanics can be of any race. Other race categories are non-Hispanic categorizations (e.g., “Black” reflects non-Hispanic Black respondents).
● Income categories reflect respondent's household income as a ratio to the federal poverty level (FPL) for their household size. “Low Income” includes households
with incomes up to 200% of the federal poverty level; “Mid/High Income” includes households with incomes at 200% or more of the federal poverty level.
12.5% 14.5%
5.8%
15.5% 15.8%
10.2%
17.3%13.6% 12.0% 13.5%
0%
20%
40%
60%
80%
100%
Boy Girl Age
0 to 4
Age
5 to 12
Age
13 to 17
Low
Income
Mid/High
Income
Black Non-Black TSA
Speech/Language Problems
Children more likely to have speech/language problems include:
Those between the ages of 5 and 12.
Child Has Speech/Language Problems(Total Service Area, 2013)
Sources: ● 2013 PRC Child & Adolescent Health Survey, Professional Research Consultants, Inc. [Item 62]
Notes: ● Asked of all respondents.
● Hispanics can be of any race. Other race categories are non-Hispanic categorizations (e.g., “Black” reflects non-Hispanic Black respondents).
● Income categories reflect respondent's household income as a ratio to the federal poverty level (FPL) for their household size. “Low Income” includes households
with incomes up to 200% of the federal poverty level; “Mid/High Income” includes households with incomes at 200% or more of the federal poverty level.
10.6%6.9%
4.4%
11.9%8.1%
10.9%8.1% 9.3% 8.0% 8.8%
0%
20%
40%
60%
80%
100%
Boy Girl Age
0 to 4
Age
5 to 12
Age
13 to 17
Low
Income
Mid/High
Income
Black Non-Black TSA
Hearing Problems
The prevalence of hearing problems in area children does not vary significantly
by demographic characteristics.
46
Child Has Hearing Problems(Total Service Area, 2013)
Sources: ● 2013 PRC Child & Adolescent Health Survey, Professional Research Consultants, Inc. [Item 32]
Notes: ● Asked of all respondents.
● Hispanics can be of any race. Other race categories are non-Hispanic categorizations (e.g., “Black” reflects non-Hispanic Black respondents).
● Income categories reflect respondent's household income as a ratio to the federal poverty level (FPL) for their household size. “Low Income” includes households
with incomes up to 200% of the federal poverty level; “Mid/High Income” includes households with incomes at 200% or more of the federal poverty level.
6.8%3.8% 5.4% 7.1%
3.7%6.2% 4.5% 5.6% 4.4% 5.3%
0%
20%
40%
60%
80%
100%
Boy Girl Age
0 to 4
Age
5 to 12
Age
13 to 17
Low
Income
Mid/High
Income
Black Non-Black TSA
Vision Problems
Uncorrectable vision problems do not vary significantly by demographics among
Total Service Area children.
Child Has Uncorrectable Vision Problems(Total Service Area, 2013)
Sources: ● 2013 PRC Child & Adolescent Health Survey, Professional Research Consultants, Inc. [Item 30]
Notes: ● Asked of all respondents.
● Hispanics can be of any race. Other race categories are non-Hispanic categorizations (e.g., “Black” reflects non-Hispanic Black respondents).
● Income categories reflect respondent's household income as a ratio to the federal poverty level (FPL) for their household size. “Low Income” includes households
with incomes up to 200% of the federal poverty level; “Mid/High Income” includes households with incomes at 200% or more of the federal poverty level.
5.5% 3.8%1.6%
4.8% 6.2% 5.6% 3.9% 3.2%
8.8%4.7%
0%
20%
40%
60%
80%
100%
Boy Girl Age
0 to 4
Age
5 to 12
Age
13 to 17
Low
Income
Mid/High
Income
Black Non-Black TSA
Allergies
A total of 12.9% of Total Service Area parents report that their child has suffered
from or been diagnosed with respiratory allergies.
More favorable than national findings.

47
A total of 26.7% of Total Service Area parents report that their child has suffered
from or been diagnosed with eczema or any kind of skin allergy.
Less favorable than national findings.
A total of 8.9% of Total Service Area parents report that their child has suffered
from or been diagnosed with a food or digestive allergy.
Similar to the national prevalence.
12.9%
26.7%
8.9%
17.7%21.0%
11.1%
0%
20%
40%
60%
80%
100%
Respiratory Allergies Eczema/Skin Allergies Food/Digestive Allergies
Total Service Area United States
Child Has Allergies(Total Service Area, 2013)
Sources: ● 2013 PRC Child & Adolescent Health Survey, Professional Research Consultants, Inc. [Items 47-49]
● 2012 PRC National Child & Adolescent Health Survey, Professional Research Consultants, Inc.
Note: ● Asked of all respondents.
Eczema & Skin Allergies
Eczema/skin allergies are statistically more common among area Black children.
Child Has Eczema/Skin Allergies(Total Service Area, 2013)
Sources: ● 2013 PRC Child & Adolescent Health Survey, Professional Research Consultants, Inc. [Item 49]
Notes: ● Asked of respondents.
● Hispanics can be of any race. Other race categories are non-Hispanic categorizations (e.g., “Black” reflects non-Hispanic Black respondents).
● Income categories reflect respondent's household income as a ratio to the federal poverty level (FPL) for their household size. “Low Income” includes households
with incomes up to 200% of the federal poverty level; “Mid/High Income” includes households with incomes at 200% or more of the federal poverty level.
22.8%
30.7%
23.8%
29.4%26.2%
29.3%25.5%
29.5%
18.8%
26.7%
0%
20%
40%
60%
80%
100%
Boy Girl Age
0 to 4
Age
5 to 12
Age
13 to 17
Low
Income
Mid/High
Income
Black Non-Black TSA
Respiratory Allergies
Children more likely to have respiratory allergies include:
Those age 5 and older (note the positive correlation with age).

48
Child Has Respiratory Allergies(Total Service Area, 2013)
Sources: ● 2013 PRC Child & Adolescent Health Survey, Professional Research Consultants, Inc. [Item 47]
Notes: ● Asked of respondents.
● Hispanics can be of any race. Other race categories are non-Hispanic categorizations (e.g., “Black” reflects non-Hispanic Black respondents).
● Income categories reflect respondent's household income as a ratio to the federal poverty level (FPL) for their household size. “Low Income” includes households
with incomes up to 200% of the federal poverty level; “Mid/High Income” includes households with incomes at 200% or more of the federal poverty level.
16.1%
9.6%4.6%
12.7%17.6%
15.2%11.7%
14.5%
8.0%12.9%
0%
20%
40%
60%
80%
100%
Boy Girl Age
0 to 4
Age
5 to 12
Age
13 to 17
Low
Income
Mid/High
Income
Black Non-Black TSA
Food or Digestive Allergies
Note also the positive correlation between age and food/digestive allergies
among Total Service Area children.
Child Has Food/Digestive Allergies(Total Service Area, 2013)
Sources: ● 2013 PRC Child & Adolescent Health Survey, Professional Research Consultants, Inc. [Item 48]
Notes: ● Asked of respondents.
● Hispanics can be of any race. Other race categories are non-Hispanic categorizations (e.g., “Black” reflects non-Hispanic Black respondents).
● Income categories reflect respondent's household income as a ratio to the federal poverty level (FPL) for their household size. “Low Income” includes households
with incomes up to 200% of the federal poverty level; “Mid/High Income” includes households with incomes at 200% or more of the federal poverty level.
9.7% 8.2%4.4%
9.7%12.1%
9.0% 9.9% 10.0%6.3%
8.9%
0%
20%
40%
60%
80%
100%
Boy Girl Age
0 to 4
Age
5 to 12
Age
13 to 17
Low
Income
Mid/High
Income
Black Non-Black TSA
Neurological Conditions
A total of 4.0% of Total Service Area parents report that their child has suffered
from or been diagnosed with migraines or severe headaches.
Similar to national findings.
A total of 1.6% of Total Service Area parents report that their child has suffered
from or been diagnosed with a brain injury or concussion.
Favorably low in comparison with national findings.

49
Less than one percent (0.8%) reports that their child has suffered from or been
diagnosed with a seizure disorder, such as epilepsy.
Similar to national findings.
4.0%1.6% 0.8%
5.2% 4.0%1.4%
0%
20%
40%
60%
80%
100%
Migraine/Severe Headaches Brain Injury/Concussion Seizure Disorder/Epilepsy
Total Service Area United States
Child Has Neurological Conditions(Total Service Area, 2013)
Sources: ● 2013 PRC Child & Adolescent Health Survey, Professional Research Consultants, Inc. [Items 50, 52-53]
● 2012 PRC National Child & Adolescent Health Survey, Professional Research Consultants, Inc.
Note: ● Asked of all respondents.
Migraines/Severe Headaches
Teens are more likely to suffer from migraines/severe headaches.
Child Has Migraines/Severe Headaches(Total Service Area, 2013)
Sources: ● 2013 PRC Child & Adolescent Health Survey, Professional Research Consultants, Inc. [Item 53]
Notes: ● Asked of respondents.
● Hispanics can be of any race. Other race categories are non-Hispanic categorizations (e.g., “Black” reflects non-Hispanic Black respondents).
● Income categories reflect respondent's household income as a ratio to the federal poverty level (FPL) for their household size. “Low Income” includes households
with incomes up to 200% of the federal poverty level; “Mid/High Income” includes households with incomes at 200% or more of the federal poverty level.
2.9% 5.0%0.0% 2.1%
9.9%
3.7% 4.4% 4.3% 3.1% 4.0%
0%
20%
40%
60%
80%
100%
Boy Girl Age
0 to 4
Age
5 to 12
Age
13 to 17
Low
Income
Mid/High
Income
Black Non-Black TSA
Brain Injuries/Concussions
Children more likely to have had a brain injury or concussion include:
Teens (note the positive correlation with age).
RELATED ISSUE:
See also Injury & Safety in the
Modifiable Health Risks
section of this report.
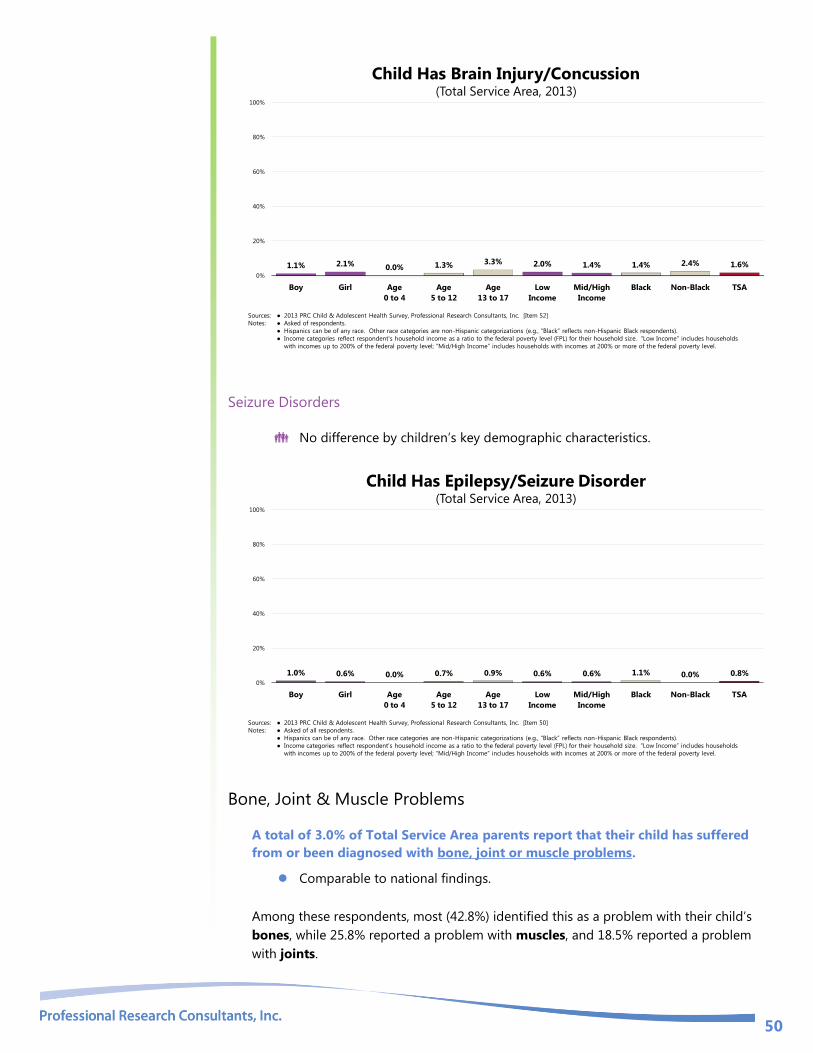
50
Child Has Brain Injury/Concussion(Total Service Area, 2013)
Sources: ● 2013 PRC Child & Adolescent Health Survey, Professional Research Consultants, Inc. [Item 52]
Notes: ● Asked of respondents.
● Hispanics can be of any race. Other race categories are non-Hispanic categorizations (e.g., “Black” reflects non-Hispanic Black respondents).
● Income categories reflect respondent's household income as a ratio to the federal poverty level (FPL) for their household size. “Low Income” includes households
with incomes up to 200% of the federal poverty level; “Mid/High Income” includes households with incomes at 200% or more of the federal poverty level.
1.1% 2.1% 0.0% 1.3% 3.3% 2.0% 1.4% 1.4% 2.4% 1.6%
0%
20%
40%
60%
80%
100%
Boy Girl Age
0 to 4
Age
5 to 12
Age
13 to 17
Low
Income
Mid/High
Income
Black Non-Black TSA
Seizure Disorders
No difference by children’s key demographic characteristics.
Child Has Epilepsy/Seizure Disorder(Total Service Area, 2013)
Sources: ● 2013 PRC Child & Adolescent Health Survey, Professional Research Consultants, Inc. [Item 50]
Notes: ● Asked of all respondents.
● Hispanics can be of any race. Other race categories are non-Hispanic categorizations (e.g., “Black” reflects non-Hispanic Black respondents).
● Income categories reflect respondent's household income as a ratio to the federal poverty level (FPL) for their household size. “Low Income” includes households
with incomes up to 200% of the federal poverty level; “Mid/High Income” includes households with incomes at 200% or more of the federal poverty level.
1.0% 0.6% 0.0% 0.7% 0.9% 0.6% 0.6% 1.1% 0.0% 0.8%0%
20%
40%
60%
80%
100%
Boy Girl Age
0 to 4
Age
5 to 12
Age
13 to 17
Low
Income
Mid/High
Income
Black Non-Black TSA
Bone, Joint & Muscle Problems
A total of 3.0% of Total Service Area parents report that their child has suffered
from or been diagnosed with bone, joint or muscle problems.
Comparable to national findings.
Among these respondents, most (42.8%) identified this as a problem with their child’s
bones, while 25.8% reported a problem with muscles, and 18.5% reported a problem
with joints.

51
3.0% 4.9%
0%
20%
40%
60%
80%
100%
Total Service Area United States
Child Has Bone, Joint or Muscle Problems(Total Service Area, 2013)
Sources: ● 2013 PRC Child & Adolescent Health Survey, Professional Research Consultants, Inc. [Item 56-57]
● 2012 PRC National Child & Adolescent Health Survey, Professional Research Consultants, Inc.
Note: ● Asked of all respondents.
Problem is with:
Bones 42.8%
Muscles 25.8%
Joints 18.5%Other 12.9%
No statistical difference when viewed by demographic characteristics.
Child Has Bone, Joint or Muscle Problems(Total Service Area, 2013)
Sources: ● 2013 PRC Child & Adolescent Health Survey, Professional Research Consultants, Inc. [Item 56]
Note: ● Asked of all respondents.
● Hispanics can be of any race. Other race categories are non-Hispanic categorizations (e.g., “Black” reflects non-Hispanic Black respondents).
● Income categories reflect respondent's household income as a ratio to the federal poverty level (FPL) for their household size. “Low Income” includes households
with incomes up to 200% of the federal poverty level; “Mid/High Income” includes households with incomes at 200% or more of the federal poverty level.
2.8% 3.3%0.8%
3.3% 4.6% 2.9% 3.6% 2.2%6.0%
3.0%
0%
20%
40%
60%
80%
100%
Boy Girl Age
0 to 4
Age
5 to 12
Age
13 to 17
Low
Income
Mid/High
Income
Black Non-Black TSA
Sickle-Cell Anemia
A total of 1.1% of Total Service Area children age 0 to 17 currently have sickle-cell
anemia.
Statistically similar by demographics.

52
Child Has Sickle-Cell Anemia(Total Service Area, 2013)
Sources: ● 2013 PRC Child & Adolescent Health Survey, Professional Research Consultants, Inc. [Item 55]
Note: ● Asked of all respondents.
● Hispanics can be of any race. Other race categories are non-Hispanic categorizations (e.g., “Black” reflects non-Hispanic Black respondents).
● Income categories reflect respondent's household income as a ratio to the federal poverty level (FPL) for their household size. “Low Income” includes households
with incomes up to 200% of the federal poverty level; “Mid/High Income” includes households with incomes at 200% or more of the federal poverty level.
0.4% 1.8% 1.6% 0.0%2.4% 1.6% 0.7% 1.2% 0.6% 1.1%
0%
20%
40%
60%
80%
100%
Boy Girl Age
0 to 4
Age
5 to 12
Age
13 to 17
Low
Income
Mid/High
Income
Black Non-Black TSA
Asthma
A total of 17.3% of Total Service Area children age 0 to 17 currently have asthma.
Less favorable than national findings.
Child Currently Has Asthma(Total Service Area, 2013)
Sources: ● 2013 PRC Child & Adolescent Health Survey, Professional Research Consultants, Inc. [Item 140]
● 2012 PRC National Child & Adolescent Survey, Professional Research Consultants, Inc.
Note: ● Asked of all respondents.
17.3%12.0%
0%
20%
40%
60%
80%
100%
Total Service Area United States
Viewed by demographics, the asthma prevalence in area children is highest among:
Boys.
Children age 5 and older.
Black children.

53
Child Currently Has Asthma(Total Service Area, 2013)
Sources: ● 2013 PRC Child & Adolescent Health Survey, Professional Research Consultants, Inc. [Item 140]
Note: ● Asked of all respondents.
● Hispanics can be of any race. Other race categories are non-Hispanic categorizations (e.g., “Black” reflects non-Hispanic Black respondents).
● Income categories reflect respondent's household income as a ratio to the federal poverty level (FPL) for their household size. “Low Income” includes households
with incomes up to 200% of the federal poverty level; “Mid/High Income” includes households with incomes at 200% or more of the federal poverty level.
22.9%
11.7%
6.1%
21.5% 19.7% 19.4%15.4%
21.2%
4.0%
17.3%
0%
20%
40%
60%
80%
100%
Boy Girl Age
0 to 4
Age
5 to 12
Age
13 to 17
Low
Income
Mid/High
Income
Black Non-Black TSA
Asthma-Related Issues
Among Total Service Area children with asthma, nearly 6 in 10 (58.7%) experienced
an emergency or urgent care visit due to their asthma in the past year.
Less favorable than the US prevalence.
This includes 29.7% of asthmatic children in the Total Service Area with 3+
asthma-related emergency medical visits over the past year.
Among Total Service Area children with asthma, 16.0% were hospitalized overnight
in the past year because of their asthma, including 2.3% who were hospitalized
more than once.
Similar to the US prevalence of asthma-related inpatient stays.
Among Total Service Area school-aged children with asthma, 57.7% missed school
because of asthma-related problems in the past year.
Similar to the US prevalence.
This includes 37.1% of school-aged asthmatic children in the Total Service Area
who missed 3+ school days because of their asthma in the past year.
In a related issue, almost one-half (49.0%) of Total Service Area parents with
asthmatic children missed at least one day of work in the last year because of their
child’s asthma.
Statistically comparable to the US percentage.
Includes 26.4% of parents who missed 3+ days of work for their child’s asthma.

54
# of Times:
1 13.8%
2 1.3%3+ 1.0%
# of Times:
1 8.6%
2 12.0%3+ 37.1%
# of Times:
1 7.1%
2 15.5%3+ 26.4%
# of Times:
1 18.2%
2 10.8%3+ 29.7%
58.7%
16.0%
57.7%
49.0%
42.1%
10.6%
54.9%
41.0%
0%
20%
40%
60%
80%
100%
Child Has Had an
Asthma-Related ER/Urgent Care
Visit in Past Year
Child Has Had an
Asthma-Related
Hospital Stay in Past Year
Child Has Missed
School Due to Asthma
in Past Year
Parent Has Missed
Work Due to Child's
Asthma in Past Year
Total Service Area US
Asthma-Related Care(Among Parents of Children With Asthma; Total Service Area, 2013)
Sources: ● 2013 PRC Child & Adolescent Health Survey, Professional Research Consultants, Inc. [Items 43-46]
● 2012 PRC National Child & Adolescent Health Survey, Professional Research Consultants, Inc.
Notes: ● Asked of respondents with a child who currently has asthma.
Diabetes
Just over one percent (1.2%) of Total Service Area parents has been told by a doctor
or other health care provider that their child (age 0-17) had diabetes.
Similar to national findings.
Child Has Diabetes(Total Service Area, 2013)
Sources: ● 2013 PRC Child & Adolescent Health Survey, Professional Research Consultants, Inc. [Item 51]
● 2012 PRC National Child & Adolescent Survey, Professional Research Consultants, Inc.
Note: ● Asked of all respondents.
1.2% 0.9%0%
20%
40%
60%
80%
100%
Total Service Area United States
Childhood diabetes prevalence in the Total Service Area is highest among:
Black children.

55
Child Has Diabetes (Total Service Area, 2013)
Sources: ● 2013 PRC Child & Adolescent Health Survey, Professional Research Consultants, Inc. [Item 51]
Notes: ● Asked of all respondents.
● Hispanics can be of any race. Other race categories are non-Hispanic categorizations (e.g., “Black” reflects non-Hispanic Black respondents).
● Income categories reflect respondent's household income as a ratio to the federal poverty level (FPL) for their household size. “Low Income” includes households
with incomes up to 200% of the federal poverty level; “Mid/High Income” includes households with incomes at 200% or more of the federal poverty level.
0.5% 1.9% 0.0% 1.7% 1.5% 1.7% 0.8% 1.6% 0.0% 1.2%
0%
20%
40%
60%
80%
100%
Boy Girl Age
0 to 4
Age
5 to 12
Age
13 to 17
Low
Income
Mid/High
Income
Black Non-Black TSA

56
Managing Children’s Special Health Needs
Special Health Needs
Prevalence of Special Health Needs
In all, 60.3% of children (age 0-17) in the service area are determined to have special
health needs (meaning that they are reported to have one or more of the chronic
disease conditions tested in the survey or any another chronic condition not specifically
tested).
Similar to national findings.
Child Has a Special Health Need(Total Service Area, 2013)
Sources: ● 2013 PRC Child & Adolescent Health Survey, Professional Research Consultants, Inc. [Item 161]
● 2012 PRC National Child & Adolescent Survey, Professional Research Consultants, Inc.
Note: ● Includes respondents reporting a child’s diagnosis of any medical condition specifically measured in the survey, as well as any other not specifically addressed.
60.3%64.5%
0%
20%
40%
60%
80%
100%
Total Service Area United States
Special health needs are more prevalent among Black children in the Total
Service Area, and appear to increase with age, as shown below.
Child Has a Special Health Need(Total Service Area, 2013)
Sources: ● 2013 PRC Child & Adolescent Health Survey, Professional Research Consultants, Inc. [Item 161]
Note: ● Includes respondents reporting a child’s diagnosis of any medical condition specifically measured in the survey, as well as any other not specifically addressed.
● Hispanics can be of any race. Other race categories are non-Hispanic categorizations (e.g., “Black” reflects non-Hispanic Black respondents).
● Income categories reflect respondent's household income as a ratio to the federal poverty level (FPL) for their household size. “Low Income” includes households
with incomes up to 200% of the federal poverty level; “Mid/High Income” includes households with incomes at 200% or more of the federal poverty level.
58.9%61.9%
42.6%
61.6%
72.6%67.8%
58.7%
64.9%
49.1%
60.3%
0%
20%
40%
60%
80%
100%
Boy Girl Age
0 to 4
Age
5 to 12
Age
13 to 17
Low
Income
Mid/High
Income
Black Non-Black TSA

57
Prescriptions & Special Therapy
A total of 24.1% of area children have a chronic condition (one that has lasted or is
expected to last one year or more) that requires prescription medication(s), not
counting vitamins.
Similar to national findings.
A total of 6.5% of Total Service Area children have a chronic condition (one that has
lasted or is expected to last one year or more) that requires special therapy, such as
physical, occupational or speech therapy.
Similar to national findings.
Sources: ● 2013 PRC Child & Adolescent Health Survey, Professional Research Consultants, Inc. [Items 156-157]
● 2012 PRC National Child & Adolescent Health Survey, Professional Research Consultants, Inc.
Note: ● Asked of all respondents.
● In this case, “chronic conditions” are defined as conditions that have lasted, or are expected to last, 12 months or longer.
24.1%
6.5%
20.9%
7.0%
0%
20%
40%
60%
80%
100%
Child Has a Chronic Condition
That Requires Prescription(s)
Child Has a Chronic Condition
That Requires Special Therapy
Total Service Area United States
Managing Children’s Special Health Needs(Total Service Area, 2013)
Chronic conditions that require either prescriptions or special therapies are more
prevalent among:
Children age 5 and older (note the positive correlation with age).
Black children.
The overall prevalence is comparable to the national figure.

58
Child Has a Chronic Condition That
Requires Either Prescription(s) or Special Therapy(Total Service Area, 2013)
Sources: ● 2013 PRC Child & Adolescent Health Survey, Professional Research Consultants, Inc. [Item 166]
● 2012 PRC National Child & Adolescent Health Survey, Professional Research Consultants, Inc.
Note: ● Asked of all respondents.
● In this case, “chronic conditions” are defined as conditions that have lasted, or are expected to last, 12 months or longer.
● Hispanics can be of any race. Other race categories are non-Hispanic categorizations (e.g., “Black” reflects non-Hispanic Black respondents).
● Income categories reflect respondent's household income as a ratio to the federal poverty level (FPL) for their household size. “Low Income” includes households
with incomes up to 200% of the federal poverty level; “Mid/High Income” includes households with incomes at 200% or more of the federal poverty level.
29.5%25.8%
10.6%
31.1%
36.9%31.5%
24.9%29.7%
18.0%
27.6%24.3%
0%
20%
40%
60%
80%
100%
Boy Girl Age
0 to 4
Age
5 to 12
Age
13 to 17
Low
Income
Mid/High
Income
Black Non-Black TSA US
In addition to the conditions specifically surveyed, some parents noted the following
other special health needs: child needs speech therapy; autism; low birthweight; vision
problems; asthma; chronic pain; and ADHD (to name a few).
Child’s & Parent’s Needs
A total of 27.1% of Total Service Area parents of children with special health needs
(as defined previously) identified medications/pharmaceutical supplies as their
greatest need for this child.
Other common needs mentioned by parents included specialists, diagnosis/
treatment, special education, nutrition, therapy, and maintenance of health.
Note that these data exclude the 36.9% of respondents who were uncertain or
said “child does not currently have health concerns.”
Respondents’ Greatest Need for Child With Special Needs(Among Parents of Children With Special Health Needs; Total Service Area, 2013)
Sources: ● 2013 PRC Child & Adolescent Health Survey, Professional Research Consultants, Inc. [Item 66]
Notes: ● Asked of all respondents whose child has special health needs; excludes those who were uncertain or unable to provide a response.
Meds/Pharmaceuticals
27.1%
Specialists 20.7%Diagnosis/Treatment
9.3%
Special Education 6.4%
Nutrition 6.4%
Therapy 5.7%
Maintenance of Health
3.6%
Other (Each <3%)
20.8%
“What is your greatest need for
your child with special needs?”
[In this case, the term “special
needs” includes children reported
to have any of the chronic disease
conditions tested in the survey.]
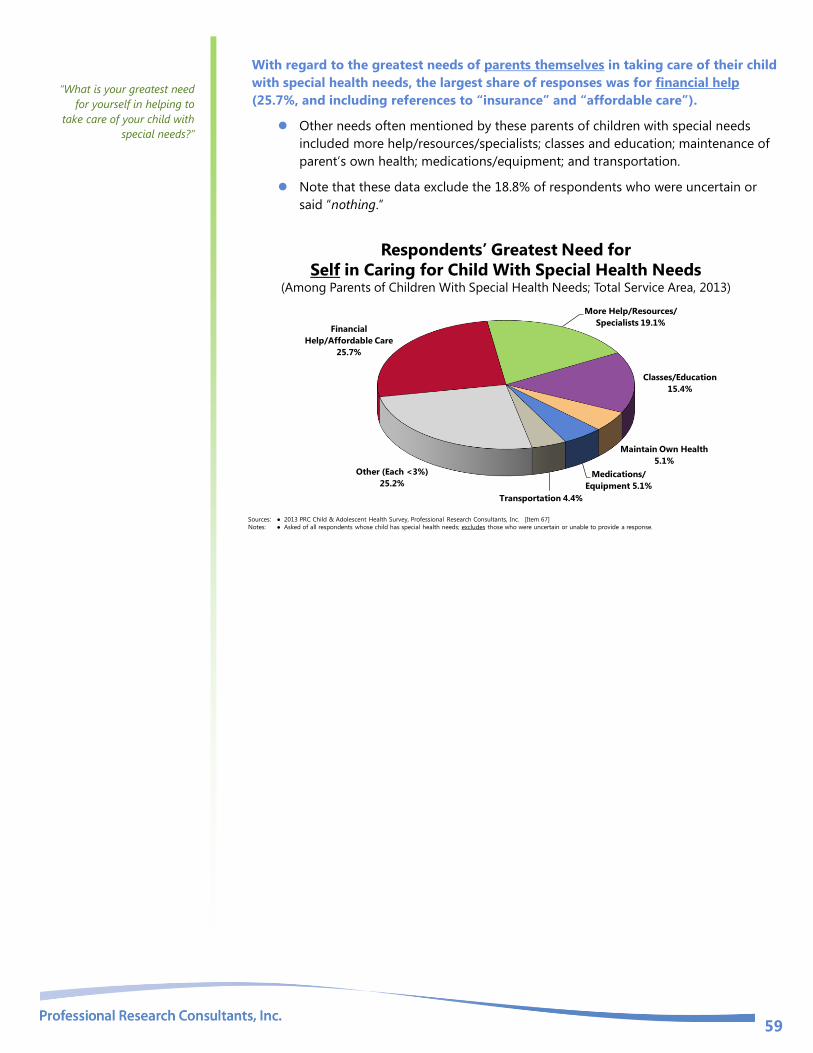
59
With regard to the greatest needs of parents themselves in taking care of their child
with special health needs, the largest share of responses was for financial help
(25.7%, and including references to “insurance” and “affordable care”).
Other needs often mentioned by these parents of children with special needs
included more help/resources/specialists; classes and education; maintenance of
parent’s own health; medications/equipment; and transportation.
Note that these data exclude the 18.8% of respondents who were uncertain or
said “nothing.”
Respondents’ Greatest Need for
Self in Caring for Child With Special Health Needs(Among Parents of Children With Special Health Needs; Total Service Area, 2013)
Sources: ● 2013 PRC Child & Adolescent Health Survey, Professional Research Consultants, Inc. [Item 67]
Notes: ● Asked of all respondents whose child has special health needs; excludes those who were uncertain or unable to provide a response.
Financial
Help/Affordable Care
25.7%
More Help/Resources/
Specialists 19.1%
Classes/Education
15.4%
Maintain Own Health
5.1%
Medications/
Equipment 5.1%
Transportation 4.4%
Other (Each <3%)
25.2%
“What is your greatest need
for yourself in helping to
take care of your child with
special needs?”

60
PRENATAL & INFANT HEALTH

61
Prenatal Care Improving the well-being of mothers, infants, and children is an important public health goal for the US. Their
well-being determines the health of the next generation and can help predict future public health challenges
for families, communities, and the healthcare system. The risk of maternal and infant mortality and pregnancy-
related complications can be reduced by increasing access to quality preconception (before pregnancy) and
inter-conception (between pregnancies) care. Moreover, healthy birth outcomes and early identification and
treatment of health conditions among infants can prevent death or disability and enable children to reach
their full potential. Many factors can affect pregnancy and childbirth, including pre-conception health status,
age, access to appropriate healthcare, and poverty.
Infant and child health are similarly influenced by socio-demographic factors, such as family income, but are
also linked to the physical and mental health of parents and caregivers. There are racial and ethnic disparities
in mortality and morbidity for mothers and children, particularly for Blacks. These differences are likely the
result of many factors, including social determinants (such as racial and ethnic disparities in infant mortality;
family income; educational attainment among household members; and health insurance coverage) and
physical determinants (i.e., the health, nutrition, and behaviors of the mother during pregnancy and early
childhood).
– Healthy People 2020 (www.healthypeople.gov)
Between 2007 and 2009, 23.6% of all City of Chicago births did not receive prenatal
care in the first trimester of pregnancy.
Less favorable than the Illinois proportion.
Fails to satisfy the Healthy People 2020 target (22.1% or lower).
Lack of Prenatal Care in the First Trimester(Percentage of Live Births, 2007-2009)
Sources: ● Illinois Department of Public Health.
● US Department of Health and Human Services. Healthy People 2020. December 2010. http://www.healthypeople.gov [Objective MICH-10.1]
Note: ● Numbers are a percentage of all live births within each population.
23.6%19.1%
0%
20%
40%
60%
80%
100%
City of Chicago Illinois
Healthy People 2020 Target = 22.1% or Lower
Lack of prenatal care is highest in the Black population.
Early and continuous
prenatal care is the best
assurance of infant health.

62
Lack of Prenatal Care in the First Trimester (Percentage of Live Births, 2007-2009)
Sources: ● Illinois Department of Public Health.
● US Department of Health and Human Services. Healthy People 2020. December 2010. http://www.healthypeople.gov [Objective MICH-10.1]
Note: ● Numbers are a percentage of all live births within each population.
20.7%
27.5%24.1% 23.6%
City of Chicago
Non-Hispanic White
City of Chicago
Non-Hispanic Black
City of Chicago
Other
City of Chicago
All Races/Ethnicities
0%
20%
40%
60%
80%
100%
Healthy People 2020 Target = 22.1% or Lower

63
Low-Weight Births A total of 9.7% of 2007-2009 City of Chicago births were low-weight.
Less favorable than the Illinois proportion.
Less favorable than the national proportion.
Fails to satisfy the Healthy People 2020 target (7.8% or lower).
Low-Weight Births(Percentage of Live Births, 2007-2009)
Sources: ● Illinois Department of Public Health.
● Centers for Disease Control and Prevention, National Vital Statistics System.
● US Department of Health and Human Services. Healthy People 2020. December 2010. http://www.healthypeople.gov [Objective MICH-8.1]
Note: ● Numbers are a percentage of all live births within each population.
● Defined as an infant born weighing less than 5.5 pounds (2,500 grams) regardless of gestational age.
9.7% 8.4% 8.2%
0%
20%
40%
60%
80%
100%
City of Chicago Illinois United States
Healthy People 2020 Target = 7.8% or Lower
Highest among Blacks in the City of Chicago.
Low-Weight Births(Percentage of Live Births, 2007-2009)
Sources: ● Illinois Department of Public Health.
● US Department of Health and Human Services. Healthy People 2020. December 2010. http://www.healthypeople.gov [Objective MICH-8.1]
Note: ● Numbers are a percentage of all live births within each population.
7.0%
14.8%
8.7% 9.7%
City of Chicago
Non-Hispanic White
City of Chicago
Non-Hispanic Black
City of Chicago
Other
City of Chicago
All Races/Ethnicities
0%
20%
40%
60%
80%
100%
Healthy People 2020 Target = 7.8% or Lower
Low birthweight babies,
those who weigh less than
2,500 grams (5 pounds,
8 ounces) at birth, are much
more prone to illness and
neonatal death than are
babies of normal
birthweight.
Largely a result of receiving
poor or inadequate prenatal
care, many low-weight
births and the consequent
health problems are
preventable.

64
CHILD & ADOLESCENT MORTALITY

65
Mortality Rates
Infant Mortality
Between 2007 and 2009, there was an annual average of 7.4 infant deaths per 1,000
live births in Cook County (City of Chicago data unavailable).
Less favorable than the Illinois rate.
Less favorable than the national rate.
Fail to satisfy the Healthy People 2020 target of 6.0 per 1,000 live births.
Infant Mortality Rate(2007-2009 Annual Average Infant Deaths per 1,000 Live Births)
Sources: ● CDC WONDER Online Query System. Centers for Disease Control and Prevention, Epidemiology Program Office, Division of Public Health Surveillance and Informatics.
Data extracted September 2012.
● Centers for Disease Control and Prevention, National Center for Health Statistics.
● US Department of Health and Human Services. Healthy People 2020. December 2010. http://www.healthypeople.gov [Objective MICH-1.3]
Notes: ● Rates are three-year averages of deaths of children under 1 year old per 1,000 live births.
● *Cook County data is used here; City of Chicago data is unavailable.
7.46.7 6.5
0
5
10
15
20
25
Cook County* Illinois United States
Healthy People 2020 Target = 6.0 or Lower
Infant mortality is particularly high among Cook County Black births.
Infant Mortality Rate(2007-2009 Annual Average Infant Deaths per 1,000 Live Births)
Sources: ● CDC WONDER Online Query System. Centers for Disease Control and Prevention, Epidemiology Program Office, Division of Public Health Surveillance and Informatics.
Data extracted September 2012.
● US Department of Health and Human Services. Healthy People 2020. December 2010. http://www.healthypeople.gov [Objective MICH-1.3]
Notes: ● Rates are three-year averages of deaths of children under 1 year old per 1,000 live births.
4.6
12.7
5.1
3.3
7.4
Cook County
Non-Hispanic White
Cook County
Non-Hispanic Black
Cook County
Hispanic
Cook County
Non-Hispanic Other
Cook County
All Races/Ethnicities
0.0
5.0
10.0
15.0
20.0
25.0
Healthy People 2020 Target = 6.0 or Lower
Infant mortality rates
reflect deaths of children
less than one year old
per 1,000 live births.

66
Child & Adolescent Mortality
Between 2006 and 2008, Cook County reported an annual average of 27.7 child
deaths (age 1 to 4) per 100,000 population.
Higher than the Illinois rate.
Identical to the national rate.
Fails to satisfy the Healthy People 2020 target of 25.7 per 100,000 population.
With regard to children age 5 to 9, the county’s crude death rate was 13.4 per
100,000 population (2006-2008 data).
Higher than the Illinois rate.
Comparable to the national rate.
Fails to satisfy the Healthy People 2020 goal of 12.3 deaths per 100,000
population.
Among Cook County youth age 10 to 14, the 2006-2008 crude death rate was 14.6
per 100,000 population.
Above the Illinois rate.
Below the national rate.
Similar to the related Healthy People 2020 goal of 15.2 deaths per 100,000
population.
Among area teens (age 15 to 19), the 2006-2008 crude death rate was 62.7.
Much higher than the Illinois rate.
Much higher than the national rate.
Far from satisfying the related Healthy People 2020 goal of 55.7 deaths per
100,000 population.
Child & Adolescent Mortality Rates by Age Group(Annual Average Child Mortality per 100,000 Population; 2006-2008)
Sources: ● CDC WONDER Online Query System. Centers for Disease Control and Prevention, Epidemiology Program Office, Division of Public Health Surveillance and Informatics.
Data extracted February 2013.
● US Department of Health and Senior Services. Healthy People 2020. December 2010. http://www.healthypeople.gov [Objective MICH-3.1]
Notes: ● Rates are crude rates, representing the number of deaths of children in each age group per 100,000 population.
27.7
13.4 14.6
62.7
26.6
11.914
52.9
27.7
12.816.1
57.7
25.7
12.315.2
55.7
0
20
40
60
80
100
Ages 1 to 4 Ages 5 to 9 Ages 10 to 14 Ages 15 to 19
Cook County Illinois United States Healthy People 2020

67
Leading Causes of Child Deaths The predominant cause of death between 2008-2010 for Cook County children
under one year of age was perinatal conditions (certain conditions occurring in the
perinatal period, usually low birthweight, preterm birth, and complications of pregnancy,
labor and delivery).
Other leading causes of death for infants included congenital conditions
(including congenital malformations, deformations and chromosomal
abnormalities) and accidents.
Accidents were the number-one leading cause of death for Cook County children
age 1 through 4 and 10 through 14.
Among children age 1-4, congenital conditions and homicide followed
accidents as the leading causes of death.
For children age 5-9, accidents and homicide followed cancer as the leading
cause of death.
Among those age 10-14, cancer and homicide followed accidents as the leading
cause of death.
Firearm-related deaths (mainly homicides) top the list for teens age 15 to 19.
Accidents (mainly motor vehicle) and suicide followed firearm-related deaths
as the leading causes of death for Cook County teens (15-19).
Leading Causes of Child Deaths by Age Group(Cook County, 2008-2010)
Sources: ● CDC WONDER Online Query System. Centers for Disease Control and Prevention, Epidemiology Program Office, Division of Public Health Surveillance and Informatics.
Data extracted February 2013.
Notes: ● *Perinatal conditions include certain conditions occurring in the perinatal period, usually low birthweight, preterm birth, and complications of pregnancy, labor
and delivery.
● **Congenital conditions include congenital malformations, deformations and chromosomal abnormalities.
Cook County Under 1 Year Ages 1 to 4 Ages 5 to 9 Ages 10 to 14 Ages 15 to 19
Number-One Leading CausePerinatal
Conditions* Accidents Cancer Accidents
Firearm-Related(Mainly Homicide)
Number-Two Leading CauseCongenital
Conditions**
Congenital
Conditions**Accidents Cancer
Accidents (Mainly
Motor Vehicle)
Number-Three Leading Cause Accidents Homicide Homicide Homicide Suicide
See also Injury &
Safety in the
Modifiable Health
Risks section of
this report.
68
MODIFIABLE HEALTH RISKS

69
Nutrition Strong science exists supporting the health benefits of eating a healthful diet and maintaining a healthy body
weight. Efforts to change diet and weight should address individual behaviors, as well as the policies and
environments that support these behaviors in settings such as schools, worksites, healthcare organizations,
and communities.
The goal of promoting healthful diets and healthy weight encompasses increasing household food security
and eliminating hunger.
Americans with a healthful diet:
Consume a variety of nutrient-dense foods within and across the food groups, especially whole grains,
fruits, vegetables, low-fat or fat-free milk or milk products, and lean meats and other protein sources.
Limit the intake of saturated and trans fats, cholesterol, added sugars, sodium (salt), and alcohol.
Limit caloric intake to meet caloric needs.
Diet and body weight are related to health status. Good nutrition is important to the growth and development
of children. A healthful diet also helps Americans reduce their risks for many health conditions, including:
overweight and obesity; malnutrition; iron-deficiency anemia; heart disease; high blood pressure; dyslipidemia
(poor lipid profiles); type 2 diabetes; osteoporosis; oral disease; constipation; diverticular disease; and some
cancers.
Diet reflects the variety of foods and beverages consumed over time and in settings such as worksites,
schools, restaurants, and the home. Interventions to support a healthier diet can help ensure that:
Individuals have the knowledge and skills to make healthier choices.
Healthier options are available and affordable.
Social Determinants of Diet. Demographic characteristics of those with a more healthful diet vary with the
nutrient or food studied. However, most Americans need to improve some aspect of their diet.
Social factors thought to influence diet include:
Knowledge and attitudes
Skills
Social support
Societal and cultural norms
Food and agricultural policies
Food assistance programs
Economic price systems
Physical Determinants of Diet. Access to and availability of healthier foods can help people follow healthful
diets. For example, better access to retail venues that sell healthier options may have a positive impact on a
person’s diet; these venues may be less available in low-income or rural neighborhoods.
The places where people eat appear to influence their diet. For example, foods eaten away from home often
have more calories and are of lower nutritional quality than foods prepared at home.
Marketing also influences people’s—particularly children’s—food choices.
– Healthy People 2020 (www.healthypeople.gov)

70
Fruit & Vegetable Consumption
A total of 42.0% of Total Service Area respondents report that their child eats five
or more servings of fruits and/or vegetables per day.
Comparable to the US response.
42.0%46.4%
0%
20%
40%
60%
80%
100%
Total Service Area United States
Child Has Five or More Servings of Fruits/Vegetables per Day( Among Parents of Children Age 2-17)
Sources: ● 2013 PRC Child & Adolescent Health Survey, Professional Research Consultants, Inc. [Item 158]
● 2012 PRC National Child & Adolescent Health Survey, Professional Research Consultants, Inc.
Notes: ● Asked of all respondents about a randomly-selected child in the household.
Very young children are reported to be more likely to get the recommended daily
servings of fruits and vegetables.
Child Has Five or More Servings of Fruits/Vegetables per Day(Among Parents of Children Age 2-17; Total Service Area, 2013)
Sources: ● 2013 PRC Child & Adolescent Health Survey, Professional Research Consultants, Inc. [Item 158]
Notes: ● Asked of all respondents about a randomly-selected child in the household.
● Hispanics can be of any race. Other race categories are non-Hispanic categorizations (e.g., “Black” reflects non-Hispanic Black respondents).
● Income categories reflect respondent's household income as a ratio to the federal poverty level (FPL) for their household size. “Low Income” includes households
with incomes up to 200% of the federal poverty level; “Mid/High Income” includes households with incomes at 200% or more of the federal poverty level.
41.9% 42.1%
61.2%
36.9%40.6% 40.9% 41.3% 41.4%
44.9%42.0%
0%
20%
40%
60%
80%
100%
Boy Girl Age
2 to 4
Age
5 to 12
Age
13 to 17
Low
Income
Mid/High
Income
Black Non-Black TSA
To measure fruit and
vegetable consumption,
survey respondents were
asked multiple questions,
specifically about the foods
their child consumes on a
typical day.

71
Fast Food
A total of 26.6% of survey respondents report that their child (age 2-17) had no
“fast food” meals in the past week.
Number of Fast Food Meals for Child in the Past Week(Among Parents of Children Age 2-17; Total Service Area, 2013)
Sources: ● 2013 PRC Child & Adolescent Health Survey, Professional Research Consultants, Inc. [Item 120]
Notes: ● Asked of respondents for whom the randomly selected child in the household is between the ages of 2 and 17.
None 26.6%
One 22.6%Two 22.9%
Three/More 27.9%
However, over one in four (27.9%) acknowledge that their child had three or more
meals from “fast food” restaurants in the past week.
Higher than national findings.
27.9%
21.5%
0%
20%
40%
60%
80%
100%
Total Service Area United States
Child Had Three or More Fast Food Meals in the Past Week(Among Parents of Children Age 2-17)
Sources: ● 2013 PRC Child & Adolescent Health Survey, Professional Research Consultants, Inc. [Item 120]
● 2012 PRC National Child & Adolescent Health Survey, Professional Research Consultants, Inc.
Notes: ● Asked of respondents for whom the randomly selected child in the household is between the ages of 2 and 17.
The prevalence does not vary significantly by demographics in the Total Service
Area.
“In the past 7 days, how
many meals would you say
this child has eaten from ‘fast
food’ restaurants? Please
include breakfasts, lunches
and dinner.”

72
Child Had Three or More Fast Food Meals in the Past Week(Among Parents of Children Age 2-17; Total Service Area, 2013)
Sources: ● 2013 PRC Child & Adolescent Health Survey, Professional Research Consultants, Inc. [Item 120]
Notes: ● Asked of respondents for whom the randomly selected child in the household is between the ages of 2 and 17.
● Hispanics can be of any race. Other race categories are non-Hispanic categorizations (e.g., “Black” reflects non-Hispanic Black respondents).
● Income categories reflect respondent's household income as a ratio to the federal poverty level (FPL) for their household size. “Low Income” includes households
with incomes up to 200% of the federal poverty level; “Mid/High Income” includes households with incomes at 200% or more of the federal poverty level.
28.2% 27.4% 26.4% 24.4%
33.4%
24.5%
31.1% 29.8%
22.6%27.9%
0%
20%
40%
60%
80%
100%
Boy Girl Age
2 to 4
Age
5 to 12
Age
13 to 17
Low
Income
Mid/High
Income
Black Non-Black TSA
Breastfeeding & Breast Milk
A total of 64.8% of Total Service Area children (age 0 to 17) were ever breastfed or
fed using breast milk (regardless of duration).
Similar to national findings.
Fails to satisfy the Healthy People 2020 objective (81.9% or higher).
64.8%69.8%
0%
20%
40%
60%
80%
100%
Total Service Area United States
Healthy People 2020 Target = 81.9% or Higher
Child Was Ever Breastfed/Fed Breast Milk as an Infant (Total Service Area, 2013)
Sources: ● 2013 PRC Child & Adolescent Health Survey, Professional Research Consultants, Inc. [Item 125]
● 2012 PRC National Child & Adolescent Health Survey, Professional Research Consultants, Inc.
● US Department of Health and Human Services. Healthy People 2020. December 2010. http://www.healthypeople.gov [Objective MICH-2.1]
Notes: ● Asked of all respondents.
Breastfeeding is more common in the Total Service Area among upper-income
households, Non-Blacks, and households with younger children.
“For the next question, I
would like you to think back
to when this child was an
infant. As best you can recall,
was this child ever breast-fed
or fed using breast milk?”

73
Child Was Ever Breastfed/Fed Breast Milk as an Infant(Total Service Area, 2013)
Sources: ● 2013 PRC Child & Adolescent Health Survey, Professional Research Consultants, Inc. [Item 125]
● US Department of Health and Human Services. Healthy People 2020. December 2010. http://www.healthypeople.gov [Objective MICH-2.1]
Notes: ● Asked of all respondents.
● Hispanics can be of any race. Other race categories are non-Hispanic categorizations (e.g., “Black” reflects non-Hispanic Black respondents).
● Income categories reflect respondent's household income as a ratio to the federal poverty level (FPL) for their household size. “Low Income” includes households
with incomes up to 200% of the federal poverty level; “Mid/High Income” includes households with incomes at 200% or more of the federal poverty level.
64.6% 64.9%
83.1%
64.3%
54.8%52.4%
76.6%
61.6%
75.6%
64.8%
0%
20%
40%
60%
80%
100%
Boy Girl Age
0 to 4
Age
5 to 12
Age
13 to 17
Low
Income
Mid/High
Income
Black Non-Black TSA
Healthy People 2020 Target = 81.9% or Higher
Among parents with children under age six, 29.6% report that their child was first fed
something other than breast milk or formula when they were three months of age or
younger. In contrast, 4.3% of these parents waited until the child was 13 months or older.
Age At Which Child Was First Fed
Something Other Than Breast Milk or Formula(Among Parents of Children Age 0-5; Total Service Area, 2013)
Sources: ● 2013 PRC Child & Adolescent Health Survey, Professional Research Consultants, Inc. [Item 120]
Notes: ● Asked of respondents for whom the randomly selected child in the household is under 6.
Less Than 1 Month
10.7%
1 to 3 Months 18.9%
4 to 6 Months 33.2%
7 to 9 Months 14.2%
10 to 12 Months
18.7%
13+ Months 4.3%

74
Physical Activity
Recommended Physical Activity
Children and adolescents should do 60 minutes (1 hour) or more of physical activity each day.
— Centers for Disease Control & Prevention (CDC)
Among children age 2-17 in the Total Service Area, 37.1% are reported to have had
one hour of physical activity on each of the seven days preceding the interview.
Number of Days in the Past Week on
Which Child Was Active for One Hour or Longer(Among Parents of Children 2-17; Total Service Area, 2013)
Sources: ● 2013 PRC Child & Adolescent Health Survey, Professional Research Consultants, Inc. [Item 117]
Notes: ● Asked of respondents for whom the randomly selected child in the household is between the ages of 2 and 17.
None 10.8%
One 3.3%
Two 8.0%
Three 17.1%Four 7.0%
Five 12.0%
Six 4.8%
Seven 37.1%
Much lower than the national prevalence.
37.1%
57.3%
0%
20%
40%
60%
80%
100%
Total Service Area United States
Child Was Physically Active for
One Hour or Longer on Every Day of the Past Week(Among Parents of Children Age 2-17; Total Service Area, 2013)
Sources: ● 2013 PRC Child & Adolescent Health Survey, Professional Research Consultants, Inc. [Item 117]
● 2012 PRC National Child & Adolescent Health Survey, Professional Research Consultants, Inc.
Notes: ● Asked of respondents for whom the randomly selected child in the household is between the ages of 2 and 17.
“The next questions are about
physical activity.
During the past 7 days, on
how many days was the child
physically active for a total of
at least 60 minutes per day?”

75
Lower levels of physical activity in the Total Service Area are found among
children age 5 and older and those in upper-income households.
Note that the Total Service Area proportion among adolescents age 13-17
currently satisfies the related Healthy People 2020 objective.
Child Was Physically Active for
One Hour or Longer on Every Day of the Past Week (Among Parents of Children Age 2-17; Total Service Area, 2013)
Sources: ● 2013 PRC Child & Adolescent Health Survey, Professional Research Consultants, Inc. [Item 117]
● US Department of Health and Human Services. Healthy People 2020. December 2010. http://www.healthypeople.gov [Objective PA-3.1]
Notes: ● Asked of respondents for whom the randomly selected child in the household is between the ages of 2 and 17.
● Hispanics can be of any race. Other race categories are non-Hispanic categorizations (e.g., “Black” reflects non-Hispanic Black respondents).
● Income categories reflect respondent's household income as a ratio to the federal poverty level (FPL) for their household size. “Low Income” includes households
with incomes up to 200% of the federal poverty level; “Mid/High Income” includes households with incomes at 200% or more of the federal poverty level.
38.6%35.5%
69.5%
32.5%28.6%
46.3%
24.0%
38.7%
28.3%
37.1%
0%
20%
40%
60%
80%
100%
Boy Girl Age
2 to 4
Age
5 to 12
Age
13 to 17
Low
Income
Mid/High
Income
Black Non-Black TSA
Healthy People 2020 Objective PA-3.1: Increase the
proportion of adolescents who meet current Federal physical
activity guidelines for aerobic physical activity (physically
active for a total of at least 60 minutes per day on seven of the past seven days) to 20.2% or higher.
Physical Activity Frequency & Duration
Note:
The term “moderate physical activity” includes 30 minutes of activity that does not make a child breathe
hard, such as fast walking, slow bicycling, skating, or pushing a lawn mower.
The term “vigorous physical activity,” includes exercise for 20 minutes that makes a child breathe hard,
such as basketball, soccer, running, swimming laps, fast bicycling, fast dancing, or similar aerobic activities).
A total of 34.5% of area children age 2-17 participated in “moderate activity” (for at
least 30 minutes at a time) on five or more of the preceding seven days.
Worse than the national figure.
A total of 56.4% of area children age 2-17 participated in “vigorous activity” (for at
least 20 minutes at a time) on three or more of the preceding seven days.
Worse than national findings.

76
34.5%
56.0%
0%
20%
40%
60%
80%
100%
Total Service Area United States
Moderate-Intensity Physical Activity on
Five or More Days in the Past Week for
at Least 30 Minutes at a Time
Children’s Physical Activity(Among Parents of Children Age 2-17; Total Service Area, 2013)
Sources: ● 2013 PRC Child & Adolescent Health Survey, Professional Research Consultants, Inc. [Item 164-165]
● 2012 PRC National Child & Adolescent Health Survey, Professional Research Consultants, Inc.
Notes: ● Asked of respondents for whom the randomly selected child in the household is between the ages of 2 and 17.
● Moderate-intensity physical activity includes exercise which does not make the child breathe hard, such as fast walking, slow bicycling, skating or pushing a lawnmower.
● Vigorous-intensity physical activity includes exercise which causes the child to breathe hard such as basketball, soccer, running, swimming laps, fast bicycling, fast
dancing, or similar aerobic activities.
56.4%
72.2%
0%
20%
40%
60%
80%
100%
Total Service Area United States
Vigorous-Intensity Physical Activity on
Three or More Days in the Past Week for
at Least 20 Minutes at a Time
Those less likely to participate in regular, sustained vigorous physical activity include:
Children in upper-income households.
Non-Black children.
Child Engaged in Vigorous Physical Activity on Three or
More Days in the Past Week for at Least 20 Minutes at a Time (Among Parents of Children Age 2-17; Total Service Area, 2013)
Sources: ● 2013 PRC Child & Adolescent Health Survey, Professional Research Consultants, Inc. [Item 165]
Notes: ● Asked of respondents for whom the randomly selected child in the household is between the ages of 2 and 17.
● Vigorous-intensity physical activity includes exercise which causes the child to breathe hard such as basketball, soccer, running, swimming laps, fast bicycling, fast
dancing, or similar aerobic activities.
● Hispanics can be of any race. Other race categories are non-Hispanic categorizations (e.g., “Black” reflects non-Hispanic Black respondents).
● Income categories reflect respondent's household income as a ratio to the federal poverty level (FPL) for their household size. “Low Income” includes households
with incomes up to 200% of the federal poverty level; “Mid/High Income” includes households with incomes at 200% or more of the federal poverty level.
60.4%
52.4%
61.8%
52.8%
59.2% 61.0%
50.2%
59.4%
44.9%
56.4%
0%
20%
40%
60%
80%
100%
Boy Girl Age
2 to 4
Age
5 to 12
Age
13 to 17
Low
Income
Mid/High
Income
Black Non-Black TSA

77
Screen Time
Television Watching & Other Screen Time
Among children aged 5 through 17, 36.9% are reported to watch three or more
hours of television per day.
A total of 19.0% are reported to spend three or more hours on other types of screen
time for entertainment (video games, Internet, etc.).
Each is similar to the corresponding US prevalence.
Television and Other Screen Time(Among Parents of Children Age 5-17; Total Service Area, 2013)
Sources: ● 2013 PRC Child & Adolescent Health Survey, Professional Research Consultants, Inc. [Items 113, 115, 141-142]
● 2012 PRC National Child & Adolescent Health Survey, Professional Research Consultants, Inc.
Notes: ● Asked of all respondents with children age 5-17.
None
12.4% Less Than
1 Hour
6.6%
1 Hour
14.0%
2 Hours
30.1%
3+ Hours
36.9%
Hours of Television
Viewing on a Typical Day
None
27.4%
Less Than
1 Hour
17.2%1 Hour
25.2%
2 Hours
11.2%
3+ Hours
19.0%
Hours of Other
Screen Time on a Typical Day
Total Screen Time
Further, 54.3% of children aged 5 to 17 spend three or more hours on screen time
(whether television or computer, Internet, video games, etc.) per day.
Nearly identical to national findings.
54.3% 54.7%
0%
20%
40%
60%
80%
100%
Total Service Area United States
Child Has Three or More Hours of Total Screen Time
(TV, Computer, Video Games, Etc.) on a Typical Day(Among Parents of Children Age 5-17; Total Service Area, 2013)
Sources: ● 2013 PRC Child & Adolescent Health Survey, Professional Research Consultants, Inc. [Item 143]
● 2012 PRC National Child & Adolescent Health Survey, Professional Research Consultants, Inc.
Notes: ● Asked of all respondents with children age 5-17.
● Include time spent watching TV, watching videos, playing video games on the TV, playing computer video games, visiting social media sites, and surfing the internet for
entertainment.

78
These children (age 5-17) are more likely to spend three or more hours of total screen
time on a typical day:
Girls, teens, and low-income children.
Child Has Three or More Hours of Total Screen Time
(TV, Computer, Video Games, Etc.) on a Typical Day (Among Parents of Children Age 5-17; Total Service Area, 2013)
Sources: ● 2013 PRC Child & Adolescent Health Survey, Professional Research Consultants, Inc. [Item 143]
Notes: ● Asked of all respondents with children age 5-17.
● Include time spent watching TV, watching videos, playing video games on the TV, playing computer video games, visiting social media sites, and surfing the internet for
entertainment.
● Hispanics can be of any race. Other race categories are non-Hispanic categorizations (e.g., “Black” reflects non-Hispanic Black respondents).
● Income categories reflect respondent's household income as a ratio to the federal poverty level (FPL) for their household size. “Low Income” includes households
with incomes up to 200% of the federal poverty level; “Mid/High Income” includes households with incomes at 200% or more of the federal poverty level.
49.1%
59.3%
45.2%
66.6%62.0%
45.4%
56.8%
45.8%
54.3%
0%
20%
40%
60%
80%
100%
Boy Girl Age
5 to 12
Age
13 to 17
Low
Income
Mid/High
Income
Black Non-Black TSA
Media in Children’s Bedrooms
A total of 58.1% of Total Service Area school-age children (5-17) currently have a
television in their bedroom.
Higher than national findings.
A total of 39.0% have a computer in their bedroom, including any laptops or tablets
that the child may use there.
Higher than national findings.
58.1%
39.0%
45.9%
25.6%
0%
20%
40%
60%
80%
100%
Television Computer
Total Service Area United States
Child Has a Television or Computer in His/Her Bedroom(Among Parents of Children Age 5-17; Total Service Area, 2013)
Sources: ● 2013 PRC Child & Adolescent Health Survey, Professional Research Consultants, Inc. [Items 114, 116]
● 2012 PRC National Child & Adolescent Health Survey, Professional Research Consultants, Inc.
Notes: ● Asked of all respondents with children age 5-17.
● Includes televisions, computers, as well as any laptops or tablets that the child may use in his/her bedroom.

79
Children (age 5-17) more likely to have a television in the bedroom include girls
and Black children in the Total Service Area.
Teens, those from upper-income households, and Black children are more likely
to have a computer in the bedroom.
Child Has a Television or Computer in His/Her Bedroom(Among Parents of Children Age 5-17; Total Service Area, 2013)
Sources: ● 2013 PRC Child & Adolescent Health Survey, Professional Research Consultants, Inc. [Items 114, 116]
Notes: ● Asked of all respondents with children age 5-17.
● Includes televisions, computers, as well as any laptops or tablets that the child may use in his/her bedroom.
● Hispanics can be of any race. Other race categories are non-Hispanic categorizations (e.g., “Black” reflects non-Hispanic Black respondents).
● Income categories reflect respondent's household income as a ratio to the federal poverty level (FPL) for their household size. “Low Income” includes households
with incomes up to 200% of the federal poverty level; “Mid/High Income” includes households with incomes at 200% or more of the federal poverty level.
52
.9% 6
3.6
%
56
.7%
60
.2%
63
.3%
53
.4%
68
.4%
18
.1%
58
.1%
37
.5%
40
.0%
32
.9%
46
.8%
29
.5%
51
.5%
42
.8%
25
.2%
39
.0%
0%
20%
40%
60%
80%
100%
Boy Girl Age
5 to 12
Age
13 to 17
Low
Income
Mid/High
Income
Black Non-Black TSA
Television Computer

80
Body Weight
Childhood Overweight & Obesity
In children and teens, body mass index (BMI) is used to assess weight status – underweight, healthy weight,
overweight, or obese. After BMI is calculated for children and teens, the BMI number is plotted on the CDC
BMI-for-age growth charts (for either girls or boys) to obtain a percentile ranking. Percentiles are the most
commonly used indicator to assess the size and growth patterns of individual children in the United States.
The percentile indicates the relative position of the child's BMI number among children of the same sex and
age.
BMI-for-age weight status categories and the corresponding percentiles are shown below:
Underweight <5th percentile
Healthy Weight ≥5th and <85th percentile
Overweight ≥85th and <95th percentile
Obese ≥95th percentile
– Centers for Disease Control and Prevention
Based on the heights/weights reported by surveyed parents, 40.1% of Total Service
Area children age 5 to 17 are overweight or obese (≥85th percentile).
Worse than national findings.
Percent of Children Who Are Overweight or Obese(Ages 5-17 With a BMI in the 85th Percentile or Higher)
Sources: ● 2013 PRC Child & Adolescent Health Survey, Professional Research Consultants, Inc. [Item 145]
● 2012 PRC National Child & Adolescent Health Survey, Professional Research Consultants, Inc.
Notes: ● Asked of respondents for whom the randomly selected child in the household is between the ages of 5 and 17.
● Overweight among children is determined by child’s Body Mass Index status at or above the 85th percentile of US growth charts by gender and age.
40.1%
30.7%
0%
20%
40%
60%
80%
100%
Total Service Area United States
Note that weight status could not be determined for 35.8% of children age 5-17 because
respondents were unable to provide their child’s height and/or weight; these children are
therefore not represented in these charts and data.
To determine children’s weight
status, respondents were asked
the height and weight of the
randomly selected child in the
household. From these, PRC
calculated a body mass index
(BMI) value that could be
compared to BMI-for-age
growth charts.

81
Overweight is notably higher among:
Children age 5 to 12.
Percent of Children Who Are Overweight or Obese (Ages 5-17 With a BMI in the 85th Percentile or Higher)
Sources: ● 2013 PRC Child & Adolescent Health Survey, Professional Research Consultants, Inc. [Item 145]
Notes: ● Asked of respondents for whom the randomly selected child in the household is between the ages of 5 and 17.
● Overweight among children is determined by child’s Body Mass Index status at or above the 85th percentile of US growth charts by gender and age.
38.1%42.5%
50.0%
28.8%
39.3%42.0% 40.4% 40.9% 40.1%
0%
20%
40%
60%
80%
100%
Boy Girl Age
5 to 12
Age
13 to 17
Low
Income
Mid/High
Income
Black Non-Black TSA
A total of 23.8% of Total Service Area children age 5 to 17 are obese (≥95th
percentile, also included in the overweight/obese findings reported previously).
Comparable to national findings.
Fails to satisfy the Healthy People target (14.6% or lower).
Percent of Children Who Are Obese (Ages 5-17 With a BMI in the 95th Percentile or Higher)
Sources: ● 2013 PRC Child & Adolescent Health Survey, Professional Research Consultants, Inc. [Item 145]
● 2012 PRC National Child & Adolescent Health Survey, Professional Research Consultants, Inc.
● US Department of Health and Human Services. Healthy People 2020. December 2010. http://www.healthypeople.gov [Objective NWS-10.4]
Notes: ● Asked of respondents for whom the randomly selected child in the household is between the ages of 5 and 17.
● Obesity among children is determined by child’s Body Mass Index status equal to or above the 95th percentile of US growth charts by gender and age.
23.8%18.0%
0%
20%
40%
60%
80%
100%
Total Service Area United States
Healthy People 2020 Target = 14.6% or Lower
Obesity is notably high among young children (age 5-12).

82
Percent of Children Who Are Obese (Ages 5-17 With a BMI in the 95th Percentile or Higher)
Sources: ● 2013 PRC Child & Adolescent Health Survey, Professional Research Consultants, Inc. [Item 145]
● US Department of Health and Human Services. Healthy People 2020. December 2010. http://www.healthypeople.gov [Objective NWS-10.4]
Notes: ● Asked of respondents for whom the randomly selected child in the household is between the ages of 5 and 17.
● Obesity among children is determined by child’s Body Mass Index status equal to or above the 95th percentile of US growth charts by gender and age.
24.5% 23.3%
29.8%
17.0%
23.5% 23.7% 25.5%
18.0%23.8%
0%
20%
40%
60%
80%
100%
Boy Girl Age
5 to 12
Age
13 to 17
Low
Income
Mid/High
Income
Black Non-Black TSA
Healthy People 2020 Target = 14.6% or Lower
Perceptions of Overweight
Parents of overweight/obese children are often inclined to see their child as being
at “about the right weight.”
This includes 60.6% of parents with overweight (not obese) children and 52.4% of
parents with obese children.
Only 12.9% perceive their obese child to be “very overweight.”
4.8%
60.6%
32.1%
2.5%0.0%
52.4%
34.7%
12.9%
0%
20%
40%
60%
80%
100%
Parent Perceives Child as
"Very/Somewhat Underweight"
Parent Perceives Child as
"About the Right Weight"
Parent Perceives Child as
"Somewhat Overweight"
Parent Perceives Child as
"Very Overweight"
Among Children Overweight But Not Obese (Based on BMI 85th-94th Percentile)
Among Obese Children (Based on BMI 95th Percentile)
Children’s Actual vs. Perceived Weight Status(Overweight/Obese Children Age 5-17; Total Service Area, 2013)
Sources: ● 2013 PRC Child & Adolescent Health Survey, Professional Research Consultants, Inc. [Item 123]
Notes: ● Asked of respondents for whom the randomly selected child in the household is between the ages of 5 and 17.
● Overweight in children is defined as a Body Mass Index (BMI) value at or above the 85th percentile of US growth charts by gender and age;
obesity in children is defined as a BMI value at or above the 95th percentile.
Note in following chart that only 18.7% of parents with an overweight/not obese
school-age child have had a health professional or someone at their child's
school tell them that their child is overweight.
Among parents with obese children, this percentage is 32.9%.
Respondents were
further asked:
“Would you describe this child's
weight as: very underweight,
somewhat underweight,
about the right weight,
somewhat overweight,
or very overweight?”
“In the past 12 months, has a
health professional or
someone at your child’s
school told you that this child
was overweight?”

83
18.7%
32.9%
0%
20%
40%
60%
80%
100%
Among Total Service Area Parents of
Overweight/Not Obese Children (Based on BMI)
Among Total Service Area Parents of
Obese Children (Based on BMI)
Parent Has Been Told in the Past Year by a School
or Health Professional That Their Child Is Overweight (Overweight/Obese Children Age 5-17; Total Service Area, 2013)
Sources: ● 2012 PRC Community Health Survey, Professional Research Consultants, Inc. [Item 124]
Notes: ● Asked of respondents for whom the randomly selected child in the household is between the ages of 5 and 17.
● Overweight in children is defined as a Body Mass Index (BMI) value at or above the 85th percentile of US growth charts by gender and age;
obesity in children is defined as a BMI value at or above the 95th percentile.

84
Tobacco
There is no risk-free level of exposure to secondhand smoke. Secondhand smoke causes heart disease and
lung cancer in adults and a number of health problems in infants and children, including: severe asthma
attacks; respiratory infections; ear infections; and sudden infant death syndrome (SIDS).
– Healthy People 2020 (www.healthypeople.gov)
Exposure to Environmental Tobacco Smoke
A total of 14.7% of Total Service Area parents report that a member of their
household smokes inside the home.
Three times the national figure.
Smoking inside the home is statistically higher among:
Female respondents.
Lower-income households.
Blacks.
Someone Smokes Inside the House(By Adult Demographics; Total Service Area, 2013)
Sources: ● 2013 PRC Child & Adolescent Health Survey, Professional Research Consultants, Inc. [Item 111]
● 2012 PRC National Child & Adolescent Health Survey, Professional Research Consultants, Inc.
Notes: ● Asked of all respondents.
● Hispanics can be of any race. Other race categories are non-Hispanic categorizations (e.g., “Black” reflects non-Hispanic Black respondents).
● Income categories reflect respondent's household income as a ratio to the federal poverty level (FPL) for their household size. “Low Income” includes households
with incomes up to 200% of the federal poverty level; “Mid/High Income” includes households with incomes at 200% or more of the federal poverty level.
6.5%
16.7% 17.8%
11.5%
20.2% 20.1%
10.6%
16.5%
8.6%
14.7%
4.8%
0%
20%
40%
60%
80%
100%
Men Women 18 to 34 35 to 49 50+ Low
Income
Mid/High
Income
Black Non-Black TSA US
Further, 27.4% of Total Service Area parents report that a member of their
household smokes outside the home.
Similar to national findings.
Smoking outside the home is notably higher among:
Young adult respondents (age 18 to 34).
Adults age 50+.

85
Lower-income households.
Blacks.
Someone Smokes Outside the House(By Adult Demographics; Total Service Area, 2013)
Sources: ● 2013 PRC Child & Adolescent Health Survey, Professional Research Consultants, Inc. [Item 111]
● 2012 PRC National Child & Adolescent Health Survey, Professional Research Consultants, Inc.
Notes: ● Asked of all respondents.
● Hispanics can be of any race. Other race categories are non-Hispanic categorizations (e.g., “Black” reflects non-Hispanic Black respondents).
● Income categories reflect respondent's household income as a ratio to the federal poverty level (FPL) for their household size. “Low Income” includes households
with incomes up to 200% of the federal poverty level; “Mid/High Income” includes households with incomes at 200% or more of the federal poverty level.
29.8%26.8%
32.4%
22.1%
35.8%38.2%
16.9%
30.4%
19.4%
27.4%23.5%
0%
20%
40%
60%
80%
100%
Men Women 18 to 34 35 to 49 50+ Low
Income
Mid/High
Income
Black Non-Black TSA US

86
Injury & Safety
Injuries
Injuries and violence are widespread in society. Both unintentional injuries and those caused by acts of
violence are among the top 15 killers for Americans of all ages. Many people accept them as “accidents,” “acts
of fate,” or as “part of life.” However, most events resulting in injury, disability, or death are predictable and
preventable.
Injuries are the leading cause of death for Americans ages 1 to 44, and a leading cause of disability for all
ages, regardless of sex, race/ethnicity, or socioeconomic status. More than 180,000 people die from injuries
each year, and approximately 1 in 10 sustains a nonfatal injury serious enough to be treated in a hospital
emergency department.
Beyond their immediate health consequences, injuries and violence have a significant impact on the well-
being of Americans by contributing to:
Premature death
Disability
Poor mental health
High medical costs
Lost productivity
The effects of injuries and violence extend beyond the injured person or victim of violence to family members,
friends, coworkers, employers, and communities.
Numerous factors can affect the risk of unintentional injury and violence, including individual behaviors,
physical environment, access to health services (ranging from pre-hospital and acute care to rehabilitation),
and social environment (from parental monitoring and supervision of youth to peer group associations,
neighborhoods, and communities).
Interventions addressing these social and physical factors have the potential to prevent unintentional injuries
and violence. Efforts to prevent unintentional injury may focus on:
Modifications of the environment
Improvements in product safety
Legislation and enforcement
Education and behavior change
Technology and engineering
Efforts to prevent violence may focus on:
Changing social norms about the acceptability of violence
Improving problem-solving skills (for example, parenting, conflict resolution, coping)
Changing policies to address the social and economic conditions that often give rise to violence
– Healthy People 2020 (www.healthypeople.gov)
See also Leading
Causes of Child
Deaths in the Child &
Adolescent Mortality
section of this report.

87
A total of 8.0% of Total Service Area parents report that their child was injured
seriously enough to need medical treatment at some point in the past year.
Similar to national findings.
Of these children, 11.8% sustained at least two injuries which were serious
enough to require medical treatment in the past year.
8.0%11.3%
0%
20%
40%
60%
80%
100%
Total Service Area United States
Child Was Injured Seriously Enough
to Need Medical Treatment in the Past Year
Sources: ● 2013 PRC Child & Adolescent Health Survey, Professional Research Consultants, Inc. [Item 71-72]
● 2012 PRC National Child & Adolescent Health Survey, Professional Research Consultants, Inc.
Notes: ● Asked of all respondents.
# of Times:
1 88.2%2 11.8%
The prevalence of serious injury among Total Service Area children is highest among:
The Black population.
Child Was Injured Seriously Enough
to Need Medical Treatment in the Past Year(Total Service Area, 2013)
Sources: ● 2013 PRC Child & Adolescent Health Survey, Professional Research Consultants, Inc. [Item 71]
Notes: ● Asked of all respondents.
● Hispanics can be of any race. Other race categories are non-Hispanic categorizations (e.g., “Black” reflects non-Hispanic Black respondents).
● Income categories reflect respondent's household income as a ratio to the federal poverty level (FPL) for their household size. “Low Income” includes households
with incomes up to 200% of the federal poverty level; “Mid/High Income” includes households with incomes at 200% or more of the federal poverty level.
10.3%5.7% 6.7% 6.9%
10.1% 10.6%6.0%
9.4%
3.6%8.0%
0%
20%
40%
60%
80%
100%
Boy Girl Age
0 to 4
Age
5 to 12
Age
13 to 17
Low
Income
Mid/High
Income
Black Non-Black TSA
“During the past year, has this
child been injured seriously
enough to need treatment from
a doctor or a nurse?”

88
Of the area children who were seriously injured in the past year, 28.1% were playing
when the injury occurred, while 19.0% were participating in organized sports and 11.5%
were playing unorganized sports.
Other activities mentioned less often include running and vehicle accidents.
Child’s Activity When Most Seriously Injured in Past Year(Parents of Children Who Were Seriously Injured in the Past Year; TSA, 2012)
Sources: ● 2013 PRC Child & Adolescent Health Survey, Professional Research Consultants, Inc. [Item 73]
Notes: ● Asked of respondents for whom the randomly selected child in the household was seriously injured in the past year.
Playing 28.1%
Organized Sports
19.0%
Sports (Unorganized)
11.5%
Running 7.0%
Vehicle Accident 6.0%
Other (Each <3%)
28.4%
With regard to the type of injury sustained, the largest share of responses was for sprains
(mentioned by 26.6%), followed by wounds needing stitches (12.1%), hand injuries
(7.6%) and stomach issues (7.0%).
Other injuries mentioned less often include burns, broken bones, facial injuries,
knocked out teeth, head injuries, and back injuries.
Type of Injury Sustained(Children Who Were Seriously Injured in the Past Year; TSA, 2013)
Sources: ● 2013 PRC Child & Adolescent Health Survey, Professional Research Consultants, Inc. [Item 74]
Notes: ● Asked of respondents for whom the randomly selected child in the household was seriously injured in the past year.
Sprain 26.6% Other (Each <3%)
16.6%
Stitches 12.1%
Hand Injury 7.6%
Stomach Issues 7.0%Burns 6.9%Broken Bone 6.1%
Facial Injury 5.8%
Knocked Out Teeth
4.0%
Head Injury 3.7%
Back Injury 3.6%

89
When asked where they sought help for their injured child, 58.3% mentioned a hospital
or emergency room.
Other sites for medical care included family physicians (mentioned by 20.1%),
urgent care centers (11.3%) and specialists (3.7%).
Source for Help After the Injury(Children Who Were Seriously Injured in the Past Year; TSA, 2013)
Sources: ● 2013 PRC Child & Adolescent Health Survey, Professional Research Consultants, Inc. [Item 75]
Notes: ● Asked of respondents for whom the randomly selected child in the household was seriously injured in the past two years.
Hospital/ER 58.3%
Family Dr 20.1%
Urgent Care 11.3%
Specialist 3.7%
Other (Each <3%) 6.6%
Safety
School Safety
In the past year, 11.5% of school-aged Total Service Area children missed school
because they felt unsafe at school or on the way to/from school.
On the other hand, the vast majority (88.5%) of school-aged children did not miss
school in the past year because of safety concerns.
Number of School Days Missed in the
Past Month Because Child Felt Unsafe(Total Service Area School-Aged Children, 2013)
Sources: ● 2013 PRC Child & Adolescent Health Survey, Professional Research Consultants, Inc. [Item 77]
Notes: ● Asked of all respondents about a school-aged, randomly-selected child in the household.
None 88.5%
One or More 11.5%
Respondents
were asked about their
child’s sense of safety:
“During the past 30 days, on
how many days did this child
not go to school because
he/she felt unsafe at school or
on the way to or from school?”

90
More than three times the national prevalence.
11.5%
3.3%
0%
20%
40%
60%
80%
100%
Total Service Area United States
Child Missed at Least One School
Day in the Past Month Because He/She Felt Unsafe(Total Service Area Children Age 5-17, 2012)
Sources: ● 2013 PRC Child & Adolescent Health Survey, Professional Research Consultants, Inc. [Item 77]
● 2012 PRC National Child & Adolescent Health Survey, Professional Research Consultants, Inc.
Notes: ● Asked of all respondents about a randomly-selected school-aged child in the household.
Viewed by the child’s demographic characteristics, the prevalence is statistically
high among Total Service Area girls, teens, and lower-income children.
Child Missed at Least One School
Day in the Past Month Because He/She Felt Unsafe (Total Service Area Children 5-17, 2012)
Sources: ● 2013 PRC Child & Adolescent Health Survey, Professional Research Consultants, Inc. [Item 77]
Notes: ● Asked of all respondents about a randomly-selected school-aged child in the household.
● Hispanics can be of any race. Other race categories are non-Hispanic categorizations (e.g., “Black” reflects non-Hispanic Black respondents).
● Income categories reflect respondent's household income as a ratio to the federal poverty level (FPL) for their household size. “Low Income” includes households
with incomes up to 200% of the federal poverty level; “Mid/High Income” includes households with incomes at 200% or more of the federal poverty level.
8.8%14.2%
6.9%
17.0% 18.2%
3.5%
11.4% 12.7% 11.5%
0%
20%
40%
60%
80%
100%
Boy Girl Age
5 to 12
Age
13 to 17
Low
Income
Mid/High
Income
Black Non-Black TSA
Reasons for feeling unsafe included references to violence, bullying, gangs, and peer
pressure, to name a few.
Car Seats & Seat Belts
A full 92.9% of Total Service Area parents report that their child (age 0 to 17)
“always” wears a seat belt (or appropriate car seat for younger children) when
riding in a vehicle.
Lower than national findings.

91
Child “Always” Wears a Seatbelt or
Appropriate Restraint When Riding in a Vehicle(Total Service Area, 2013)
Sources: ● 2013 PRC Child & Adolescent Health Survey, Professional Research Consultants, Inc. [Item 76]
● 2012 PRC National Child & Adolescent Health Survey, Professional Research Consultants, Inc.
Notes: ● Asked of all respondents.
92.9%96.6%
0%
20%
40%
60%
80%
100%
Total Service Area United States
The prevalence does not vary significantly by child’s demographic characteristics.
Child “Always” Wears a Seatbelt or
Appropriate Restraint When Riding in a Vehicle(Total Service Area, 2013)
Sources: ● 2013 PRC Child & Adolescent Health Survey, Professional Research Consultants, Inc. [Item 76]
Notes: ● Asked of all respondents.
● Hispanics can be of any race. Other race categories are non-Hispanic categorizations (e.g., “Black” reflects non-Hispanic Black respondents).
● Income categories reflect respondent's household income as a ratio to the federal poverty level (FPL) for their household size. “Low Income” includes households
with incomes up to 200% of the federal poverty level; “Mid/High Income” includes households with incomes at 200% or more of the federal poverty level.
93.5% 92.2% 93.7% 95.0%90.0%
92.7% 94.5% 93.1% 92.3% 92.9%
0%
20%
40%
60%
80%
100%
Boy Girl Age
0 to 4
Age
5 to 12
Age
13 to 17
Low
Income
Mid/High
Income
Black Non-Black TSA
Helmet Use
Bicycles
Among Total Service Area school-age children who rode a bicycle in the past year,
29.3% “always” wore a helmet.
Much lower than the US prevalence.

92
Child “Always” Wore a Helmet
When Riding a Bicycle in the Past Year(Among Children Age 5-17 Who Rode a Bike in Past Year; Total Service Area, 2013)
Sources: ● 2013 PRC Child & Adolescent Health Survey, Professional Research Consultants, Inc. [Item 80]
● 2011 PRC National Health Survey, Professional Research Consultants, Inc.
Notes: ● Asked of respondents for whom the randomly selected child in the household is between the ages of 5 and 17 and who rode a bicycle in the past year;
excludes the 40.7% of children who did not ride a bicycle in the past year.
29.3%
44.1%
0%
20%
40%
60%
80%
100%
Total Service Area United States
Among children age 5-17, notably low among girls, teens, and those from low-
income households.
Child “Always” Wore a Helmet
When Riding a Bicycle in the Past Year(Among Children Age 5-17 Who Rode a Bike in Past Year; Total Service Area, 2013)
Sources: ● 2013 PRC Child & Adolescent Health Survey, Professional Research Consultants, Inc. [Item 80]
Notes: ● Asked of respondents for whom the randomly selected child in the household is between the ages of 5 and 17 and who rode a bicycle in the past year.
● Hispanics can be of any race. Other race categories are non-Hispanic categorizations (e.g., “Black” reflects non-Hispanic Black respondents).
● Income categories reflect respondent's household income as a ratio to the federal poverty level (FPL) for their household size. “Low Income” includes households
with incomes up to 200% of the federal poverty level; “Mid/High Income” includes households with incomes at 200% or more of the federal poverty level.
34.8%
23.5%
35.3%
19.3%22.1%
34.7%
27.4%30.8% 29.3%
0%
20%
40%
60%
80%
100%
Boy Girl Age
5 to 12
Age
13 to 17
Low
Income
Mid/High
Income
Black Non-Black TSA
Skateboards, Scooters, Skates & Rollerblades
Among Total Service Area school-age children who rode a skateboard, scooter,
skates or rollerblades in the past year, 18.7% “always” wore a helmet.
Half the national percentage.

93
Child “Always” Wore a Helmet on
Skateboards, Scooters, Skates or Rollerblades in the Past Year (Children Age 5-17 Who Engaged in These Activities in the Past Year; TSA, 2012)
Sources: ● 2013 PRC Child & Adolescent Health Survey, Professional Research Consultants, Inc. [Item 81]
Notes: ● Asked of respondents for whom the randomly selected child in the household is between the ages of 5 and 17 and who rode a skateboard, scooter, skates or rollerblades
in the past year; excludes the 52.6% of children who did not ride a skateboard, scooter, skates or rollerblades in the past year.
18.7%
37.5%
0%
20%
40%
60%
80%
100%
Total Service Area United States
Highest among boys, children age 5 to 12, and those from upper-income
households.
Child “Always” Wore a Helmet on
Skateboards, Scooters, Skates or Rollerblades in the Past Year (Children Age 5-17 Who Engaged in These Activities in the Past Year; TSA, 2012)
Sources: ● 2013 PRC Child & Adolescent Health Survey, Professional Research Consultants, Inc. [Item 81]
Notes: ● Asked of respondents for whom the randomly selected child in the household is between the ages of 5 and 17 and who rode a skateboard, scooter, skates or rollerblades
in the past year.
● Hispanics can be of any race. Other race categories are non-Hispanic categorizations (e.g., “Black” reflects non-Hispanic Black respondents).
● Income categories reflect respondent's household income as a ratio to the federal poverty level (FPL) for their household size. “Low Income” includes households
with incomes up to 200% of the federal poverty level; “Mid/High Income” includes households with incomes at 200% or more of the federal poverty level.
26.5%
9.8%
23.0%
11.9%14.3%
22.4%
16.1%19.5% 18.7%
0%
20%
40%
60%
80%
100%
Boy Girl Age
5 to 12
Age
13 to 17
Low
Income
Mid/High
Income
Black Non-Black TSA
Neighborhood Safety
Fewer than 4 in 10 Total Service Area survey respondents report that they feel
“extremely” (6.1%) or “quite” (31.0%) safe from crime and violence in their
neighborhood.
“How safe from crime
do you consider your
neighborhood to be —
would you say extremely
safe, quite safe, slightly
safe, or not at all safe?”

94
Perceptions of Neighborhood
Being Safe From Crime and Violence(Total Service Area, 2013)
Sources: ● 2013 PRC Child & Adolescent Health Survey, Professional Research Consultants, Inc. [Item 79]
Notes: ● Asked of all respondents.
Extremely Safe 6.1%
Quite Safe 31.0%
Slightly Safe 38.1%
Not At All Safe 24.8%
On the other hand, the majority of Total Service Area respondents (62.9%) feel
“slightly” or “not at all” safe in their neighborhood.
Dramatically higher than the national prevalence.
62.9%
9.1%
0%
20%
40%
60%
80%
100%
Total Service Area United States
Perceive Neighborhood as
“Slightly” or “Not At All” Safe From Crime and Violence
Sources: ● 2013 PRC Child & Adolescent Health Survey, Professional Research Consultants, Inc. [Item 79]
● 2012 PRC National Child & Adolescent Health Survey, Professional Research Consultants, Inc.
Notes: ● Asked of all respondents.
Perceptions of low neighborhood safety are more common among:
Women.
Respondents in low-income households.
Parents of Black children.

95
Perceive Neighborhood as
“Slightly” or “Not At All” Safe From Crime and Violence(By Adult Respondents’ Demographic Characteristics; Total Service Area, 2013)
Sources: ● 2013 PRC Child & Adolescent Health Survey, Professional Research Consultants, Inc. [Item 79]
Notes: ● Asked of all respondents.
● *Race represents that of the child, not the respondent. Hispanics can be of any race. Other race categories are non-Hispanic categorizations (e.g., “Black” reflects
non-Hispanic Black respondents).
● Income categories reflect respondent's household income as a ratio to the federal poverty level (FPL) for their household size. “Low Income” includes households
with incomes up to 200% of the federal poverty level; “Mid/High Income” includes households with incomes at 200% or more of the federal poverty level.
50.0%
66.0% 66.4%
60.1%
68.7%72.1%
56.6%
67.4%
48.1%
62.9%
0%
20%
40%
60%
80%
100%
Men Women 18 to 39 40 to 64 65+ Low
Income
Mid/High
Income
Black* Non-Black* TSA
Child Abuse
Between 2008 and 2010, there was an annual average child abuse offense rate of
21.9 per 1,000 children in Cook County (City of Chicago data not available).
Lower than the Illinois rate.
Reported Child Abuse Rates(2008-2010 Annual Average Offenses per 1,000 Children)
Sources: ● Illinois State Police
Notes: ● Rates are reports of child abuse per 1,000 children.
● *City of Chicago data unavailable; Cook County data is shown here.
21.9
30.0
0
10
20
30
40
50
Cook County* Illinois

96
Sexual Activity
Chlamydia
Nationally, chlamydia incidence rates are highest in the 15-24 age group, particularly among young women.
— Centers for Disease Control & Prevention (CDC)
Between 2008 and 2010, there were 884.8 diagnosed chlamydia infections (all ages)
per 100,000 population in the City of Chicago.
Nearly twice the Illinois rate.
More than twice the national rate.
Chlamydia Incidence(2008-2010 Annual Average Cases per 100,000 Population)
Sources: ● Illinois Department of Public Health.
● Centers for Disease Control and Prevention, National Center for Health Statistics.
Notes: ● Rates are annual average new cases per 100,000 population.
884.8
449.6409.8
0
500
1,000
1,500
City of Chicago Illinois United States
Births to Teen Mothers
The negative outcomes associated with unintended pregnancies are compounded for adolescents. Teen
mothers:
Are less likely to graduate from high school or attain a GED by the time they reach age 30.
Earn an average of approximately $3,500 less per year, when compared with those who delay childbearing.
Receive nearly twice as much Federal aid for nearly twice as long.
Similarly, early fatherhood is associated with lower educational attainment and lower income. Children of teen
parents are more likely to have lower cognitive attainment and exhibit more behavior problems. Sons of teen
mothers are more likely to be incarcerated, and daughters are more likely to become adolescent mothers.
– Healthy People 2020 (www.healthypeople.gov)
A total of 12.8% of 2007-2009 Total Service Area births were to teenage mothers
(under the age of 20).
Worse than the Illinois rate.
Worse than the national rate.

97
Births to Teen Mothers (Under Age 20)(Percentage of Live Births, 2007-2009)
Sources: ● Illinois Department of Public Health.
● Centers for Disease Control and Prevention, National Vital Statistics System.
Note: ● Numbers are a percentage of all live births within each population.
12.8%9.9% 10.3%
0%
20%
40%
60%
80%
100%
City of Chicago Illinois United States
Unfavorably high in the City of Chicago’s Black population.
Births to Teen Mothers(Percentage of Live Births, 2007-2009)
Sources: ● Illinois Department of Public Health.
Note: ● Numbers are a percentage of all live births within each population.
8.7%
22.2%
1.7%
12.8%
City of Chicago
Non-Hispanic White
City of Chicago
Non-Hispanic Black
City of Chicago
Other
City of Chicago
All Races/Ethnicities
0%
20%
40%
60%
80%
100%

98
ACCESS TO HEALTHCARE SERVICES

99
Health Insurance Coverage
Type of Coverage
A total of 47.3% of Total Service Area parents report having private healthcare
coverage for their child.
Another 48.4% report coverage through a government-sponsored program (e.g.,
state children’s health insurance program, Medicaid, Medicare, military benefits).
Healthcare Insurance Coverage for Child(Total Service Area, 2013)
Sources: ● 2013 PRC Child & Adolescent Health Survey, Professional Research Consultants, Inc. [Item 146]
Notes: ● Asked of all respondents.
Private Coverage 47.3%
Medicaid 32.5%
Medicare 7.2%
Medicaid & Medicare
1.2%
State-Sponsored Plan
5.2%
Other Gov't 1.9%
VA/Military 0.4%
No Insurance/
Self-Pay 4.2%
Lack of Coverage
However, 4.2% report having no coverage for their child’s healthcare expenses.
Similar to the national proportion.
The Healthy People 2020 target is universal coverage (0% uninsured).
4.2%6.8%
0%
20%
40%
60%
80%
100%
Total Service Area United States
Lack Healthcare Insurance Coverage for Child(Total Service Area, 2013)
Sources: ● 2013 PRC Child & Adolescent Health Survey, Professional Research Consultants, Inc. [Item 146]
● 2012 PRC National Child & Adolescent Health Survey, Professional Research Consultants, Inc.
● US Department of Health and Human Services. Healthy People 2020. December 2010. http://www.healthypeople.gov [Objective AHS-1]
Notes: ● Asked of all respondents.
Healthy People 2020 Target = 0.0% (Universal Coverage)
Survey respondents
were asked a series of
questions to determine their
child’s healthcare insurance
coverage, if any, from either
private or government-
sponsored sources.
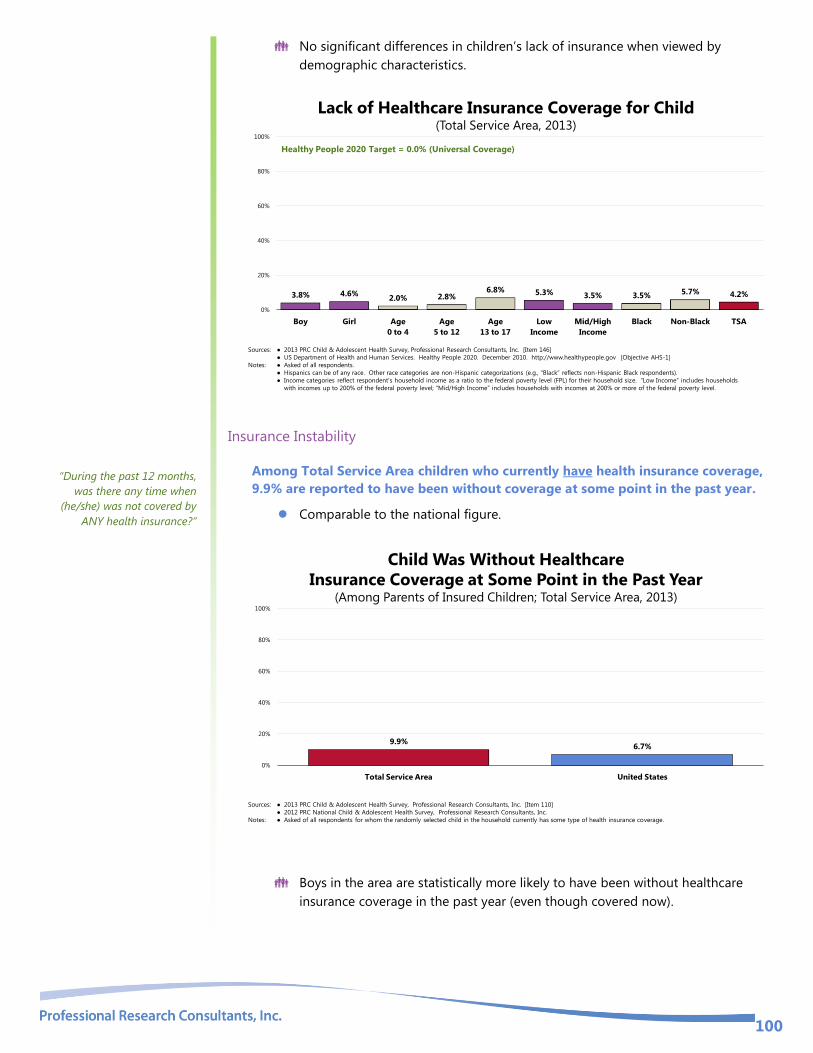
100
No significant differences in children’s lack of insurance when viewed by
demographic characteristics.
3.8% 4.6%2.0% 2.8%
6.8% 5.3% 3.5% 3.5%5.7% 4.2%
0%
20%
40%
60%
80%
100%
Boy Girl Age
0 to 4
Age
5 to 12
Age
13 to 17
Low
Income
Mid/High
Income
Black Non-Black TSA
Lack of Healthcare Insurance Coverage for Child(Total Service Area, 2013)
Sources: ● 2013 PRC Child & Adolescent Health Survey, Professional Research Consultants, Inc. [Item 146]
● US Department of Health and Human Services. Healthy People 2020. December 2010. http://www.healthypeople.gov [Objective AHS-1]
Notes: ● Asked of all respondents.
● Hispanics can be of any race. Other race categories are non-Hispanic categorizations (e.g., “Black” reflects non-Hispanic Black respondents).
● Income categories reflect respondent's household income as a ratio to the federal poverty level (FPL) for their household size. “Low Income” includes households
with incomes up to 200% of the federal poverty level; “Mid/High Income” includes households with incomes at 200% or more of the federal poverty level.
Healthy People 2020 Target = 0.0% (Universal Coverage)
Insurance Instability
Among Total Service Area children who currently have health insurance coverage,
9.9% are reported to have been without coverage at some point in the past year.
Comparable to the national figure.
Child Was Without Healthcare
Insurance Coverage at Some Point in the Past Year(Among Parents of Insured Children; Total Service Area, 2013)
Sources: ● 2013 PRC Child & Adolescent Health Survey, Professional Research Consultants, Inc. [Item 110]
● 2012 PRC National Child & Adolescent Health Survey, Professional Research Consultants, Inc.
Notes: ● Asked of all respondents for whom the randomly selected child in the household currently has some type of health insurance coverage.
9.9%6.7%
0%
20%
40%
60%
80%
100%
Total Service Area United States
Boys in the area are statistically more likely to have been without healthcare
insurance coverage in the past year (even though covered now).
“During the past 12 months,
was there any time when
(he/she) was not covered by
ANY health insurance?”

101
Child Was Without Healthcare
Insurance Coverage at Some Point in the Past Year (Among Parents of Insured Children; Total Service Area, 2013)
Sources: ● 2013 PRC Child & Adolescent Health Survey, Professional Research Consultants, Inc. [Item 110]
Notes: ● Asked of all respondents for whom the randomly selected child in the household currently has some type of health insurance coverage.
● Hispanics can be of any race. Other race categories are non-Hispanic categorizations (e.g., “Black” reflects non-Hispanic Black respondents).
● Income categories reflect respondent's household income as a ratio to the federal poverty level (FPL) for their household size. “Low Income” includes households
with incomes up to 200% of the federal poverty level; “Mid/High Income” includes households with incomes at 200% or more of the federal poverty level.
13.1%
6.8% 6.0%10.2% 11.5% 11.8%
8.9% 8.9%13.3%
9.9%
0%
20%
40%
60%
80%
100%
Boy Girl Age
0 to 4
Age
5 to 12
Age
13 to 17
Low
Income
Mid/High
Income
Black Non-Black TSA

102
Difficulties Accessing Healthcare Access to comprehensive, quality health care services is important for the achievement of health equity and
for increasing the quality of a healthy life for everyone. It impacts: overall physical, social, and mental health
status; prevention of disease and disability; detection and treatment of health conditions; quality of life;
preventable death; and life expectancy.
Access to health services means the timely use of personal health services to achieve the best health
outcomes. It requires three distinct steps: 1) Gaining entry into the health care system; 2) Accessing a health
care location where needed services are provided; and 3) Finding a health care provider with whom the
patient can communicate and trust.
– Healthy People 2020 (www.healthypeople.gov)
A total of 37.8% of Total Service Area parents report some type of difficulty or
delay in obtaining healthcare services for their child in the past year.
Worse than national findings.
Experienced Difficulties or Delays of Some Kind
in Receiving Child’s Needed Healthcare in the Past Year
Sources: ● 2013 PRC Child & Adolescent Health Survey, Professional Research Consultants, Inc. [Item 162]
Notes: ● Asked of all respondents.
● Represents the percentage of respondents experiencing one or more barriers to accessing their child’s healthcare in the past 12 months.
37.8%
30.3%
0%
20%
40%
60%
80%
100%
Total Service Area United States
Note that the following demographic groups more often report difficulties accessing their
child’s healthcare services:
Parents of children age 5 and older.
Residents in low-income households.

103
Experienced Difficulties or Delays of Some Kind
in Receiving Child’s Needed Healthcare in the Past Year(Total Service Area, 2013)
Sources: ● 2013 PRC Child & Adolescent Health Survey, Professional Research Consultants, Inc. [Item 162]
Notes: ● Asked of all respondents.
● Represents the percentage of respondents experiencing one or more barriers to accessing their child’s healthcare in the past 12 months.
● Hispanics can be of any race. Other race categories are non-Hispanic categorizations (e.g., “Black” reflects non-Hispanic Black respondents).
● Income categories reflect respondent's household income as a ratio to the federal poverty level (FPL) for their household size. “Low Income” includes households
with incomes up to 200% of the federal poverty level; “Mid/High Income” includes households with incomes at 200% or more of the federal poverty level.
37.6% 38.3%
20.6%
43.4%46.6%
50.3%
27.1%
39.4%35.5%
37.8%
0%
20%
40%
60%
80%
100%
Boy Girl Age
0 to 4
Age
5 to 12
Age
13 to 17
Low
Income
Mid/High
Income
Black Non-Black TSA
Barriers to Healthcare Access
Of the tested barriers, inconvenient office hours impacted the greatest share of
Total Service Area families (23.0% of parents say that inconvenient office hours
prevented them from taking a child for medical care in the past year).
The proportion of Total Service Area families impacted was statistically worse
than found nationally for difficulty getting an appointment, inconvenient office
hours, and cost as a barrier to children’s prescription medication.
23.0%
16.6%
10.9% 8.8% 8.1% 6.8%
15.7%11.6%
6.7% 6.8% 7.1% 8.5%
0%
20%
40%
60%
80%
100%
Inconvenient
Office Hours
Getting a
Dr Appointment
Cost
(Prescriptions)
Lack of
Transportation
Finding
a Doctor
Cost
(Doctor Visit)
Total Service Area United States
Barriers to Access Have
Prevented Medical Care in the Past Year
Sources: ● 2013 PRC Child & Adolescent Health Survey, Professional Research Consultants, Inc. [Items 13-18]
● 2012 PRC National Child & Adolescent Health Survey, Professional Research Consultants, Inc.
Notes: ● Asked of all respondents.
To better understand healthcare access
barriers, parents were asked whether
any of six types of barriers to access
prevented their child from seeing a
physician or obtaining a needed
prescription in the
past year.
These percentages reflect
the total population of children age 0-
17, regardless of whether medical care
was needed or sought.

104
Access to Specialty Care
A total of 25.0% of Total Service Area parents say that they or their child’s physician
felt at some point in the past year that their child needed to see a specialist.
Similar to national findings.
Child Has Needed to See a Specialist in the Past Year
Sources: ● 2013 PRC Child & Adolescent Health Survey, Professional Research Consultants, Inc. [Item 23]
Notes: ● Asked of all respondents.
● Represents the percentage of respondents experiencing one or more barriers to accessing their child’s healthcare in the past 12 months.
25.0% 25.5%
0%
20%
40%
60%
80%
100%
Total Service Area United States
Note that the prevalence of children needing to see specialists increases with age
in the Total Service Area.
Child Has Needed to See a Specialist in the Past Year(Total Service Area, 2013)
Sources: ● 2013 PRC Child & Adolescent Health Survey, Professional Research Consultants, Inc. [Item 23]
Notes: ● Asked of all respondents.
● Hispanics can be of any race. Other race categories are non-Hispanic categorizations (e.g., “Black” reflects non-Hispanic Black respondents).
● Income categories reflect respondent's household income as a ratio to the federal poverty level (FPL) for their household size. “Low Income” includes households
with incomes up to 200% of the federal poverty level; “Mid/High Income” includes households with incomes at 200% or more of the federal poverty level.
24.2% 25.8%
16.4%
26.3%30.6%
27.1%23.9% 25.0% 23.7% 25.0%
0%
20%
40%
60%
80%
100%
Boy Girl Age
0 to 4
Age
5 to 12
Age
13 to 17
Low
Income
Mid/High
Income
Black Non-Black TSA
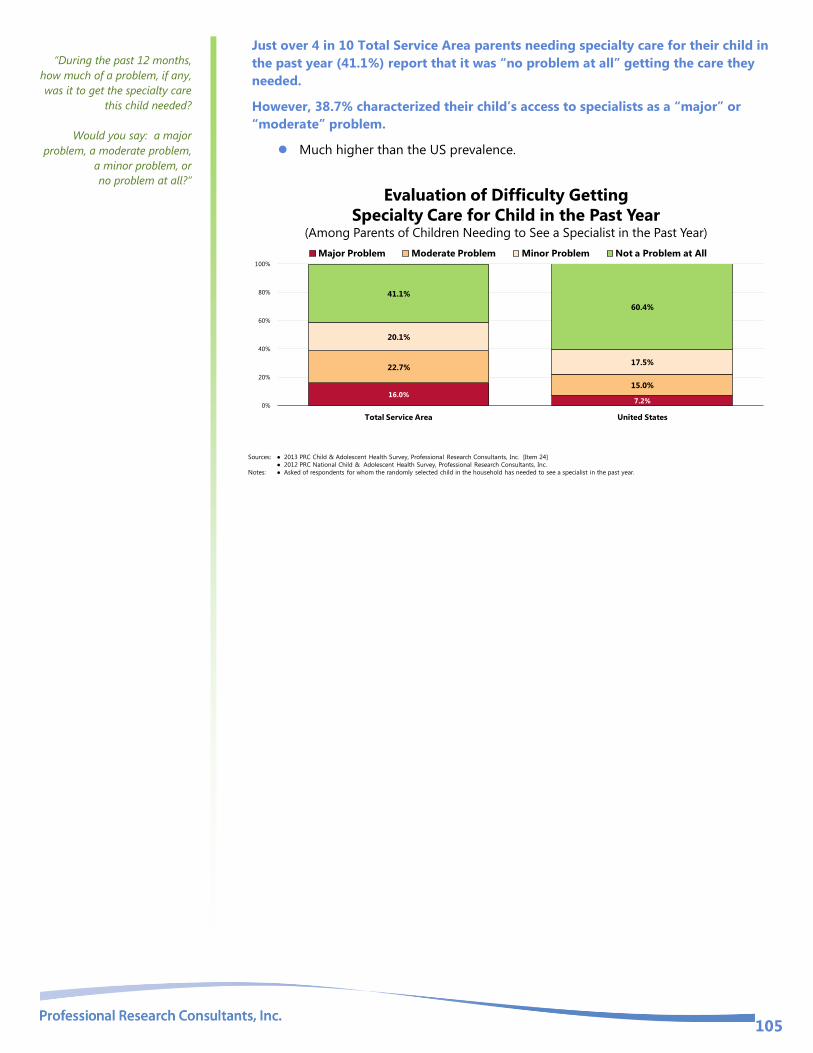
105
Just over 4 in 10 Total Service Area parents needing specialty care for their child in
the past year (41.1%) report that it was “no problem at all” getting the care they
needed.
However, 38.7% characterized their child’s access to specialists as a “major” or
“moderate” problem.
Much higher than the US prevalence.
Evaluation of Difficulty Getting
Specialty Care for Child in the Past Year(Among Parents of Children Needing to See a Specialist in the Past Year)
Sources: ● 2013 PRC Child & Adolescent Health Survey, Professional Research Consultants, Inc. [Item 24]
● 2012 PRC National Child & Adolescent Health Survey, Professional Research Consultants, Inc.
Notes: ● Asked of respondents for whom the randomly selected child in the household has needed to see a specialist in the past year.
16.0%7.2%
22.7%
15.0%
20.1%
17.5%
41.1%
60.4%
0%
20%
40%
60%
80%
100%
Total Service Area United States
Major Problem Moderate Problem Minor Problem Not a Problem at All
“During the past 12 months,
how much of a problem, if any,
was it to get the specialty care
this child needed?
Would you say: a major
problem, a moderate problem,
a minor problem, or
no problem at all?”

106
Primary Care Services Improving health care services depends in part on ensuring that people have a usual and ongoing source of
care. People with a usual source of care have better health outcomes and fewer disparities and costs. Having a
primary care provider (PCP) as the usual source of care is especially important. PCPs can develop meaningful
and sustained relationships with patients and provide integrated services while practicing in the context of
family and community. Having a usual PCP is associated with:
Greater patient trust in the provider
Good patient-provider communication
Increased likelihood that patients will receive appropriate care
Improving health care services includes increasing access to and use of evidence-based preventive services.
Clinical preventive services are services that: prevent illness by detecting early warning signs or symptoms
before they develop into a disease (primary prevention); or detect a disease at an earlier, and often more
treatable, stage (secondary prevention).
– Healthy People 2020 (www.healthypeople.gov)
Usual Source Care
Most Total Service Area children (85.2%) are determined to have a usual source of
ongoing care, such as a specific doctor’s office or clinic they regularly use.
Lower than the national prevalence.
Fails to satisfy the Healthy People 2010 objective of 100%.
Have a Usual Source for Child’s Ongoing Medical Care
Sources: ● 2013 PRC Child & Adolescent Health Survey, Professional Research Consultants, Inc. [Item 155]
● 2012 PRC National Child & Adolescent Health Survey, Professional Research Consultants, Inc.
● US Department of Health and Human Services. Healthy People 2020. December 2010. http://www.healthypeople.gov [Objective AHS-5.2]
Notes: ● Asked of all respondents.
85.2%89.6%
0%
20%
40%
60%
80%
100%
Total Service Area United States
Healthy People 2020 Target = 100%
Note that the following children are less likely to have a usual source of care:
Children age 5 and older.
Children in low-income households.

107
Have a Usual Source for Child’s Ongoing Medical Care(Total Service Area, 2013)
Sources: ● 2013 PRC Child & Adolescent Health Survey, Professional Research Consultants, Inc. [Item 155]
● 2012 PRC National Child & Adolescent Health Survey, Professional Research Consultants, Inc.
● US Department of Health and Human Services. Healthy People 2020. December 2010. http://www.healthypeople.gov [Objective AHS-5.2]
Notes: ● Asked of all respondents.
● Income categories reflect respondent's household income as a ratio to the federal poverty level (FPL) for their household size. “Low Income” includes households
with incomes up to 200% of the federal poverty level; “Mid/High Income” includes households with incomes at 200% or more of the federal poverty level.
83.0%87.5%
91.2%
82.3%86.2%
82.0%
90.5%85.4% 86.3% 85.2%
0%
20%
40%
60%
80%
100%
Boy Girl Age
0 to 4
Age
5 to 12
Age
13 to 17
Low
Income
Mid/High
Income
Black Non-Black TSA
Healthy People 2020 Target = 100%
When asked where they usually go if their child were sick or they needed advice about
his/her health, the greatest share of respondents (59.8%) identified a particular doctor’s
office.
Particular Place Utilized for Child’s Medical Care(Total Service Area, 2013)
Sources: ● 2013 PRC Child & Adolescent Health Survey, Professional Research Consultants, Inc. [Items 20-21]
Notes: ● Asked of all respondents.
Dr's Office 59.8%
Clinic 23.4%
Other 7.4%
Hospital ER 5.9%
None 3.6%
Receipt of Routine Medical Care
Most Total Service Area children (91.5%) have seen a doctor for a routine checkup,
well-child checkup, or general physical exam in the past year (not counting an exam
for a sports physical or visits for a specific injury, illness, or condition).
Better than national findings.

108
Child Has Visited a Physician
for a Routine Checkup in the Past Year(Total Service Area, 2013)
Sources: ● 2013 PRC Child & Adolescent Health Survey, Professional Research Consultants, Inc. [Item 22]
● 2012 PRC National Child & Adolescent Health Survey, Professional Research Consultants, Inc.
Notes: ● Asked of all respondents.
91.5%
82.0%
0%
20%
40%
60%
80%
100%
Total Service Area United States
Receipt of routine care decreases with age in the Total Service Area.
However, it appears that the finding among area adolescents age 13-17 satisfies
the related age-specific Healthy People 2020 objective.
Child Has Visited a Physician
for a Routine Checkup in the Past Year(Total Service Area, 2013)
Sources: ● 2013 PRC Child & Adolescent Health Survey, Professional Research Consultants, Inc. [Item 22]
● US Department of Health and Human Services. Healthy People 2020. December 2010. http://www.healthypeople.gov [Objective AH-1]
Notes: ● Asked of all respondents.
● Hispanics can be of any race. Other race categories are non-Hispanic categorizations (e.g., “Black” reflects non-Hispanic Black respondents).
● Income categories reflect respondent's household income as a ratio to the federal poverty level (FPL) for their household size. “Low Income” includes households
with incomes up to 200% of the federal poverty level; “Mid/High Income” includes households with incomes at 200% or more of the federal poverty level.
93.3%89.8%
97.3%93.6%
85.3%90.6% 91.3% 92.3%
87.4%91.5%
0%
20%
40%
60%
80%
100%
Boy Girl Age
0 to 4
Age
5 to 12
Age
13 to 17
Low
Income
Mid/High
Income
Black Non-Black TSA
Healthy People 2020 Objective AH-1:
Increase the proportion of adolescents who have had a wellness checkup in the past 12 months to 75.6% or higher.

109
Dental Care
The health of the mouth and surrounding craniofacial (skull and face) structures is central to a person’s overall
health and well-being. Oral and craniofacial diseases and conditions include: dental caries (tooth decay);
periodontal (gum) diseases; cleft lip and palate; oral and facial pain; and oral and pharyngeal (mouth and
throat) cancers.
The significant improvement in the oral health of Americans over the past 50 years is a public health success
story. Most of the gains are a result of effective prevention and treatment efforts. One major success is
community water fluoridation, which now benefits about 7 out of 10 Americans who get water through public
water systems. However, some Americans do not have access to preventive programs. People who have the
least access to preventive services and dental treatment have greater rates of oral diseases. A person’s ability
to access oral healthcare is associated with factors such as education level, income, race, and ethnicity.
Oral health is essential to overall health. Good oral health improves a person’s ability to speak, smile, smell,
taste, touch, chew, swallow, and make facial expressions to show feelings and emotions. However, oral
diseases, from cavities to oral cancer, cause pain and disability for many Americans. Good self-care, such as
brushing with fluoride toothpaste, daily flossing, and professional treatment, is key to good oral health. Health
behaviors that can lead to poor oral health include:
Tobacco use
Excessive alcohol use
Poor dietary choices
Barriers that can limit a person’s use of preventive interventions and treatments include:
Limited access to and availability of dental services
Lack of awareness of the need for care
Cost
Fear of dental procedures
There are also social determinants that affect oral health. In general, people with lower levels of education and
income, and people from specific racial/ethnic groups, have higher rates of disease. People with disabilities
and other health conditions, like diabetes, are more likely to have poor oral health.
Community water fluoridation and school-based dental sealant programs are 2 leading evidence-based
interventions to prevent tooth decay.
Major improvements have occurred in the nation’s oral health, but some challenges remain and new concerns
have emerged. One important emerging oral health issue is the increase of tooth decay in preschool children.
A recent CDC publication reported that, over the past decade, dental caries (tooth decay) in children ages 2 to
5 have increased.
Lack of access to dental care for all ages remains a public health challenge. This issue was highlighted in a
2008 Government Accountability Office (GAO) report that described difficulties in accessing dental care for
low-income children. In addition, the Institute of Medicine (IOM) has convened an expert panel to evaluate
factors that influence access to dental care.
Potential strategies to address these issues include:
Implementing and evaluating activities that have an impact on health behavior.
Promoting interventions to reduce tooth decay, such as dental sealants and fluoride use.
Evaluating and improving methods of monitoring oral diseases and conditions.
Increasing the capacity of State dental health programs to provide preventive oral health services.
Increasing the number of community health centers with an oral health component.
– Healthy People 2020 (www.healthypeople.gov)
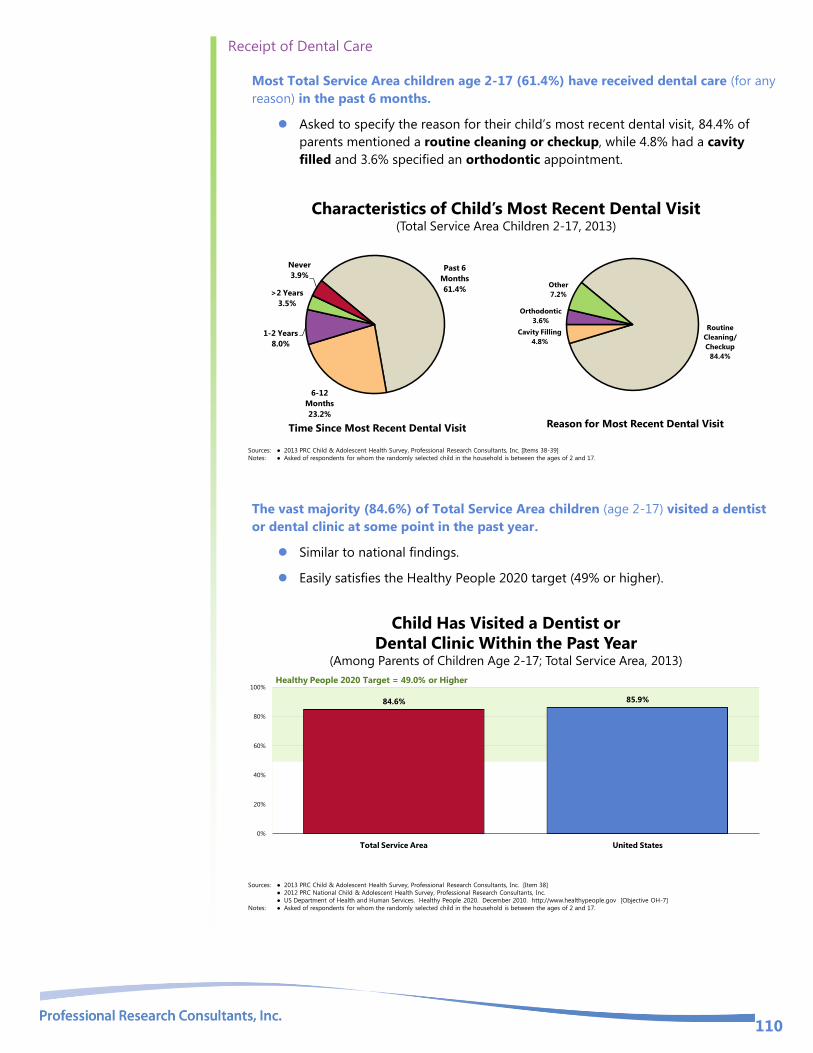
110
Receipt of Dental Care
Most Total Service Area children age 2-17 (61.4%) have received dental care (for any
reason) in the past 6 months.
Asked to specify the reason for their child’s most recent dental visit, 84.4% of
parents mentioned a routine cleaning or checkup, while 4.8% had a cavity
filled and 3.6% specified an orthodontic appointment.
Routine
Cleaning/
Checkup
84.4%
Cavity Filling
4.8%
Orthodontic
3.6%
Other
7.2%
Reason for Most Recent Dental Visit
Characteristics of Child’s Most Recent Dental Visit(Total Service Area Children 2-17, 2013)
Sources: ● 2013 PRC Child & Adolescent Health Survey, Professional Research Consultants, Inc. [Items 38-39]
Notes: ● Asked of respondents for whom the randomly selected child in the household is between the ages of 2 and 17.
Past 6
Months
61.4%
6-12
Months
23.2%
1-2 Years
8.0%
>2 Years
3.5%
Never
3.9%
Time Since Most Recent Dental Visit
The vast majority (84.6%) of Total Service Area children (age 2-17) visited a dentist
or dental clinic at some point in the past year.
Similar to national findings.
Easily satisfies the Healthy People 2020 target (49% or higher).
Child Has Visited a Dentist or
Dental Clinic Within the Past Year(Among Parents of Children Age 2-17; Total Service Area, 2013)
Sources: ● 2013 PRC Child & Adolescent Health Survey, Professional Research Consultants, Inc. [Item 38]
● 2012 PRC National Child & Adolescent Health Survey, Professional Research Consultants, Inc.
● US Department of Health and Human Services. Healthy People 2020. December 2010. http://www.healthypeople.gov [Objective OH-7]
Notes: ● Asked of respondents for whom the randomly selected child in the household is between the ages of 2 and 17.
84.6% 85.9%
0%
20%
40%
60%
80%
100%
Total Service Area United States
Healthy People 2020 Target = 49.0% or Higher

111
As may be expected, regular dental care is statistically low among very young
children (those age 2 to 4).
Child Has Visited a Dentist or
Dental Clinic Within the Past Year(Among Parents of Children Age 2-17; Total Service Area, 2013)
Sources: ● 2013 PRC Child & Adolescent Health Survey, Professional Research Consultants, Inc. [Item 38]
● US Department of Health and Human Services. Healthy People 2020. December 2010. http://www.healthypeople.gov [Objective OH-7]
Notes: ● Asked of respondents for whom the randomly selected child in the household is between the ages of 2 and 17.
● Hispanics can be of any race. Other race categories are non-Hispanic categorizations (e.g., “Black” reflects non-Hispanic Black respondents).
● Income categories reflect respondent's household income as a ratio to the federal poverty level (FPL) for their household size. “Low Income” includes households
with incomes up to 200% of the federal poverty level; “Mid/High Income” includes households with incomes at 200% or more of the federal poverty level.
82.1%86.9%
74.1%
87.4% 85.4%81.6%
87.5%84.3% 84.8% 84.6%
0%
20%
40%
60%
80%
100%
Boy Girl Age
2 to 4
Age
5 to 12
Age
13 to 17
Low
Income
Mid/High
Income
Black Non-Black TSA
Healthy People 2020 Target = 49.0% or Higher
Dental Sealants
More than one-third of Total Service Area parents (35.1%) indicate that their child
(age 6-17) has received sealants on his or her permanent molars.
Lower than the US prevalence.
35.1%
48.8%
0%
20%
40%
60%
80%
100%
Total Service Area United States
Child Has Had Dental Sealants on Permanent Molars(Among Parents of Children Age 6-17)
Sources: ● 2013 PRC Child & Adolescent Health Survey, Professional Research Consultants, Inc. [Item 40]
● 2012 PRC National Child & Adolescent Health Survey, Professional Research Consultants, Inc.
Notes: ● Asked of respondents for whom the randomly selected child in the household is between the ages of 6 and 17.
Sealants are less likely among boys, younger children, those in upper-income
households, and Blacks.

112
Child Has Had Dental Sealants on Permanent Molars (Among Parents of Children Age 6-17; Total Service Area, 2013)
Sources: ● 2013 PRC Child & Adolescent Health Survey, Professional Research Consultants, Inc. [Item 40]
Notes: ● Asked of respondents for whom the randomly selected child in the household is between the ages of 5 and 17.
● Hispanics can be of any race. Other race categories are non-Hispanic categorizations (e.g., “Black” reflects non-Hispanic Black respondents).
● Income categories reflect respondent's household income as a ratio to the federal poverty level (FPL) for their household size. “Low Income” includes households
with incomes up to 200% of the federal poverty level; “Mid/High Income” includes households with incomes at 200% or more of the federal poverty level.
27.5%
42.6%
28.9%
42.5%38.9%
29.3%32.7%
43.0%
35.1%
0%
20%
40%
60%
80%
100%
Boy Girl Age
6 to 12
Age
13 to 17
Low
Income
Mid/High
Income
Black Non-Black TSA
Vision & Hearing
Vision Care
Note the following frequency of eye exams among Total Service Area children; as
shown, 9.4% of Total Service Area children have never had an eye exam.
Child’s Most Recent Eye Exam(Total Service Area, 2013)
Sources: ● 2013 PRC Child & Adolescent Health Survey, Professional Research Consultants, Inc. [Item 31]
Notes: ● Asked of all respondents.
Within the Past Year
70.6%
1 to 2 Years 14.5%
More Than 2 Yrs 5.5%
Never 9.4%
On the other hand, a total of 89.3% of Total Service Area parents indicate that their
child has had an eye exam within the past three years.
Higher than the national figure.
RELATED ISSUE:
See also Vision Problems
and Hearing Problems in
the Prevalence of Selected
Medical Conditions
section of this report.

113
Child Has Had an Eye Exam in the Past Three Years(Total Service Area, 2013)
Sources: ● 2013 PRC Child & Adolescent Health Survey, Professional Research Consultants, Inc. [Item 31]
● 2012 PRC National Child & Adolescent Health Survey, Professional Research Consultants, Inc.
Notes: ● Asked of all respondents.
89.3%
79.3%
0%
20%
40%
60%
80%
100%
Total Service Area United States
Recent eye exams (within the past three years) are lower among:
Girls.
Children age 0 to 4.
Non-Blacks.
Note that Total Service Area young children (age 0-5) appear to satisfy the
Healthy People 2020 objective established for preschool-age children.
Child Has Had an Eye Exam in the Past Three Years(Total Service Area, 2013)
Sources: ● 2013 PRC Child & Adolescent Health Survey, Professional Research Consultants, Inc. [Item 31]
● US Department of Health and Human Services. Healthy People 2020. December 2010. http://www.healthypeople.gov [Objective V-1]
Notes: ● Asked of all respondents.
● Hispanics can be of any race. Other race categories are non-Hispanic categorizations (e.g., “Black” reflects non-Hispanic Black respondents).
● Income categories reflect respondent's household income as a ratio to the federal poverty level (FPL) for their household size. “Low Income” includes households
with incomes up to 200% of the federal poverty level; “Mid/High Income” includes households with incomes at 200% or more of the federal poverty level.
93.2%
85.4%
61.8%
95.7%99.1%
92.1%
86.0%91.3%
80.9%
89.3%
0%
20%
40%
60%
80%
100%
Boy Girl Age
0 to 4
Age
5 to 12
Age
13 to 17
Low
Income
Mid/High
Income
Black Non-Black TSA
Healthy People 2020 Objective V-1:
Increase the proportion of preschool children
aged 5 years and under who receive vision
screening to 44.1% or higher.
In the Total Service Area: 46.1% of children
0-5 received an eye exam in the past year.
Hearing Testing
Note that 4.9% of Total Service Area parents indicate that their child has never had
a hearing test.

114
Child’s Most Recent Hearing Test(Total Service Area, 2013)
Sources: ● 2013 PRC Child & Adolescent Health Survey, Professional Research Consultants, Inc. [Item 33]
Notes: ● Asked of all respondents.
Within the Past Year
63.6%
1 to 2 Years 16.2%
More Than 2 Yrs
15.3%Never 4.9%
On the other hand, 87.7% of Total Service Area children have had a hearing test
within the past five years.
Comparable to national findings.
Child Has Had a Hearing Exam in the Past Five Years(Total Service Area, 2013)
Sources: ● 2013 PRC Child & Adolescent Health Survey, Professional Research Consultants, Inc. [Item 33]
● 2012 PRC National Child & Adolescent Health Survey, Professional Research Consultants, Inc.
Notes: ● Asked of all respondents.
87.7%85.0%
0%
20%
40%
60%
80%
100%
Total Service Area United States
No difference when viewed by demographic characteristics.
Note that Total Service Area adolescents (age 12-17) appear to satisfy the age-
specific Healthy People 2020 objective.

115
Child Has Had a Hearing Exam in the Past Five Years(Total Service Area, 2013)
Sources: ● 2013 PRC Child & Adolescent Health Survey, Professional Research Consultants, Inc. [Item 33]
● US Department of Health and Human Services. Healthy People 2020. December 2010. http://www.healthypeople.gov [Objective ENT-VSL-4.3]
Notes: ● Asked of all respondents.
● Hispanics can be of any race. Other race categories are non-Hispanic categorizations (e.g., “Black” reflects non-Hispanic Black respondents).
● Income categories reflect respondent's household income as a ratio to the federal poverty level (FPL) for their household size. “Low Income” includes households
with incomes up to 200% of the federal poverty level; “Mid/High Income” includes households with incomes at 200% or more of the federal poverty level.
89.5%86.0% 85.1%
89.6%86.5% 85.9%
88.3% 87.0% 89.0% 87.7%
0%
20%
40%
60%
80%
100%
Boy Girl Age
0 to 4
Age
5 to 12
Age
13 to 17
Low
Income
Mid/High
Income
Black Non-Black TSA
Healthy People 2020 Objective ENT-VSL-4.3:
Increase the proportion of Adolescents aged 12 to 19
years who have had a hearing examination in the past
5 years to 87.2% or higher.
In the Total Service Area: 85.2% of adolescents age
12-17 had a hearing exam in the past 5 years.

116
Emergency Room Services A total of 14.6% of Total Service Area children have gone to a hospital emergency
room two or more times in the past year.
Higher than national findings.
Child Has Used a Hospital
Emergency Room Two or More Times in the Past Year
Sources: ● 2013 PRC Child & Adolescent Health Survey, Professional Research Consultants, Inc. [Items 34-35]
● 2012 PRC National Child & Adolescent Health Survey, Professional Research Consultants, Inc.
Notes: ● Asked of all respondents.
14.6%8.8%
0%
20%
40%
60%
80%
100%
Total Service Area United States
16.1% of visits resulted
in a hospital admission: (among all children with any
ER visits in the past year)
Among all children with an emergency room visit in the past year, 16.1% had an ER visit
that resulted in a hospital admission.
Viewed by demographic characteristics, children more likely to have had multiple ER visits
in the past year include:
Children in low-income households.
Black children.
Child Has Used a Hospital
Emergency Room Two or More Times in the Past Year(Total Service Area, 2013)
Sources: ● 2013 PRC Child & Adolescent Health Survey, Professional Research Consultants, Inc. [Item 34]
Notes: ● Asked of all respondents.
● Hispanics can be of any race. Other race categories are non-Hispanic categorizations (e.g., “Black” reflects non-Hispanic Black respondents).
● Income categories reflect respondent's household income as a ratio to the federal poverty level (FPL) for their household size. “Low Income” includes households
with incomes up to 200% of the federal poverty level; “Mid/High Income” includes households with incomes at 200% or more of the federal poverty level.
17.4%
11.8%
19.2%
12.0%15.0%
18.4%
7.7%
14.9%
6.8%
14.6%
0%
20%
40%
60%
80%
100%
Boy Girl Age
0 to 4
Age
5 to 12
Age
13 to 17
Low
Income
Mid/High
Income
Black Non-Black TSA

117
Note that over one-half (55.9%) of parents whose child received emergency room care in
the past year acknowledge that the injury or illness might have been treatable in a
doctor’s office or clinic. Most (40.1%) of these parents say, however, that they used the
ER because the occasion was after hours (or on the weekend). Another 27.1% stated
that it was a true emergency/life-threatening situation; however, 29.4% offered reasons
suggesting poor access to regular primary care services.
40.1%
27.1%
29.4%
2.0%
After Hours/
Weekend
Emergency/
Life-Threatening
Access-Related
Issues
Recommended by
Healthcare Professional
0% 20% 40% 60% 80% 100%
Reason for Using the Hospital ER
Instead of a Doctor’s Office or Clinic
(Among Those Responding “Yes” at Left)
Emergency Room Visits(Among Parents of Children With Any ER Visits in Past Year; Total Service Area, 2013)
Sources: ● 2013 PRC Child & Adolescent Health Survey, Professional Research Consultants, Inc. [Items 36-37]
Notes: ● Asked of respondents for whom the randomly selected child in the household has visited a hospital emergency room in the past year.
Yes
55.9%
No
44.1%
ER Visit Was for Something That Might
Have Been Treated in a Doctor’s Office

118
HEALTH EDUCATION & OUTREACH
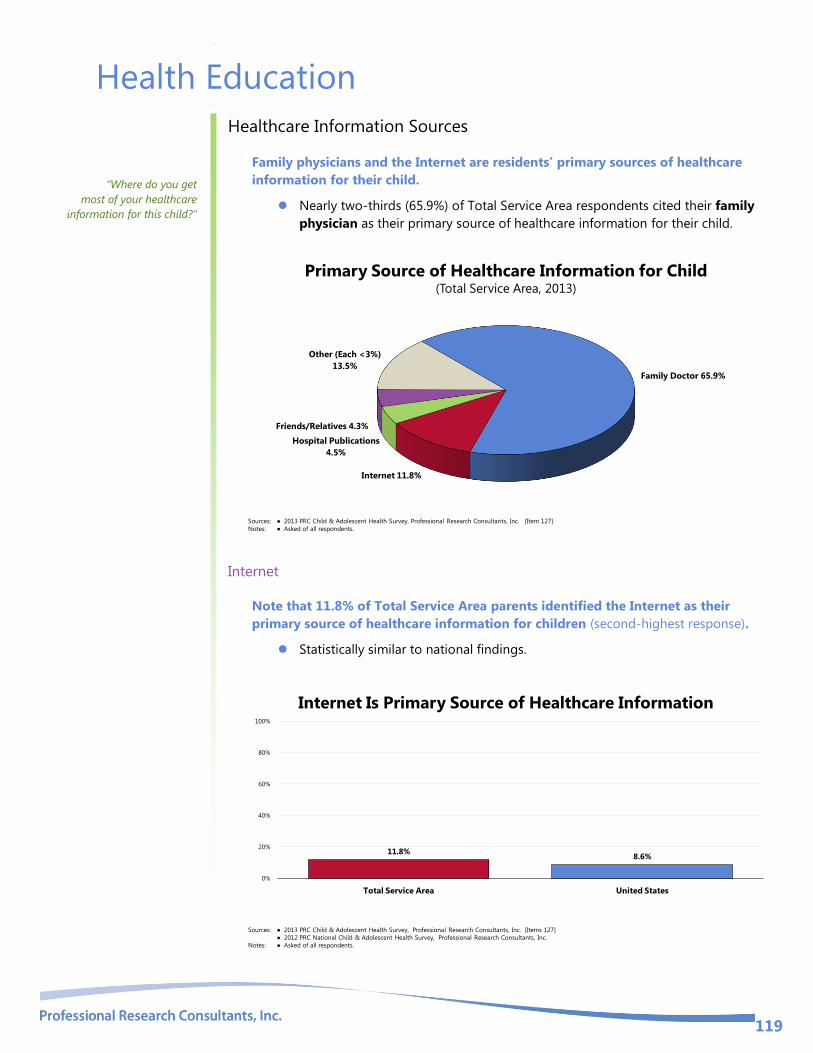
119
Health Education
Healthcare Information Sources
Family physicians and the Internet are residents’ primary sources of healthcare
information for their child.
Nearly two-thirds (65.9%) of Total Service Area respondents cited their family
physician as their primary source of healthcare information for their child.
Primary Source of Healthcare Information for Child(Total Service Area, 2013)
Sources: ● 2013 PRC Child & Adolescent Health Survey, Professional Research Consultants, Inc. [Item 127]
Notes: ● Asked of all respondents.
Family Doctor 65.9%
Internet 11.8%
Hospital Publications
4.5%
Friends/Relatives 4.3%
Other (Each <3%)
13.5%
Internet
Note that 11.8% of Total Service Area parents identified the Internet as their
primary source of healthcare information for children (second-highest response).
Statistically similar to national findings.
Internet Is Primary Source of Healthcare Information
Sources: ● 2013 PRC Child & Adolescent Health Survey, Professional Research Consultants, Inc. [Items 127]
● 2012 PRC National Child & Adolescent Health Survey, Professional Research Consultants, Inc.
Notes: ● Asked of all respondents.
11.8%8.6%
0%
20%
40%
60%
80%
100%
Total Service Area United States
“Where do you get
most of your healthcare
information for this child?”

120
Reliance on the Internet for children’s healthcare information does not vary
significantly by children’s key demographic characteristics.
Internet Is Primary Source of Healthcare Information(Total Service Area, 2013)
Sources: ● 2013 PRC Child & Adolescent Health Survey, Professional Research Consultants, Inc. [Item 127]
Notes: ● Asked of all respondents.
● Hispanics can be of any race. Other race categories are non-Hispanic categorizations (e.g., “Black” reflects non-Hispanic Black respondents).
● Income categories reflect respondent's household income as a ratio to the federal poverty level (FPL) for their household size. “Low Income” includes households
with incomes up to 200% of the federal poverty level; “Mid/High Income” includes households with incomes at 200% or more of the federal poverty level.
13.4%10.4% 9.3%
15.5%10.8% 9.3%
14.8%10.3%
15.5%11.8%
0%
20%
40%
60%
80%
100%
Boy Girl Age
0 to 4
Age
5 to 12
Age
13 to 17
Low
Income
Mid/High
Income
Black Non-Black TSA
In all, 96.7% of Total Service Area parents have access to the Internet.
Higher than the national percentage.
Have Access to the Internet
Sources: ● 2013 PRC Child & Adolescent Health Survey, Professional Research Consultants, Inc. [Items 135]
● 2012 PRC National Child & Adolescent Health Survey, Professional Research Consultants, Inc.
Notes: ● Asked of all respondents.
96.7%93.1%
0%
20%
40%
60%
80%
100%
Total Service Area United States
Internet access is less prevalent in low-income households and among Black
respondents.

121
Have Access to the Internet (Total Service Area, 2013)
Sources: ● 2013 PRC Child & Adolescent Health Survey, Professional Research Consultants, Inc. [Item 135]
Notes: ● Asked of all respondents.
● Hispanics can be of any race. Other race categories are non-Hispanic categorizations (e.g., “Black” reflects non-Hispanic Black respondents).
● Income categories reflect respondent's household income as a ratio to the federal poverty level (FPL) for their household size. “Low Income” includes households
with incomes up to 200% of the federal poverty level; “Mid/High Income” includes households with incomes at 200% or more of the federal poverty level.
97.2% 96.2%93.4%
97.8% 98.1%94.4%
100.0%95.5%
100.0%96.7%
0%
20%
40%
60%
80%
100%
Boy Girl Age
0 to 4
Age
5 to 12
Age
13 to 17
Low
Income
Mid/High
Income
Black Non-Black TSA
Smartphones
Note that 30.4% of Total Service Area children have a smartphone, or a phone that
can access the internet.
Twice that reported nationally
Statistically high among:
Teens.
Child Has a Smartphone(By Child’s Demographic Characteristics; Total Service Area, 2013)
Sources: ● 2013 PRC Child & Adolescent Health Survey, Professional Research Consultants, Inc. [Item 137-138]
● 2012 PRC National Child & Adolescent Health Survey, Professional Research Consultants, Inc.
Notes: ● Asked of all respondents about a randomly-selected child age 5-17.
● A “smartphone” is a phone that can access the Internet.
● Hispanics can be of any race. Other race categories are non-Hispanic categorizations (e.g., “Black” reflects non-Hispanic Black respondents).
● Income categories reflect respondent's household income as a ratio to the federal poverty level (FPL) for their household size. “Low Income” includes households
with incomes up to 200% of the federal poverty level; “Mid/High Income” includes households with incomes at 200% or more of the federal poverty level.
24.0%
31.9%
7.3%
62.8%
30.1% 30.2% 32.3%
26.2%30.4%
15.3%
0%
20%
40%
60%
80%
100%
Boy Girl Age
5 to 12
Age
13 to 17
Low
Income
Mid/High
Income
Black Non-Black TSA US

122
Parenting Education
Among Total Service Area survey respondents, 37.1% are aware of parenting
education programs offered in the community.
Notably lower than found nationally.
Aware of Local Parenting Education Programs
Sources: ● 2013 PRC Child & Adolescent Health Survey, Professional Research Consultants, Inc. [Item 128]
● 2012 PRC National Child & Adolescent Health Survey, Professional Research Consultants, Inc.
Notes: ● Asked of all respondents.
37.1%
50.3%
0%
20%
40%
60%
80%
100%
Total Service Area United States
No statistical difference by demographic characteristics.
Aware of Local Parenting Education Programs(By Adult Respondents’ Demographic Characteristics; Total Service Area, 2013)
Sources: ● 2013 PRC Child & Adolescent Health Survey, Professional Research Consultants, Inc. [Item 128]
Notes: ● Asked of all respondents.
● *Race reflects that of the child, not the respondent. Hispanics can be of any race. Other race categories are non-Hispanic categorizations (e.g., “Black” reflects
non-Hispanic Black respondents).
● Income categories reflect respondent's household income as a ratio to the federal poverty level (FPL) for their household size. “Low Income” includes households
with incomes up to 200% of the federal poverty level; “Mid/High Income” includes households with incomes at 200% or more of the federal poverty level.
42.1%
35.9%
44.9%
34.9%31.2%
39.9%34.6% 36.6%
39.6%37.1%
0%
20%
40%
60%
80%
100%
Men Women 18 to 34 35 to 49 50+ Low
Income
Mid/High
Income
Black* Non-Black* TSA
“Are you aware of any
parenting education
programs offered in your
community?”

123
Further, 14.2% of all local parents have used a local parenting education program.
Comparable to national findings.
Have Used a Local Parenting Education Program
Sources: ● 2013 PRC Child & Adolescent Health Survey, Professional Research Consultants, Inc. [Item 160]
● 2012 PRC National Child & Adolescent Health Survey, Professional Research Consultants, Inc.
Notes: ● Asked of all respondents.
14.2%18.5%
0%
20%
40%
60%
80%
100%
Total Service Area United States
No difference by demographic breakout.
Have Used a Local Parenting Education Program (By Adult Respondents’ Demographic Characteristics ; Total Service Area, 2013)
Sources: ● 2013 PRC Child & Adolescent Health Survey, Professional Research Consultants, Inc. [Item 160]
Notes: ● Asked of all respondents.
● *Race reflects that of the child, not the respondent. Hispanics can be of any race. Other race categories are non-Hispanic categorizations (e.g., “Black” reflects
non-Hispanic Black respondents).
● Income categories reflect respondent's household income as a ratio to the federal poverty level (FPL) for their household size. “Low Income” includes households
with incomes up to 200% of the federal poverty level; “Mid/High Income” includes households with incomes at 200% or more of the federal poverty level.
17.5%13.5%
16.2%13.6% 14.0%
16.2%11.3%
15.0%12.3% 14.2%
0%
20%
40%
60%
80%
100%
Men Women 18 to 34 35 to 49 50+ Low
Income
Mid/High
Income
Black* Non-Black* TSA