Embed Size (px)
Citation preview
8/3/2019 Chicago Aviation Policy
http://slidepdf.com/reader/full/chicago-aviation-policy 1/93

8/3/2019 Chicago Aviation Policy
http://slidepdf.com/reader/full/chicago-aviation-policy 2/93
1
BOOZ·ALLEN & HAM ILTON INC.
225 WEST WACKER DRIVE SUITE 1700 • CHICAGO , IL 60606 • TELEPHON E: (312) 346-1900 • FAX: (312) 578-4667
I. INTRODUCTION
Metropolitan Chicago has the aspiration of becoming one of the world’s ten or fifteen greatmetropolitan centers in the twenty-first century. Key to achieving that ambition is having the pre-eminentinternational air transportation hub in North America. Today, Chicago has the foundation for building itsposition as that hub.
Developing good aviation and airport policy is a highly complex undertaking that requires a balanceof economic, consumer and social issues. Consumers have an interest in competitive airfares,convenient access, and frequent service. Area residents have quality of life concerns. Aviation cangreatly impact the economy – and the lives of residents – as a powerful engine that generates jobs,income, and business across an entire region.
Maximizing the economic power of the region’s aviation resources should be a central policy goal.
Resources should be developed in a rational manner to ensure that Chicago not only captures a shareof growing opportunities in the aviation marketplace but earns a position of pre-eminence.

8/3/2019 Chicago Aviation Policy
http://slidepdf.com/reader/full/chicago-aviation-policy 3/93
8/3/2019 Chicago Aviation Policy
http://slidepdf.com/reader/full/chicago-aviation-policy 4/93

8/3/2019 Chicago Aviation Policy
http://slidepdf.com/reader/full/chicago-aviation-policy 5/93
4
– Chicago, or any city, can only have one world-class hub. Chicago and Illinoisneed to decide whether O’Hare is Chicago’s hub for the future and invest inmaking it as strong as possible. To achieve its position of prominence, Chicagomust have one international hub – and O’Hare is clearly the best choice.
- An additional airport in Peotone, for example, would not help Chicago capture anincreased share of international traffic. A single strong hub is a requirement tobuild international traffic and sustain Chicago’s premier position as an aviationcenter
• Chicago should maintain and develop significant point-to-point traffic capacity at
Midway and other airports
– Doubling price -and service- stimulated point-to-point traffic at Midway andsignificantly extending the range of destinations served is a reasonable goal
– Increasing secondary airport point-to-point capacity will stimulate the economy andbenefit consumers through lower fares. As a point-to-point facility, Midway exertsprice discipline on O’Hare fares similar to low price competitors at other hubs
– As Midway reaches capacity, secondary airport point-to-point traffic can beaccommodated by enhancing other existing, conveniently located airports or bybuilding an additional airport in a location convenient to the population center

8/3/2019 Chicago Aviation Policy
http://slidepdf.com/reader/full/chicago-aviation-policy 6/93
T A B L E O F C O N T E N T S
I . INTRODUCTION AND EXECUTIVE SUMMARY
I I . EVALUATING AN AIRPORT SYSTEM
I I I . OPPORTUNITIES FOR CHICAGO
I V OPTIONS
V . IMPORTANCE OF O’HARE AND MIDWAY TOTHEIR RESPECTIVE VICINITIES
Note to reader: The document is paginated so that those pages labeled ‘F’ are to be read as corresponding pages to the similarly labeled page (e.g., page V-2F should be read as a page directly related to V-2). In the bound document, these corresponding pages are printed opposite the main page and are consequently referred to as the facing exhibit, or the page opposite.

8/3/2019 Chicago Aviation Policy
http://slidepdf.com/reader/full/chicago-aviation-policy 7/93
I. INTRODUCTION AND EXECUTIVE SUMMARY
8/3/2019 Chicago Aviation Policy
http://slidepdf.com/reader/full/chicago-aviation-policy 8/93
I-1
INTRODUCTION
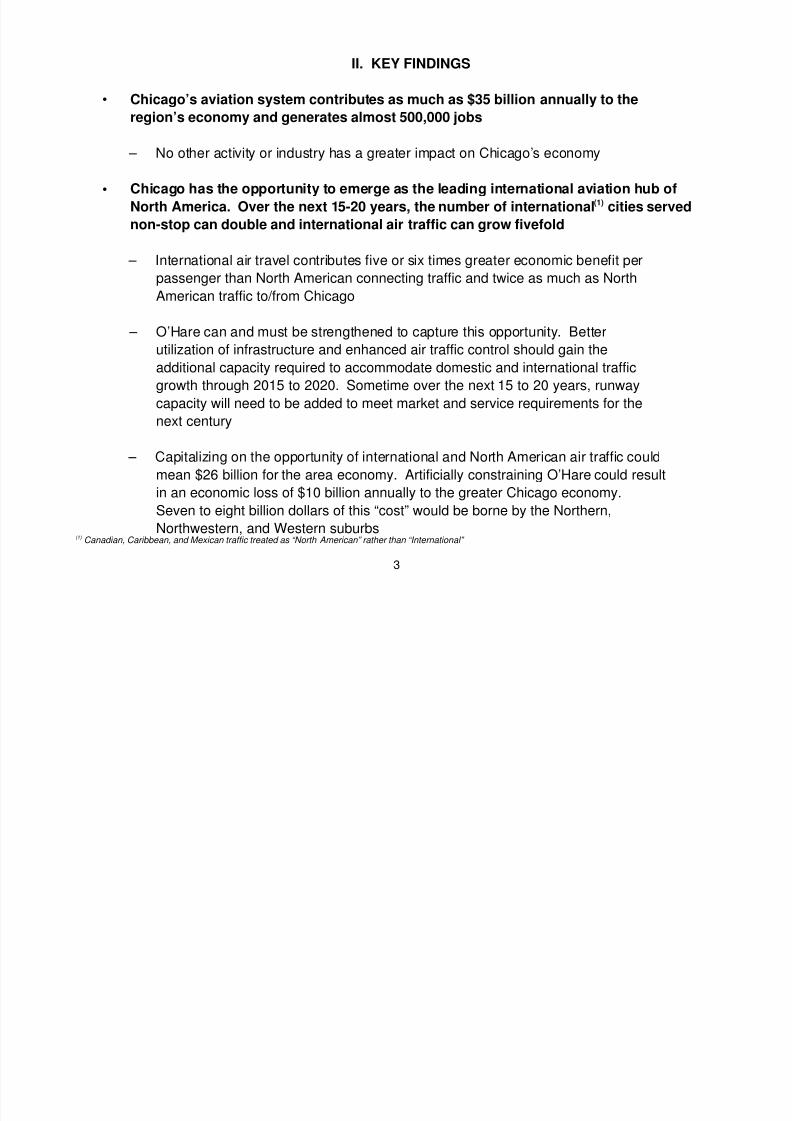
Aviation policy and associated infrastructure decisions are highly complex issues involving
legitimate economic, consumer, and social concerns. These include employment, the competitiveness ofChicago as a domestic and international center for trade, tourism and transportation, fares paid byconsumers, ease of access to airports, access to Chicago provided to the smaller communities, qualityof life concerns, and noise disturbances. There is no single solution which can satisfy the needs of allinterested parties—compromises must be assessed and trade-offs made.
This study seeks to provide an independent perspective on commercial aviation policy for greaterChicago and on the potential consequences for the Northern Suburbs. We have reviewed selected
airport options using reasonable demand projections. We have not reviewed all potential solutions insufficient technical depth to draw final conclusions. Instead, we recommend further study to evaluate thekey viable options.
The conclusions represent Booz·Allen & Hamilton’s independent opinion. The study wascommissioned by the Chicagoland Chamber of Commerce.
8/3/2019 Chicago Aviation Policy
http://slidepdf.com/reader/full/chicago-aviation-policy 9/93
I-2
EXECUTIVE SUMMARY
PERFORMANCE
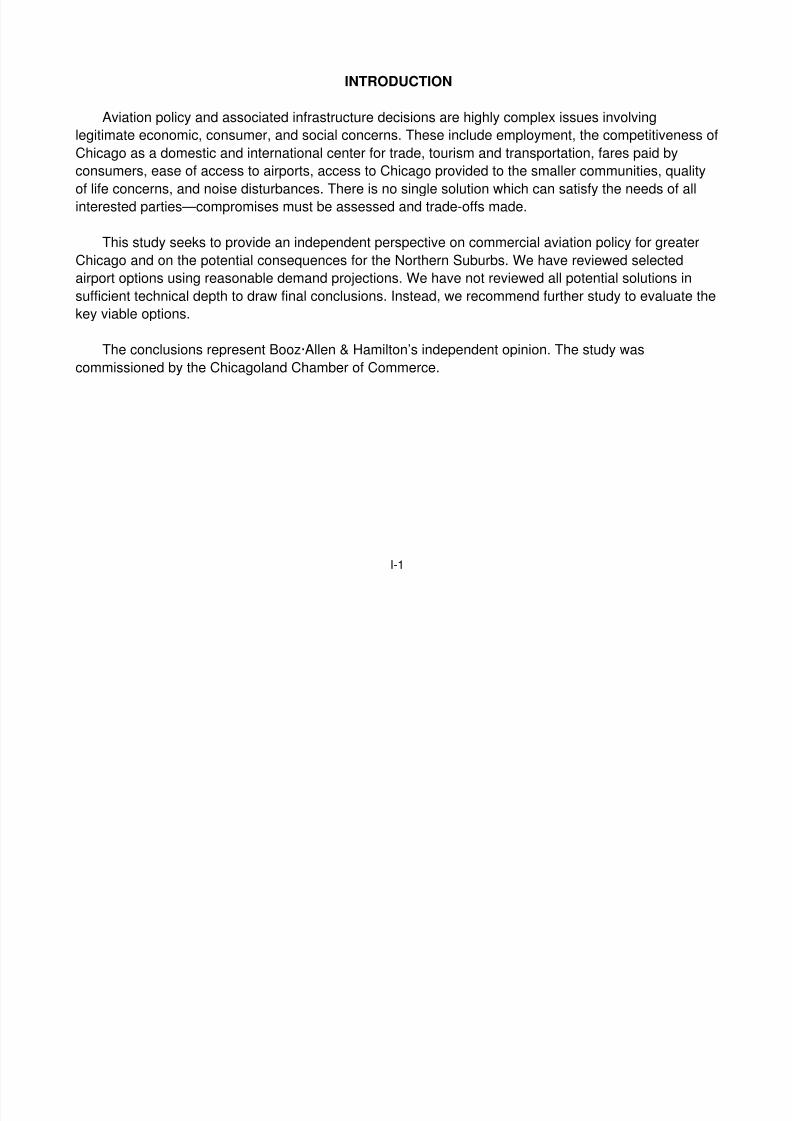
Chicago’s aviation system is a critical asset to the community. Between them, O’Hare and Midwaycontribute $31B–$38B annually to regional economic output and 420,000–510,000 jobs. Thiscontribution takes many forms: direct employment in airport, airline, hotel, restaurant, convention,ground transportation and other transport and tourism related activities; the induced economic effect andemployment caused by the goods and services bought by all the above; and the commerce andbusiness attracted to Chicago by the broad range of domestic and international air services provided bythe airport system.
No other U.S. city provides as extensive North American (1) services as Chicago, and no central U.S.hub provides more extensive international services. Chicago, however, lags behind the traditionalcoastal gateways of New York, Los Angeles and Miami on the international scene. By virtue of itsprimary gateway status and center of economic trade and commerce, New York provides non-stopservices to nearly two and a half times more international destinations than Chicago.
Chicago consumers obviously benefit from the broad range of services. Consumers are offered achoice of lower priced services from Midway and a broader range of destinations from O’Hare. A farecomparison showed that Chicago consumers pay similar prices to those at other hub cities and thatMidway exerts significant price discipline on O’Hare, similar to that provided by low-price carriers atother hubs.
(1) Throughout this document, Canadian, Caribbean, and Mexican traffic is treated as “North American” rather than “International”

8/3/2019 Chicago Aviation Policy
http://slidepdf.com/reader/full/chicago-aviation-policy 10/93
I-3
Executive Summary…
OPPORTUNITY
There are three sources of traffic: point-to-point North American, connecting North American, andinternational. Since O’Hare is one of the most established and mature hubs in the U.S., we expect NorthAmerican hub-based traffic (point-to-point and connecting) growth to continue, but at a modest pace of1.7–2.0% annual enplanements.
Point-to-point demand at Midway is price—and service—stimulated by low-price airlines, such asSouthwest (Midway services involve low proportions of connecting traffic). Current investments and
Southwest’s experience elsewhere suggests that the recent growth of 4% annually may continue forsome time. Our forecasts suggest that point-to-point traffic at secondary Chicago airports (1) may morethan double in the next 15–20 years, with obvious consumer benefits: more extensive, low-price servicesto a broader range of destinations. Secondary airport point-to-point traffic can be split across multipleconveniently located airports as Midway reaches capacity.
International traffic at O’Hare has the potential for substantial growth, and is tied to the emergenceof Chicago as the international hub of the future. At present, a relatively low share of international traffic
to the central United States flies directly to O’Hare. Passengers from a broad range of cities outside theU.S. are offered little or no non-stop service to Chicago. Hence, even passengers traveling to Chicagofrequently choose to connect via other gateways.
Note: (1) A secondary airport is regarded as a small complementary airport to the main hub, where the service offering does not replicate that of the hub

8/3/2019 Chicago Aviation Policy
http://slidepdf.com/reader/full/chicago-aviation-policy 11/93
I-4
Executive Summary…
OPPORTUNITY (continued)
Chicago’s opportunity is to become the principal U.S. gateway beyond New York and, in fact, tocapture a share of international services from New York. While the first U.S. city to be served byinternational carriers will likely continue to be New York by virtue of its importance for international trade,added flights may go elsewhere. Kennedy is vulnerable because connections to other U.S. cities areweak, while Chicago offers the broadest range of connecting services in the U.S.
As international traffic volumes grow, an increasing number of international cities will support non-stop services to cities other than the traditional coastal gateways. By providing effective connections andcapturing Chicago-bound passengers, Chicago can become the next city served from many (if not most)
international locations. As direct Chicago service builds up, more U.S. and international passengers willuse Chicago as a connecting point ... enabling even more non-stop international frequencies.Capitalizing on this opportunity will require a very effective connecting system, since flights frommedium-sized international cities can carry as much as 80% connecting passengers.
Our forecasts suggest that international cities served non-stop may more than double in the next 15-20 years and that international traffic volumes could increase fivefold. The economic benefits to thecommunity would be substantial. We estimate that an international passenger contributes five to sixtimes more to economic development and employment than a North American connecting passenger,
and twice as much as a North American local passenger ($2310 regional economic output perinternational passenger enplanement compared to $430 per North American connecting and $1120 perNorth American local enplanement). International traffic growth will make Chicago more attractive as acenter of international commerce.
This growth opportunity and associated economic development can only be realized by establishingone of the most efficient international hubs—Chicago will need to “earn” the share gain.

8/3/2019 Chicago Aviation Policy
http://slidepdf.com/reader/full/chicago-aviation-policy 12/93
I-5
Executive Summary…
AIRPORT UTILIZATION
Chicago’s current airports can be more effectively utilized. At O’Hare, there is a potential to increaseaverage aircraft size and load factors (especially with the shift toward international traffic); non-scheduled operations can be relocated elsewhere (e.g. air taxi and military); and airspace can be betterutilized. Technology and procedure developments to alleviate airspace bottlenecks are quite advanced,and one may reasonably expect O’Hare’s enplanement capacity (i.e. passengers) to be raised by some65–70% in the next 15–20 years by airspace management and passengers per plane alone. Similarly,Midway’s throughput may be doubled over the same period.
Expanded O’Hare and Midway airports may satisfy market demand through 2015—withinternational traffic increasing fivefold, with domestic growth at O’Hare accommodated mainly throughlarger aircraft and better utilization of infrastructure and airspace, and with point-to-point traffic at Midwaydoubling.
By 2015–2020 the Chicago airport systems will likely become constrained. Sometime during thenext 15–20 years, runway capacity will need to be added to meet market and service requirements for
the next century. Investments in O’Hare will have huge payback to the Chicago community.
8/3/2019 Chicago Aviation Policy
http://slidepdf.com/reader/full/chicago-aviation-policy 13/93
I-6
Executive Summary…
POLICY OPTIONS
Chicago has two key imperatives:
(1) Build and maintain a single strong hub(2) Ensure there is sufficient secondary, point-to-point capacity
The principal requirement for building Chicago into the major international air transportation centerin North America is a single, strong hub.
(1) Build and maintain a single strong hub
Cities which have attempted to create ‘split hubs’ have failed to become effective connectinglocations or international hubs. Passengers will connect through other cities rather than switchingairports at a connecting point. In cities which have built second, more distant airports, local passengershave preferred to use the existing, more convenient airport. To enable the second airport to grow, citieshave either closed the first airport (e.g., Denver) or placed restrictions on the first airport to force flightsto the new airport. Examples include LaGuardia, Ronald Reagan National, and Love Field (Dallas).
Without restrictions, such new airports have failed; e.g., Mirabel (Montreal). The failure of Mirabel was amajor factor in Montreal’s reduced status as a primary international gateway—and reportedly cost $4billion in public funds. A very recent example is Milan, where there has been a battle between the EUand Italy over restriction on Milan's downtown Linate airport to provide a traffic base for the expandedMalpensa airport.

8/3/2019 Chicago Aviation Policy
http://slidepdf.com/reader/full/chicago-aviation-policy 14/93
I-7
Executive Summary…
POLICY OPTIONS (CONTINUED)
Capacity at O'Hare must grow to ensure its effectiveness as a hub and international gateway. Sincehub traffic is not transferable across airports, the concept of Peotone as a complementary hub is flawed.Chicago, or any city, can only have one world-class hub. Chicago and Illinois need to decide whetherO’Hare is Chicago’s hub for the future and invest in making it as strong as possible. To achieve itsposition of prominence, Chicago must have one international hub—and O'Hare is clearly the bestchoice.
Booz·Allen estimates that artificially constraining O’Hare and developing Peotone could cost GreaterChicago some $8–10 billion per year in lost economic output by 2015. Artificially constraining O’Harewould be devastating to the Northern Suburbs, costing the O’Hare vicinity some $7–8 billion annually ineconomic output by 2015. If O’Hare were forced to close, the cost to its vicinity would be close to $30billion annually in economic output by 2015 – involving an absolute reduction of 145,000 jobs from 1997levels and a huge foregone opportunity for economic development.
(2) Ensure that there is sufficient secondary point-to-point capacity
A plan needs to be developed to ensure adequate commercial and general aviation point-to-pointcapacity for the Chicago area beyond 2015. There are several active airports in the Chicago vicinity,some of which are candidates for commercial expansion. The Peotone location was chosen as a site fora major new international airport. Different criteria (i.e., incremental point-to-point capacity) may result ina different answer. The decision to expand current secondary airports and add a new airport should bemade in the context of point-to-point commercial and general aviation requirements, includingconvenient access for concentrations of area population.

8/3/2019 Chicago Aviation Policy
http://slidepdf.com/reader/full/chicago-aviation-policy 15/93
II. EVALUATING AN AIRPORT SYSTEM

8/3/2019 Chicago Aviation Policy
http://slidepdf.com/reader/full/chicago-aviation-policy 16/93
II-1
Evaluating an Airport System…
AIRPORT SYSTEMS ARE EVALUATED AGAINST FOUR BROAD CRITERIA—SERVICE LEVELS,FARES, ECONOMIC GROWTH, AND QUALITY OF LIFE
GOAL DIMENSION
• Superior ServiceLevel
• Provide frequent services to a broad range of destinations for benefitof local, Chicago-based consumers
• Provide small and medium-sized communities access to Chicago
• Provide direct access to a broad range of international destinations
• Provide connecting passengers convenient and diverse connections• Competitive Fares • Provide competitive prices for business and leisure travelers alike
• Maximum EconomicBenefit
• Airports are a primary engine of economic growth
– Through airline, airport, and associated service employment andexpenditures
– By encouraging tourism
– By attracting a broad range of businesses to the region – throughconvenient air access to a large set of destinations
• Protect quality of life • Minimize noise pollution• Provide convenient access

8/3/2019 Chicago Aviation Policy
http://slidepdf.com/reader/full/chicago-aviation-policy 17/93
II-2F
NORTH AMERICAN DESTINATIONS SERVED NON-STOP
CITY
Coastal Gateways Mid-Continental Cities RPCH247-008-108
INTERNATIONAL DESTINATIONS SERVED NON-STOP
ATL MSP PITLA CHI SF DTW HOUNY WAS DFW
CITY
10
20
30
40
50
60
70
00
20
40
60
80
100
120
140
160
180
CHI MSP ATL DAL NY PIT DEN DET HOU MIA LA WAS SF MIA
Sources: OAG database; BA&H analysis

8/3/2019 Chicago Aviation Policy
http://slidepdf.com/reader/full/chicago-aviation-policy 18/93

8/3/2019 Chicago Aviation Policy
http://slidepdf.com/reader/full/chicago-aviation-policy 19/93
II-3F
COMMENTARY
There has been much debate on fares
A comparison of average domestic fares suggests thatpassengers traveling to and from Chicago pay similarprices to passengers traveling to and from other majorhub cities
The comparison shown has been adjusted by stagelength and passenger density – in effect, comparingprices for journeys of similar length and weightingdestinations by the total number of passengers travelingthe route

8/3/2019 Chicago Aviation Policy
http://slidepdf.com/reader/full/chicago-aviation-policy 20/93
II-3
Evaluating an Airport System… Fares…
AVERAGE CHICAGO FARES ARE SIMILAR TO THOSE AT MAJOR MIDCONTINENTAL HUBCITIES
RPLA247-007-004Ba.Y
AVERAGE PRICE COMPARISON(Stage Length and Passenger Density Adjusted)
0
20
40
60
80
100
120
140
Chicago ATL DEN Dallas DTW Houston MSP PIT
AVERAGEPRICE INDEX
Source: DB1A data, BA&H Analysis

8/3/2019 Chicago Aviation Policy
http://slidepdf.com/reader/full/chicago-aviation-policy 21/93
II-4F
RPLA293-008-017LLa.Y
IMPACT OF SECONDARYPOINT-TO-POINT AIRPORTS: MIDWAY
0
10
20
30
40
50
60
STAGE LENGTH (Miles)
O’Hare Unique(No Direct Midway Competition)
O’Hare Common(Direct Midway Competition)
MidwayR 2 = 82%R 2 = 79%
R 2 = 84%
AVERAGEO&D YIELD
(c/mile)
250 500 750 1,000 1,500
IMPACT OF LOW PRICECARRIERS: ATLANTA
0
20
40
50
60
250 500 750 1,000 1,500
30
10
DeltaUnique
DeltaCommon
Valujet R 2 = 88%R 2 = 95%
R 2 = 84%
STAGE LENGTH (Miles)
AVERAGEO&D YIELD
(c/mile)
Sources: DB1A data; BA&H analysis

8/3/2019 Chicago Aviation Policy
http://slidepdf.com/reader/full/chicago-aviation-policy 22/93
II-4
Evaluating an Airport System…Fares…
MIDWAY PROVIDES SIGNIFICANT PRICE DISCIPLINE -- SIMILAR TO THAT PROVIDED BY LOW-PRICE CARRIERS AT OTHER HUBS
Midway provides price discipline in Chicago in two ways:
• Support low price services to a range of destinations• Reduce O’Hare’s fares by some 25-30% on routes with direct Midway competition
A comparison across hubs has shown that this price discipline effect is similar to that provided byLove Field in Dallas and similar to that provided by in-hub low price competition (e.g. the Atlanta-ValuJetexample shown opposite)
Encouraging Midway growth will clearly be in Chicago consumer’s interest

8/3/2019 Chicago Aviation Policy
http://slidepdf.com/reader/full/chicago-aviation-policy 23/93
II-5F
NOTES
• The economic impact estimates include both the primary andinduced economic effects. The primary economic effect is the directemployment caused (e.g. airline personnel); the induced economiceffect is the employment caused by the services and goodspurchased by the direct employees (the economic multiplier effect)
• While most airport economic studies recognize the importance ofaccess sensitive business, most do not quantify it. ACG/TAMS(performed the economic feasibility study of the South SuburbanAirport), estimated O’Hare access sensitive employment at180,000 (1) jobs. BA&H has conservatively assumed access-sensitiveemployment around O’Hare at 90,000-180,000
(1) Non-resident jobs within 12 miles of the airport in Finance, Real Estate, Insurance,Manufacturing, Telecommunications, Utilities and Transportation Industries
8/3/2019 Chicago Aviation Policy
http://slidepdf.com/reader/full/chicago-aviation-policy 24/93
II-5
Evaluating an Airport System…Economic Benefit…
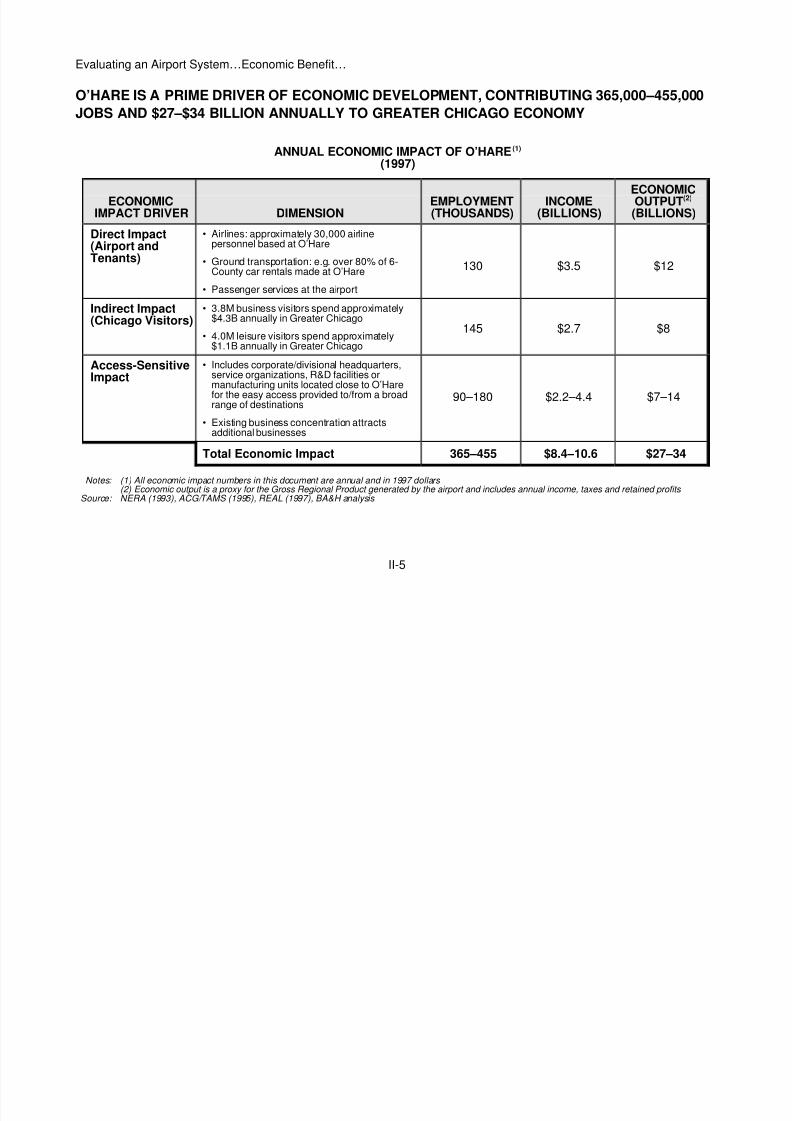
O’HARE IS A PRIME DRIVER OF ECONOMIC DEVELOPMENT, CONTRIBUTING 365,000–455,000JOBS AND $27–$34 BILLION ANNUALLY TO GREATER CHICAGO ECONOMY
ANNUAL ECONOMIC IMPACT OF O’HARE (1)
(1997)
ECONOMICIMPACT DRIVER DIMENSION
EMPLOYMENT(THOUSANDS)
INCOME(BILLIONS)
ECONOMICOUTPUT (2)
(BILLIONS)
Direct Impact(Airport andTenants)
• Airlines: approximately 30,000 airlinepersonnel based at O’Hare
• Ground transportation: e.g. over 80% of 6-County car rentals made at O’Hare
• Passenger services at the airport
130 $3.5 $12
Indirect Impact(Chicago Visitors)
• 3.8M business visitors spend approximately$4.3B annually in Greater Chicago
• 4.0M leisure visitors spend approximately$1.1B annually in Greater Chicago
145 $2.7 $8
Access-SensitiveImpact
• Includes corporate/divisional headquarters,service organizations, R&D facilities ormanufacturing units located close to O’Harefor the easy access provided to/from a broadrange of destinations
• Existing business concentration attractsadditional businesses
90–180 $2.2–4.4 $7–14
Total Economic Impact 365–455 $8.4–10.6 $27–34
Notes: (1) All economic impact numbers in this document are annual and in 1997 dollars (2) Economic output is a proxy for the Gross Regional Product generated by the airport and includes annual income, taxes and retained profits
Source: NERA (1993), ACG/TAMS (1995), REAL (1997), BA&H analysis

8/3/2019 Chicago Aviation Policy
http://slidepdf.com/reader/full/chicago-aviation-policy 25/93
II-6
Evaluating an Airport System…Economic Benefit…
SIMILARLY, MIDWAY CONTRIBUTES SOME 60,000 JOBS AND $4 BILLION ANNUALLY TO THEGREATER CHICAGO ECONOMY
ANNUAL ECONOMIC IMPACT OF MIDWAY(1997)
ECONOMICIMPACT DRIVER DIMENSION
EMPLOYMENT(THOUSANDS)
INCOME(MILLIONS)
ECONOMICOUTPUT
(BILLIONS)
Direct Impact(Airport andTenants)
• Airlines: approximately 2,600airline personnel based atMidway
• Passenger services at the airport
14 $340 $1.2
Indirect Impact(Chicago Visitors)
• 1.4M business visitors spendapproximately $1.0B annually inGreater Chicago
• 0.6M leisure visitors spendapproximately $0.2B annually inGreater Chicago
29 $530 $1.6
Access-SensitiveImpact
• Includes businesses located inChicago and around Midway foreasy airport access
16 $370 $1.2
Total Economic Impact 59 $1,240 $4.0
Sources: NERA (1993), ACG/TAMS (1995), REAL (1997), BA&H analysis

8/3/2019 Chicago Aviation Policy
http://slidepdf.com/reader/full/chicago-aviation-policy 26/93
II-7
Evaluating an Airport System…Economic Benefit…
THE ECONOMIC VALUE OF AN INTERNATIONAL PASSENGER IS 5 TO 6 TIMES THE VALUE OF ANORTH AMERICAN CONNECTING PASSENGER
ECONOMIC BENEFITS BY TYPE OF TRAFFIC (O’HARE—1997) (1)
ECONOMIC BENEFITS GENERATED BY ANADDITIONAL:
North AmericanPassenger International (2)
COMMENTS
Connect.Point-to-
Point Passenger
Airport $290 $320 $1,160 • Long haul flights require significantly more handlingand servicing than short-haul North American flights
Visitors $0 $520 $600 • Higher international expenditure per visitor driven bylonger stays
Access-SensitiveBusinesses
$140 $280 $550 • Each additional international destination servedshould attract more businesses to Chicago thananother North American flight
Total $430 $1,120 $2,310
IncreasingEconomic Benefit 1 x 2.6 x 5.4 x
Notes: (1) Economic impact of passengers at Midway will differ somewhat because of differences in the type of traffic stimulated and costs-to-serve (2) Long-haul International flights–Canadian, Mexican and Caribbean flights are counted as North American
Sources:PEA/ACG studies, BA&H analysis

8/3/2019 Chicago Aviation Policy
http://slidepdf.com/reader/full/chicago-aviation-policy 27/93

8/3/2019 Chicago Aviation Policy
http://slidepdf.com/reader/full/chicago-aviation-policy 28/93
III. OPPORTUNITIES FOR CHICAGO

8/3/2019 Chicago Aviation Policy
http://slidepdf.com/reader/full/chicago-aviation-policy 29/93

8/3/2019 Chicago Aviation Policy
http://slidepdf.com/reader/full/chicago-aviation-policy 30/93
III-1
Opportunities for Chicago…
BOOZ·ALLEN TRAFFIC FORECASTS SUGGEST THAT THERE ARE TWO MAIN POTENTIALAREAS FOR GROWTH: PRICE AND SERVICE STIMULATED POINT-TO-POINT ANDINTERNATIONAL TRAFFIC
13.2
47.3
11.8
RPLA293-008-007Bb.Y
1996 2015
Midway
O’Hare
POTENTIAL GROWTH OPPORTUNITYCHICAGO DEMAND
(Passenger Enplanements, in Millions)
Domestic “HUB” Traffic(Point-to-point
and connecting)+ 1.9% p.a.
Price and ServiceStimulated
Point-To-PointTraffic at Secondary
Airports+ 4.1% p.a.
International(to Chicago
and Connecting)+ 8.2%
36.8
4.5
30.3
2
10.5
43.8
9.7
64.0
2020
72.3
+ 2.5% p.a.
+ 3.0% p.a.
+ 9.1% p.a.
+ 4.7% p.a.
8/3/2019 Chicago Aviation Policy
http://slidepdf.com/reader/full/chicago-aviation-policy 31/93
III-2
Opportunities for Chicago…
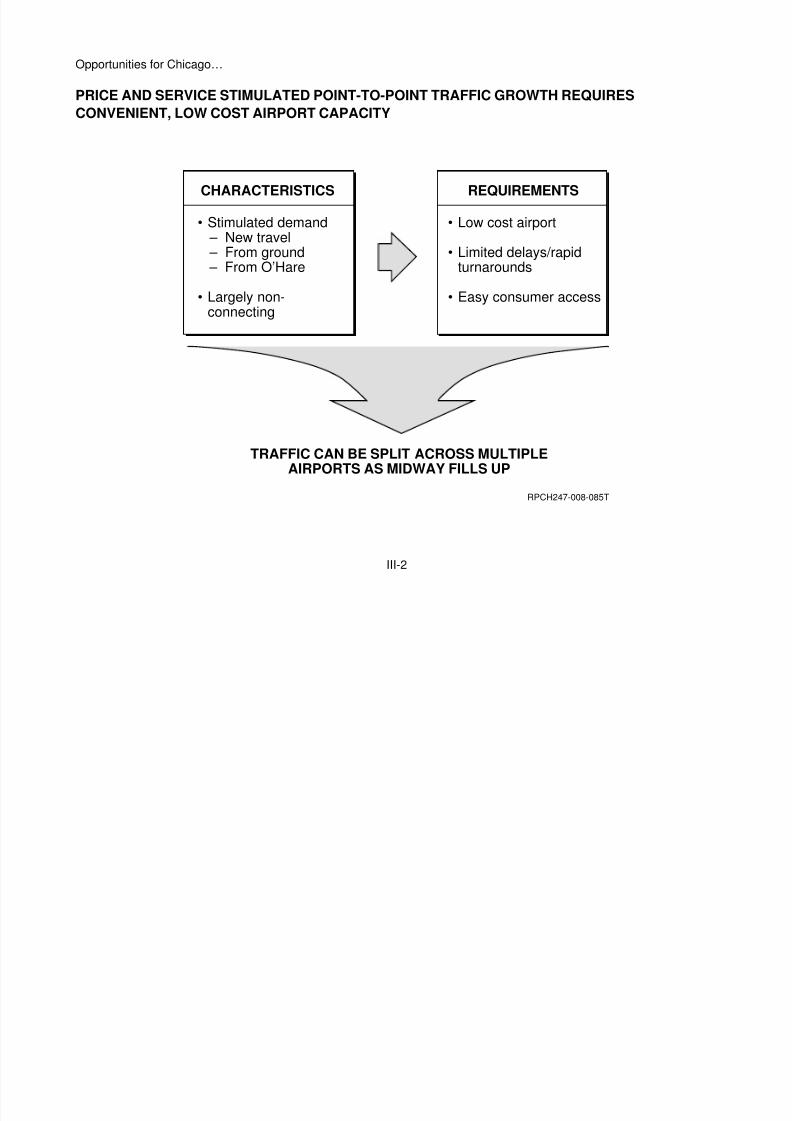
PRICE AND SERVICE STIMULATED POINT-TO-POINT TRAFFIC GROWTH REQUIRESCONVENIENT, LOW COST AIRPORT CAPACITY
RPCH247-008-085T
REQUIREMENTS
•
•
•
Low cost airport
Limited delays/rapidturnarounds
Easy consumer access
CHARACTERISTICS
•
•
Stimulated demand – New travel – From ground – From O’Hare
Largely non-connecting
TRAFFIC CAN BE SPLIT ACROSS MULTIPLEAIRPORTS AS MIDWAY FILLS UP
8/3/2019 Chicago Aviation Policy
http://slidepdf.com/reader/full/chicago-aviation-policy 32/93
III-3F
200,000
400,000
600,000
800,000
1,000,000
1,200,000
1,400,000
RPLA293-008-008BLc.Y
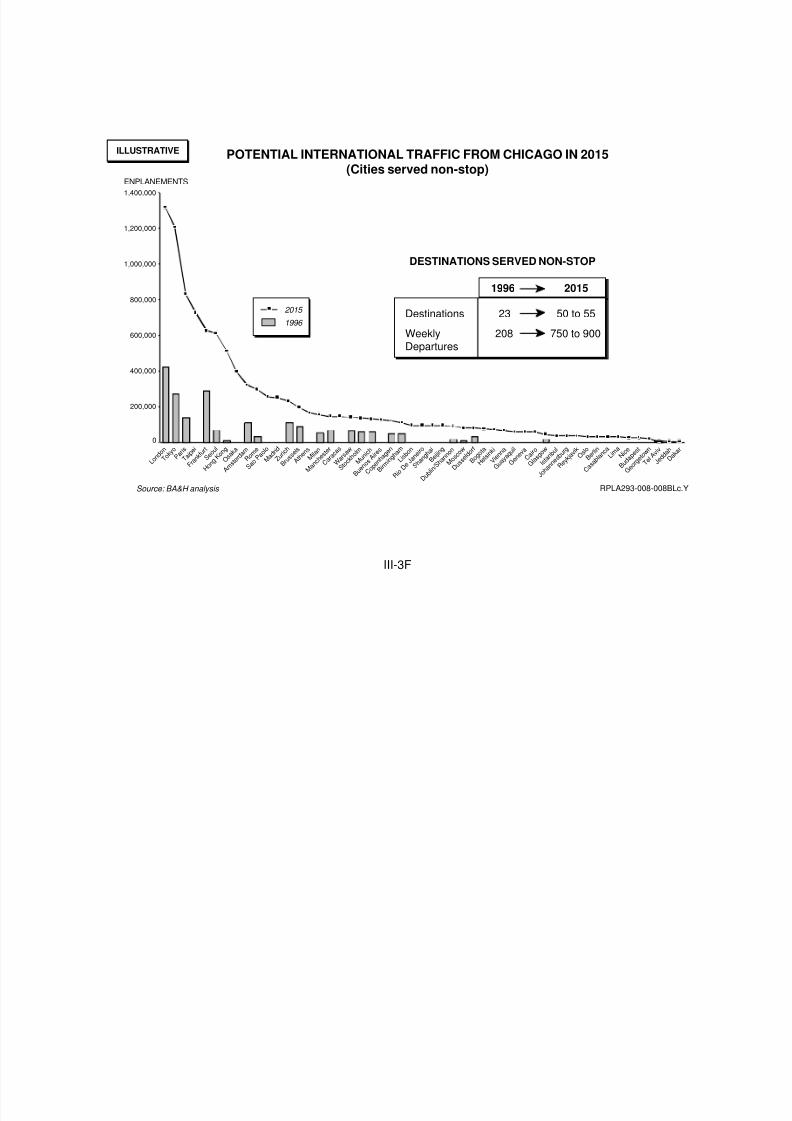
POTENTIAL INTERNATIONAL TRAFFIC FROM CHICAGO IN 2015(Cities served non-stop)
DESTINATIONS SERVED NON-STOP
Destinations
WeeklyDepartures
23
208
50 to 55
750 to 900
1996 2015
2015
1996
L o n d o n T o k
y o P a r i s T a i
p e i
F r a n k f
u r t S e o
u l
H o n g K o
n g O s
a k a
A m s t e r d
a m R o
m e
S a o P a
o l o M a
d r i d Z u r
i c h
B r u s s e
l s A t h e n
s M i l a n
M a n c h
e s t e r
C a r a c
a s
W a r s a
w
S t o c k h o l
m M u
n i c h
B u e n o
s A i r e s
C o p e n
h a g e n
B i r m i n g h a m L i s b o
n
R i o D e
J a n e i
r o
S h a n g h a i
B e i j i n g
D u b l i n / S
h a n n o n M o
s c o w
D u s s e
l d o r f
B o g o t a H e
l s i n k i V i e n n
a
G u a y a
q u i l
G e n e v
a C a
i r o
G l a s g o w I s t a n b
u l
J o h a n n
e s b u r g
R e y k j a v i k
O s l o B e r
l i n
C a s a b
l a n c a L i m a N i c e
B u d a p e
s t
G e o r g e t o
w n
T e l A v i v J e d
d a h D a k a r
ENPLANEMENTS
0
Source: BA&H analysis
ILLUSTRATIVEILLUSTRATIVE

8/3/2019 Chicago Aviation Policy
http://slidepdf.com/reader/full/chicago-aviation-policy 33/93
III-3
Opportunities for Chicago…
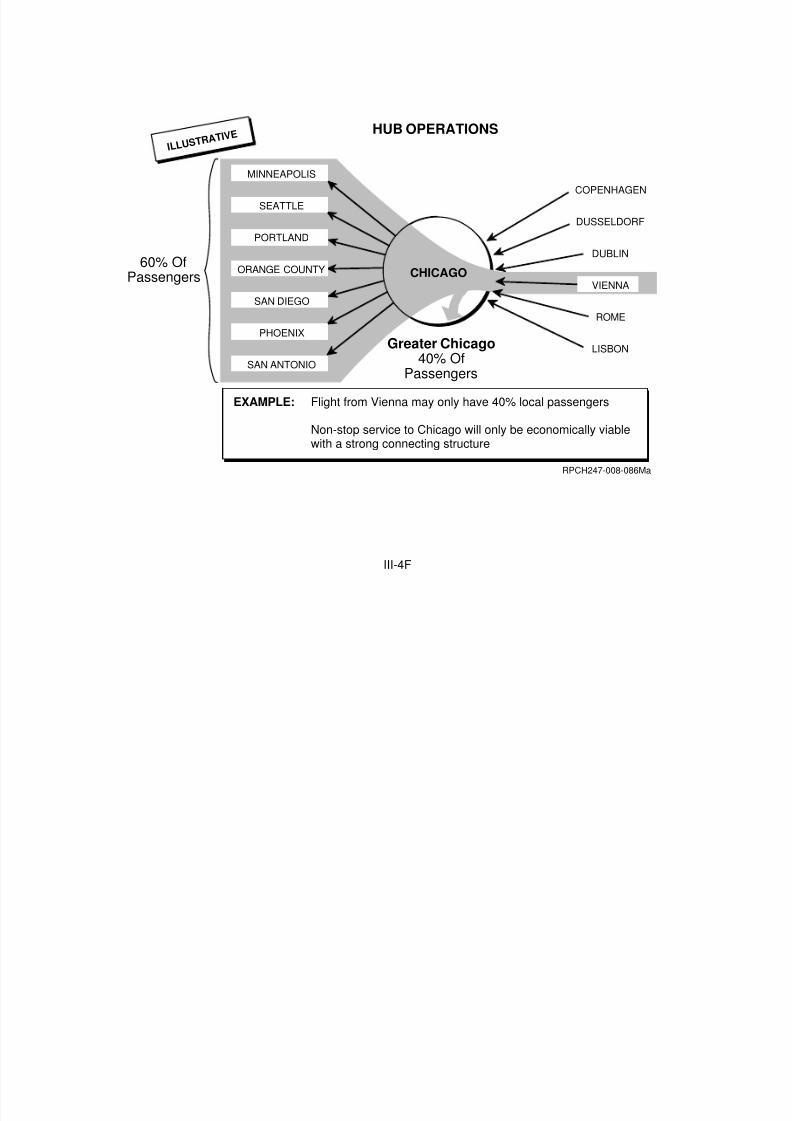
INTERNATIONAL GROWTH IS TIED TO THE EMERGENCE OF CHICAGO AS THEINTERNATIONAL HUB OF THE FUTURE
O’Hare currently has a relatively low share of international traffic to Illinois and nearby states
• Passengers from cities such as Athens, Lisbon, Taipei, and Beijing currently have toconnect via JFK, LAX or cities such as London, Amsterdam, Frankfurt or Tokyo
• Passengers from cities such as Paris, Amsterdam or Seoul are offered limited frequenciesand often choose to connect via other gateways when timings do not suit (or flights are full)
With increased traffic flows and efficient connections to the rest of the USA, a number of other citieswill provide sufficient volumes to justify non-stop services and increased frequencies to Chicago.Capturing a reasonable share of international connections should allow Chicago to regain share toIllinois and nearby states, and emerge as the preferred hub to the USA from a range of destinations(New York and Washington, in particular, provide poor connections as US flights are concentrated atLGA and National, with international arrivals and departures at JFK and Dulles). The facing exhibitshows the forecasted traffic for 2015 between several major international cities and Chicago compared
to the actual traffic between Chicago and those cities in 1996
Such growth will not only create direct airport and travel related employment but also make Chicagomore attractive as a center of international commerce—we estimate that international growth maycontribute an incremental $17B annually to greater Chicago’s economic output by 2015
8/3/2019 Chicago Aviation Policy
http://slidepdf.com/reader/full/chicago-aviation-policy 34/93
III-4F
HUB OPERATIONS I L L U S T R
A T I V E
CHICAGO
EXAMPLE: Flight from Vienna may only have 40% local passengers
Non-stop service to Chicago will only be economically viablewith a strong connecting structure
RPCH247-008-086Ma
60% Of
Passengers
Greater Chicago40% Of
Passengers
COPENHAGEN
DUSSELDORF
DUBLIN
VIENNA
ROME
LISBON
MINNEAPOLIS
SEATTLE
PORTLAND
ORANGE COUNTY
SAN DIEGO
PHOENIX
SAN ANTONIO

8/3/2019 Chicago Aviation Policy
http://slidepdf.com/reader/full/chicago-aviation-policy 35/93
III-4
Opportunities for Chicago…
INTERNATIONAL GROWTH REQUIRES AN EFFECTIVE CONNECTING SYSTEM TO THE REST OFTHE USA
International traffic is highly dependent on connections: flights from medium sized international citiescan carry as much as 80% connecting passengers
In the illustrative example shown opposite, the flight from Vienna may only carry 40% of passengersto Chicago, while the remainder will catch connecting flights to a broad range of North Americandestinations
An effective hub structure will be required to capitalize on growth opportunities from these ‘secondtier’ international origins
Note: New York currently serves many of these cities by virtue of the importance of New York as a trading center -- New York tends to be the first US city served non-stop from European cities despite JFK’s poor connecting structure
8/3/2019 Chicago Aviation Policy
http://slidepdf.com/reader/full/chicago-aviation-policy 36/93
III-5
Opportunities for Chicago…
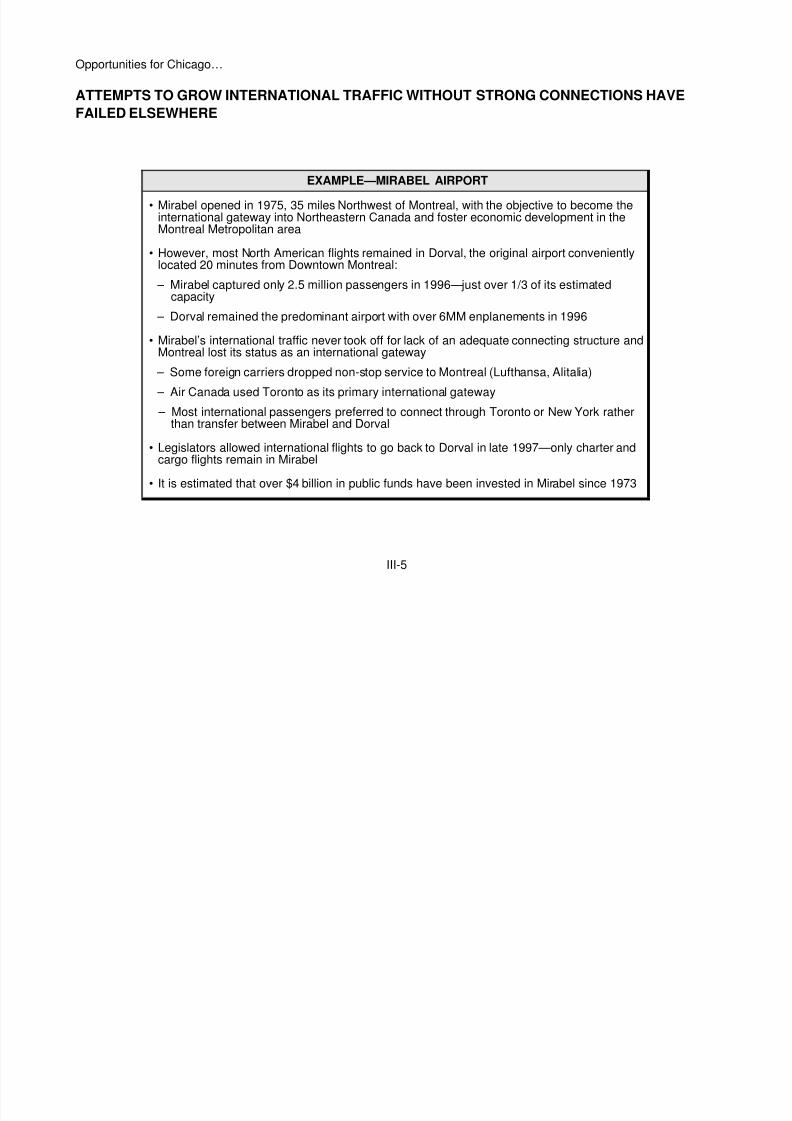
ATTEMPTS TO GROW INTERNATIONAL TRAFFIC WITHOUT STRONG CONNECTIONS HAVEFAILED ELSEWHERE
EXAMPLE—MIRABEL AIRPORT
• Mirabel opened in 1975, 35 miles Northwest of Montreal, with the objective to become theinternational gateway into Northeastern Canada and foster economic development in theMontreal Metropolitan area
• However, most North American flights remained in Dorval, the original airport convenientlylocated 20 minutes from Downtown Montreal:
– Mirabel captured only 2.5 million passengers in 1996—just over 1/3 of its estimatedcapacity
– Dorval remained the predominant airport with over 6MM enplanements in 1996
• Mirabel’s international traffic never took off for lack of an adequate connecting structure andMontreal lost its status as an international gateway
– Some foreign carriers dropped non-stop service to Montreal (Lufthansa, Alitalia)
– Air Canada used Toronto as its primary international gateway
– Most international passengers preferred to connect through Toronto or New York ratherthan transfer between Mirabel and Dorval
• Legislators allowed international flights to go back to Dorval in late 1997—only charter andcargo flights remain in Mirabel
• It is estimated that over $4 billion in public funds have been invested in Mirabel since 1973

8/3/2019 Chicago Aviation Policy
http://slidepdf.com/reader/full/chicago-aviation-policy 37/93

8/3/2019 Chicago Aviation Policy
http://slidepdf.com/reader/full/chicago-aviation-policy 38/93
III-6
Opportunities for Chicago …
SPLIT AIRPORT OPERATIONS HAVE FAILED TO DEVELOP INTO SIGNIFICANT HUBS
Hub operations serve two distinct market segments: passengers traveling to and from the hub cityand passengers connecting through the hub city. These connecting passengers are important forservices to smaller cities where the traffic to the hub city is not sufficient to warrant non-stop services,but where connecting passengers take traffic volumes beyond minimum thresholds. Connectingpassengers also allow higher frequencies to larger cities
Effective hubs therefore tend to have reasonably high proportions of connecting traffic
Such hubs have only been established in cities with a single main airport, or cities with asignificantly smaller secondary point to point airport (e.g. Midway in Chicago or Love Field in Dallas)
Cities with split main airport operations (airports of similar size) have failed to emerge as effectivehubs

8/3/2019 Chicago Aviation Policy
http://slidepdf.com/reader/full/chicago-aviation-policy 39/93
III-7F
WASHINGTON D.C.
(Dulles)
• 1,250-mile perimeter rule on Ronald Reagan National
• Dulles is still not a major international connecting hub
• Domestic traffic system remains concentrated at Ronald Reagan National
NEW-YORK(JFK/Newark)
• Restrictions have split traffic between LaGuardia and JFK/Newark
• Airport system largely focused on local traffic despite prime gateway position
MONTREAL(Mirabel)
• International traffic was diverted from Dorval (downtown airport) to Mirabel(new airport outside Montreal)
• Montreal lost status as an international gateway to Toronto and U.S. cities
MILAN(Malpensa)
• Some 60%–70% of flights are being forced to the newly expanded out-of-townMalpensa airport
PARIS(Charles de Gaulle)
• Historically, split operations between Orly (domestic traffic) and Charles deGaulle (international traffic) have contributed to preventing Paris frombecoming a major international gateway
8/3/2019 Chicago Aviation Policy
http://slidepdf.com/reader/full/chicago-aviation-policy 40/93
8/3/2019 Chicago Aviation Policy
http://slidepdf.com/reader/full/chicago-aviation-policy 41/93
III-8
Opportunities for Chicago…
IF O’HARE IS ARTIFICIALLY CONSTRAINED IT WILL LOSE CONNECTING TRAFFIC ANDSERVICES TO SMALL/MEDIUM CITIES, AND CAPTURE LESS INTERNATIONAL GROWTH
O’Hare can support increased traffic growth even if it is constrained
• International traffic growth can continue with larger aircraft displacing domesticservices with smaller aircraft if necessary
• Similarly, much of the domestic growth to cities currently served can beaccommodated by switching to larger aircraft
Economic incentives will ensure that domestic connecting traffic and services to small/mediumcommunities are the first to be reduced when operational constraints are encountered
• Domestic connecting traffic is significantly less profitable than local or internationaltraffic plus connecting traffic can be served over a range of less-constrained U.S.hubs
• Small/medium sized cities tend to be the first to lose service as aircraft operationsare restricted, in part as they can be more reliant on connecting traffic
As constraints become severe, the economic incentive to grow Chicago’s share of internationaltraffic will however diminish
• Opportunity cost of O’Hare take-off and landing opportunities increases• There is less incentive for airlines to focus international growth investments on Chicago

8/3/2019 Chicago Aviation Policy
http://slidepdf.com/reader/full/chicago-aviation-policy 42/93
III-9
Opportunities for Chicago…
PEOTONE WOULD LIKELY BE COMPETITIVELY DISADVANTAGED IN CAPTURING SPILLEDTRAFFIC FROM O’HARE—TRAFFIC WILL BE LOST TO OTHER U.S. HUBS AND GATEWAYS
Consumers displaced from O’Hare would have little incentive to select Peotone as their alternative
• Domestic connecting passengers have a large range of choices (e.g. Detroit, Minneapolis,Dallas, Denver, Cleveland, St. Louis – a range of choices which will increase with thepenetration of regional jets)
• Displaced local traffic will be from the most “marginal origins” that can only be served by afully fledged hub, since those cities require extensive connecting volumes to support anyservice
• Similarly, “spilled” international traffic will be from the smaller international origins whichrequire extensive connections to support a service- and hence will connect elsewhere
If built, Peotone would unlikely develop into a hub
• Hubs are highly dependent on a strong local traffic base - but few Chicago basedconsumers are likely to select Peotone as their preferred airport. Only 10% of Chicago’spopulation live closer to Peotone than Midway and only 19% live closer to Peotone thanO’Hare (1)
• Peotone would be competitively disadvantaged with an established O’Hare hub and asubstantial low-price operation at Midway
• There is no undersupply of hubs in the USA—in fact, airlines have been shutting downsome weaker hubs (especially where the local traffic base was limited, such as Raleigh-Durham, Nashville and San Jose)
Note: (1) Based on a catchment area of 50 miles around each airport

8/3/2019 Chicago Aviation Policy
http://slidepdf.com/reader/full/chicago-aviation-policy 43/93
III-10
Opportunities for Chicago…
BECAUSE HUB TRAFFIC IS NOT DIVISIBLE OR TRANSFERABLE ACROSS AIRPORTS, A SINGLESTRONG HUB IS A REQUIREMENT FOR BUILDING INTERNATIONAL TRAFFIC AND SUSTAININGCHICAGO’S PREMIER POSITION AS A TRANSPORTATION CENTER
A strong hub will be required to capture significant international growth
• Second-tier international cities have limited local Chicago traffic and are highlydependent on effective connections
• Capturing share from first-tier international cities will require higher frequencies tomatch time table choices over alternative gateways
An attempt to create a second hub in Chicago will likely require artificial restrictions such as aperimeter rule or a reallocation of international traffic
However, as experiences elsewhere have shown, this will likely result in local US traffic beingconcentrated at O’Hare and longer-haul, international traffic being forced to Peotone: the result would bea split airport operation with poor international and domestic connections, much like Washington andNew York
Chicago would thus be unable to capitalize on the opportunity to emerge as the preferredinternational hub, limiting direct international and long-haul domestic services primarily to local traffic
The regions economic growth would suffer with fewer aviation related jobs and Chicago would beless attractive as a center for international business

8/3/2019 Chicago Aviation Policy
http://slidepdf.com/reader/full/chicago-aviation-policy 44/93
III-11F
RPCH247-008-098TTT
ACG/TAMS ENPLANEMENT FORECASTS(In Millions)
Notes:
Source:
(1) ACG/TAMS Needs Assessment and Enplanement Forecasts (July, 1994)(2) ACG/TAMS Economic Impact Assessment (April, 1995)(3) Includes the domestic leg of international enplanements ACG/TAMS
O’HARE
International
Connecting
Local
Total
2001 2010 2020
4.4
15.1
15.7
35.2
5.8
16.9
18.0
40.7
7.0
17.1
20.1
44.2
MIDWAY
International
Connecting
Local
Total
2001 2010 2020
0.1
1.3
3.1
4.5
0.2
1.6
4.9
6.7
0.3
1.9
5.9
8.1
(1) (1)
(3) (3)
PEOTONE
International
Connecting
Local
Total
2001 2010 2020
1.6
3.7
1.8
6.1
4.9
8.7
4.3
17.9
11.1
12.3
7.3
30.7
(2)
(3)

8/3/2019 Chicago Aviation Policy
http://slidepdf.com/reader/full/chicago-aviation-policy 45/93
III-11
Opportunities for Chicago …
ENPLANEMENT PROJECTIONS DEVELOPED IN 1994/95 FOR PEOTONE APPEAR TO BE QUITEOPTIMISTIC
KEY ISSUES WITH SOUTH SUBURBAN AIRPORT FORECASTS
OVERALL TRAFFIC • Forecasts assume that traffic is transferable across airports
INTERNATIONALTRAFFIC
• Restrictions on O’Hare would be necessary for Peotone to captureinternational traffic
• Splitting international traffic between airports would weaken Chicago’s hubposition—reducing total traffic volumes
• It is unlikely that 60% of Chicago’s international traffic would be captured byPeotone—international traffic will be attracted to the airport with the strongestdomestic connecting structures, or largely be lost to other hubs
CONNECTINGTRAFFIC
• Connections require an integrated hub
• Connections displaced at O’Hare would be lost to other U.S. hubs (see pageIII-9)
LOCAL TRAFFIC • The local Peotone traffic volumes projected would likely require restrictionson Midway

8/3/2019 Chicago Aviation Policy
http://slidepdf.com/reader/full/chicago-aviation-policy 46/93
III-12
Opportunities for Chicago …
IN SUMMARY:
DO DON’T
• Expand hub capacity to captureinternational traffic
• Meet local demand by adding capacityat Midway and other regional airports
• Focus O’Hare on scheduled operationsintegral to the hub
• Artificially constrain O’Hare
• Attempt to divert “hub” traffic betweenairports

8/3/2019 Chicago Aviation Policy
http://slidepdf.com/reader/full/chicago-aviation-policy 47/93
IV. OPTIONS

8/3/2019 Chicago Aviation Policy
http://slidepdf.com/reader/full/chicago-aviation-policy 48/93
IV-1
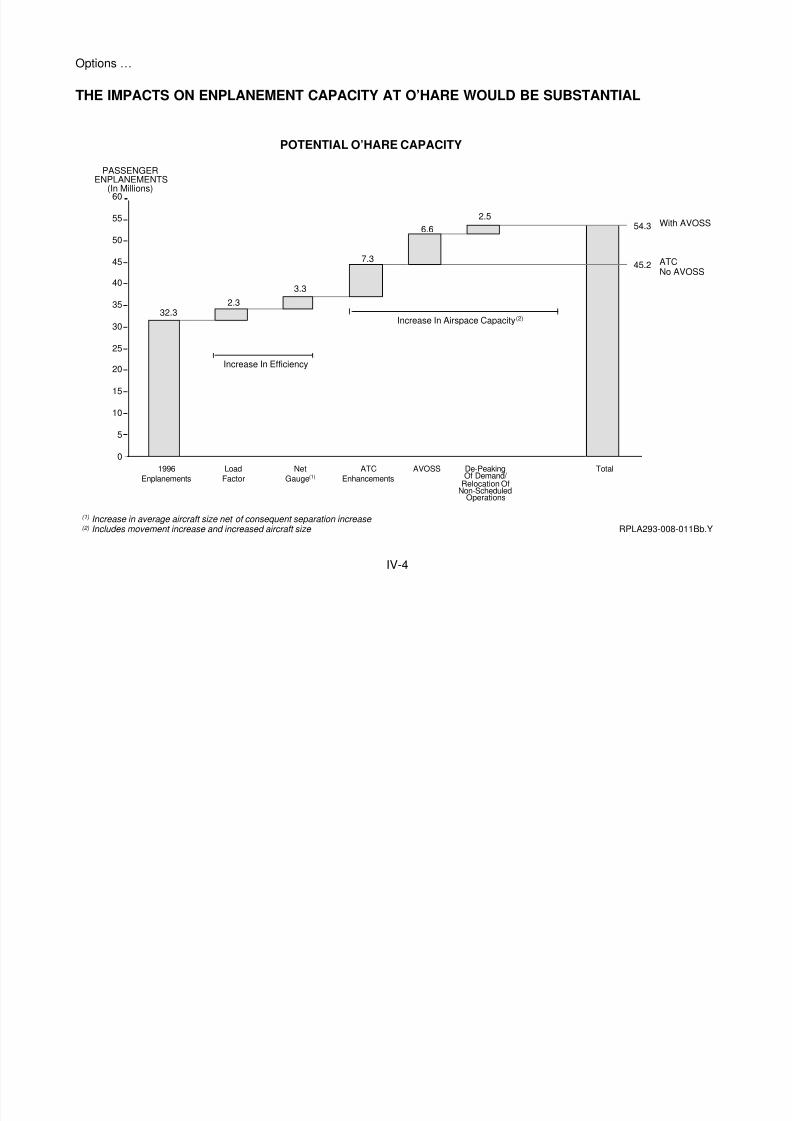
Options …
THUS, THERE ARE TWO KEY IMPERATIVES FOR CHICAGO
• Capture international traffic growth
• Connect both domestic and internationaltraffic
• Maintain domestic service level
• Capture international traffic growth
• Connect both domestic and internationaltraffic
• Maintain domestic service level
• Provide broad, low-price, local service
• Extend price discipline to as manydestinations as possible
• Generate price-stimulated demand
• Capture local overflow from hub
• Support services from convenientlylocated airport(s)
• Provide broad, low-price, local service
• Extend price discipline to as manydestinations as possible
• Generate price-stimulated demand
• Capture local overflow from hub
• Support services from convenientlylocated airport(s)
RATIONALE
MAINTAIN ONE STRONG HUB
ENSURE THERE IS SUFFICIENT SECONDARY
POINT-TO-POINT CAPACITY
1.
2.
RPCH247-008-083T

8/3/2019 Chicago Aviation Policy
http://slidepdf.com/reader/full/chicago-aviation-policy 49/93

8/3/2019 Chicago Aviation Policy
http://slidepdf.com/reader/full/chicago-aviation-policy 50/93
IV-2
Options …
ALTHOUGH O’HARE WILL OBVIOUSLY BE CAPACITY-CONSTRAINED AT SOME POINT, THEREIS SIGNIFICANT POTENTIAL FOR GROWTH
General aviation, air taxi, cargo and military services account for some 8% of operations and aportion can be relocated elsewhere without damaging O’Hare’s primary mission
Average aircraft size can be raised. Both American and United Airlines are buying larger aircraft fortheir domestic systems and both have the ability to utilize larger aircraft from other parts of their systemsas traffic growth warrants. The proportionally higher growth of international traffic will also raise averageaircraft size
There is also potential to raise load factors, especially on flights where aircraft are currentlyoversized
In addition, significant air traffic control developments can allow existing airspace to be moreeffectively utilized and increase the throughput capacity of existing airspace and runways—examplesshown on the following page

8/3/2019 Chicago Aviation Policy
http://slidepdf.com/reader/full/chicago-aviation-policy 51/93
IV-3F
BOTTLENECK TECHNOLOGY (1) DESCRIPTION AND STATUS
Aircraft Arrivals ToApproach Path
CAP(Compressed ArrivalProcedures)(+8%)
• Ensure aircraft arrive at the approach path at the capacityof the runways
• Extensively used at Dallas and Denver, in testing phase forChicago
Sequencing ofAircraft To UseRunway CapacityEffectively
CTAS(Center/TRACONAutomation System)(+10%)
• System sequences aircraft to minimize landing slot losses
• Testing in Dallas and Denver began in 1992. More generalavailability is expected within 5 years
• Landings at Dallas were increased 10–14% in 1996 tests
Distance betweenAircraft Because OfTurbulence
AVOSS(Aircraft Vortex SpacingSystem)(+15-30%)
• Predict and detect vortex turbulence
• Reduce separations and select an approach path avoidingvortex
• Increase aircraft size without penalty of increasedseparation (+15%)
• May allow increased arrival rates—not factored (+15%)
• Elements now being tested, with live demonstrationexpected in Dallas in 2000
• Eurocontrol expects the technology to be available by 2010
Note: (1) A range of other procedure/technology enhancements can improve operations, principally affecting ‘bad weather’ throughput

8/3/2019 Chicago Aviation Policy
http://slidepdf.com/reader/full/chicago-aviation-policy 52/93
IV-3
Options…
TECHNOLOGY DEVELOPMENTS OVER THE NEXT 10–20 YEARS MAY INCREASE PEAK-HOURTHROUGHPUT AT O’HARE BY 30%–40%
There are three principal airspace bottlenecks at O’Hare:
(1) An inability to ensure that aircraft arrive at the approach paths at the rate that therunways can accept them
(2) An inability to sequence aircraft in an efficient manner—a small aircraft following alarge aircraft will require a greater separation than a large aircraft following anotherlarge aircraft. The more random the sequencing of aircraft, the greater theseparation losses
(3) Minimum separation levels reflect a current lack of understanding and predictingcapability of turbulence behind aircraft (wake vortex)
As outlined in the facing page, technology and procedures to alleviate the first two bottlenecks arequite advanced. Wake vortex developments to address the third bottleneck are less advanced but mayreasonably be expected within a 10–15 years time frame: relatively conservative assumptions on theimpact of this third technology development have been used in this evaluation
8/3/2019 Chicago Aviation Policy
http://slidepdf.com/reader/full/chicago-aviation-policy 53/93
8/3/2019 Chicago Aviation Policy
http://slidepdf.com/reader/full/chicago-aviation-policy 54/93
IV-5
Options …
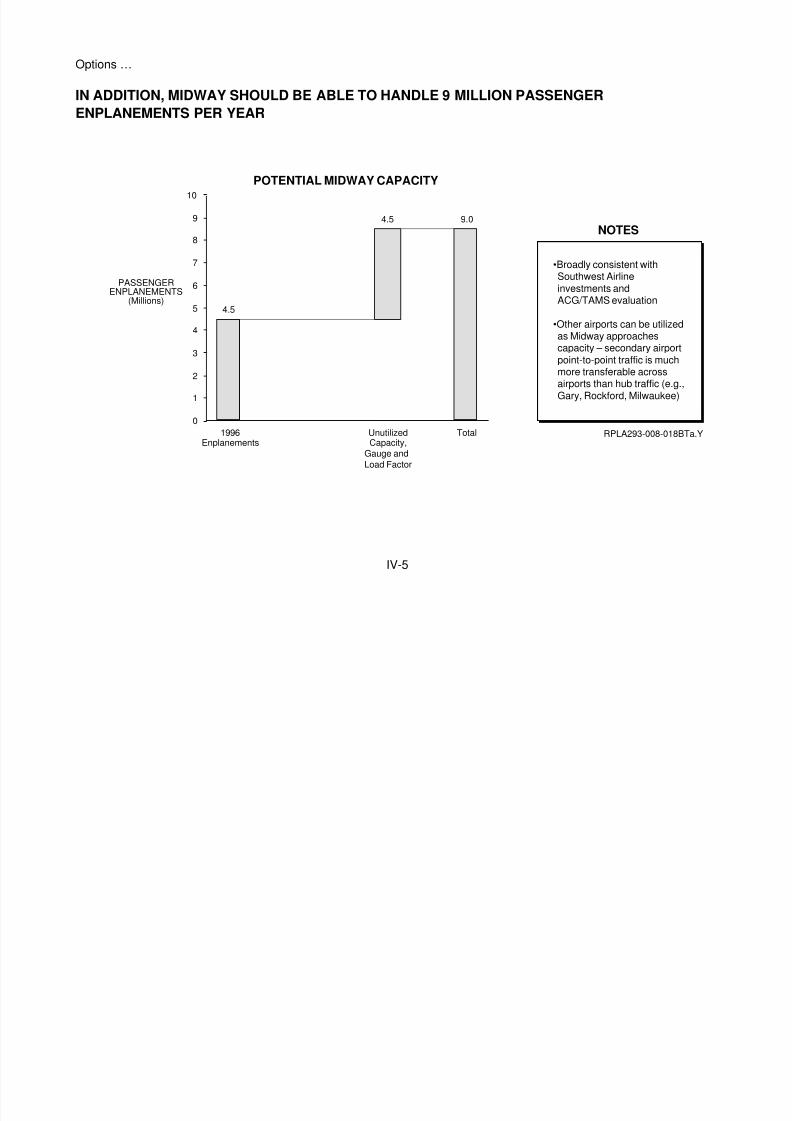
IN ADDITION, MIDWAY SHOULD BE ABLE TO HANDLE 9 MILLION PASSENGERENPLANEMENTS PER YEAR
PASSENGERENPLANEMENTS(Millions)
4.5
4.5 9.0
0
1
2
3
4
5
6
7
8
9
10
1996Enplanements
UnutilizedCapacity,
Gauge andLoad Factor
Total
POTENTIAL MIDWAY CAPACITY
NOTES
RPLA293-008-018BTa.Y
•Broadly consistent withSouthwest Airlineinvestments andACG/TAMS evaluation
•Other airports can be utilizedas Midway approachescapacity – secondary airportpoint-to-point traffic is muchmore transferable acrossairports than hub traffic (e.g.,Gary, Rockford, Milwaukee)

8/3/2019 Chicago Aviation Policy
http://slidepdf.com/reader/full/chicago-aviation-policy 55/93
IV-6F
RPLA293-008-012Lc.Y
SUPPLY AND DEMAND BALANCE AT O’HARE
30
40
50
60
70
1996 2000 2005 2010 2015 2020
32.3
37.9
45.2
51.854.3
32.3
60.5
54.3
48.1
42.3
36.7
ENPLANEMENTS(Millions)
Demand
1996
De-Peaking of Demand/Relocationof Non-Scheduled Operations
AVOSS
ATC Enhancements
Increasing Efficiency••
Load factorNet gauge
POTENTIALADDITIONALO’HARECAPACITY

8/3/2019 Chicago Aviation Policy
http://slidepdf.com/reader/full/chicago-aviation-policy 56/93
IV-6
Options …
EFFECTIVE UTILIZATION OF O’HARE, MIDWAY, AND OTHER REGIONAL AIRPORTS SYSTEMMAY CAPTURE MOST TRAFFIC DEMAND TO 2015/2020
Successful implementation of ATC technologies (including conservative use of AVOSS) shouldallow O’Hare, Midway and regional airports to satisfy demand growth until 2015
• International traffic increases five fold, O’Hare serving 50-55 destinations• Domestic growth at O’Hare largely accommodated through aircraft size
• Point-to-point traffic at Midway and other regional airports doubles
• Services to new domestic destinations added (O’Hare)
By 2020 such an airport system would become constrained, resulting in subsequent:
• Loss of connecting traffic to alternative hubs
• Reduction in international traffic growth and at the expense of domestic services
• Services to “new” destinations crowded out
Sometime over the next 15–20 years, runway capacity will need to be added to meetmarket and service requirements for the next century

8/3/2019 Chicago Aviation Policy
http://slidepdf.com/reader/full/chicago-aviation-policy 57/93
IV-7
Options …
ARTIFICIALLY CONSTRAINING O’HARE COULD COST GREATER CHICAGO $8-$10 BILLION PERYEAR BY 2015 IN ECONOMIC OUTPUT
RPLA293-008-019Ta.Y
ANNUAL OPPORTUNITY COST OF CONSTRAINING O’HARE(2015)
•
•
Lost opportunity for internationalgrowth – other regions develop as the
principal international hubs and gainprominence as “magnets” ofinternational commerce
Reduction in service levels to U.S.destinations
– Fewer frequencies – Fewer cities served
DRIVERS OF ECONOMIC LOSS
Preventing O’Hare from developing into an
international hub and gateway would cost Chicago's economy
estimated $8-$10B annually in economic output by 2015
The overall value of economic growth to greater Chicago is estimated of $26 billion annually ineconomic output by 2015. The above estimate assumes that O’Hare is movement constrained, thatsome growth is accommodated through aircraft size, that Midway grows and that Peotone is built(scenario 2 in next chapter)
8/3/2019 Chicago Aviation Policy
http://slidepdf.com/reader/full/chicago-aviation-policy 58/93
IV-8
Options …
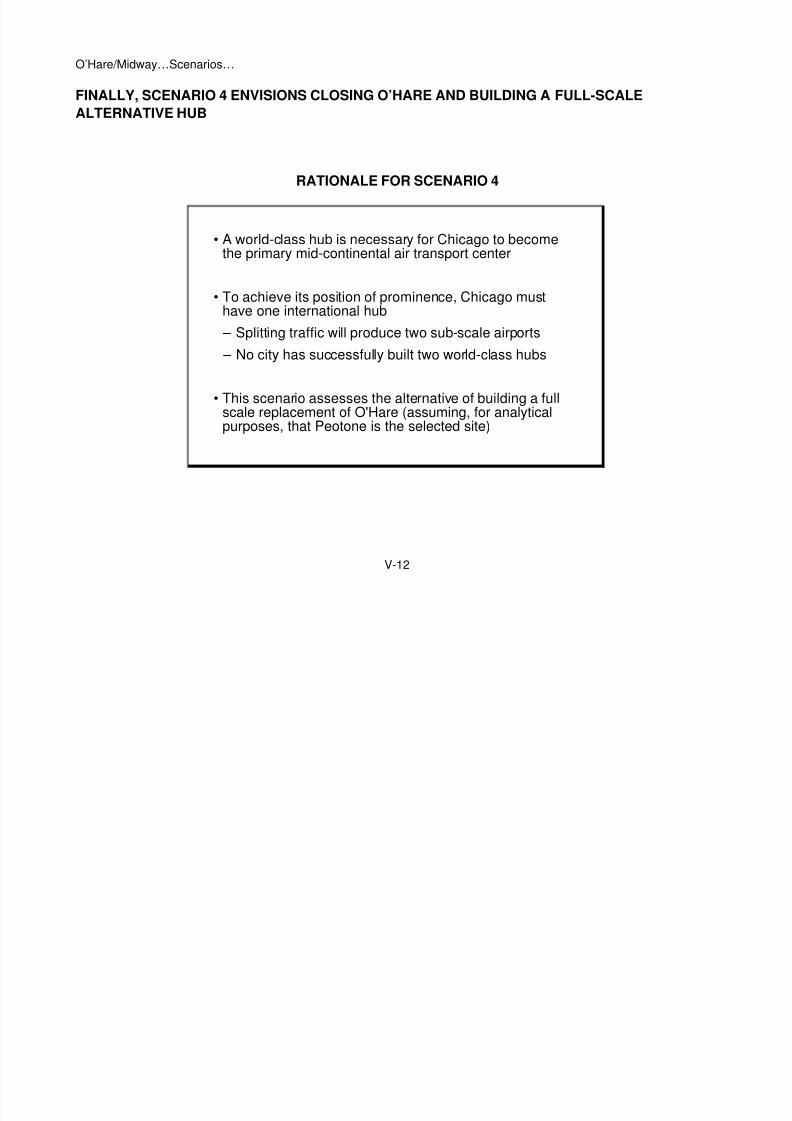
THERE IS NO VIABLE OR FORESEEABLE ALTERNATIVE TO EXPANDING O'HARE
A world-class hub is necessary for Chicago to become the primary mid-continental air transportcenter. Chicago can have only one world-class hub
• Splitting traffic will produce two sub-scale airports• No city has successfully built two world-class hubs
O’Hare can become the mid-continental hub with moderate increases in operations
• Maintain robust domestic network• Increase international operations• Transfer non-essential operations to other airports
By 2015–2020 the Chicago airport systems will likely become constrained. Sometime during thenext 15–20 years, runway capacity will need to be added to meet market and service requirements forthe next century.

8/3/2019 Chicago Aviation Policy
http://slidepdf.com/reader/full/chicago-aviation-policy 59/93
V. IMPORTANCE OF O’HARE AND MIDWAY TO THEIRRESPECTIVE VICINITIES

8/3/2019 Chicago Aviation Policy
http://slidepdf.com/reader/full/chicago-aviation-policy 60/93
V-1
This section quantifies the economic consequences of alternative airport strategies for the O’Hareand Midway vicinities, assuming for analytical purposes that Peotone is the selected site for additionalairport capacity. The chapter is subdivided into the following sections:
• Current Economic Impact
• Scenarios
• Implications

8/3/2019 Chicago Aviation Policy
http://slidepdf.com/reader/full/chicago-aviation-policy 61/93
V-2F
• ••
•
•
•Aurora
Joliet
Chicago
Peotone
•
•
Oaklawn
Elgin
WheatonOak Park
Arlington HeightsEvanston
Elk Grove
•Grayslake
•Vernon Hills
•Woodstock
• Crystal Lake
•Burbank
•OakForest
•Addison
•Naperville
•Antioch
•
•Harvard
•Geneva
•
•
O’Hare •Des Plaines
• Skokie
•Cicero •Midway
Waukegan
Lake Forest
Highland Park
•
RATIONALE FOR THE DEFINITIONOF THE O’HARE REGION
RATIONALE FOR THE DEFINITIONOF THE O’HARE REGION
Notes:
Sources: RPLA293-008-036Map
MidwayPopulation: 0.52
Employment: 0.14Median Income: $32
MidwayPopulation: 0.52
Employment: 0.14Median Income: $32
GREATER CHICAGO DEMOGRAPHICS(Population and Employment in Millions; Median Income in Thousands)
Median income refers to the median annual household income; O’Hare direct employees include: airline and airline related personnel, passenger service personnel, ground transportation personnel to/from O’Hare Census Bureau,1990; Zip Code Business Patterns,1994; BA&H analysis
DowntownPopulation: 2.00
Employment: 0.96Median Income: $31
DowntownPopulation: 2.00
Employment: 0.96Median Income: $31
Northern RegionPopulation: 0.72Employment: 0.27Median Income: $50
Northern RegionPopulation: 0.72Employment: 0.27Median Income: $50
Southern RegionPopulation: 1.63
Employment: 0.42Median Income: $39
Southern RegionPopulation: 1.63
Employment: 0.42Median Income: $39
O’HarePopulation: 2.40
Employment: 1.51Median Income: $47
O’HarePopulation: 2.40
Employment: 1.51Median Income: $47
• The exact definition of the area (zipcode by zip code) is based on theresidential location of thepersonnel directly employed atO’Hare
• The region extends 20-25 milesnorth and west of O’Hare andincludes 35% of O’Hare directemployees
• 38% of direct employees live in theChicago downtown area and 21%outside of the 6-County region

8/3/2019 Chicago Aviation Policy
http://slidepdf.com/reader/full/chicago-aviation-policy 62/93
V-2
O’Hare/Midway…Current Economic Impact…
FOR EVALUATION PURPOSES, GREATER CHICAGO HAS BEEN DIVIDED INTO FIVE ECONOMICREGIONS, THE O’HARE VICINITY EXTENDING 20-25 MILES NORTH AND WEST OF O’HARE
MAJOR ECONOMIC REGIONS
REGION COVERAGEPOPULATION
(MILLIONS)EMPLOYMENT
(MILLIONS)
ChicagoDowntown
• Chicago Central Business District• Bounded South by Garfield Boulevard• Bounded West by Highway 43• Bounded North by Touhy Avenue
2.00 0.96
O’Hare VicinityArea
• Northern and Western suburbs of Chicago• Includes the first set of townships in Lake and Kane
Counties
2.40 1.51
Midway Vicinity • Adjacent portion of Chicago and the suburbs centeredaround Midway airport (e.g., Burbank, Bridgeview, Summit,Oak Lawn)
0.52 0.14
Northern OuterSuburbs
• Includes the first set of townships along the lake shore northof Chicago
• McHenry, Lake and Kane Counties• Up to the county boundaries (McHenry, Lake, and DuPage)
0.72 0.27
Southern Suburbs • Will County and portion of Cook not already included in theMidway vicinity or Chicago Downtown
1.63 0.42
TOTAL GREATER CHICAGO (6-County Region) 7.27 3.30
8/3/2019 Chicago Aviation Policy
http://slidepdf.com/reader/full/chicago-aviation-policy 63/93
V-3
O’Hare/Midway…Current Economic Impact…
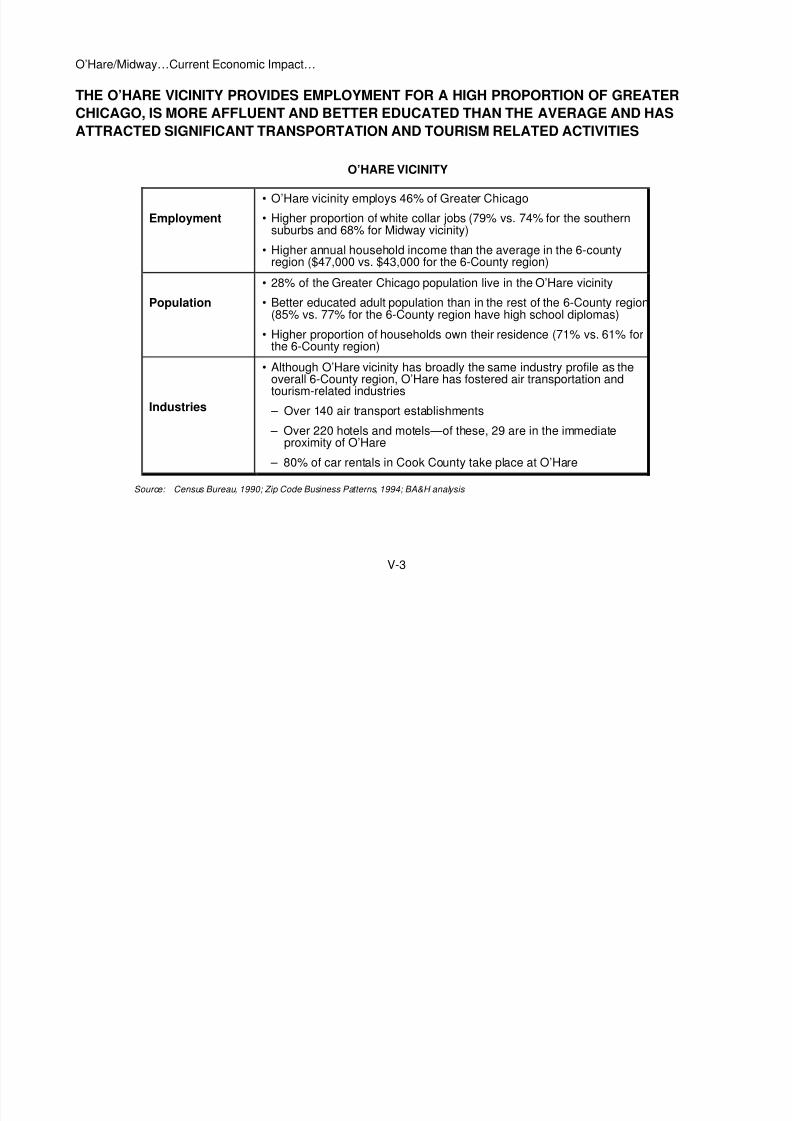
THE O’HARE VICINITY PROVIDES EMPLOYMENT FOR A HIGH PROPORTION OF GREATERCHICAGO, IS MORE AFFLUENT AND BETTER EDUCATED THAN THE AVERAGE AND HASATTRACTED SIGNIFICANT TRANSPORTATION AND TOURISM RELATED ACTIVITIES
O’HARE VICINITY
Employment
• O’Hare vicinity employs 46% of Greater Chicago
• Higher proportion of white collar jobs (79% vs. 74% for the southernsuburbs and 68% for Midway vicinity)
• Higher annual household income than the average in the 6-countyregion ($47,000 vs. $43,000 for the 6-County region)
Population• 28% of the Greater Chicago population live in the O’Hare vicinity• Better educated adult population than in the rest of the 6-County region
(85% vs. 77% for the 6-County region have high school diplomas)
• Higher proportion of households own their residence (71% vs. 61% forthe 6-County region)
Industries
• Although O’Hare vicinity has broadly the same industry profile as theoverall 6-County region, O’Hare has fostered air transportation andtourism-related industries
– Over 140 air transport establishments
– Over 220 hotels and motels—of these, 29 are in the immediateproximity of O’Hare
– 80% of car rentals in Cook County take place at O’Hare
Source: Census Bureau, 1990; Zip Code Business Patterns, 1994; BA&H analysis

8/3/2019 Chicago Aviation Policy
http://slidepdf.com/reader/full/chicago-aviation-policy 64/93
V-4F
Note:
Source:
(1) The analysis only includes the primary economic effect of access-sensitive employment.There will be induced economic effects but appropriate multipliers and geographic distribution of impact are not available at this point. This simplifying assumption is consistent with the analysis of ACG/TAMS
BA&H analysis
RPCH247-008-070Tb
GEOGRAPHICAL DISTRIBUTION OF O’HARE ECONOMIC IMPACT
DIRECTIMPACT(Airport AndTenants)
INDIRECTIMPACT(ChicagoVisitors)
ACCESS-SENSITIVEIMPACT
Created In O’Hare Vicinity Legend:
PRIMARY EFFECT INDUCED EFFECT
•
•
Created throughout greater Chicagobased on the residential location of thepeople directly employed at O’HareApproximately 35% of this inducedemployment created in the O’Harevicinity
•
•
Created throughout greater Chicagobased on the residential location of thepeople employed by the tourism industryApproximately 32% of this inducedemployment created in the O’Harevicinity
• Created entirely in the vicinity ofO’Hare (approximately 50,000 jobs)
•
•
Based on location of expenditures ofChicago’s visitorsApproximately 38% of visitorexpenditures estimated to be made inO’Hare vicinity (~35,000 jobs)
••
Created in the vicinity of O’HareAssumes 90,000-180,000 access-sensitive jobs
(1)

8/3/2019 Chicago Aviation Policy
http://slidepdf.com/reader/full/chicago-aviation-policy 65/93
V-4
O’Hare/Midway…Current Economic Impact…
O’HARE “RETAINS” 60–75% OF ITS ECONOMIC CONTRIBUTION TO GREATER CHICAGO IN ITSVICINITY
RPLA293-008-013BBBb.Y
IMPACT OF O’HARE ON ITS VICINITY(1997)
365–455,000
220–310,000
Created InGreaterChicago
Created InThe O’Hare
Vicinity(2)
$8.4–10.6
$5.9–8.1
$27–34
$19–26
EMPLOYMENT ANNUAL INCOME(Billions)
ANNUAL ECONOMIC OUTPUT(Billions)
61–68% 70–76% 70–76%
Created InGreaterChicago
Created InThe O’Hare
Vicinity(2)
Created InGreaterChicago
Created InThe O’Hare
Vicinity(2)
(1)(2)
Sources:
Employment figures based on where people work As defined on Page V-2F NERA (1993), ACG/TAMS (1995), REAL (1997), BA&H analysis
(1)

8/3/2019 Chicago Aviation Policy
http://slidepdf.com/reader/full/chicago-aviation-policy 66/93
V-5
O’Hare/Midway…Current Economic Impact…
OVERALL, 15–20% OF THE O’HARE REGION 1.5 MILLION EMPLOYMENT IS GENERATED BYTHE AIRPORT
EMPLOYMENT GENERATED BY O’HARE IN ITS VICINITY
RPCH247-008-042TMAP
• ••
•
•
•Aurora
Joliet
Chicago
Peotone
•
•
Oaklawn
Elgin
WheatonOak Park
Arlington Heights Evanston
Elk Grove
•Grayslake
•Vernon Hills•Woodstock
• Crystal Lake
•Burbank
•OakForest
•Addison
•Naperville
•Antioch
•
•Harvard
•Geneva
•
•
O’Hare •Des Plaines
• Skokie
•Cicero •Midway
Waukegan
Lake Forest
Highland Park O’Hare VicinityEmployment
Employment GeneratedBy O’Hare In O’HareVicinity
1.5 Million
220-310Thousand
NERA (1993), ACG/TAMS (1995), REAL (1997), BA&H analysis Sources:
• Percentage Of O’HareVicinity Employment
15-21%

8/3/2019 Chicago Aviation Policy
http://slidepdf.com/reader/full/chicago-aviation-policy 67/93
V-6F
ANNUAL ECONOMIC IMPACT OF MIDWAY(1997)
ECONOMICIMPACT DRIVER DIMENSION
EMPLOYMENT(THOUSANDS)
INCOME(MILLIONS)
ECONOMICOUTPUT
(BILLIONS)
Direct Impact(Airport andTenants)
• Airlines: approximately 2,600airline personnel based atMidway (includes flightattendants)
• Passenger services at the airport
14 $340 $1.2
Indirect Impact(Chicago Visitors) • 1.4M business visitors spendapproximately $1.0B annually inGreater Chicago
• 0.6M leisure visitors spendapproximately $0.2B annually inGreater Chicago
29 $530 $1.6
Access-SensitiveImpact
• Includes businesses located inChicago and around Midway foreasy airport access
16 $370 $1.2
Total Economic Impact 59 $1,240 $4.0
Source: NERA (1993), ACG/TAMS (1995), REAL (1997), BA&H analysis

8/3/2019 Chicago Aviation Policy
http://slidepdf.com/reader/full/chicago-aviation-policy 68/93
V-6
O’Hare/Midway…Current Economic Impact…
SIMILARLY, MIDWAY CONTRIBUTES SOME 60,000 JOBS AND APPROXIMATELY $4 BILLION TOTHE GREATER CHICAGO ECONOMY, AND RETAINS 40–50% OF THIS ECONOMIC VALUE IN ITSVICINITY
RPLA293-008-014BBBa.Y
IMPACT OF MIDWAY ON GREATER CHICAGO ECONOMY(1997)
59
25
Created InGreaterChicago
Created InThe Midway
Vicinity(2)
$1.24
$0.64
$4.0
$2.1
EMPLOYMENT(Thousands)
ANNUAL INCOME(Billions)
ANNUAL ECONOMIC OUTPUT(Billions)
42% 52% 53%
Created InGreaterChicago
Created InThe Midway
Vicinity(2)
Created InGreaterChicago
Created InThe Midway
Vicinity(2)
Notes:
Source:
(1) Employment figures based on where people work (2) As defined on Page V-2F NERA (1993), ACG/TAMS (1995), REAL (1997), BA&H analysis
(1)

8/3/2019 Chicago Aviation Policy
http://slidepdf.com/reader/full/chicago-aviation-policy 69/93
V-7
O’Hare/Midway……Scenarios…
FOUR SCENARIOS HAVE BEEN DEVELOPED TO ASSESS LONG-TERM ECONOMIC IMPACTS OFALTERNATIVE AIRPORT STRATEGIES
RPLA293-008-015TH
• Accommodated growth at O’Hare• Midway grows; other regional airports are expanded to
capture point-to-point traffic overflow as Midway approachescapacity (assumed at 9.0 million enplanements p.a.)
No increase in operations at O’Hare (910,000 operations in 1996),with restraints placed on the airport and the airlines
Increase in average gauge and load factor at O’HareMidway growsPeotone captures some portion of the domestic traffic growth notaccommodated by O’Hare and Midway, but no internationaloperations
• O’Hare closes when Peotone opens
• Midway grows• Other regional airports are expanded to capture point-to-pointtraffic overflow as Midway approaches capacity (assumed at9.0MM enplanements p.a.)
SCENARIO O’Hare Midway PeotoneDEFINITION
1 Grow Grow Not Built
2 Cap Grow Build
3 Downsize Grow Build
4 Close Grow BuildIncreasing Constraints On O’Hare
LONG-TERM SCENARIO DEFINITION
•
•••
Operation constraints and a perimeter rule imposed on O’Hare to forciblyreduce enplanements by some 40% by 2015 from 1996 levelsInternational and long-haul domestic flights relocate to PeotoneMidway grows until capacity limits are reachedPeotone captures some portion of the area’s traffic growth
•
•••

8/3/2019 Chicago Aviation Policy
http://slidepdf.com/reader/full/chicago-aviation-policy 70/93
V-8F
RPLA293-008-021Ta.Y
SCENARIO 1 ENPLANEMENT FORECASTS(In Millions)
(1)Source:
Includes the domestic leg of international enplanements BA&H analysis
O’HARE
International
Connecting
Local
Total
1996 2015
2.00
17.45
12.85
32.30
10.5
26.1
17.7
54.3
MIDWAY
International
Connecting
Local
Total
1996 2015
0
0.45
4.05
4.5
0
0.9
8.1
9.0
OTHER POINT-TO-POINT AIRPORT
International
Connecting
Local
Total
1996 2015
0
0
0
0
0
0.07
0.63
0.7
(1)

8/3/2019 Chicago Aviation Policy
http://slidepdf.com/reader/full/chicago-aviation-policy 71/93
V-8
O’Hare/Midway…Scenarios…
SCENARIO 1 INVOLVES CONTINUED GROWTH AT O’HARE AND SOME TRAFFIC OVERFLOWFROM MIDWAY TO ANOTHER POINT-TO-POINT AIRPORT
O’HARE GROWTH SCENARIO
O’HARE• Airlines capitalize on opportunity to develop O’Hare as
the leading international mid-continental hub
• Service increases to small communities
MIDWAY • Price-and service stimulated demand is captured
OTHERPOINT-TO-POINTAIRPORT
• Overflow from Midway is captured

8/3/2019 Chicago Aviation Policy
http://slidepdf.com/reader/full/chicago-aviation-policy 72/93
V-9F
RPCH247-008-101TTT.PB
SCENARIO 2 ENPLANEMENT FORECASTS(In Millions)
Note: Source:
(1) Includes the domestic leg of international enplanements BA&H analysis
O’HARE
International
Connecting
Local
Total
1996 2015
2.00
17.45
12.85
32.30
7.60
17.11
16.60
41.31
MIDWAY
International
Connecting
Local
Total
1996 2015
0
0.45
4.05
4.5
0
0.9
8.1
9.0
PEOTONE
International
Connecting
Local
Total
1996 2015
0
0
0
0
0
0.19
1.75
1.94
(1)

8/3/2019 Chicago Aviation Policy
http://slidepdf.com/reader/full/chicago-aviation-policy 73/93
V-9
O’Hare/Midway…Scenarios…
SCENARIO 2 (O’HARE CONSTRAINED) COULD RESULT IN A MORE LOCALLY-FOCUSEDO’HARE PLUS TWO POINT-TO-POINT AIRPORTS
CONSTRAINED O’HARE SCENARIO
O’HARE
• International growth only partly captured
• Loss of connecting traffic to other U.S. hubs and gateways
• Some loss of local traffic to small/medium size cities (to beconservative, the loss of local domestic traffic has not beenfactored into the numbers)
MIDWAY• Price stimulated demand captured, achieves capacity earlier
• Some local overflow from O’Hare captured
PEOTONE• Some local overflow from O’Hare captured
• Due to weak connecting structure, Peotone prevented fromcapturing most of the connecting traffic lost by O’Hare

8/3/2019 Chicago Aviation Policy
http://slidepdf.com/reader/full/chicago-aviation-policy 74/93

8/3/2019 Chicago Aviation Policy
http://slidepdf.com/reader/full/chicago-aviation-policy 75/93
V-10
O’Hare/Midway…Scenarios…
THE MOST REALISTIC WAY TO DOWNSIZE O’HARE (SCENARIO 3) WOULD BE TO IMPOSEMAJOR RESTRICTIONS AND RELOCATE INTERNATIONAL TRAFFIC TO PEOTONE
DOWNSIZED O’HARE SCENARIO
O’HARE
• Relocate all international traffic to Peotone by imposing aperimeter rule on O’Hare
• Similarly, relocate domestic long-haul traffic to Peotone (WestCoast, Florida)
• Focus O’Hare on regional, local traffic with a low level ofconnections (model used at LaGuardia and RR National)
MIDWAY• Capture price stimulated demand
• Capture some local overflow from O’Hare
PEOTONE
• Partly capture the international growth opportunity—with a smallconnecting structure Peotone will not be able to gain share fromother U.S. gateways or build traffic to the smaller internationalorigins
• Similarly, Peotone will have lower frequencies to the majordomestic origins due to a weaker connecting structure

8/3/2019 Chicago Aviation Policy
http://slidepdf.com/reader/full/chicago-aviation-policy 76/93
V-11F
RPCH247-008-057BB
WASHINGTON, D.C. ENPLANEMENTS(1965-1995)
5MM
12MM
14.6MM15.4MM
0
2
4
6
8
10
12
14
16
1965 1975 1985 1995
NATIONAL AIRPORT
0.9MM
2.6MM
4.7MM
12.4MM
0
2
4
6
8
10
12
14
16
1965 1975 1985 1995
DULLES INTERNATIONAL AIRPORTENPLANEMENTS(MM)
80%Local
90%Local
ENPLANEMENTS(MM)
DBIA Database, SSD Database, “Technology And Politics: The Regional Airport Experience” (1976), Southern Methodist University, BA&H analysis
Source:

8/3/2019 Chicago Aviation Policy
http://slidepdf.com/reader/full/chicago-aviation-policy 77/93
V-11
O’Hare/Midway…Scenarios…
THE LIKELY OUTCOME OF SCENARIO 3 WOULD MIRROR WASHINGTON D.C.’S EXPERIENCE:IF O’HARE IS DOWNSIZED, CHICAGO WILL NOT BECOME THE U.S. PREMIER INTERNATIONALHUB
WASHINGTON D.C. CHICAGO
• A 650-mile perimeter rule was imposed in1966 to drive traffic into Dulles airport
– All international traffic – U.S. transcontinental traffic
• Perimeter rule imposed on O’Hare to forceinternational traffic and West Coast traffic intoPeotone
• Local traffic remained in Ronald ReaganNational airport taking the feed away fromDulles
• The perimeter rule has been relaxed to 1250miles, in part as a response to local marketneeds
• Local traffic will remain in O’Hare, moreconveniently located for large parts of the city
• Price-stimulated traffic will remain in Midway
• The combination of better service levels atO’Hare and low price operations at Midwaywill take the feed away from Peotone
• Washington has not emerged as a majorinternational gateway and hub—both airportsare focussed on local traffic
• Peotone will not capture much of theinternational traffic growth
SCENARIO4 ENPLANEMENT FORECASTS

8/3/2019 Chicago Aviation Policy
http://slidepdf.com/reader/full/chicago-aviation-policy 78/93
V-12F
RPCH247-008-105TTT.PB
SCENARIO 4 ENPLANEMENT FORECASTS(In Millions)
Note: Source:
(1) Includes the domestic leg of international enplanements BA&H analysis
PEOTONE
International
Connecting
Local
Total
1996 2015
0
0
0
0
9.5
23.5
15.9
48.9
MIDWAY
International
Connecting
Local
Total
1996 2015
0
0.45
4.05
4.5
0
0.9
8.1
9.0
OTHER POINT-TO-POINT AIRPORT
International
Connecting
Local
Total
1996 2015
0
0
0
0
0
0.07
0.65
0.72
(1)
The Chicago region would most likely not develop as rapidly with Peotone replacing O’Hare as it would if O’Hare
were expanded. The new replacement airport would be very inconveniently located for large parts of the businesscommunity North of the city, it would take time for infrastructure to develop near the replacement airport and the total costof travel would likely rise -- higher travel costs to the airport and potentially higher landing fees. This assessment hasassumed that there would be a 10% loss of traffic. Although of significant importance for the greater Chicago region, theassumption has little impact on the economic consequences for the O’Hare vicinity
8/3/2019 Chicago Aviation Policy
http://slidepdf.com/reader/full/chicago-aviation-policy 79/93
8/3/2019 Chicago Aviation Policy
http://slidepdf.com/reader/full/chicago-aviation-policy 80/93
V-13F
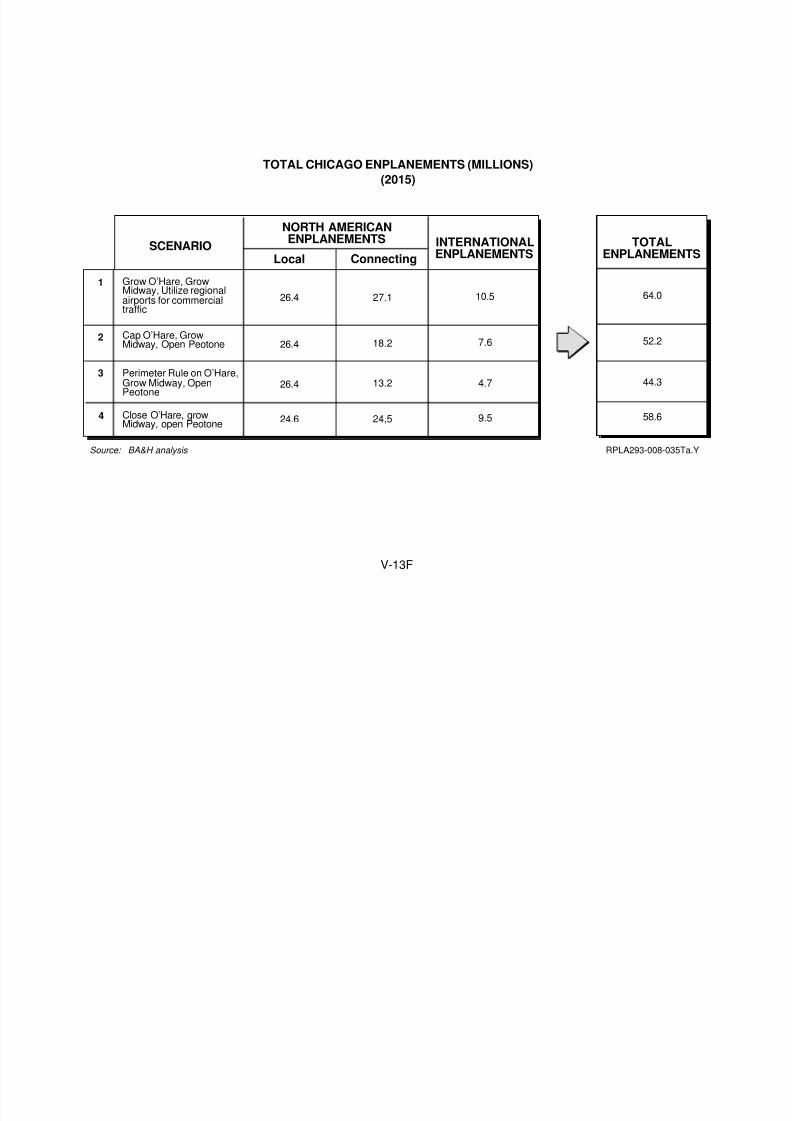
TOTAL CHICAGO ENPLANEMENTS (MILLIONS)(2015)
Grow O’Hare, GrowMidway, Utilize regionalairports for commercialtraffic
Cap O’Hare, GrowMidway, Open Peotone
Perimeter Rule on O’Hare,Grow Midway, OpenPeotone
SCENARIONORTH AMERICANENPLANEMENTS
LocalINTERNATIONALENPLANEMENTS
26.4
26.4
26.4
24.6
Source: BA&H analysis
Close O’Hare, grow
Midway, open Peotone
Connecting
27.1
13.2
18.2
24,5
10.5
4.7
7.6
9.5
TOTALENPLANEMENTS
64.0
44.3
52.2
58.6
1
2
3
4
RPLA293-008-035Ta.Y

8/3/2019 Chicago Aviation Policy
http://slidepdf.com/reader/full/chicago-aviation-policy 81/93
V-13
O’Hare/Midway…Scenarios…
OVERALL TRAFFIC FLOWS DIFFER SIGNIFICANTLY ACROSS THE FOUR SCENARIOSEVALUATED
SCENARIOS IMPLICATIONS FOR CHICAGO
Scenario 1Growth At O’Hare and Midway
• O’Hare, Midway and other regional airports capture all passenger traffic growth• Other regional airports expand to accommodate excess Midway demand
Scenario 2Cap Operations At O’Hare,
Grow Midway, Open Peotone
• Significant connecting traffic growth spills to other hubs• North American local traffic growth is largely captured by O’Hare, Midway, and Peotone
• Only a proportion of international traffic growth is captured by O’Hare toward the end ofthe period as capacity constraints become severe
Scenario 3Downsize O’Hare, Grow Midway,Open Peotone
• Operations constraints and perimeter rule on O’Hare force international and long-haulNorth American traffic into Peotone
• Much of connecting traffic growth spills to other hubs• Peotone, with a small connecting structure, will not be in position to capture as much of
the international traffic growth—preventing Chicago from becoming a majorinternational hub
Scenario 4Close O’Hare, Grow Midway,Open Peotone
• Peotone, Midway and other regional airports capture most passenger traffic growth• Other regional airports expand to accommodate excess Midway demand

8/3/2019 Chicago Aviation Policy
http://slidepdf.com/reader/full/chicago-aviation-policy 82/93
V-14
O’Hare/Midway…Implications…
CAPITALIZING ON O’HARE GROWTH COULD CONTRIBUTE AN ADDITIONAL$16 BILLION IN ECONOMIC OUTPUT PER YEAR TO THE O’HARE VICINITY BY 2015
(1)Source:
Includes economic impact from O’Hare, Midway and other regional airports in 2015 BA&H analysis
RPCH247-008-078BT
ANNUAL VALUE OF MARKET GROWTH TOO’HARE VICINITY
(Billions)
$19.9
1997Economic
Output
2015Economic Output
With O’HareGrowth
(1)
Additional Value Of Market Growth $16.4
$36.3
ECONOMIC IMPLICATIONS
Passenger Traffic:
Employment:
Economic Output:
O’Hare emerges as a leadinginternational hub and continues to growdomestically
An additional 195,000 jobs are created(vs. 1997), equivalent to 13% of currentemployment in the O’Hare vicinity
$16 billion in additional economic outputper annum created
O’HAREVICINITY
O’H /Mid I li i
8/3/2019 Chicago Aviation Policy
http://slidepdf.com/reader/full/chicago-aviation-policy 83/93
V-15
O’Hare/Midway…Implications…
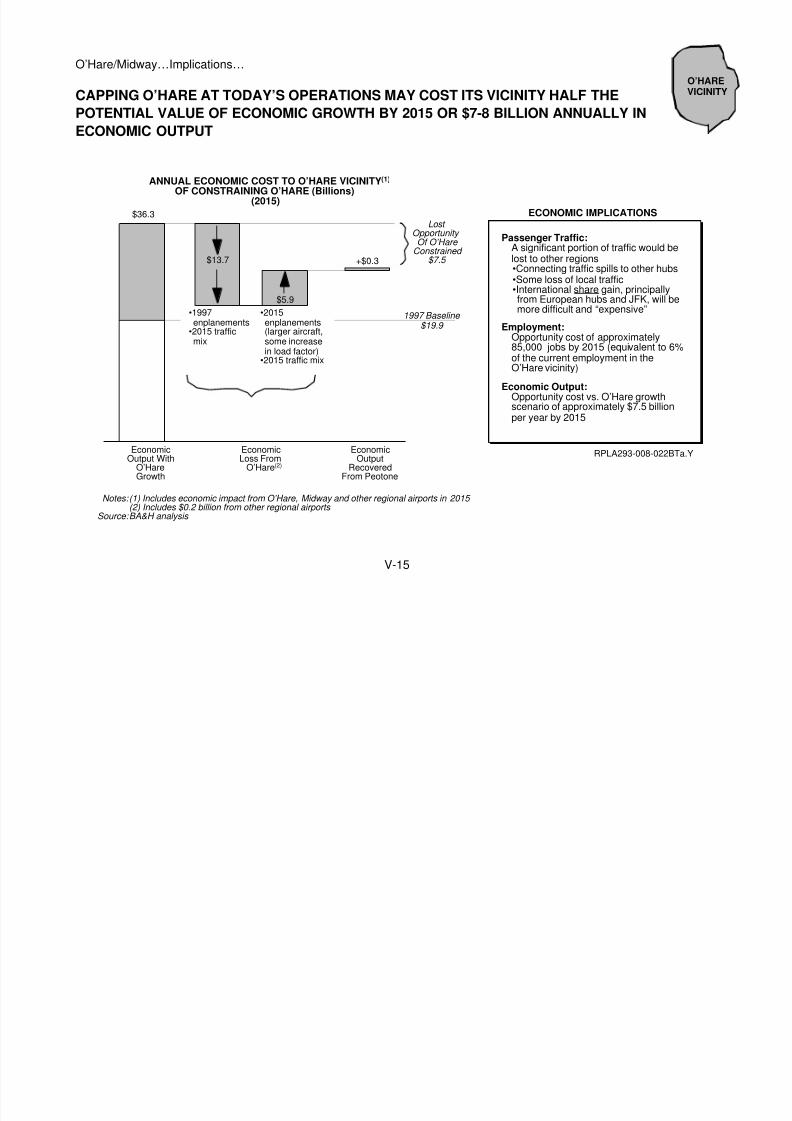
CAPPING O’HARE AT TODAY’S OPERATIONS MAY COST ITS VICINITY HALF THEPOTENTIAL VALUE OF ECONOMIC GROWTH BY 2015 OR $7-8 BILLION ANNUALLY INECONOMIC OUTPUT
•1997enplanements
•2015 trafficmix
•2015enplanements(larger aircraft,some increasein load factor)
•2015 traffic mix
(1) Includes economic impact from O’Hare, Midway and other regional airports in 2015 (2) Includes $0.2 billion from other regional airports BA&H analysis
Notes:
Source:
RPLA293-008-022BTa.Y
ECONOMIC IMPLICATIONS
Passenger Traffic:
Employment:
Economic Output:
A significant portion of traffic would belost to other regions
Opportunity cost of approximately85,000 jobs by 2015 (equivalent to 6%of the current employment in theO’Hare vicinity)
Opportunity cost vs. O’Hare growthscenario of approximately $7.5 billionper year by 2015
•Connecting traffic spills to other hubs•Some loss of local traffic•International share gain, principallyfrom European hubs and JFK, will bemore difficult and “expensive”
EconomicOutput With
O’HareGrowth
EconomicLoss From
O’Hare (2)
EconomicOutput
RecoveredFrom Peotone
ANNUAL ECONOMIC COST TO O’HARE VICINITY (1)
OF CONSTRAINING O’HARE (Billions)(2015)
$36.3Lost
Opportunity Of O’Hare
Constrained $7.5
1997 Baseline $19.9
+$0.3$13.7
$5.9
O’HAREVICINITY
O’H /Mid I li i
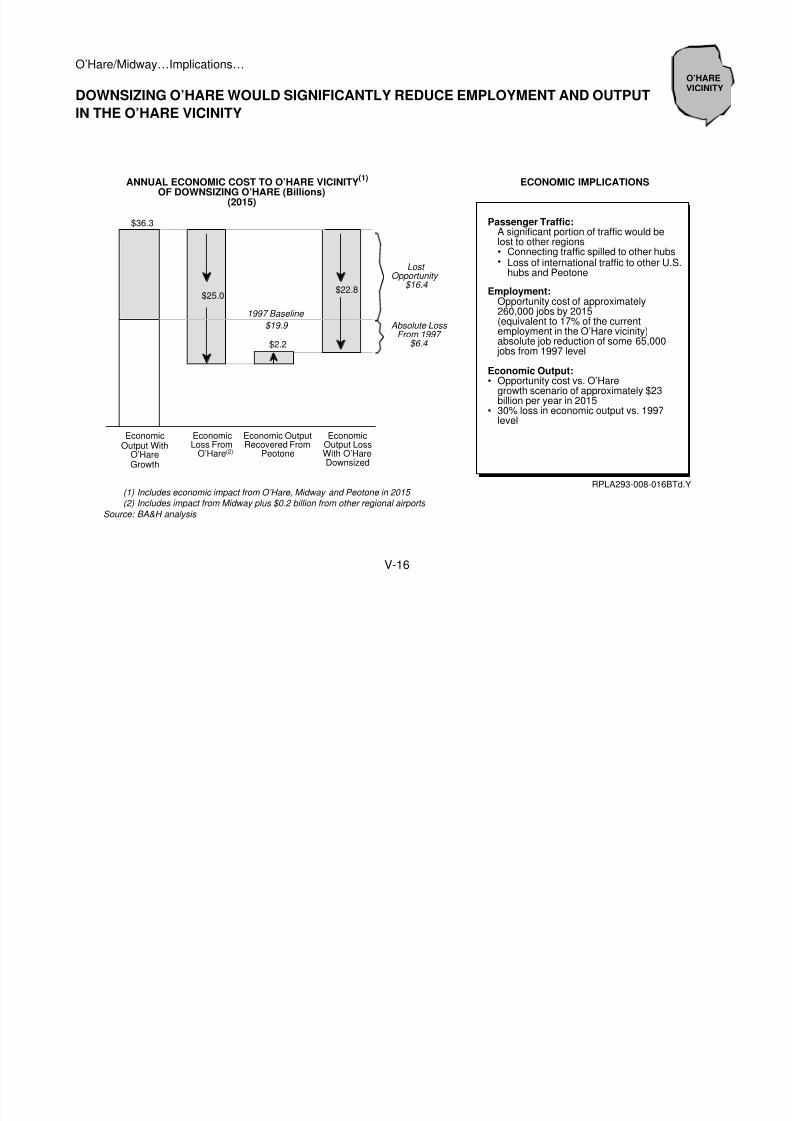
8/3/2019 Chicago Aviation Policy
http://slidepdf.com/reader/full/chicago-aviation-policy 84/93
V-16
O’Hare/Midway…Implications…
DOWNSIZING O’HARE WOULD SIGNIFICANTLY REDUCE EMPLOYMENT AND OUTPUTIN THE O’HARE VICINITY
ANNUAL ECONOMIC COST TO O’HARE VICINITYOF DOWNSIZING O’HARE (Billions)
(2015)
$36.3
$2.2
$25.0
EconomicOutput With
O’HareGrowth
EconomicLoss From
O’Hare (2)
Economic OutputRecovered From
Peotone
EconomicOutput LossWith O’HareDownsized
ECONOMIC IMPLICATIONS
Lost Opportunity
$16.4
Passenger Traffic:
Employment:
Economic Output:•
•
A significant portion of traffic would belost to other regions••
Opportunity cost of approximately260,000 jobs by 2015(equivalent to 17% of the currentemployment in the O’Hare vicinity)absolute job reduction of some 65,000
jobs from 1997 level
Opportunity cost vs. O’Haregrowth scenario of approximately $23billion per year in 201530% loss in economic output vs. 1997level
(1)(2)
Source:
Includes economic impact from O’Hare, Midway and Peotone in 2015 Includes impact from Midway plus $0.2 billion from other regional airports BA&H analysis
RPLA293-008-016BTd.Y
1997 Baseline $19.9
(1)
Connecting traffic spilled to other hubsLoss of international traffic to other U.S.hubs and Peotone
Absolute Loss From 1997
$6.4
$22.8
O’HAREVICINITY
O’H /Mid I li ti

8/3/2019 Chicago Aviation Policy
http://slidepdf.com/reader/full/chicago-aviation-policy 85/93
V-17
O’Hare/Midway…Implications…
CLOSING O’HARE WOULD LIKELY COST O’HARE’S LOCAL ECONOMY $30 BILLIONPER YEAR BY 2015
EconomicLoss FromO’Hare (2)
ANNUAL ECONOMIC COST TO O’HARE VICINITY (1)OF CLOSING O’HARE (Billions)
(2015)
ECONOMIC IMPLICATIONS
Passenger Traffic:•
Employment:•
Economic Output:•
•
Largest economic loss for the O’Harevicinity as the economic contribution frompassengers traveling through Peotone willonly marginally offset the loss fromO’Hare
Opportunity cost of approximately340,000 jobs by 2015 (equivalent to 23%of the current employment in the O’Harevicinity); absolute job reduction of some145,000 jobs from 1997 level
Opportunity cost vs. O’Hare growthscenario of approximately $30 billionper year in 201567% loss in economic output vs. 1997
level
$4.5
(1)(2)
Source:
Includes economic impact from O’Hare, Midway and Peotone in 2015 Includes impact from Midway and $0.2 billion from other regional airports BA&H analysis
RPLA293-008-002BTd.Y
$36.3
$34.4
EconomicOutput With
O’HareGrowth
EconomicOutput
RecoveredFrom Peotone
EconomicOutput LossWith O’Hare
Closed
Lost Opportunity
$16.4
Absolute Loss From 1997
$13.3
1997 Baseline $19.9
$29.9
O’HAREVICINITY

8/3/2019 Chicago Aviation Policy
http://slidepdf.com/reader/full/chicago-aviation-policy 86/93
V-18F
(1):
(2)Source:
The map only demonstrates the economic impact distribution in the O’Hare vicinity. There will obviously be an economic impact in Downtown Chicago and elsewhere Does not include United Headquarters DOA O’Hare; Census Bureau, 1990’s BA&H analysis
O’HARE DIRECT EMPLOYEES PER 10,000 RESIDENTS IN THE O’HARE VICINITY
A
A
AA
A
A
A
A
A
A
A
A
A
A
A
A
AA
A
A
A
A
A
A
AA
A
A
A
A
A
A
A
A
A
A
A
A
A
A
A
A
A
A
A
AA
A
A
A
K
U
a
a
A
A
A
AA
A
A
A
A
A
A A
A
A
A
A
A
A
A
A
A
A
A
A
A
A
A
A
A
A A
A
A
A
Algonquin
Arlington Heights
Barrington Hills
Bolingbrook
Carpentersville
Cary
Cicero
Crystal Lake
Des Plaines
Downers Grove
Elmhurst
Fox River Grove
Glenview
Hampshire
Highland Park
Hoffman Estates
Huntley
Ingleside
Island Lake
Lake Barrington
Lake In The HillsLake Zurich
Lombard
McHenry
Mount Prospect
Niles
North Chicago
Northbrook
Park Ridge
Pistakee Highlands
Skokie
Sleepy Hollow
South Elgin
Wauconda
Wheaton
Wonder Lake
Woodstock
Carol Stream
Elgin
Naperville
Palatine
Schaumburg Evanston
Oak Lawn
Oak Park
Aurora
Waukegan
Chicago
Midway
O'Hare
Romeoville
Lemont
Bensenville
Elk Grove Village
Roselle
Willowbrook
Palos Park
North Aurora
Eola
Buffalo Grove
Wood DaleNorridge
Winnetka
Wilmette
Batavia
Pingree Grove
Plato Center
Vernon Hills
Mundelein
Stickney
Berwyn
Lake Forest
Prairie Grove
Third Lake
Geneva
Bartlett
Wayne
St. Charles
Montgomery
Oswego
Worth
Calumet Park
Justice
Summit
0 - 7 5
76 - 120
121 - 4060
121 - 4,060
0 - 75
76 - 120
Number Of Direct Employees Per 10,000
Residents Per Zip Code
R P C H 2 4 7 - 0
0 8 - 1
0 3 M a p

8/3/2019 Chicago Aviation Policy
http://slidepdf.com/reader/full/chicago-aviation-policy 87/93

8/3/2019 Chicago Aviation Policy
http://slidepdf.com/reader/full/chicago-aviation-policy 88/93
V-19F
PROJECTED ANNUAL TAX IMPACT FOR THE LOCALCOMMUNITIES IN THE O’HARE VICINITY (Millions)
(2015)
(1)
(2)Source:
The impact of downsizing O’Hare is worse than the impact of closing O’Hare because the latter scenario has 19.2 millions higher enplanements, resulting in higher employment and visitor expenditures in the greater Chicago region. The analysis conservatively assumes that large parts of the population will live in the Northern and Western suburbs and commute to points of employment outside the O’Hare vicinity Includes sales tax (food and retail), hotel and car rental taxes BA&H analysis RPLA293-008-003BBd.Y
0
20
40$40
-$6
-$15-$12
O’HareGrowth
O’HareConstrained
O’HareDownsized
O’HareClosed
0
20
40
60
80$79
-$9
-$28-$35
O’HareGrowth
O’HareConstrained
O’HareDownsized
O’HareClosed
VISITOR EXPENDITURES TAX IMPACT (2)PERSONAL INCOME AND
SALES TAX IMPACT (1)
O’Hare/Midway Implications

8/3/2019 Chicago Aviation Policy
http://slidepdf.com/reader/full/chicago-aviation-policy 89/93
V-19
O Hare/Midway…Implications…
THE LOCAL COMMUNITIES IN THE O’HARE VICINITY WILL SUFFER SUBSTANTIAL REDUCTIONIN THE TAXES COLLECTED AS A RESULT OF THE REDUCED ECONOMIC ACTIVITY
• Personal income and sales taxes collected by the local communities in the O’Hare Vicinitywould fall by an estimated $15 million p.a. if O’Hare was downsized, due to the loss ofemployment in locations which generate taxes
• Visitor sales taxes collected by the local communities in the O’Hare Vicinity would fall by anestimated $28 million p.a. if O’Hare was downsized, due to the loss in visitor expenditures(hotel, car rental, food and retail) around O’Hare

8/3/2019 Chicago Aviation Policy
http://slidepdf.com/reader/full/chicago-aviation-policy 90/93
V-20F
Note:
Source:
The impact of downsizing O’Hare is worse than the impact of closing O’Hare because the latter scenario has
19.2 million higher enplanements, resulting in higher employment and visitor expenditures in the greater Chicago region (1) Includes sales tax (food and retail), hotel and car rental taxes BA&H analysis RPLA293-008-004BBc.Y
PROJECTED ANNUAL TAX IMPACT FOR THE CITY OF CHICAGO (Millions)(2015)
O’HareGrowth
O’HareConstrained
O’HareDownsized
O’HareClosed
0
50
100
150
200
250 $235
-$22
-$51-$36
O’HareGrowth
O’HareConstrained
O’HareDownsized
O’HareClosed
0
20
40
60
80
100
120$117
-$18
-$36
-$17
VISITOR EXPENDITURES TAX IMPACT (1)PERSONAL INCOME AND
SALES TAX IMPACT
O’Hare/Midway Implications

8/3/2019 Chicago Aviation Policy
http://slidepdf.com/reader/full/chicago-aviation-policy 91/93
V-20
O Hare/Midway…Implications…
TAX IMPLICATIONS FOR THE CITY OF CHICAGO WOULD ALSO BE SIGNIFICANT
• Personal income and sales taxes for the City of Chicago would fall by an estimated $36million p.a. if O’Hare was downsized, due to the loss of employment in locations whichgenerate taxes for the city
• Visitor sales taxes for the City of Chicago would fall by an estimated $51 million p.a. ifO’Hare was downsized, due to the loss in visitor expenditures (hotel, car rental, food andretail) around O’Hare, and only a small portion of the loss would be captured in thePeotone vicinity
O’Hare/Midway…Implications…
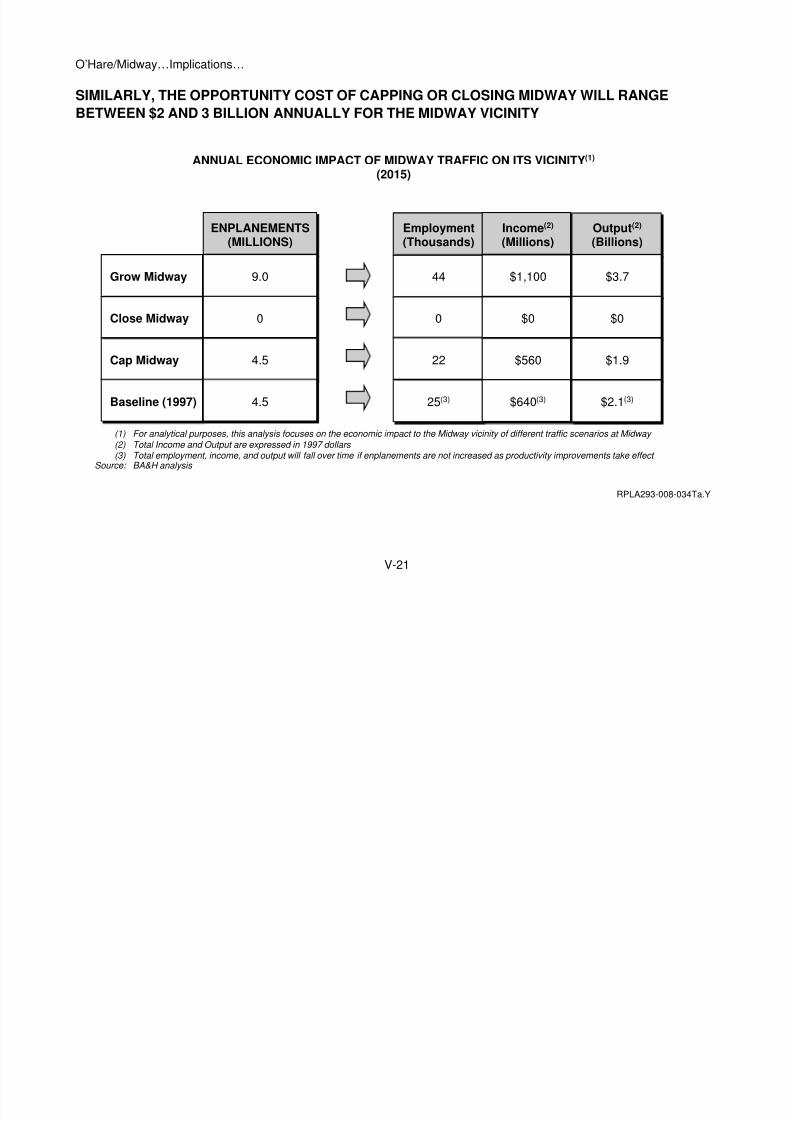
8/3/2019 Chicago Aviation Policy
http://slidepdf.com/reader/full/chicago-aviation-policy 92/93
V-21
O Hare/Midway…Implications…
SIMILARLY, THE OPPORTUNITY COST OF CAPPING OR CLOSING MIDWAY WILL RANGEBETWEEN $2 AND 3 BILLION ANNUALLY FOR THE MIDWAY VICINITY
Employment(Thousands)Employment(Thousands)
Income (2)
(Millions)Income (2)
(Millions)Output (2)
(Billions)Output (2)
(Billions)
4444
00
2222
25 (3)25 (3)
$1,100$1,100
$0$0
$560$560
$640 (3)$640 (3)
$3.7$3.7
$0$0
$1.9$1.9
$2.1 (3)$2.1 (3)
ENPLANEMENTS(MILLIONS)
ENPLANEMENTS(MILLIONS)
For analytical purposes, this analysis focuses on the economic impact to the Midway vicinity of different traffic scenarios at Midway Total Income and Output are expressed in 1997 dollars Total employment, income, and output will fall over time if enplanements are not increased as productivity improvements take effect BA&H analysis
(1)(2)(3)
Source:
RPLA293-008-034Ta.Y
ANNUAL ECONOMIC IMPACT OF MIDWAY TRAFFIC ON ITS VICINITY (1)
(2015)
Grow MidwayGrow Midway 9.09.0
Close MidwayClose Midway 00
Cap MidwayCap Midway 4.54.5
Baseline (1997)Baseline (1997) 4.54.5

8/3/2019 Chicago Aviation Policy
http://slidepdf.com/reader/full/chicago-aviation-policy 93/93