Embed Size (px)
Citation preview
I M P L E M E N TAT I E I AT F 1 6 9 4 9
Tiel, 8 maart 2018
FRANS DOLMANS – TECHNICAL MANAGER LRQA LLOYD’S REGISTER, AREA NORTH EUROPE
OLAF JANSEN – SENIOR CONSULTANT QUALITY (AUTOMOTIVE) – TATA STEEL
© Symbol 2018 2
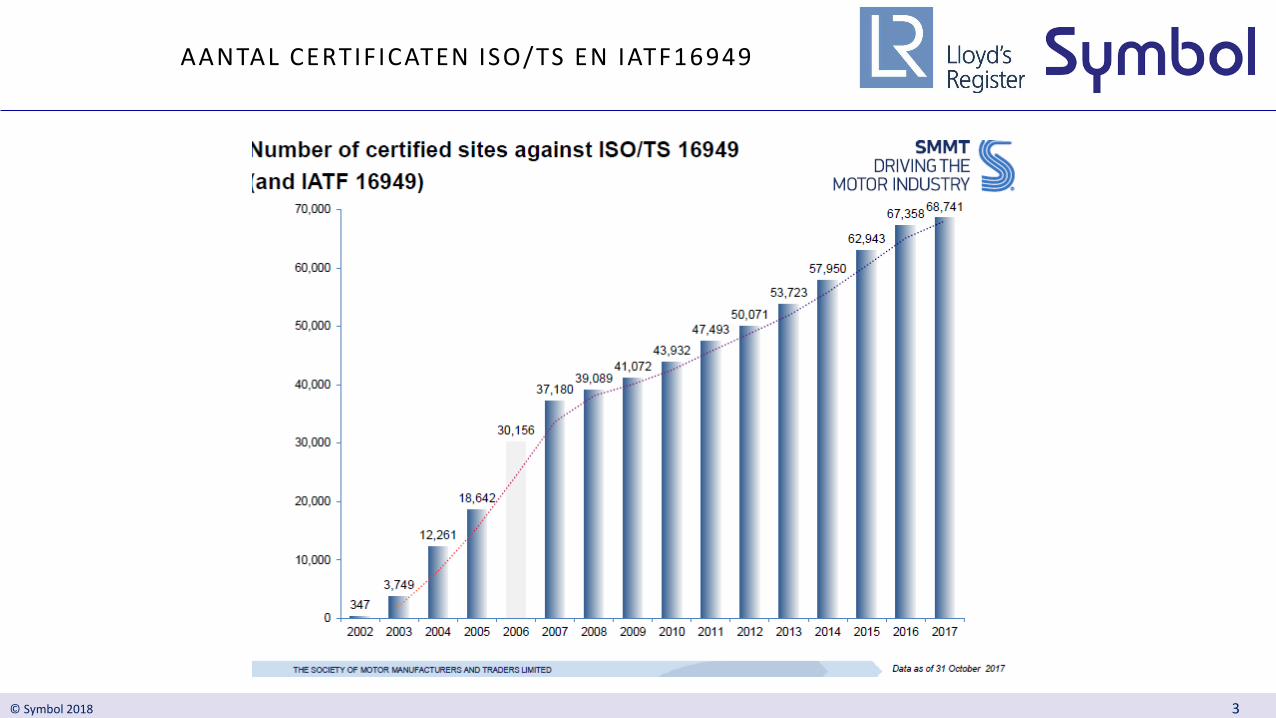
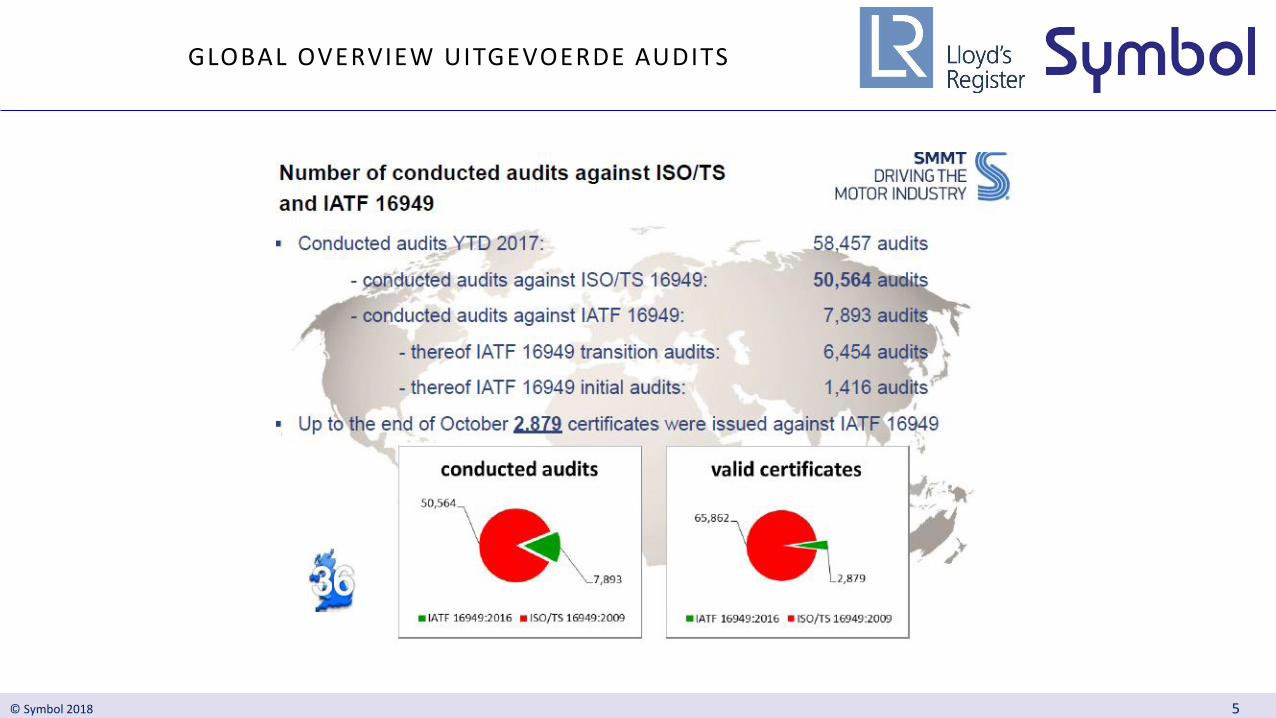
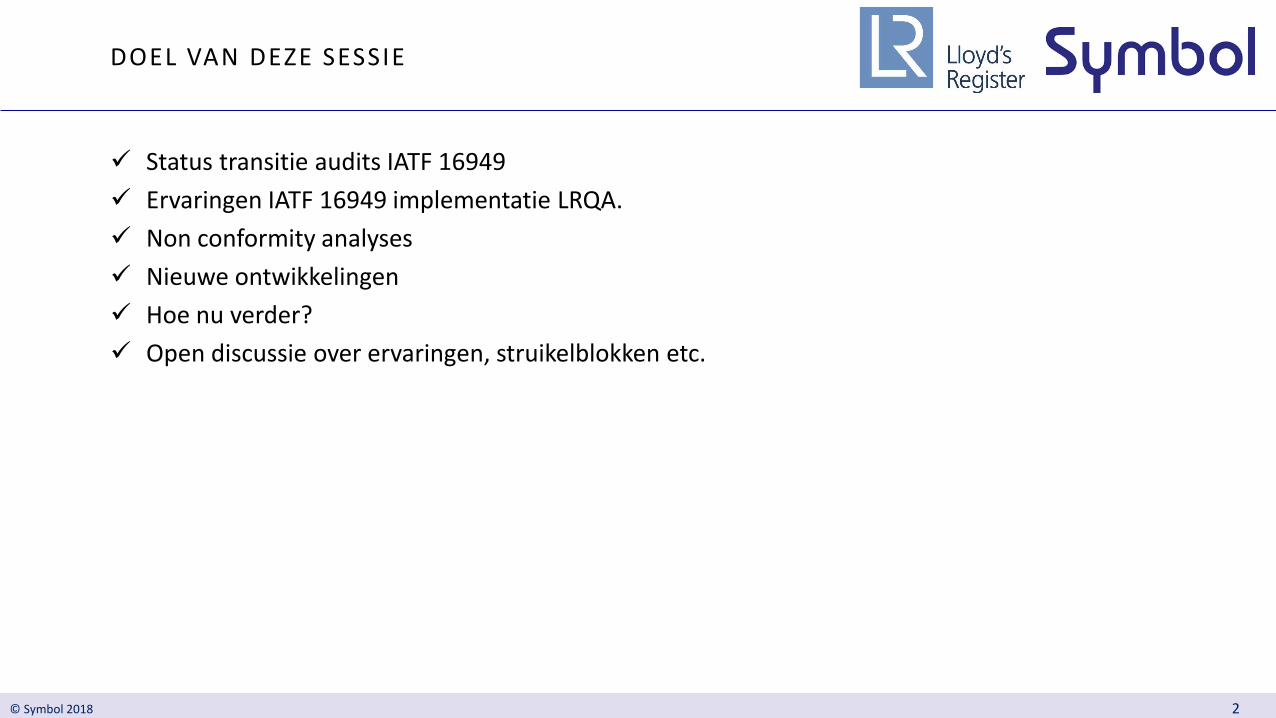
✓ Status transitie audits IATF 16949
✓ Ervaringen IATF 16949 implementatie LRQA.
✓ Non conformity analyses
✓ Nieuwe ontwikkelingen
✓ Hoe nu verder?
✓ Open discussie over ervaringen, struikelblokken etc.
DOEL VAN DEZE SESSIE

© Symbol 2018 7
MOST COMMON NON CONFORMITIES DURINGIATF16949 AUDITS
✓ Management review
✓ Core tools
✓ Calibration / MSA
✓ Context analysis, Stake holders analyses
✓ Measures to achieve objectives
✓ Internal audits + auditor qualification
✓ Supplier management, improvement. Evaluation
✓ Customer specific requirements
✓ IATF knowledge, general knowledge management

© Symbol 2018 8
TRICKY AREAS TO AUDIT
✓ Product development, process development.
✓ All procceses were interfaces with other processes exist (often located out of the location, following audit trails).
✓ Cascade of objectives top down, result registration bottom up.
✓ Effectiveness of training.
✓ Effectivity vs Efficiency.
© Symbol 2018 9
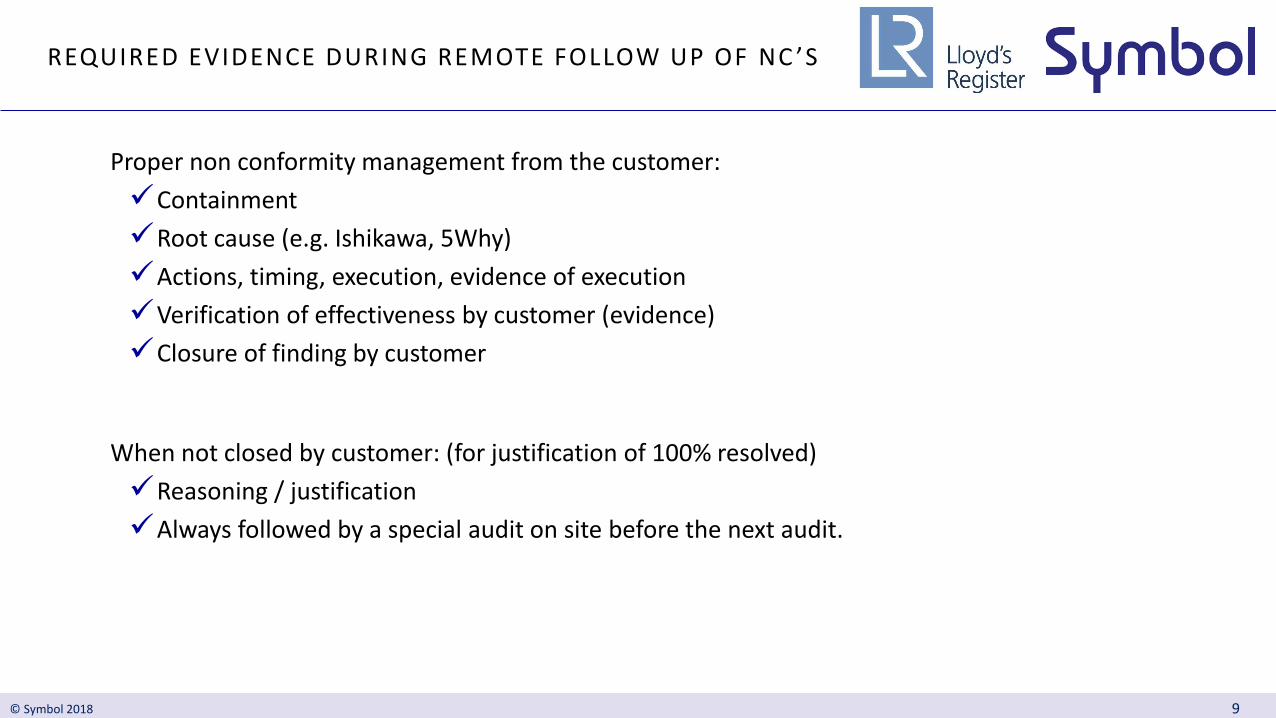
REQUIRED EVIDENCE DURING REMOTE FOLLOW UP OF NC ’S
Proper non conformity management from the customer:
✓Containment
✓Root cause (e.g. Ishikawa, 5Why)
✓Actions, timing, execution, evidence of execution
✓Verification of effectiveness by customer (evidence)
✓Closure of finding by customer
When not closed by customer: (for justification of 100% resolved)
✓Reasoning / justification
✓Always followed by a special audit on site before the next audit.

© Symbol 2018 10
NIEUWE ONTWIKKELINGEN HARMONISATIE FMEA AIAG & VDA
Harmonisatie FMEA handboeken AIAG en VDA:
Timing:
✓ Validatie fase: June/July 2017 (met aangewezen klanten en evaluatie van de resultaten)
✓ Uitgifte yellow print 15 November 2017
✓ Uitgifte final version eind April 2018
✓ Publicatie May 2018.
✓ Training voor de nieuwe manual FMEA in 2018, zal verzorgd worden door VDA, AIAG en hunlicentie houders.

© Symbol 2018 12
NUTTIGE WEBSITES
✓ http://www.iatfglobaloversight.org/
✓ http://www.iatfglobaloversight.org/wp/wp-content/uploads/2017/01/IATF-16949-Transition-Strategy-and-Requirements_REV04.pdf
✓ http://vda-qmc.de/en/publications/fmea-alignment
Tata Steel Slide
Title-slide
O. Jansen
Transition to the new IATF 16949
Don’t Panic
Tata Steel Slide
50% text / 50% image
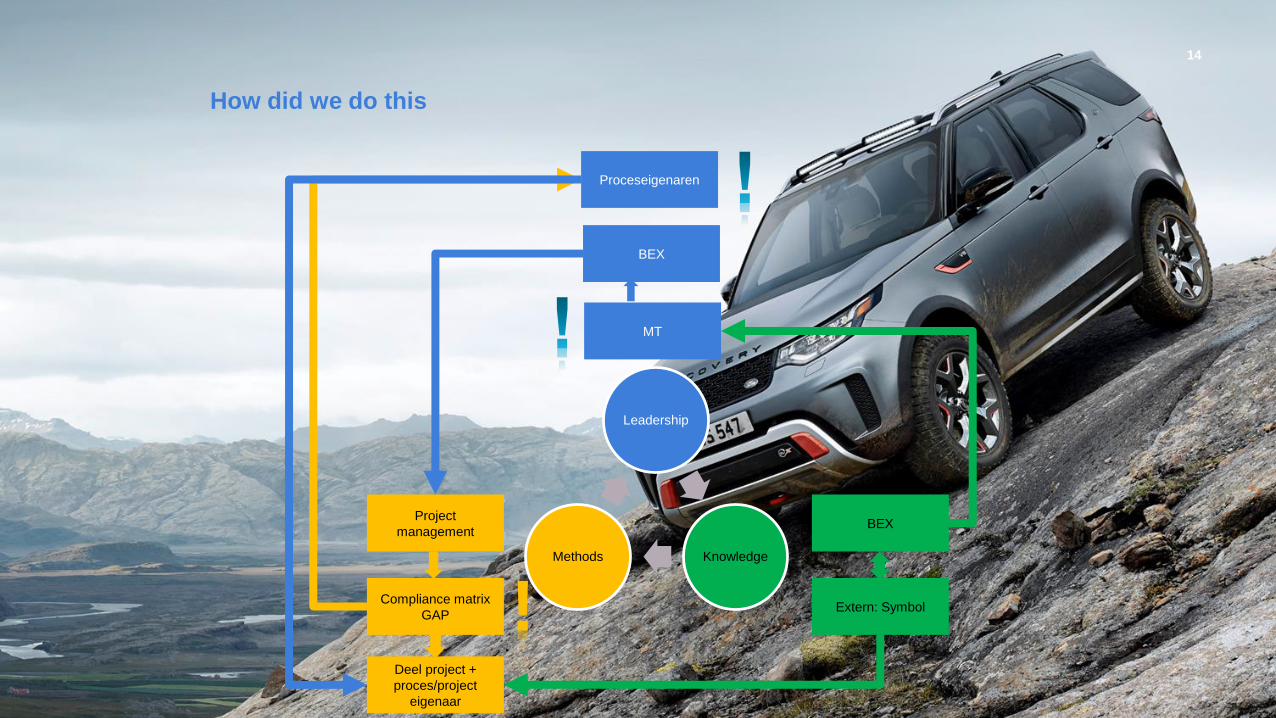
How did we do this
14
Leadership
KnowledgeMethods
Compliance matrix
GAP
BEX
BEX
Project
management
Proceseigenaren
MT
Deel project +
proces/project
eigenaar
Extern: Symbol!

Tata Steel Slide
50% text / 50% image
Game time
Presentation title, change Insert >> Header & Footer 15
https://kahoot.it/
Tata Steel Slide
50% text / 50% image
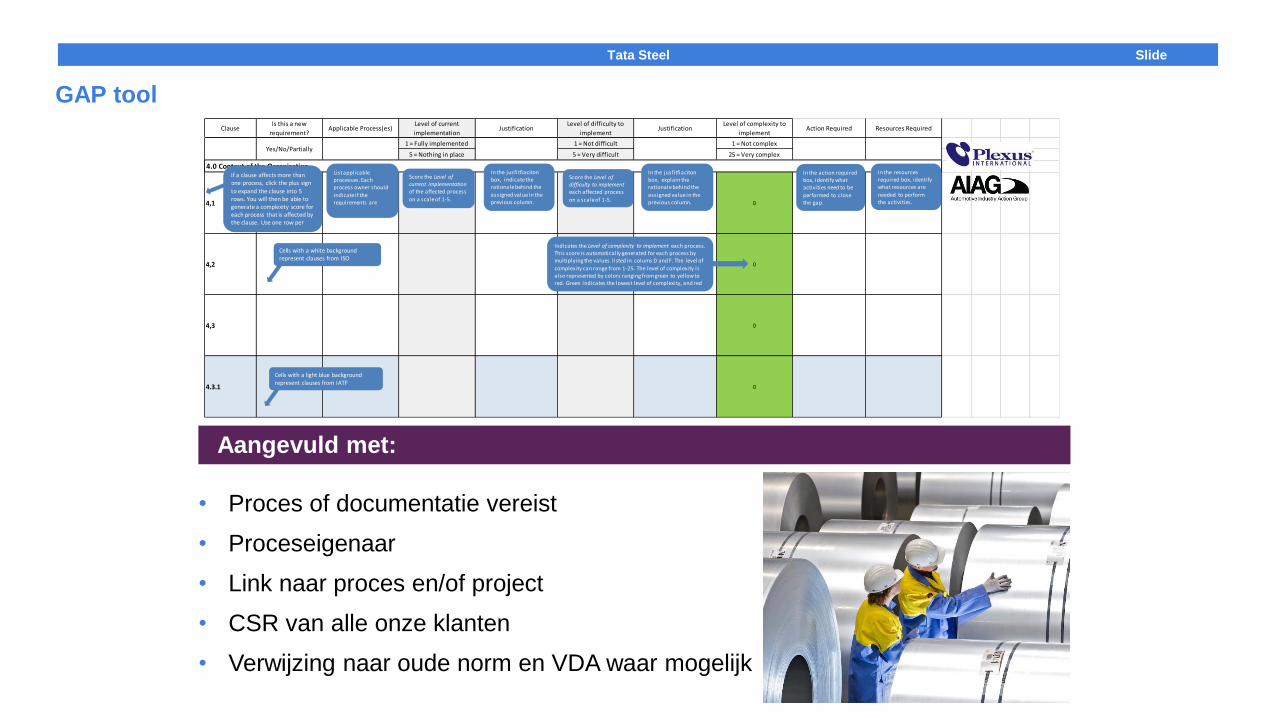
GAP tool
• Proces of documentatie vereist
• Proceseigenaar
• Link naar proces en/of project
• CSR van alle onze klanten
• Verwijzing naar oude norm en VDA waar mogelijk
Aangevuld met:
ClauseIs this a new
requirement?Applicable Process(es)
Level of current
implementationJustification
Level of difficulty to
implementJustification
Level of complexity to
implementAction Required Resources Required
1 = Fully implemented 1 = Not difficult 1 = Not complex
5 = Nothing in place 5 = Very difficult 25 = Very complex
4,1 0
4,2 0
4,3 0
4.3.1 0
4.0 Context of the Organization
Yes/No/Partially
Score the Level of current implementationof the affected process
on a scale of 1-5.
In the jusfitfiacitonbox, indicate the rationale behind the
assigned value in the previous column.
If a clause affects more than one process, click the plus sign
to expand the clause into 5 rows. You will then be able to generate a complexity score for each process that is affected by the clause. Use one row per
Score the Level of difficulty to implement each affected process
on a scale of 1-5.
In the jusfitfiacitonbox, explain the rationale behind the
assigned value in the previous column.
Cells with a light blue background represent clauses from IATF
Cells with a white background represent clauses from ISO
Indicates the Level of complexity to implement each process. This score is automatically generated for each process by multiplying the values l isted in colums D and F. The level of
complexity can range from 1-25. The level of complexity is also represented by colors ranging from green to yellow to red. Green indicates the lowest level of complexity, and red
In the action required box, identify what activities need to be
performed to close the gap.
In the resourcesrequired box, identify what resources are
needed to perform the activities.
List applicable processes. Each process owner should
indicate if the requirements are
© Symbol 2018 17
VRAGEN?
Indien u vragen heeft, dan beantwoorden we deze graag.
We denken graag met u mee!
Dennis van Scherpenzeel: [email protected]


![Versie 2 - Untisdownload.untis.nl/U-Handboeken/Unio.pdf · [HACK] NOWINDOW=1 2.5 Invoer van gegevens Vakafkortingen kunnen in Unio handmatig worden ingevoerd, maar het is aan te bevelen](https://img.dokumen.tips/doc/110x75/5eac70d46882327381524188/versie-2-hack-nowindow1-25-invoer-van-gegevens-vakafkortingen-kunnen-in-unio.jpg)