Embed Size (px)
Citation preview

CHI 97 * 22-27 MARCH 1997 PAPERS
Beyond Fitts’ Law: Models for Trajectory-Based HCI Tasks
Johnny Accot lZ Shumin Zhai 23
* Centre d’Etudes de la 2 Input Research Group 3 IBM AlmadenNavigation A6rienne CSRI Research Center
7 avenue Edouard Belin University of Toronto 650 Harry Road31055 Toulouse cedex Toronto, ON M5S 1A4 San Jose, CA 95120
France Canada USA
{accot,zhai} (i?dgp.toronto.edu
ABSTRACTTrajectory-based interactions, such as navigating throughnested-menus, drawing curves, and moving in 3D worlds,are becoming common tasks in modern computer interfaces.Users’ performances in these tasks cannot be successfullymodeled with Fitts’ law as it has been applied to point-ing tasks. Therefore we explore the possible existence ofrobust regularities in trajectory-based tasks. We used “steer-ing through tunnels” as our experimental paradigm to repre-sent such tasks, and found that a simple “steering law” indeedexists. The paper presents the motivation, analysis, a seriesof four experiments, and the applications of the steering law.
KeywordsFitts’ law, human performance, modeling, movements, pathsteering, task difficulty, motor control, input techniques anddevices, trajectory-based interaction
INTRODUCTIONIt has been argued that the advancement of HCI lies in“hardening’’the field with quantitative, engineering-like mod-els [14]. In reality, few theoretical, quantitative tools areavailable in user interface research and development. A rareexception to this is Fitts’ law [6]. Extending informationthem-y to human perceptual-motor system, Paul Fitts found aformal relationship that models speedfaccuracy tradeoffs inaimed movements. It predicts that the time T needed to pointto a target of width W and at distance A is logarithmicallyrelated to the inverse of the spatial relative error ~, that is:
T=a+blog2(#+c) (1)
where a and b are empirically determined constants, and cis O, 0.5 or 1 (See [13] for detail). The factor log2 ( ~ + c),called the index of difficulty (ID), describes the difficulty toachieve the task: the greater ID, the more difficult the task.
Pennkskm 10Imk digitalllmrd copies of’all or pafi ofthis maierifi[ for
persomd or clawoom use is gmn(td without lie provided that the copies
are not madeor distributed for profit or commercial adv:mL~ge. Lhe copy-
righ[ notice. (he title of [he publiut ion and its dale appear, and noiice is
given thirl copyrighl is by pwmission ot’ I he ACM. Inc. To copy otherwise,
10 republish. 10 post on servers or to redislrilwte to tisL’+.rqu iris specific
pem]ission mid/or lie
Clil 97, ,Itlanta GA I.JSA
Copyrighl 1997 ACA4 (J-8979 I -802-9/97,03 .$3.50
Due to its accuracy and robustness, Fitts’ law has been a pop-ular research topic. Numerous studies have been conductedto explain [5, 8], extend [12] and apply Fitts’ law to variousdomains. The value of Fitts’ law in human-computer interac-tion research can be readily appreciated. Taking input deviceresearch as an example, it was nearly impossible to comparedevice performance results from different studies until theFitts’ law model was applied [2]. Without Fltts’ law, perfor-mance scores (pointing/tapping times) are only meaningfulunder a set of specific experimental conditions (target sizesand distances). With Fitts, these scores can be translated intoa performance index (in bitshecond) that is independent ofthose experimental details.
What Fitts’ laws revealed is a somewhat intuitive tradeoffin human movement: the faster we move, the less preciseour movements are, or vice versa: the more severe the con-straints are, the slower we move. Paul Fitts [6] formulatedsuch a tradeoff in three experimental tasks (bar strip tap-ping, disk transfer, and nail insertion) that are essentiallyin one paradigm: hitting a target over certain distance. Inhuman-computer interaction, such a paradigm correspondsto a frequent elemental task: pointingh,mget selection.
However, it is obvious that Fitts’ law addresses only onetype of movement. Increasingly, computer input devices areused not only for pointing to targets but also for producingtrajectories, such as in drawing, writing, and steering in 3Dspace (e.g. VRML worlds). Fitts’ law is not an adequatemodel for these trajectory-based tasks. Simply by trying towrite with a mouse one would realize the marked differencebetween a mouse and a pen (stylus). Yet formal studies inFitts’ law paradigm [11] showed little performance differencebetween these two types of devices. Clearly the user interface/ input device studies carried out in the Fltts’ law paradigmare not sufficient for today’s practical needs. It has longbeen proposed that in addition to pointing (target acquisition),pursuit tracking, free-hand inking, tracing, and constrainedmotion should all be considered as testing tasks for inputdevice evaluation [1].
Given the tremendous value and success of Fitts’ law, it is
295
PAPERS CHI 97 * 22-27 MARCH 1997
surprising that the very spirit of Fitts law, namely simplequantitative relationships between task constraint and move-ment speed, has not been applied to other types of tasks. Arethere any other regularities in human movement that can bemodeled in simple mathematical equations? If so, we wouldhave a richer set of quantitative tools for both motor controlresearch and for user interface evaluations. The current workis one step toward such a goal.
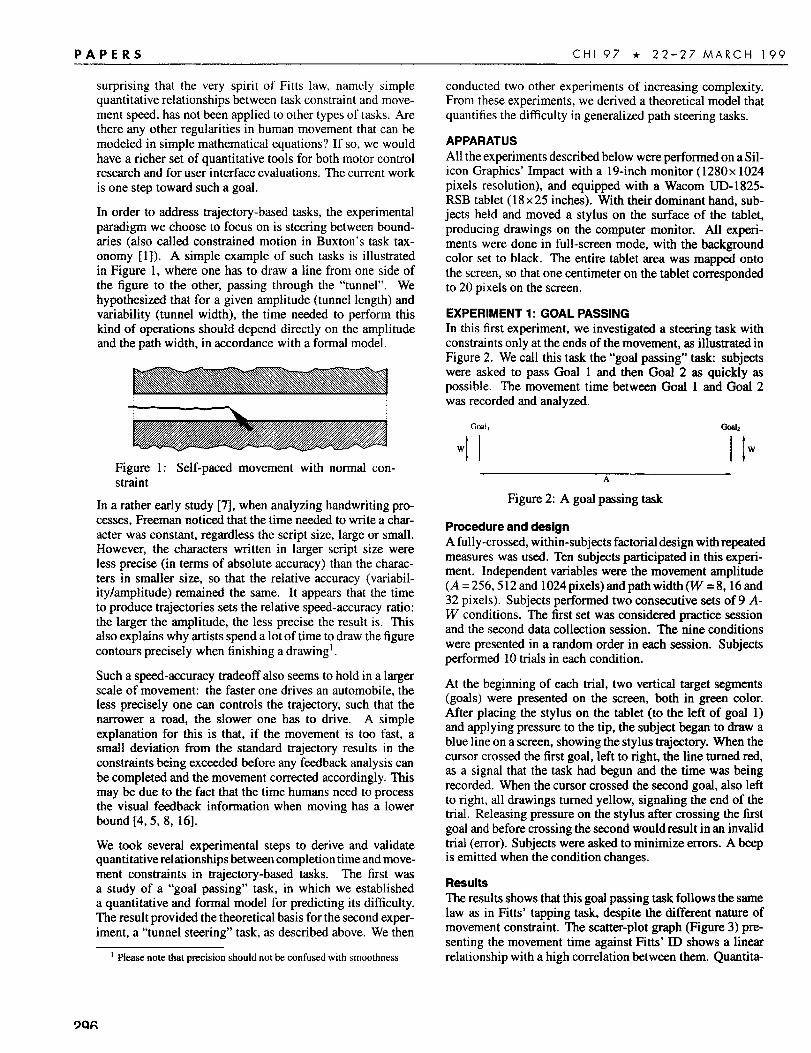
In order to address trajectory-based tasks, the experimentalparadigm we choose to focus on is steering between bound-aries (also called constrained motion in Buxton’s task tax-onomy [1]). A simple example of such tasks is illustratedin Figure 1, where one has to draw a line from one side ofthe figure to the other, passing through the “tunnel”. Wehypothesized that for a given amplitude (tunnel length) andvariability (tunnel width), the time needed to perform thiskind of operations should depend directly on the amplitudeand the path width, in accordance with a formal model.
Figure 1: Self-paced movement with normal con-straint
In a rather early study [7], when analyzing handwriting pro-cesses, Freeman noticed that the time needed to write a char-acter was constant, regardless the script size, large or small.However, the characters written in larger script size wereless precise (in terms of absolute accuracy) than the charac-ters in smaller size, so that the relative accuracy (variabil-ityhtmplitude) remained the same. It appears that the timeto produce trajectories sets the relative speed-accuracy ratio:the larger the amplitude, the less precise the result is. Thisalso explains why artists spend a lot of time to draw the figurecontours precisely when finishing a drawing 1.
Such a speed-accuracy tradeoff also seems to hold in a largerscale of movement: the faster one drives an automobile, theless precisely one can controls the trajectory, such that thenarrower a road, the slower one has to drive. A simpleexplanation for this is that, if the movement is too fast, asmall deviation from the standard trajectory results in theconstraints being exceeded before any feedback analysis canbe completed and the movement corrected accordingly. Thismay be due to the fact that the time humans need to processthe visual feedback information when moving has a lowerbound [4, 5,8, 16].
We took several experimental steps to derive and validatequantitative relationships between completion time and move-ment constraints in trajectory-based tasks. The first wasa study of a “goal passing” task, in which we establisheda quantitative and formal model for predicting its difficulty.The result provided the theoretical basis for the second exper-iment, a “tunnel steering” task, as described above. We then
* Please note that precision should not be confused with smoothness
conducted two other experiments of increasing complexity.From these experiments, we derived a theoretical model thatquantifies the difficulty in generalized path steering tasks.
APPARATUSAll the experiments described below were performed on a Sil-icon Graphics’ Impact with a 19-inch monitor (1280x 1024pixels resolution), and equipped with a Wacom UD-1 825-RSB tablet ( 18 x 25 inches). Wh.h their dominant hand, sub-jects held and moved a stylus on the surface of the tablet,producing drawings on the computer monitor. All experi-ments were done in full-screen mode, with the backgroundcolor set to black. The entire tablet area was mapped ontothe screen, so that one centimeter on the tablet correspondedto 20 pixels on the screen.
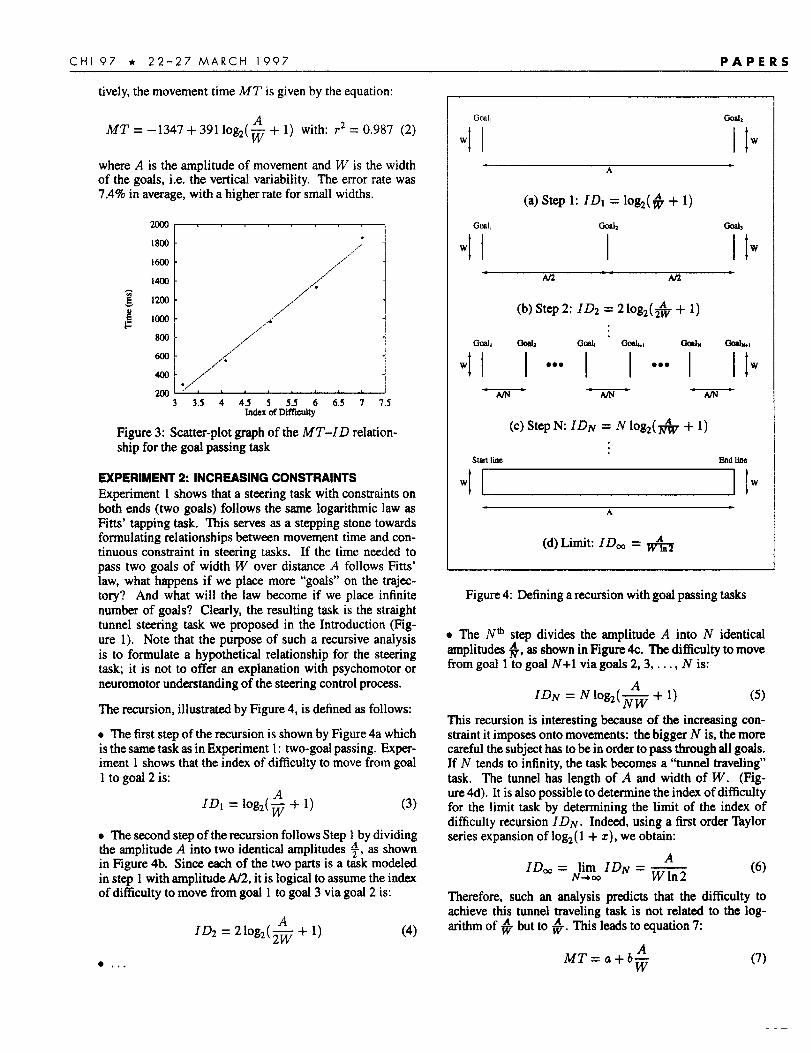
EXPERIMENT 1:GOAL PASSINGIn this first experiment, we investigated a steering task withconstraints only at the ends of the movement, as illustrated inFigure 2. We call this task the “goal passing” task subjectswere asked to pass Goal 1 and then Goal 2 as quickly aspossible. The movement time between Goal 1 and Goal 2was recorded and analyzed.
Goal, 00s1,
J I I twII II
A
Figure 2: A goal passing task
Procedure and designA fully-crossed, within-subjects factorial design with repeatedmeasures was used. Ten subjects participated in this experi-ment. Independent variables were the movement amplitude(A =256, 512 and 1024 pixels) and path width(W =8, 16and32 pixels). Subjects performed two consecutive sets of 9 A-W conditions. The first set was considered practice sessionand the second data collection session. The nine conditionswere presented in a random order in each session. Subjectsperformed 10 trials in each condition.
At the beginning of each trial, two vertical target segments(goals) were presented on the screen, both in green color.After placing the stylus on the tablet (to the left of goal 1)and applying pressure to the tip, the subject began to draw ablue line on a screen, showing the stylus trajectory. When thecursor crossed the first goal, left to right, the line turned red,as a signal that the task had begun and the time was beingrecorded. When the cursor crossed the second goal, also leftto right, all drawings turned yellow, signaling the end of thetrial. Releasing pressure on the stylus after crossing the firstgoal and before crossing the second would result in an invalidtrial (error). Subjects were asked to minimize errors. A beepis emitted when the condition changes.
ResulteThe results shows that this goal passing task follows the samelaw as in Fitts’ tapping task, despite the different nature ofmovement constraint. The scatter-plot graph (Figure 3) pre-senting the movement time against Fitts’ ID shows a linearrelationship with a high correlation between them. Quantita-
296
CHI 97 * 22-27 MARCH 1997 PAPERS
tively, the movement time MT is given by the equation:
MT= –1347 + 391 log2(~ + 1) with: r2 = 0.987 (2)
where A is the amplitude of movement and W is the widthof the goals, i.e. the vertical variability. The error rate was7.4% in average, with a higher rate for small widths.
2000
18LMI-.
,/,..,’
lWI - ..-’,,../,’
1430 - ,..,,.~.’
g 1200 -,/
/’”: ,~ - ,../
800 -/“’”A
600 - /’”
“/, ,,, ,,, -
. .
400.
2Lm ‘3 3.5 4 4.5 5 5.5 6 6.3 7 7.5
Indexof Difficulty
Figure 3: Scatter-plot graph of the MT-ID relation-ship for the goal passing task
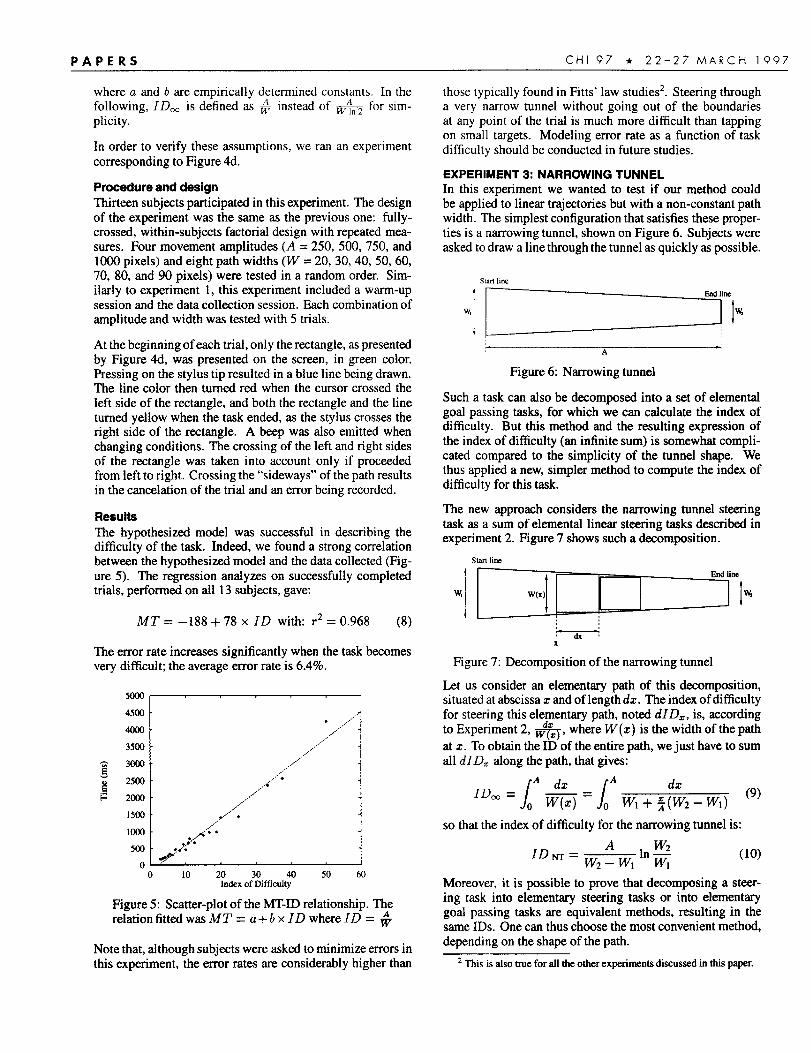
EXPERIMENT 2: INCREASING CONSTRAINTSExperiment 1 shows that a steering task with constraints onboth ends (two goals) follows the same logarithmic law asFitts’ tapping task. This serves as a stepping stone towardsformulating relationships between movement time and con-tinuous constraint in steering tasks. If the time needed topass two goals of width W over distance A follows Fitts’law, what happens if we place more “goals” on the trajec-tory? And what will the law become if we place infinitenumber of goals? Clearly, the resulting task is the straighttunnel steering task we proposed in the Introduction (Fig-ure 1). Note that the purpose of such a recursive analysisis to formulate a hypothetical relationship for the steeringtask; it is not to offer an explanation with psychomotor orneuromotor understanding of the steering control process.
The recursion, illustrated by Figure 4, is defined as follows:
● The fist step of the recursion is shown by Figure 4a whichis the same task as in Experiment 1: two-goal passing. Exper-iment 1 shows that the index of difficulty to move from goal1 to goal 2 is:
IDI = logz(; + 1) (3)
● The second step of the recursion follows Step 1 by dividingthe amplitude A into two identical amplitudes ~, as shownin Figure 4b. Since each of the two parts is a task modeledin step 1 with amplitude A/2, it is logical to assume the indexof difficulty to move from goal 1 to goal 3 via goal 2 is:
ID2 = 210g2(* + 1)
● ✎ ✎✎
(4)
God Goal,
wII II
w
A
(a) Step 1: ]Dl = log2(# + 1)
Goal, Gdz Goal,
wH I II
w
(b) Step 2: IDz = 2 log2(~ + 1)
wII I
● e,I I
● 00I II
w
(c) Step N: IDN = N log2(~ + 1)
NMline &d lime
WI I I Iw
A
Figure 4: Defining a recursion with goal passing tasks
● The A@ stet) divides the arrditude A into N identical. .amplitudes f, u shown in Figure 4c. The difficulty to movefrom goal 1 to goal N+l via goals 2,3, ..., N is:
IDN = N log2( —;W + 1)
(5)
This recursion is interesting because of the increasing con-straint it imposes onto movements: the bigger N is, the morecareful the subject has to be in order to pass through all goals.If N tends to infinity, the task becomes a “tunnel traveling”task. The tunnel has length of A and width of W. (Fig-ure 4d). It is also possible to determine the index of difficultyfor the limit task by determining the limit of the index ofdifficulty recursion IDN. Indeed, using a first order Taylorseries expansion of log2 ( 1 + z), we obtain:
(6)
Therefore, such art analysis predicts that the difficulty toachieve this tunnel traveling task is not related to the log-arithm of ~ but to ~. This leads to equation 7:
MT=a+b~ (7)
PAPERS CHI Q7 * 22-27 MARCS 1’?97
where cr and b are empirically determined cons(ants. In thefollowing, IDm is defined as ~ instead of ~ for sim-plicity.
In order to verify these assumptions, we ran an experimentcorresponding to Figure 4d.
Procedure and designThirteen subjects participated in this experiment. The designof the experiment was the same as the previous one: fully -crossed, within-subjects factorial design with repeated mea-sures. Four movement amplitudes (A = 250, 500, 750, and1000 pixels) and eight path widths (W= 20, 30, 40,50,60,70, 80, and 90 pixels) were tested in a random order. Sim-ilarly to experiment 1, this experiment included a warm-upsession and the data collection session. Each combination ofamplitude and width was tested with 5 trials.
At the beginning of each trial, only the rectangle, as presentedby Figure 4d, was presented on the screen, in green color.Pressing on the stylus tip resulted in a blue line being drawn.The line color then turned red when the cursor crossed theleft side of the rectangle, and both the rectangle and the lineturned yellow when the task ended, as the stylus crosses theright side of the rectangle. A beep was also emitted whenchanging conditions. The crossing of the left and right sidesof the rectangle was taken into account only if proceededfrom left to right. Crossing the “sideways” of the path resultsin the cancellation of the trial and an error being recorded.
ResultsThe hypothesized model was successful in describing thedifficulty of the task. Indeed, we found a strong correlationbetween the hypothesized model and the data collected (Fig-ure 5). The regression analyzes on successfully completedtrials, performed on all 13 subjects, gave:
MT= –188 +78 x ID with: r2 = 0.968 (8)
The error rate increases significantly when the task becomesvery difficult; the average error rate is 6.4170.
4553
4000
3500
3000
2500
2000
1500
IOa3
500
n“o 102030405060
indexof Difficulty
Figure 5: Scatter-plot of the MT-ID relationship. Therelation fitted was MT = a + b x ID where ID = ~
Note that, although subjects were asked to minimize errors inthis experiment, the error rates are considerably higher than
those typically found in Fitts’ law studies2. Steering througha very narrow tunnel without going out of the boundariesat any point of the trial is much more difficult than tappingon small targets. Modeling error rate as a function of taskdifficulty should be conducted in future studies.
EXPERIMENT 3: NARROWING TUNNELIn this experiment we wanted to test if our method couldbe applied to linear trajectories but with a non-constant pathwidth. The simplest configuration that satisfies these proper-ties is a namowing tunnel, shown on Figure 6. Subjects wereasked to draw a line through the tunnel as quickly as possible.
Slal’1llne
w:~”
A
Figure 6: Narrowing tunnel
Such a task can also be decomposed into a set of elementalgoal passing tasks, for which we can calculate the index ofdifficulty. But this method and the resulting expression ofthe index of difficulty (an infinite sum) is somewhat compli-cated compared to the simplicity of the tunnel shape. Wethus applied a new, simpler method to compute the index ofdifficulty for this task.
The new approach considers the narrowing tunnel steeringtask as a sum of elemental linear steering tasks described inexperiment 2. Figure 7 shows such a decomposition.
Marlline
‘l~’w
L+
x
Figure 7: Decomposition of the narrowing tunnel
Let us consider an elementary path of this decomposition,situated at abscissa z and of length dx. The index of difficultyfor steering this elementary path, noted dID=, is, accordingto Experiment 2, ~, where W(z) is the width of the pathat x. To obtain the ID of the entire path, we just have to sumall dIDc along the path, that gives:
so that the index of difficulty for the narrowing tunnel is:
IDW=A ,n ~
W2 – WI WI(lo)
Moreover, it is possible to prove that decomposing a steer-ing task into elementary steering tasks or into elementarygoal passing tasks are equivalent methods, resulting in thesame IDs. One can thus choose the most convenient method,depending on the shape of the path.
2This is atsotrueforatl theotherexperimentsdiscussedin thispaper.
CHI 97 * 22-27 MARCH 1997 PAPERS
Procedure and designTen subjects participated in this experiment. The design andprocedure of the experiment was the same as for experiment2. Parameters were set as follows: WI = 20,30, 40, 50; W2=8; A = 250,500,750, 1000.
ResultsAs shown in Figure 8, the completion time of the successfultrials and index of difficulty for the narrowing tunnel steeringtask once again forms a linear relationship as follows:
MT= –532 +93 x ID with: r2 = 0.978 (11)
Due to the high constraint on the right end of the tunnel, higherror rate occurred in all conditions. The average error rateis close to 18Y0.
7000
613LH3t
.,...
,,.,/’” !,..,
5000 -/.’”
,,..,:
../’” “401M - . “,’,,.
3000 - Y“”,? .
2000 /:y
1000 -,:9 /“s’
o . ““,o 10203040506070 80
Indexof Difficulty
Figure 8: Scatter-plot of the MT-ID relationship forthe narrowing tunnel task
A GENERIC APPROACH: DEFINING A GLOBAL LAWThe narrowing tunnel study brought the new concept of inte-grating the inverse of the path width along the trajectory. Webelieve that this approach is generic, that is to say that it ispossible to propose an extension of this method to complexpaths such as the one shown in Figure 9.
\.,
Figure 9: Integrating along a curve
To establish a generic formula we introduced the curvilinearabscissa as the integration variable if C is a curved path,we define the index of difficulty for steering through thispath as the sum along the curve of the elementary indexes ofdifficulty. We thus obtain the generic expression of IDc:
/
dsIDC = —
~ w(s)(12)
Our hypothesis was then that the time to steer through C islinearly related to IDc, that is:
/
dsTc=a+b —
c w(s)(13)
where a and b are constants. This formula is a generalizationof the cases presented earlier, which can be deduced from it.As an example, let us consider the horizontal steering taskcorresponding to experiment 2. In this case, W(s) is constantand equal to W, so that equation 13 gives:
Tc=a+b~I
ds=a+b. ~WC
(14)
which is equation 7 found in experiment 2.
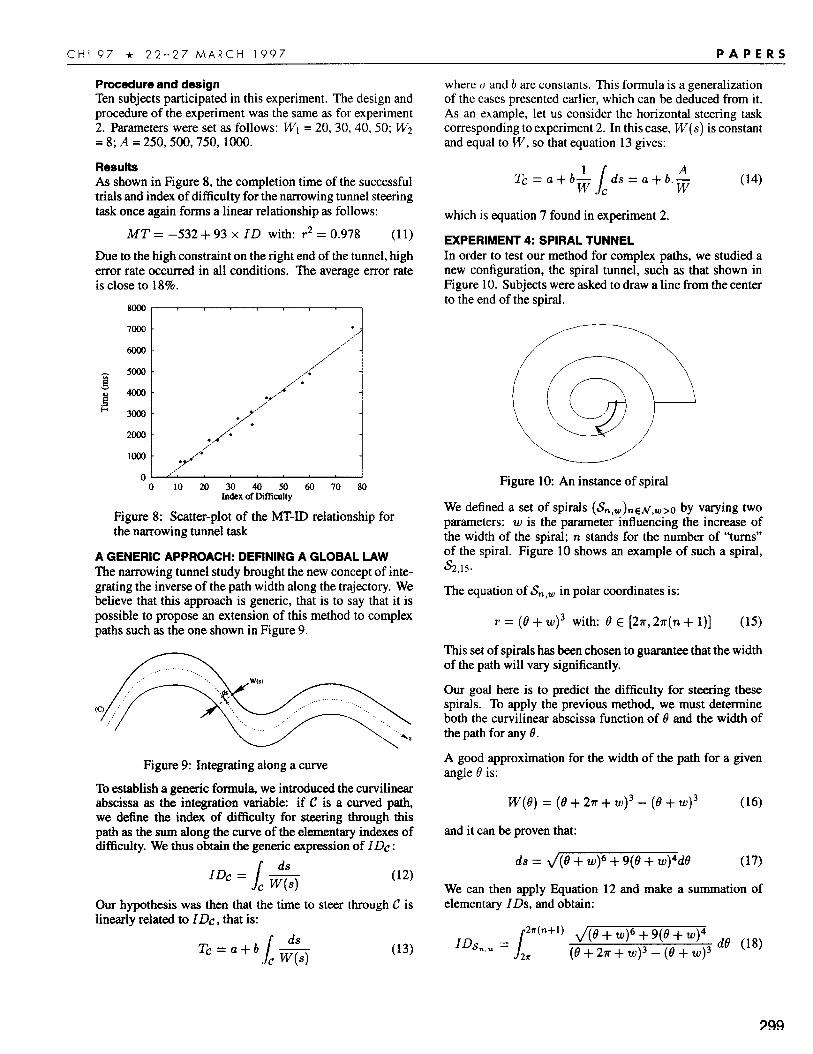
EXPERIMENT 4: SPIRAL TUNNELIn order to test our method for complex paths, we studied anew configuration, the spiral tunnel, such as that shown inFigure 10. Subjects were asked to draw a line from the centerto the end of the spiral.
Figure 10: An instance of spiral
We defined a set of spirals (tSn,W)n~N,W >0 by varying two
parameters: w is the parameter influencing the increase ofthe width of the spiral; n stands for the number of “turns”of the spiral. Figure 10 shows an example of such a spiral,
S2,15.
The equation of S.,W in polar coordinates is:
r = (0+ W)3 with: O c [27r,27r(ra + 1)] (15)
This set of spirals has been chosen to guarantee that the widthof the path will vary significantly.
Our goal here is to predict the difficulty for steering thesespirals. To apply the previous method, we must determineboth the curvilinear abscissa function of O and the width ofthe path for any 0.
A good approximation for the width of the path for a givenangle 6’is:
w(o) = (8+ 27r+ W)3 – (f?+ W)3 (16)
and it can be proven that:
ds = /(6+ W)6 + 9(6 + w)4d0 (17)
We can then apply Equation 12 and make a summation ofelementary IDs, and obtain:
/
2m(n+l)
ID5n,w =/(8 + W)6 + 9(0 + W)4
2T (e+27r+ W)3 - (0+ W)3 ‘e ’18)
299
PAPERS CHI 97 * 22-27 MARCH 1997
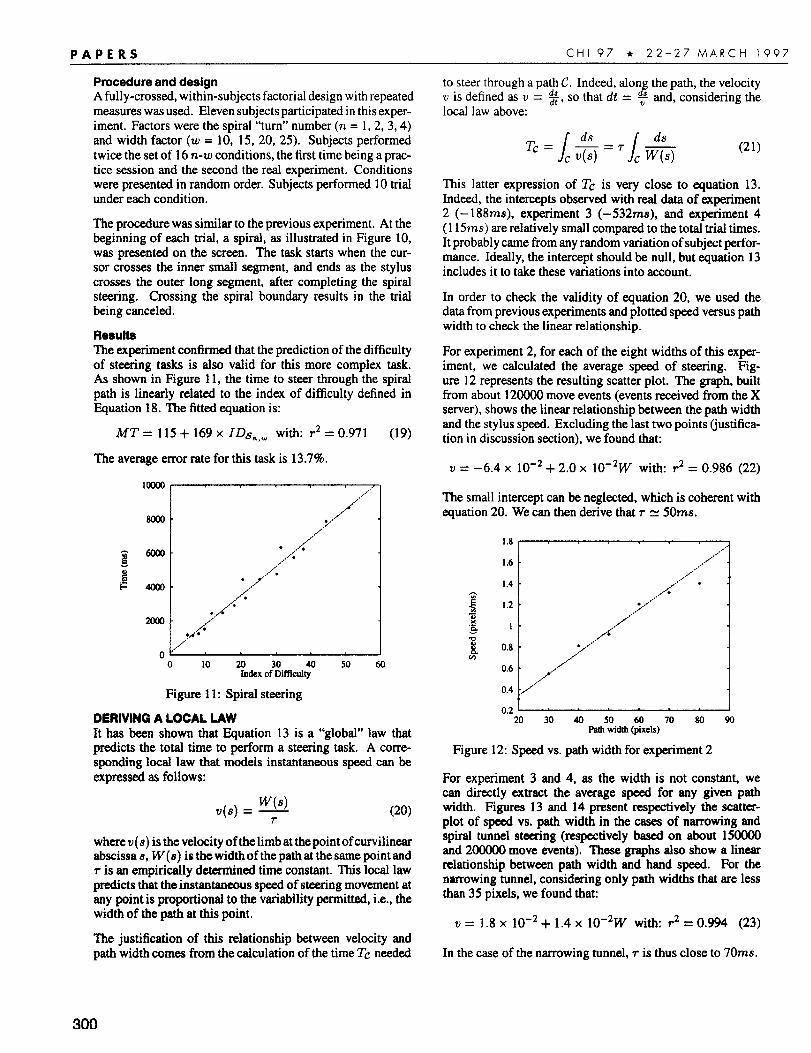
Procedure and designA fully-crossed, within-subjects factorial design with repeatedmeasures was used. Eleven subjects participated in this exper-iment. Factors were the spiral “turn” number (n = 1, 2, 3, 4)and width factor (w = 10, 15, 20, 25). Subjects performedtwice the set of 16 n-w conditions, the first time being a prac-tice session and the second the rest experiment. Conditionswere presented in random order. Subjects performed 10 trialunder each condition.
The procedure was similar to the previous experiment. At thebeginning of each trial, a spiral, as illustrated in Figure 10,was presented on the screen. The task starts when the cur-sor crosses the inner small segment, and ends as the styluscrosses the outer long segment, after completing the spiralsteering. Crossing the spiral boundary results in the trialbeing canceled.
ResutteThe experiment confirmed that the prediction of the difficultyof steering tasks is also valid for this more complex task.As shown in Figure 11, the time to steer through the spiralpath is linearly related to the index of difficulty defined in&uation 18. he fitted equation is: -
M?’ = 115+ 169 x Illsn,w with: r2 = 0.971
The average error rate for this task is 13.7%.
IL
m ,./’’>’A
(19)
o 10 m 50 60Jndcxof3~iffkul&@
Figure 11: Spiral steering
DERIVING A LOCAL LAWIt has been shown that Equation 13 is a “global” law thatpredicts the total time to perform a steering task. A corre-sponding load law that models instantaneous speed ean beexpressed as follows:
.(s) = ~7-
(20)
where v(s) is the velocity of the limb at the point of curvilinearabscissa S, W(8) is the width of the path at the same point andT is an empirically determined time constant. This local lawpredicts that the instantaneous speed of steering movement atany point is proportional to the variability permitted, i.e., thewidth of the path at this point.
The justification of this relationship between velocity andpath width comes from the calculation of the time TC needed
to steer through a path C. Indeed, alon the path, the velocityv is defined as v = ~, fso that dt = & and, considering thelocal law above:
‘C=l%=’h% (21)
This latter expression of Tc is very close to equation 13.Indeed, the intercepts observed with real data of experiment2 (– 188ms), experiment 3 (-532ms), and experiment 4(115ms) are relatively small compared to the total trial times.It probabl y came from any random variation of subject perfor-mance. Ideally, the intercept should be null, but equation 13includes it to take these variations into account.
In order to check the validity of equation 20, we used thedata from previous experiments and plotted speed versus pathwidth to check the linear relationship.
For experiment 2, for each of the eight widths of this exper-iment, we calculated the average speed of steering. Fig-ure 12 represents the resulting scatter plot. The graph, builtfrom about 120000 move events (events received from the Xserver), shows the linear relationship between the path widthand the stylus speed. Excluding the last two points @stifica-tion in discussion section), we found that:
v = –6.4 x 10⁻² + 2,0 x 10⁻²W with: r2 = 0.986 (22)
The small intercept can be neglected, which is coherent withequation 20. We can then da;ve that T R 50ms.
.—20304050607080 90
Pathwidth(pixels)
Figure 12: Speed vs. path width for experiment 2
For experiment 3 and 4, as the width is not constant, wecan directly extract the average speed for any given pathwidth. Figures 13 and 14 present respectively the scatter-plot of speed VS, path width in the cases of narrowing andspirat tunnel steering (respectively based on about 150000and 200000 move events). These graphs also show a linearrelationship between path width end hand speed. For thenarrowing tunnel, considering only path widths that are lessthan 35 pixels, we found that:
v = 1.8 x 10⁻² + 1.4 x 10⁻²W with: r2 = 0.994 (23)
In the case of the narrowing tunnel, T is thus close to 70ms.
300
CHI 97 * 22-27 MARCH 1997 PAPERS
0.7,...”
...’0.6
I
.,’”... .,,,..”. . . 1..
0.5...’
.4”’. ● .,.#”
....’”0.4 - #
~..,’#
0.3 - ,./r’
,W’
0.2/“’,-
/’+’,,,-.
0.1I 15 10 15 20 25 30 35 40 45 50
Pathwidth (pixels)
Figure 13: Speed vs. path width for experiment 3
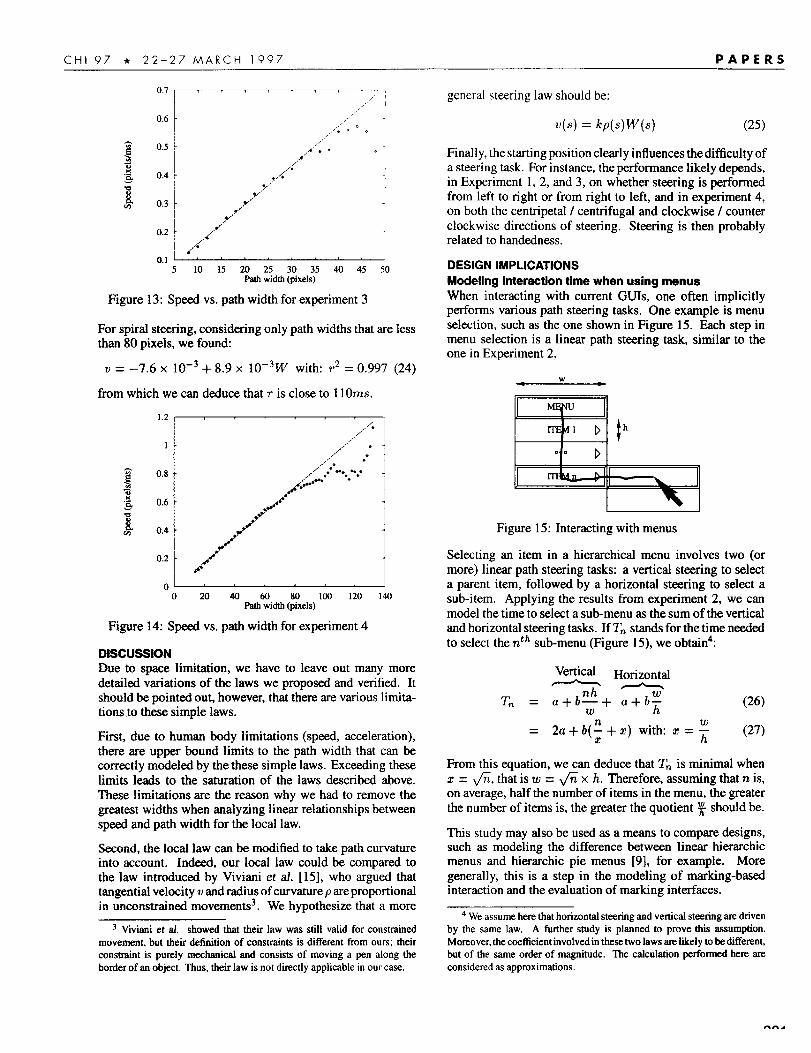
For spiral steering, considering only path widths that are lessthan 80 pixels, we found:
rJ = –7.6 x 10⁻³ + 8.9 x 10⁻³W with: r2 = 0.997 (24)
from which we can deduce that T is close to 110ms.
1
0.8 -
0.6 -
0.4 -
,,,.,’.,/’
,.,,’ ,,/,’
,/,’ .“,,.’ . .
,/” .. -*. *,*‘,&.O.. ●
.&•
./’”’&*”
1.2 ,
n 1 1-0204060 s0100 120 140
Pathwidth (pixels)
Figure 14: Speed vs. path width for experiment 4
DISCUSSIONDue to space limitation, we have to leave out many moredetailed variations of the laws we proposed and verified. Itshould be pointed out, however, that there are various limita-tions to these simple laws.
First, due to human body limitations (speed, acceleration),there are upper bound limits to the path width that can becorrectly modeled by the these simple laws. Exceeding theselimits leads to the saturation of the laws described above.These limitations are the reason why we had to remove thegreatest widths when analyzing linear relationships betweenspeed and path width for the local law.
Second, the local law can be modified to take path curvatureinto account. Indeed, our local law could be compared tothe law introduced by Viviani er al. [15], who argued thattangential velocity v and radius of curvature pare proportional
3 We hypothesize that a morein unconstrained movements .
3 Vlvimi et ~, showed tit their law was still vatid for constrained
movement, but their definition of constraints is different from ours; their
constraint is purely mechanical and consists of moving a pen along the
border of an object. Thus, their law is not directly applicable in our case.
general steering law should be:
v(s) = kp(s)w(s) (25)
Finally, the starting position clearly influences the difficulty ofa steering task. For instance, the performance likely depends,in Experiment 1, 2, and 3, on whether steering is performedfrom left to right or from right to left, and in experiment 4,on both the centripetal / centrifugal and clockwise / counterclockwise directions of steering. Steering is then probablyrelated to handedness.
DESIGN IMPLICATIONSModeling interaction time when using menusWhen interacting with current GUIS, one often implicitlyperforms various path steering tasks. Gne example is menuselection, such as the one shown in Figure 15. Each step inmenu selection is a linear path steering task, similar to theone in Experiment 2.
B&ihD
Jrr
(
I I
Figure 15: Interacting with menus
Selecting an item in a hierarchical menu involves two (ormore) linear path steering tasks: a vertical steering to selecta parent item, followed by a horizontal steering to select asub-item. Applying the results from experiment 2, we canmodel the time to select a sub-menu as the sum of the verticaland horizontal steering tasks. If Tn stands for the time neededto select the nth sub-menu (Figure 15), we obtain4:
s Horizontal/ \
T. = a+b$+ a+b~ (26)
= 2a+ b(~+z)with:z=~ (27)
From this equation, we can deduce that T. is minimal whenz = W, that is w = W x ~. Therefore, assuming that n is,on average, half the number of items in the menu, the greaterthe number of items is, the greater the quotient ~ should be.
This study may also be used as a means to compare designs,such as modeling the difference between linear hierarchicmenus and hierarchic pie menus [9], for example. Moregenerally, this is a step in the modeling of marking-basedinteraction and the evaluation of marking interfaces.
4 We assume here that horizorrtat steering and verticat steering are driven
by the same law. A further study is planned to prove this assumption.
Moreover, the coefficient involved in these two laws am tikely to be different,
but of the same order of magnitude. The calculation performed here am
considered as approximations.
301
PAPERS CHI 97 * 22-27 MARCH 1997
Performance Evaluation
By analogy to 1P in Fitts’ law, bin equation 13 and Tin equa-tion 20, can be used as indexes for performance comparisons.Device [2, 11] and limb [3, 10] comparisons have been donewith Fitts’ Index of Performance in pointing tasks. b and ~in the steering laws will allow us to quantify performance intrajectory-based tasks, as a function of different devices, afunction of different body limbs, or a function of any designparameter changes such as control gain and transfer function,By applying the steering law, we plan to study performancedifferences among various input devices such as mouse, sty-lus, isometric joystick, and trackball.
CONCLUSIONFitts’ law is one of the very few robust and quantitative lawsthat can be applied to human-computer interaction researchand design. A great number of studies have been conductedto verify and apply Fhts’ law. We carried the spirit of Fitts’law a step forward and explored the possible existence ofother robust regularities in movement tasks. In this study, wefirst demonstrated that the logarithmic relationship betweenmovement time and tangential width of target in a tappingtask also exists between movement time and normal width ofthe target in a “goal passing” task. A thought experiment ofplacing infinite numbers of goals along a movement trajectorylead us to hypothesize that there is a simple linear relationshipbetween movement time and the “tunnel” width in steeringtasks. We then confirmed such a relationship in three typesof “tunnels”: straight, narrowing, and spiral, all with correla-tions greater than 0.96. We then generalize the relationshipsin both integral and local forms. The integral form statesthat the steering time is linearly related to the index of dif-ficulty, which is defined as the integral of the inverse of thewidth along the path; the local form states that the speed ofmovement is linearly related to the normal constraint.
The regularities presented in this study may enrich the smallrepertoire of quantitative tools in HCI research and design.Device comparison and menu design are just two of the manypotential HCI applications.
ACKNOWLEDGMENTSThis research was undertaken under the auspices of the InputResearch Group of the University of Toronto, directed byBill Buxton who has made substantial contributions to thedevelopment of this paper. The work was supported by
the Centre d’Etude de la Navigation A6rienne (CENA), theInformation Technology Research Center of Ontario (ITRC),AliaslWavefront Inc., the Natural Sciences and Engineer-ing Research Council of Canada (NSERC), and the IBMAlmaden Research Center. We are indebted to the mem-bers of the IRG group for their input. We would also liketo thank Wacom Corporation Inc. for their contributions tothe project. We particularly like to thank Thomas Baudel ofAliaslWavefront, St6phane Chatty of the CENA, and WilliamHunt of the University of Toronto for their helpful commentson the project.
REFERENCES
1. Buxton, W. (1987). The haptic channel. Chapter 8 inBaecker, R. M., & Buxton, W., Readings in Human-
2.
3.
4.
5.
6.
7.
8.
9.
10.
11.
12.
13.
14.
Co/}~puter Interaction. Morgan Kaufmann Publishers,357-365.
Card, S.K., English, W.K., & Burr, B. J. (1978).Evaluation of mouse, rate-controlled isometric joystick,step keys and text keys for text selection on a CRT.Ergonomics, 21(8), 601-613.
Card, S.K., Mackinlay, J.D., & Robertson, G.G. (1991).A morphological analysis of the design space of inputdevices. ACM Transactions on Information Systems,9(2), 99-122.
Cadton, L.G. (1981). Processing visual feedback infor-mation for movement control. Journul of Experimen-tal Psychology: Human Perception and Pe~ormance, 7,1019-1030.
Crossman, E.R.F. & Goodeve, P.J. (1983). Feedback con-trol of hand-movement and Fitts’ law. Quarterly Journalof Experimental Psychology, 35A, 251-278.
Fitts, P.M. ( 1954). The information capacity of the humanmotor system in controlling the amplitude of movement.Journal of Experimental Psychology, 47,381-391.
Freeman, F.N. (1914). The teaching of handwriting.Boston: Houghton Mifflin.
Keele, S.W. & Posner, M.I. (1968). Processing of visualfeedback in rapid movements. Journal of ExperimentalPsychology, 77, 155-158.
Kurtenbach, G. & Buxton, W. (1994). User learning andperformance with marking menus. Proceedings ofACMCHI’94 Conference on Human Factors in ComputingSystems, 258-264.
Langolf, G.D., Chaffin, D.B. & Foulke, J.A. (1976). Aninvestigation of Fltts’ law using a wide range of move-ment amplitudes. Journal ofMotorBehavior, 8, 113-128.
MacKenzie, 1.S., Sellen, A., & Buxton, W. (1991). Acomparison of input devices in elemental pointing anddragging tasks. Proceedings of ACM CHI’91 Conferenceon Human Factors in Computing Systems , 161-166.
MacKenzie, 1.S., & Buxton, W. (1992). Extending Fitts’law to two-dimensional tasks. Proceedings of ACMCHI ’92 Conference on Human Factors in ComputingSystems, 219-226.
MacKenzie, I. S. (1992). Fitts’ law as a research anddesign tool in human-computer interaction. Human-Computer Interaction, 7,91-139.
Newell A., & Card, S.K. (1985). The Prospects forpsychological science in human~computer in~eraction.Human-Computer Interaction, 1,209-242.
15. Vlviani, P. & Terzuolo, C.A. (1982). Trajectory deter-mines movement dynamics. Neuroscience, 7,431-437.
16. Zelaznik, H.N., Hawkins, B., & Kisselburg, L. (1983).Rapid visual feedback processing in single-aimed move-ments. Journal of Motor Behavior, 15,217-236.


![Bibliography · Tracing. In Proc. Eurographics ’87, Amsterdam, The Netherlands, pages 1–10, August 1987. [AZ97]Johnny Accot and Shumin Zhai. Beyond Fitts’ law: Models for trajectory-based](https://img.dokumen.tips/doc/110x75/606b34e3a252163ff71fb709/tracing-in-proc-eurographics-a87-amsterdam-the-netherlands-pages-1a10.jpg)


![REDACTED VERSION · on 27 years of Fitts’ law research in HCI. International Journal of Human-Computer Studies, 61, 751-789. [J] 26. Miniotas, D., Spakov, O., & MacKenzie, I. S](https://img.dokumen.tips/doc/110x75/60c25f8beb5e0043d60dfd72/redacted-version-on-27-years-of-fittsa-law-research-in-hci-international-journal.jpg)