Embed Size (px)
Citation preview

CHERRY Discussion Paper Series CHERRY DP 12/02
Discount rate policy under the Classical Gold Standard:core versus periphery (1870s – 1914)
By
Matthias Morys

1
Discount rate policy under the Classical Gold Standard:core versus periphery (1870s – 1914)
Matthias MorysDepartment of Economics
University of [email protected]
March, 2012
AbstractDrawing on a new data set of monthly observations, this paper investigates similaritiesand differences in discount rate policy of 12 European countries under the Classical GoldStandard; it asks, in particular, whether bank rate policy followed different patterns incore and peripheral countries. Based on OLS, ordered probit and pooled estimations ofcentral bank discount rate behaviour, two main findings emerge: first, the discount ratedecisions of core countries were motivated by keeping the exchange-rate within the goldpoints. In stark contrast, the discount rate decisions of peripheral countries reflectedchanges in the domestic cover ratio. The main reason for the different behaviour was thelimited effectiveness of the discount rate tool for peripheral countries which resulted inmore frequent gold point violations. Consequently, peripheral countries relied on highreserve levels and oriented their discount rate policy towards maintaining the reservelevel. Second, interest rate decisions were influenced by Berlin and London to a similardegree, suggesting that the European branch of the Classical Gold Standard was lessLondon-centered than hitherto assumed. In establishing general patterns of discount ratepolicy, this paper aims to contribute to the wider question of monetary policy under thegold standard and the core-periphery dichotomy.
Keywords: gold standard, rules of the game, balance-of-payment adjustment,central banking
JEL classification: E4, E5, E6, F3, N13
________________________Earlier versions of this paper were presented at the AEA, EHES, EHS and IEHA meetings; at seminars in Antwerp,Berkeley, Glasgow, Leuven, NYU, Oxford, Paris, Rutgers, York; and at the EABH Young Scholars Workshop inRotterdam and the SEEMHN Annual Conference in Bucharest. I am grateful to all participants for their spiriteddiscussion and helpful suggestions, and in particular to Dion Bongaerts, Michael Bordo, Barry Eichengreen, ClemensJobst, Chris Meissner, Larry Neil, Jaime Reis, Alan Taylor and Marc Weidenmier. I owe a special thanks to thefollowing people in helping me collect the data: Ivo Maes and Arnold de Schepper (National Bank of Belgium), KathBegley (Bank of England), Alfredo Gigliobianco (Bank of Italy), Mrs Beex (De Nederlandsche Bank), all members ofthe data collection task force of the South-East European Monetary History Network, Erik Buyst, Jan Tore Kloveland,Larry Neal, Giuseppe Tattara, Anders Ogren and Marc Weidenmier. The usual disclaimer applies.

2
CHAPTER ONE INTRODUCTION
The Classical Gold Standard (1870s – 1914) has attracted the interest of economists, economic
historians and policy-makers ever since its foundation. The exchange-rate stability among most
countries of the world for some forty years was unprecedented and remained an inspiration for
policy-makers after both world wars. At the time, adherence to gold was not entirely
uncontroversial, as the international bimetallic movement of the mid-1870s to mid-1890s
demonstrates.1 But the perspective soon changed as a result of monetary instability following World
War I and high exchange-rate volatility in the 1930s; policy-makers came to idealize the pre-World
War I gold standard as a benchmark against which any international monetary system should be
measured – hence the label Classical Gold Standard.
Economists and economic historians, aware of costs and benefits of adhering to a system of
fixed exchange-rates, have tended to avoid the eulogistic tone of policy-makers; they have
contributed to the gold standard myth, however, by producing a highly stereotypical account of its
working. Some of the stereotypes have surely been overturned by more recent research. Following
Hume’s price-specie mechanism (1752), the textbook account of the gold standard had it that
physical gold was shipped between countries to settle balance-of-payments disequilibria. Recent
research, following earlier leads2, has demonstrated the importance and sophistication of foreign
exchange policy.3 In other cases, recent research has provided the empirical basis to verify or reject
some of the claims made in the older gold standard literature. This would be the case for the
discussion on the benefits of gold standard adherence which are seen in improved access to global
1 Reti, Silver and Gold: The Political Economy of International Monetary Conferences. 1867-1892 (Westport (CT),London: Greenwood, 1998).
2 Lindert, Key Currencies and Gold. 1900-1913, Princeton Studies in International Finance 24 (Princeton1969).3 Jobst, "Market Leader: The Austro-Hungarian Bank and the Making of Foreign Exchange Intervention, 1896-1913,"
European Review of Economic History 13, no. 3 (2009).

3
capital markets and reduced transaction costs with other gold standard countries.4 Yet another
strand of the recent literature has highlighted conditions crucial to the workings of the Classical
Gold Standard which had been neglected so far, such as the importance of labour mobility and
remittances in smoothing the adjustment mechanism.5
While the gold standard myth has given way to a broader empirical analysis in some
debates, in other areas it stubbornly persists. One of them is the alleged core-periphery dichotomy.
It is argued that the adjustment process to balance-of-payments disequilibria was much smoother
for the industrialised core countries of North-Western Europe as opposed to the peripheral
economies. Different authors have emphasised different factors in explaining the alleged advantages
of the core countries in the adjustment process. Drawing on the theory of optimum currency areas,
one school of thought has argued that core countries were better suited for monetary integration.6
Others have argued that central banks7 of core countries helped each other in times of crisis, but did
not help peripheral economies for the lack of self-interest.8 The more recent literature has
emphasized differences in credibility9, whereas an older school of thought highlighted the
peripheral countries’ role as debtors in the global financial system which made them vulnerable to
sudden withdrawals of funds in times of financial strain.10
4 Bordo and Rockoff, "The Gold Standard as a 'Good Housekeeping Seal of Approval'," Journal of Economic History56(1996). Lόpez-Cόrdova and Meissner, "Exchange-Rate Regimes and International Trade: Evidence from the Classical Gold Standard Era," American Economic Review 93(2003).
5 Esteves and Khoudour-Castéras, "A Fantastic Rain of Gold: European Migrants' Remittances and Balance ofPayments Adjustment During the Gold Standard Period," Journal of Economic History 69, no. 4 (2009). Khoudour-Castéras, International Adjustment During the Classical Gold Standard: The Migration Nexus, Working PaperChaire Finances Internationales, Science Po (Paris2005).
6 Martín Aceña and Reis, eds., Monetary Standards in the Periphery: Paper, Silver, and Gold. 1854-1933 (London,New York: MacMillan Press, St. Martin's Press,2000).
7 We will use the word “central bank” in the following, even though the transition to modern central banking had notyet been completed and the terminology “banks of note issue” would be more appropriate.
8 Eichengreen, "Central bank cooperation and exchange rate commitments: the classical and interwar gold standardscompared," Financial History Review 2(1995). Flandreau, "Central Bank Cooperation in Historical Perspective: ASceptical View," Economic History Review 50, no. 4 (1998).
9 Hallwood, MacDonald, and Marsh, "Credibility and fundamentals: Were the Classical and Interwar Gold StandardsWell-Behaved Target Zones?," in Modern Perspectives on the Gold Standard, ed. Bayoumi, Eichengreen, andTaylor (Cambridge: Cambridge University Press, 1996). Bordo and MacDonald, "Interest Rate Interactions in theClassical Gold Standard, 1880-1914: Was there any Monetary Independence?," Journal of Monetary Economics52(2005).
10 de Cecco, Money and Empire: The International Gold Standard, 1890-1914 (Oxford: Blackwell, 1974).

4
Although the existing literature allures to the core-periphery dichotomy, it is surprising to see that
little effort has gone into analyzing what exactly these differences consist of. A number of
publications of recent years on the experience of individual countries has greatly expanded our
knowledge of the European periphery under the Classical Gold Standard11; but case studies, by
design, can never substitute for a cross-country study analyzing similarities and differences between
countries based on the same methodology. Such comparative studies on different aspects of
monetary policy under the Classical Gold Standard exist, but they are mostly confined to comparing
core countries with each other.12
In this paper we aim to provide the first systematic comparison of discount rate policy under
the Classical Gold Standard based on the concept of a central bank reaction function. The discount
rate was the most important monetary policy instrument at the time; Bagehot’s famous description
of the London money market, for instance, is almost exclusively concerned with the discount rate.13
Modern research, going back to Bloomfield’s path-breaking 1959 study14, has followed this
approach. Drawing on a sample of 12 European countries (Austria-Hungary, Belgium, Bulgaria,
England, France, Germany, Italy, the Netherlands, Norway, Romania, Serbia, Sweden) and relying
on monthly data – the highest frequency available for all countries simultaneously –, we will
analyse the determinants of discount rate policy; in particular, we will ask whether core and
peripheral countries followed different patterns and, if so, explain why this was the case.
In the process of collecting the data required for this analysis, it became clear to us why a
comparative study of similar size and data frequency had never been conducted before: with the
11 Esteves, Reis, and Ferramosca, "Market Integration in the Golden Periphery: The Lisbon/London Exchange, 1854-1891," Explorations in Economic History 46, no. 3 (2009). Jobst, "Market Leader: The Austro-Hungarian Bank andthe Making of Foreign Exchange Intervention, 1896-1913." Reis, "An "Art" and not a "Science"? Central BankManagement in Portugal under the Gold Standard, 1863-1887," Economic History Review 60, no. 4 (2007). Tattara,"Paper money but a gold debt: Italy on the gold standard," Explorations in Economic History 40(2003). Ögren andOksendal, eds., The gold standard peripheries: monetary policy, adjustment and flexibility in a global setting(London: Palgrava Macmillan,2012).
12 Giovannini, "'Rules of the Game' during the International Gold Standard: England and Germany," Journal ofInternational Money and Finance 5(1986). Contamin and Denise, "Quelle autonomie pour les politiques monétairessous l'étalon-or, 1880-1913?," Economie Internationale. La Revue di CEPII 78(1999).
13 Bagehot, Lombard Street. A Description of the Money Market, 6th ed. (London: Kegan Paul, 1878).14 Bloomfield, Monetary Policy under the International Gold Standard, 1880-1914 (New York: Federal Reserve Bank
of New York, 1959), p. 27.
5
exception of England, Italy and Norway, the central banks have not made their historical balance
sheet data publicly available. Most of the data (though not all) could be found in the Annual Reports
of the time, but copies of these reports can nowadays only be found in the archives of the respective
central banks.15 Hence intensive collaboration with the central banks’ historical archives was
needed to reconstruct the time series.16
Which countries do we view as core and which ones as periphery? This dichotomy is often
used in the literature but rarely defined based on rigorous foundations. A classification based on
GDP per capita appears problematic in this context, as some countries considered peripheral by
most scholars would need to be classified as core (Argentina comes to mind and Ford’s famous
comparison with the UK17). In our context, any definition should rather capture the position in the
international economy and, in particular, the international financial system. Liquidity in the foreign
exchange market, for instance, provides evidence on the ability to attract short-term capital; another
potential indicator might relate to the ability to attract long-term capital: raising long-term capital is
more difficult for countries suffering from original sin than for those able to access global capital
markets in domestic currency.
Classifying countries into core and periphery along these two (or other similar) criteria
might lead to conflicting results; the example of the US comes to mind, which Morgenstern and
Schwartz classify as core, while Bordo and Eichengreen tend to see it as peripheral in the pre-WW I
financial architecture.18 Fortunately, our sample of 12 countries poses little risk of unclear
15 The only exception to this rule is the Bank of England which holds all of the German and many of the FrenchAnnual Reports. Interestingly enough, national libraries and university libraries did not even collect the AnnualReports of the bank of note issue of their own country (as they do today). Banks of note issue at the time wereprivately owned and the evolution towards a central bank was so gradual that librarians apparently judged thesereports to be akin to the Annual Reports of conventional commercial banks and hence did not deem holding thereports to be in the public interest.
16 I owe a special thanks to the following people in helping me collect the data: Ivo Maes and Arnold de Schepper(National Bank of Belgium), Kath Begley (Bank of England), Alfredo Gigliobianco (Bank of Italy), Mrs Beex (DeNederlandsche Bank), all members of the data collection task force of the South-East European Monetary HistoryNetwork, Erik Buyst, Jan Tore Kloveland, Larry Neal, Giuseppe Tattara, Anders Ogren and Marc Weidenmier.
17 Ford, Britain and Argentina (Oxford: Clarendon Press, 1962).18 We thank Michael Bordo for discussion on how the view of the US in the pre-World War I financial architecture has
changed over time in historiography.

6
classification: based on an analysis of foreign exchange-market liquidity, Flandreau&Jobst19
classify England, France, Germany, Belgium and the Netherlands as “key countries”20 of the
international monetary system in 1880, a year which conveniently coincides with the beginnings of
our estimation period; we would choose exactly the same five countries if we looked at the second
criterion allured to above, i.e., the ability to issue sovereign bonds in terms of their own currency:
from the 12 countries in our sample, Bordo&Flandreau show that it is the same five countries who
were in a position to issue debt abroad in their own currency.21 In the following, we will therefore
treat Belgium, England, France, Germany and the Netherlands as core countries and the other seven
countries as periphery.
The remainder of the paper is organized as follows. In the second chapter we will estimate central
bank reaction functions for core and peripheral countries. Having established that the two types of
countries reacted to different variables in setting their discount rate, chapter three aims at explaining
the differences; based on published sources and internal documents of the time, we will show that
peripheral countries adapted the “English” gold standard to suit their needs; a modification which
also impinged on how exactly the discount rate was be used. Chapter four summarizes and
concludes.
19 Flandreau and Jobst, "The ties that divide: a network analysis of the international monetary system, 1890-1910,"Journal of Economic History 65, no. 4 (2005): p. 997.
20 Flandreau&Jobst have a classification into key-internediary-periphery in mind rather than a dichotomy between coreand periphery only; the implication for our research is that we merge the second and the third group into a singlegroup labelled “periphery”.
21 Bordo and Flandreau, "Core, periphery, exchange rate regimes, and globalization," in Globalization in historicalperspective, ed. Bordo, Taylor, and Williamson (Chicago: University of Chicago Press, 2003), p. 439.

7
CHAPTER TWO DETERMINANTS OF DISCOUNT RATE DECISIONS
Components of a central bank reaction function
Adherence to the gold standard implied two main constraints. First, in order to maintain confidence
in the domestic monetary system, banks of note issue were required to hold a certain minimum level
of reserves against bank notes in circulation; if the ratio between the two – usually referred to as the
cover ratio – fell below some statutory level (typically 30% - 40%), some sort of sanction would be
applied. In extremis, this could lead to the complete loss of the note issuing privilege granted by the
government.22
The second constraint relates to the international dimension of the gold standard, i.e., the
need to keep the exchange-rate within the gold points. As the vast majority of transactions in the
late 19th century were settled by bills of exchange23, the exchange-rate (i.e., the price of a bill of
exchange drawn on a foreign country) could deviate from mint parity (i.e., the “standard” exchange-
rate implied by the respective mint ratios); only over and above some level of deviation – known as
the gold export point -, it will be advantageous to settle debt with (physical) gold, transaction costs
notwithstanding (mainly shipping and insurance). As such withdrawal of gold from domestic
circulation led, directly or indirectly, to a loss in reserves, central banks used the discount rate to
prevent the exchange-rate from breaking out of the gold points.
Third, discount rate decisions might be explained by patterns of interest rate followership
vis-à-vis England, France and Germany. In a world of fixed exchange-rates and capital mobility, the
macroeconomic policy trilemma implies that “small countries” have to follow the interest rates set
by “large countries”.24
22 Reichsbank, Vergleichende Notenbank-Statistik. Organisation und Geschäftsverkehr wichtiger europäischerNotenbanken 1876-1913 statistisch dargestellt (Berlin: Reichsdruckerei, 1925).
23 Denzel, "The European Bill of Exchange. Its Development from the Middle Ages to 1914," in Cashless Paymentsand Transactions from the Antiquity to 1914, ed. Chaudhuri and Denzel (Stuttgart: Franz Steiner Verlag, 2008).
24 Obstfeld, Shambaugh, and Taylor, "The Trilemma in History: Tradeoffs among Exchange Rates, Monetary Policies,and Capital Mobility," Review of Economics and Statistics 87, no. 3 (2005).
8
In an ideal world, we would also include real economic variables such as output,
unemployment or whether the economy is in an expansionary or contractionary phase of the
business cycle; for, after all, central bank reaction functions are meant to shed light on the trade-off
between the external constraint (or, in today’s setting, the inflation target) and the incentive to
stimulate the domestic economy. This approach is well exemplified by Eichengreen&Watson&
Grossman’s study on the Bank of England interwar discount rate policy, where real economic
conditions are captured by monthly series on output and unemployment.25 Real economic data on
such frequency are available for our period not even for England, France and Germany26, let alone
for the other 9 countries (for many of which we would not even have decent annual GDP estimates).
We can therefore only point out to the problem and move on.
Modelling a central bank reaction function
Our model emerges naturally from our previous discussion. The discount rate is perceived as a
function of the exchange-rate, the cover ratio and interest rates set abroad. As for exchange-rate and
interest rate, we choose England, France and Germany as the reference point, following widespread
practice in the literature.27
Two more decisions need to be taken: first, shall we model specific discount rate changes or,
more generally, discount rate behaviour? In the first case, we wish to explain why, for instance, the
Bank of England increased its discount rate by 100 basis points on 31st October 1907 (the American
Banking Crisis reaches England). Some of the literature follows exclusively this approach28, but in
confining our sample to actual discount rate changes we miss an important dimension: if central
banks leave the discount rate unchanged at their monthly meeting, this also constitutes a decision
25 Eichengreen, Watson, and Grossman, "Bank Rate Policy under the Interwar Gold Standard: A Dynamic ProbitModel," Economic Journal 95(1985).
26 Bordo and MacDonald, "Interest Rate Interactions in the Classical Gold Standard, 1880-1914: Was there anyMonetary Independence?." are faced with the same problem and are forced to rely on an interpolated series forEngland, France and Germany. As our sample of countries is larger, we cannot go down that road.
27 Tullio and Wolters, "Monetary policy in Austria-Hungary, 1876-1913: an econometric analysis of the determinantsof the central bank's discount rate and the liquidity ratio," Open Economy Review 18(2007). Contamin and Denise,"Quelle autonomie pour les politiques monétaires sous l'étalon-or, 1880-1913?."
28 Tullio and Wolters, "Monetary policy in Austria-Hungary, 1876-1913: an econometric analysis of the determinantsof the central bank's discount rate and the liquidity ratio."
9
worth investigating. Consequently, we will model discount rate changes as well as monthly
discount rate behaviour. The frequency of the second approach will be monthly; this is the highest
frequency available (for all countries simultaneously), but it also seems justified, as our sources
suggest most central banks at the time had one (regular) meeting each month.
Second, shall we pool the data or conduct country-specific regressions? The appeal of the
latter option is to pursue a general-to-specific approach, thereby establishing which regressors
mattered for which country. On the other hand, direct comparability of results is better ensured by
pooling the data with country-specific (or group-specific) regressors; moreover, country-specific
regressions might constitute a case of seemingly unrelated regressions (SUR) and hence be
econometrically questionable. As each approach has its own advantages, we decided to pursue both.
This leads to four sets of equations of which we shall discuss the two country-specific
equations first. We propose the following equation for the actual discount rate changes:
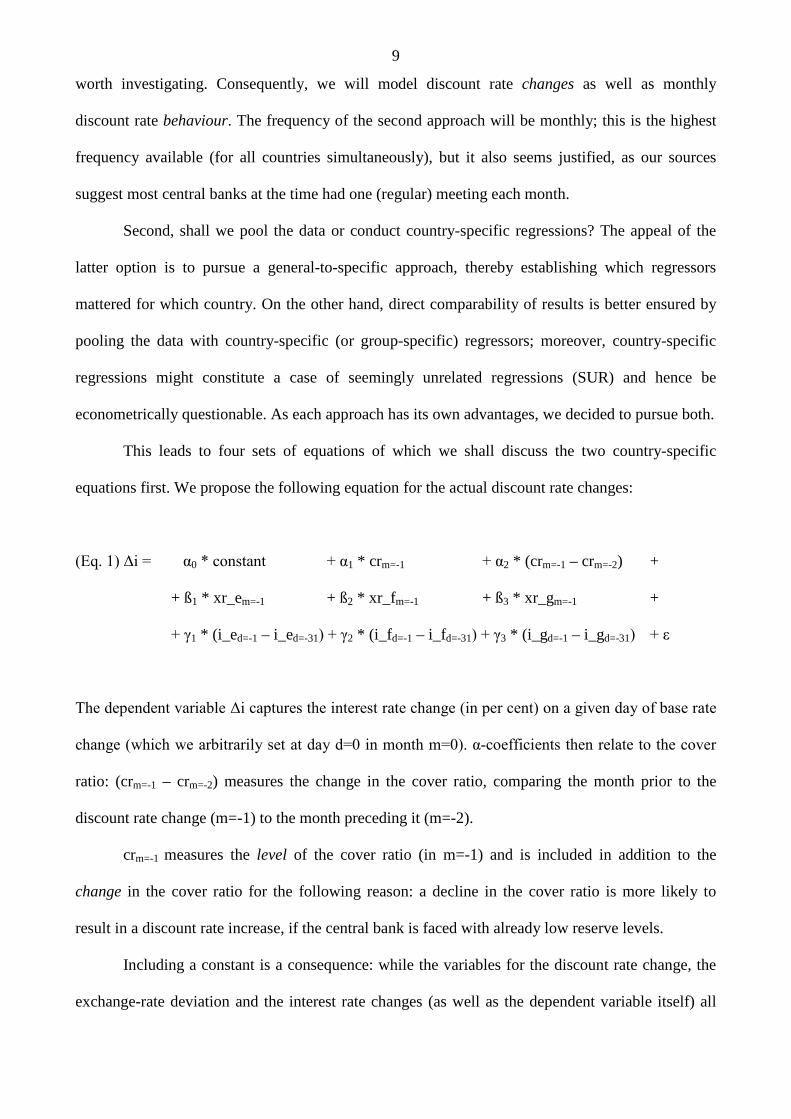
(Eq. 1) Δi = α0 * constant + α1 * crm=-1 + α2 * (crm=-1 – crm=-2) +
+ ß1 * xr_em=-1 + ß2 * xr_fm=-1 + ß3 * xr_gm=-1 +
+ γ1 * (i_ed=-1 – i_ed=-31) + γ2 * (i_fd=-1 – i_fd=-31) + γ3 * (i_gd=-1 – i_gd=-31) + ε
The dependent variable Δi captures the interest rate change (in per cent) on a given day of base rate
change (which we arbitrarily set at day d=0 in month m=0). α-coefficients then relate to the cover
ratio: (crm=-1 – crm=-2) measures the change in the cover ratio, comparing the month prior to the
discount rate change (m=-1) to the month preceding it (m=-2).
crm=-1 measures the level of the cover ratio (in m=-1) and is included in addition to the
change in the cover ratio for the following reason: a decline in the cover ratio is more likely to
result in a discount rate increase, if the central bank is faced with already low reserve levels.
Including a constant is a consequence: while the variables for the discount rate change, the
exchange-rate deviation and the interest rate changes (as well as the dependent variable itself) all

10
have an expected value of zero, crm=-1 is positive; implying we require the constant as an offset.
Assuming the central bank targets a specific reserve level, we would expect this level to be close to
– (α1 / α0). We will return to this issue later.
ß-coefficients relate to the exchange-rates vis-à-vis England, France and Germany. They
measure deviations from mint parity, with a positive value implying a depreciated exchange-rate;
for instance, a value of 0.01 for xrEngland means that the exchange-rate vis-à-vis England was
depreciated by 1% with respect to mint parity.
Finally, γ-coefficients relate to potential patterns of interest rate followership vis-à-vis
England, France and Germany. While data on cover ratio and exchange-rate are available only on
monthly frequency, we exploit the daily character of our discount rate data by measuring the
(potential) discount rate change of England, France and Germany as the difference between the
discount rate level the day before the discount rate decision of the country in question (d=-1)
compared to a month before (d=-31).
What signs do we expect? A declining cover ratio should lead to a discount rate increase;
similarly, a discount rate increase is more likely at low reserve levels. Hence, α1 and α2 are expected
to be negative; α0 as an offset should then be positive. ß-coefficients are expected to be positive, as
a depreciation puts upward pressure on the bank rate; similarly, the concept of interest rate
followership implies that γ-coefficients should be positive.
Modelling monthly discount rate behaviour entails two changes: first, we estimate this equation as
an ordered probit with three entries: comparing the last day of the current month (m=0) with the last
day of the previous month (m=-1), the discount rate was either increased (Δi= +1), decreased (Δi=-
1) or remained at the same level (Δi=0).
Second, adaptation is required for the interest rate. As the dependent variable looks at a one-
month horizon (as opposed to a specific day in the first set of equations), i_e, i_f and i_g refer to
potential interest rate changes between the last day of the previous month (m=-1) compared to the

11
last day of the month before (m=-2). Sign expectations remain unchanged but refer to marginal
effects (or, in the case of interest rate changes, differential effects).
(Eq. 2) Δi = δ1 * crm=-1 + δ2 (crm-1 – crm-2) +
+ ε1 * xr_em=-1 + ε2 * xr_fm=-1 + ε3 * xr_gm=-1 +
ζ1 * (i_em=-1 – i_em=-2) + ζ2 * (i_fm=-1 – i_fm=-2) + ζ3 * (i_gm=-1 – i_gm=-2) + ε
How do eqs. 1 and 2 compare to central bank reaction functions estimated in earlier research? For
all their minor differences, most estimations include the same variables as we do, with the possible
exception of the exchange-rate deviation which is only captured by Tullio&Walters29. The main
difference lies in the high frequency of our data as well as the large sample. Most earlier studies do
not venture beyond England, France and Germany30 (and often involve only one31 or two32 of them)
and there is really only one study dedicated to a peripheral country (Austria-Hungary in the event).
The pooled estimations follow the same principle with one modification: exchange-rate data on
England, France and Germany was highly multi-collinear so that it seemed prudent to replace the
individual series by a principal component series. We first estimate a separate pool for core
countries and for peripheral countries (eqs. 3A and 3B for actual discount rate changes and eqs. 4A
and 4B for monthly discount rate behaviour). In another estimation (3C and 4C), we then merge
29 Ibid; ———, The Objectives of French Monetary Policy during the Classical Gold Standard, 1876-1913: aneconometric analysis of the determinants of the Banque de France's official discount rate, Diskussionsbeiträge desFachbereichs Wirtschaftswissenschaft der Freien Universität Berlin, Nr. 12 (2003); ———, The Objectives ofBritish Monetary Policy during the Classical Gold Standard, 1876-1913: an econometric analysis of domestic andforeign determinants of bank rate, Diskussionsbeiträge des Fachbereichs Wirtschaftswissenschaft der FreienUniversität Berlin, Nr. 13 (2003); ———, The Objectives of German Monetary Policy during the Classical GoldStandard, 1876-1913: an econometric analysis of the determinants of the Reichsbank's discount rate,Diskussionsbeiträge des Fachbereichs Wirtschaftswissenschaft der Freien Universität Berlin, Nr. 14 (2003).
30 Contamin and Denise, "Quelle autonomie pour les politiques monétaires sous l'étalon-or, 1880-1913?."31 Goodhart, The Business of Banking, 1891-1914 (London1972). Dutton, "The Bank of England and the Rules of the
Game under the International Gold Standard: New Evidence," in A Retrospective on the Classical Gold Standard,1821-1931, ed. Bordo and Schwartz (Chicago: Chicago University Press, 1984). Pippenger, "Bank of EnglandOperations, 1893-1913," in A Retrospective on the Classical Gold Standard, 1821-1931, ed. Bordo and Schwartz(Chicago: Chicago University Press, 1984). Davutyan and Parke, "The Operations of the Bank of England, 1890-1908: A Dynamic Probit Approach," Journal of Money, Credit and Banking 27(1995).
32 Giovannini, "'Rules of the Game' during the International Gold Standard: England and Germany."
12
both pools and use group-specific regressors for those variables which delivered substantially
different results in 3A vs. 3B and 4A vs. 4B.
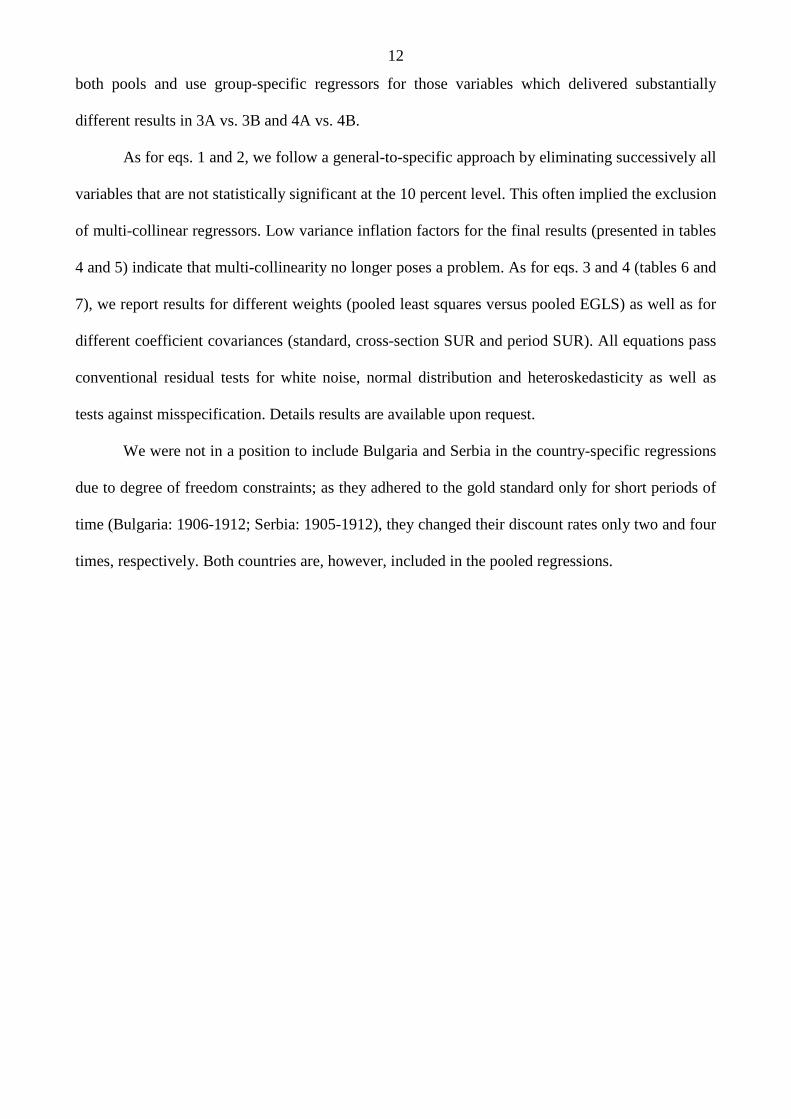
As for eqs. 1 and 2, we follow a general-to-specific approach by eliminating successively all
variables that are not statistically significant at the 10 percent level. This often implied the exclusion
of multi-collinear regressors. Low variance inflation factors for the final results (presented in tables
4 and 5) indicate that multi-collinearity no longer poses a problem. As for eqs. 3 and 4 (tables 6 and
7), we report results for different weights (pooled least squares versus pooled EGLS) as well as for
different coefficient covariances (standard, cross-section SUR and period SUR). All equations pass
conventional residual tests for white noise, normal distribution and heteroskedasticity as well as
tests against misspecification. Details results are available upon request.
We were not in a position to include Bulgaria and Serbia in the country-specific regressions
due to degree of freedom constraints; as they adhered to the gold standard only for short periods of
time (Bulgaria: 1906-1912; Serbia: 1905-1912), they changed their discount rates only two and four
times, respectively. Both countries are, however, included in the pooled regressions.

13
Summary statistics on the independent and the dependent variables
Before presenting the estimation results, it seems worthwhile exploring our raw data on the
exchange-rate performance, the discount rate behaviour and the cover ratio. Some summary
statistics of these three indicators alone are suggestive of substantial differences in monetary policy
between core and peripheral countries.
(a) Exchange-rate performance
Available gold point estimates33 mainly cover intra-core country pairs and range between 0.367
percent (Germany to England) and 0.645 percent (Austria-Hungary to England).34 For core-
periphery pairs, we expect gold points to be further away from mint parity, as transportation costs
for gold shipping between, say, Bucharest and Berlin were higher than between Paris and Berlin.
Fortunately, we can avoid calculating gold points, as peripheral countries did normally not
introduce specie convertibility; this is well documented for Austria-Hungary and Italy, but recent
research on Bulgaria, Romania, Serbia and Sweden suggests the same for other peripheral
economies.35 Stabilising the exchange-rate with respect to England, France and Germany is often
referred to as shadowing the gold standard and is conventionally seen as another form of gold
standard adherence.36 Crucial in our context is that if the peripheral countries wanted to stabilize
their exchange-rate, they had to conceive of “virtual” gold points which would trigger some kind of
central bank reaction. We have therefore assumed two such points at 0.6 percent and 1.0 percent.
33 It should be emphasized that gold points were not time-invariant; they grew smaller over time due to decliningtransportations costs and they could also change during financial crises, as shown byCanjels, Prakash-Canjels, andTaylor, "Measuring market integration: foreign exchange-arbitrage and the gold standard, 1879-1913," Review ofEconomics and Statistics 86, no. 4 (2004). For the argument advanced here, however, it seems justified to operatewith an average gold point taken from contemporary calculations.
34 Cf. sources of table 1.35 Morys, "The Classical Gold Standard in the European Periphery: A Case Study of Austria-Hungary and Italy, 1870-
1913" (PhD Diss., London School of Economics, 2006), pp. 23-27. Fratianni and Spinelli, Storia Monetaria d'Italia.Lira e politica monetaria dall'Unità all'Unione Europea, 2nd ed. (Milan: Mondadori, 2001). Tattara, "Was ItalyEver on Gold?," in Monetary Standards in the Periphery: Paper, Silver, and Gold, 1854-1933, ed. Martín Acenaand Reis (London, New York: MacMillan Press, St. Martin's Press, 2000). Monetary Time Series of SoutheasternEurope from the 1870s to 1914, Bank of Greece Working Paper Nr. 94 (Athens2009), p. 29. We thank AndersOgren for providing similar insight for the Swedish case.
36 Inter alia Obstfeld, Shambaugh, and Taylor, "The Trilemma in History: Tradeoffs among Exchange Rates, MonetaryPolicies, and Capital Mobility." who do not even differentiate between de jure and de facto adherence to gold.

14
Table 1 provides us with the relevant statistics, based on exchange-rate data with respect to
England, France and Germany. For each of the three exchange-rates, we provide the maximum
deviation and the standard deviation. The information is then “condensed” into three indicators: the
maximum deviation with respect to all three countries, the average maximum deviation and the
average standard deviation. The lower part of table 1 shows how often (in percent) the gold export
point was violated with respect to England, France, and Germany, as well as how often the
exchange-rate was depreciated by more than 0.6% and 1.0%, respectively. We also provide an
additional statistic in which we look at gold export violations without taking into account periods of
global financial strain before World War I. These periods were identified as the onset of the Boer
War (1899-1902), the crisis of 1907, and the Balkan Wars (1912/13). We will return to these crises
– and their importance in understanding the core-periphery dichotomy – in chapter 3.
England, Germany, France and the Netherlands are the only countries whose exchange-rate
never depreciated by more than 1 percent. Only slightly below we find Belgium (1.19 percent). At
the other end of the spectrum, Italy and Romania stand out with maximum deviations of 2.83
percent and 5.27 percent, respectively. The middle field is occupied by Sweden, Norway, and
Austria-Hungary (in this order). The average standard deviation gives a similar picture, even though
Sweden, Norway and Austria-Hungary (again in this order) are more similar to the core countries
on this measure. The five core countries and Sweden, Norway and Austria-Hungary all have
average standard deviations between 0.22 percent and 0.36 percent. This contrasts strongly with
Italy and Romania with average standard deviations of approximately double the size.
Focusing on the middle and lower part of table 1, we first consider export point violations of
those countries for which we have gold export point estimates (England, Germany, France, the
Netherlands, Austria-Hungary). Such violations were rare but did occur. The only country without
any such violation in our sample is the Netherlands, but England and Germany, for instance, had
more than the occasional gold point violation. In their bilateral relationship, they had, on average,
one violation every year. This might not sound much, but we have to take into account that we are

15
relying on monthly averages; consequently, the number of gold point violations reported in table 1
only constitutes a lower bound of the actual number of violations if data of higher frequency were
used. A similar picture emerges for the German exchange-rate vis-à-vis France.
Austria-Hungary is the only peripheral country for which we have contemporary gold point
estimates and we find that gold export point violations were more frequent (7.0 percent) than for
England, France, Germany, and the Netherlands (2.7 percent on average). We now turn to Sweden,
Norway, Italy and Romania for which we do not have gold point estimates. When applying the 0.6
percent benchmark (a criterion milder than any of the gold point estimates we have bar the one for
Austria-Hungary), we find that only Sweden’s exchange-rate performance comes close to England,
France, Germany and the Netherlands (2.8 percent). Next come Norway (5.6 percent) and Austria-
Hungary (6.5 percent), to be followed – with a wider margin – by Italy (27.2 percent) and Romania
(30.6 percent). If we allow for a 1 percent depreciation, fewer gold point violations occur but the
broad patterns remains unchanged: Sweden, Norway, and Austria-Hungary had substantially fewer
gold points violations than Italy and Romania.
A closer observation of the exchange-rate data show that most gold point violations
happened during three well-defined events: the early period of the Boer War (1899-1902), the crisis
of 1907, and the Balkan Wars (1912/13). For the purposes of this section, we will confine ourselves
to pointing out how our statistics change when leaving the three episodes out of consideration (more
on the implications for discount rate policy in chapter 3). The exchange-rate performance of both
core and periphery improves but improvements are more pronounced for the periphery (lower part
of table 1). Sweden, Norway and Austria-Hungary have no (on the 1 percent benchmark) or
virtually no (on the 0.6 percent benchmark) gold point violations, and Italy’s and Romania’s
exchange-rate performance now appears in a different light; Italy, for instance, does not exhibit a
single gold point violation vis-à-vis Germany (at the 1.0 percent benchmark).
We can summarize our findings on exchange-rate performance as follows: first, peripheral
countries exhibited higher exchange-rate volatility, which, in turn, led to more frequent and more

16
sizeable violations of the gold points; second, differences in the ability to keep the exchange-rate
close to mint parity were particularly acute in times of global financial strain.
(b) Discount rate behaviour
Table 2 provides data on the average discount rate and the frequency of discount rate changes. As
Austria-Hungary and Italy joined the gold standard only in 1896 and 1904, respectively, we
distinguish between three periods for the average discount rate: 1883-1913, 1896-1913, and 1904-
1913. For some countries, we were able to collect data for the private discount rate. It relates to the
interest rate applied to bills of exchange discounted on the private market; which usually (especially
in the English case which we understand best thanks to Bagehot) meant discounting at banks
specialised on discounting bills. We failed to locate such data for Bulgaria, Italy, Norway, Romania,
Serbia and Sweden, which suggests that the money market in these places was less mature and
most, if not all, of the discounting took place at the central bank.
France enjoyed both the lowest bank rate and the lowest private discount rate. As for the
bank rate, England does not even come in the second position which is taken by the Netherlands.
Only if we look at the private discount rate, we find England in second place. The spread among
core countries was low, but it is interesting to note that Germany had the highest discount rate of the
five core countries.
Peripheral countries had substantially higher interest rates. Sweden, Norway, and Romania –
all of which adhered to gold for the entire period – exhibit a discount rate spread of more than 150
basis points (4.97 percent versus 3.41 percent). If we include Austria-Hungary, Italy, Bulgaria, and
Serbia – all of which adhered to gold only for parts of the 1883-1913 period -, the interest rate
spread increases to more than 200 basis points (5.48 percent versus 3.41 percent).
Turning to the frequency of discount rate changes, table 2 shows that core countries had a
more active discount rate policy; core countries changed their discount rate 2.9 times per annum,
compared to 1.6 times per annum for the periphery. We will be able to give a full explanation only
17
in chapter 3, but two factors should be mentioned at this stage: peripheral countries were, on
balance, under more government pressure, and hence more reluctant to change the discount rate (in
particular in cases where formal government approval was required). This argument, which is often
found in the literature37, probably goes some way towards explaining the differences but fairly
independent central banks could also come under intense pressure: Bagehot, for instance, wrote:
“The Bank directors now fear public opinion exceedingly; probably no kind of persons are so
sensitive to newspaper criticism.”38 Presumably more important was how dominant the central
bank’s position was in the money market: If faced with heavy competition from discount houses,
the central bank had to adjust frequently its bank rate to the market rate so as to get its share of the
discount market. If the central bank dominated the money market – which was presumably the case
in the periphery –, fewer discount rate changes were needed.
(c) Cover ratio
The cover ratio represents the fraction of reserves to liquid liabilities and served as an indicator of
the central bank’s liquidity. The legal requirement to publish the cover ratio on a monthly or even
weekly basis aimed at retaining confidence in the domestic monetary system. We show a
standardized central bank balance sheet to illustrate which items might potentially constitute
“reserves” and “liquid liabilities”.
[INSERT FIGURE 1 ABOUT HERE]
Rules as to what exactly defined the cover ratio differed across countries and over time, but the
broad pattern is as follows: Initially, the reserve ratio was defined as gold (bullion or specie) over
bank notes39; gold was the quintessential store of value, and the convertibility requirement referred
only to bank notes but not deposits. As time went on, the cover ratio matured from this somewhat
37 Reis, "An "Art" and not a "Science"? Central Bank Management in Portugal under the Gold Standard, 1863-1887,"pp. 712-22.
38 Bagehot, Lombard Street. A Description of the Money Market, p. 72.39 The cover ratio of the Bank of England was defined differently as a result of the 1844 Bank Act. The Issue
Department only issued notes. There was a limited fiduciary note issue, but any additional note issue had to be fullybacked by gold. The cover ratio – often referred to as the “proportion” in the English case – refers to the BankingDepartment and represents its reserves (largely bank notes) to its liquid liabilities. For details cf. appendix.
18
legalistic perspective into a more economic concept. This was largely the result of foreign exchange
holdings becoming more important relative to gold holdings. Consequently, countries amended
their bank acts in order to include foreign exchange into the note cover.40 As far as we can see, a
similar process did not take place on the liabilities side. While deposits grew as a share of liquid
liabilities, bank acts were not changed to provide cover for both bank notes as well as deposits. This
is probably explained by the fact that the share of deposits never grew larger than 15 percent – 20
percent of liquid liabilities.
Table 3 shows the average, the minimum, the maximum and the standard deviation of the
cover ratio. Core countries had a substantially lower average reserve ratio than the periphery (56.0
percent versus 69.6 percent). The minimum reserve ratio shows a similar dichotomy: England,
Germany, and Belgium, for instance, let their reserve ratio decline to 30 percent and below. This
contrasts strongly with a minimum cover ratio of 66.1 percent for Italy. So while neither core nor
periphery violated their bank acts (which normally stipulated a 30 percent - 40 percent minimum
cover41), our findings suggest that peripheral countries felt the need to have substantially higher
reserve levels.
In sum: Core countries had few gold point violations (which allowed them to introduce specie
convertibility), changed their discount rate frequently and had a low cover ratio. Peripheral
countries, by contrast, had a worse exchange-rate performance (especially in periods of global
financial strain), changed their discount rate infrequently and relied on a high cover ratio. Do these
pronounced differences in independent and dependent variables translate into different central bank
reaction functions for core and peripheral countries? This is what we turn to now.
40 Morys, "The Classical Gold Standard in the European Periphery: A Case Study of Austria-Hungary and Italy, 1870-1913", p. 136. Monetary Time Series of Southeastern Europe from the 1870s to 1914.
41 Reichsbank, Vergleichende Notenbank-Statistik. Organisation und Geschäftsverkehr wichtiger europäischerNotenbanken 1876-1913 statistisch dargestellt.
19
Results of country-specific estimations (eq. 1 and eq. 2)
(a) Cover ratio
Results for eq. 1 (actual discount rate changes) show that England, Germany, the Netherlands and
Belgium did not respond to changes in the cover ratio by adjusting their discount rate. By contrast,
for all peripheral countries (with the exception of Sweden), we find the expected negative sign. For
some peripheral countries (Italy, Norway and Sweden), we can detect an additional role for the
level of the cover ratio.42
Our findings for eq. 2 (monthly discount rate behaviour) are supportive. Given that more
observations are now available for each equation, we do find a role for the cover ratio in all
equations (except for Belgium); crucially, however, marginal effects for core countries are much
smaller than for peripheral countries (and in some cases only marginally significant). Germany, for
instance, has a marginal effect ten times smaller than Italy (-0.34 versus -3.42).
(b) Exchange-rates
ß- and ε-coefficients on the exchange-rate reveal another core-periphery divide. Counteracting
exchange-rate deviations by means of discount rate changes was crucial for England, Germany, the
Netherlands, and Belgium, but not for peripheral countries. In eq. 2 – which should allow more
precise estimation given the higher number of observations – the exchange-rate does not come out
as significant for any of the five peripheral countries; only in eq. 1 we find a role for the exchange-
rate in the cases of Sweden and Norway. This intra-periphery difference is in line with our findings
for the exchange-rate performance, where the two Scandinavian countries performed better than
Austria-Hungary, Italy and Romania.
42 In these cases, - (α0 / α1) ≈ average cover ratio, vindicating our interpretation of the intercept as an offset to the level of the cover ratio; e.g., Italy: - (α0 / α1) = 74.53% ≈ 75.0% (cf. table 3).

20
(c) Interest rates
Eq. 1 and eq. 2 demonstrate that all countries track the interest rate of at least one of the large core
countries. While differences prevail between core and periphery regarding cover ratio and
exchange-rate, similarities are strong as far as the interest rate is concerned: most countries follow
either England or Germany and coefficients/differential effects are of comparable magnitude.
While interest rate followership can clearly be detected, the size of the
coefficients/differential effects is probably not as large as one would expect given the
macroeconomic policy trilemma. In eq. 1, none of the coefficients comes even close to unity (which
would mean perfect interest rate pass through). Similarly, differential effects in eq. 2 are low: for
example, when the Bank of England increases its discount rate by 1%, the Reichsbank’s probability
to increase its discount rate in response is only raised by 9%; even the highest value in this context
(a 22%-increase in probability for Italy in response to Germany) is far away from an “automatic”
interest rate response. Thus, γ- and ζ-coefficients suggest that a considerable amount of monetary
autonomy was retained under the Classical Gold standard, even for peripheral countries.
Taken together, eq. 1 and eq. 2 show similarities and differences between core and periphery. An
element of interest rate followership was common to both, though not as strong as we would expect
under fixed exchange-rates and capital mobility. Core and periphery differ, however, in the
importance they attach to cover ratio and exchange-rate deviations. Core countries use their
discount rate changes to target specifically the exchange-rate; and they do so with great success, as
evidenced by the superior exchange-rate performance compared with peripheral countries. In turn,
they pay little attention to the cover ratio which was allowed to fall close to the minimum level
required by the bank act. Peripheral countries pursue the opposite strategy: paying little attention to
exchange-rate deviations (hence their poor performance on this account), they target the cover ratio
and successfully manage to keep it at levels approximately twice as high as required by the bank
act.

21
The only country which escapes this clear-cut core-periphery dichotomy seems to be France.
Neither eq. 1 nor eq. 2 suggest that discount rate policy was motivated by exchange-rate deviations;
similarly, the high cover ratio and low frequency of discount rate changes set it apart somewhat
from England, Germany, Belgium and the Netherlands. Yet its exchange-rate performance was
stellar. This seeming contradiction is probably best reconciled by a well-established body of
research which has stressed the sophistication and effectiveness of French gold devices, thereby
substantially reducing reliance on the discount rate tool.43
Results of pooled estimations (eqs. 3 A, B, C and eq. 4 A, B, C)
Our results obtained from country-specific regressions are confirmed by pooled estimations. We
first discuss the pooled estimates for core countries vs. peripheral countries (3A vs. 3B and 4A vs.
4B) and then proceed to a common pool with group-specific regressors.
(a) Cover ratio
Changes in the cover ratio are important for core and periphery but peripheral countries react more
strongly in eq. 3. Moreover, the level of reserves is significant for peripheral countries but not for
the core (the same is true for the constant, see our discussion above on the constant as an offset for
the level of reserves). Both findings are in line with eq. 1 and 2 and underline the specific
importance attached to the cover ratio – both in levels and first differences – by peripheral
countries.
(b) Exchange-rates
Core countries target the exchange-rate but peripheral countries do not, confirming earlier results.
43 For a recent contribution see Contamin, "Interdépendences financières et dilemma de politique monétaire: la Banquede France entre 1880 et 1913," Revue Economique 54(2003).

22
(c) Interest rates
3A, 3B, 4A, 4B all show patterns of interest rate followership vis-à-vis England and Germany but
there is some difference between core and periphery: core countries follow the English interest rate
more strongly, as evidenced by a higher coefficient.44 By contrast, peripheral countries follow
Germany more strongly, with some specifications not even indicating any role for the London bank
rate.
It is worth exploring this difference in some more detail by referring back to the country-
specific equations. Leaving England and Germany aside for obvious reasons, eq. (1) and (2) suggest
the same interest rate setter in seven out of eight cases: Sweden follows both England and Germany,
with the size of the coefficient/differential effect suggesting similar dependence on London and
Berlin. The remaining six countries either follow the Bank of England or the Reichsbank, with
France and Romania following England and the Netherlands, Norway, Austria-Hungary and Italy
following Germany. Only Belgium seems to follow the German bank rate in eq. (1) and the French
bank rate in eq. (2). Combining our findings of eq. (1) – (4), we find that the Reichsbank had a
much bigger role in setting interest rates under the Classical Gold Standard – at least vis-à-vis
countries on the European periphery – than is conventionally acknowledged.45
Pooling core and peripheral countries with group-specific regressors (esq. 3C and 4C)
Eq. 3A, 3B, 4A and 4B have shown that the main difference lies in the importance attached to the
reserve level and the exchange-rate. We therefore pool core and peripheral countries and form
group-specific regressors for the level of the cover ratio and the exchange-rate.
The fundamental difference is confirmed in 3C and 4C: while all other coefficients can
easily be pooled for all countries (and then take on an intermediate value compared to the separate
44 Moreover, in the case of eq. 4A, the coefficient on Germany is not significant at conventional levels.45 Eichengreen, "Conducting the International Orchestra: Bank of England Leadership under the Classical Gold
Standard," Journal of International Money and Finance 6(1987). Tullio and Walters, "Was London the Conductorof the International Orchestra, the Second Violinist or the Triangle Player? A Survey of the Literature onAsymmetries in Balance of Payments Adjustment during the Classical Gold Standard," Scottish Journal of PoliticalEconomy 43(1996).

23
equations reported before), the coefficient for the exchange-rate is only significant for core
countries, while the reserve level is significant only for peripheral countries.46
In conclusion, we found similarities and differences between core and periphery. A strong element
of interest rate followership was common to both. They differ, however, in the importance they
attach to cover ratio and exchange-rate deviations. Core countries used their frequent discount rate
changes to target the exchange-rate. Little attention was paid to the cover ratio which occasionally
fell close to the minimum level required by the bank act. Peripheral countries, by contrast, targeted
the cover ratio and successfully managed to keep it at levels approximately twice as high as
required by the bank act.
But why, then, did peripheral countries not attach more importance to exchange-rate
deviations in setting the discount rate? Was this out of choice or out of necessity? We recall that the
exchange-rate performance of peripheral countries was not much worse than that of core countries
for most of the time, but deteriorated quickly during periods of global financial strain.
Understanding central bank behaviour during these periods will enable us to give an answer to this
question. This is what we turn to now.
46 In some specifications, the reserve level is not significant at the 10%-level for the peripheral countries, as opposed to3B and 4B. This is owed to the circumstance that we cannot have a group-specific constant (which would allow theconstant to assume the function as an offset to the reserve level as argued above) in a country-fixed-effectsestimation, the reason being: country-fixed effects imply adding dummy-variables for each cross-sectional unit; agroup-specific constant means adding (in our case) two dummy variables. If both types of dummy variables areadded simultaneously, each group-specific dummy variable can be written as a linear combination of some of thecountry-specific dummy variables, thereby resulting in a non-full-rank matrix (which can hence not be inverted).
24
CHAPTER THREE. CENTRAL BANK BEHAVIOUR DURING THE PERIODS OF GLOBAL
FINANCIAL STRAIN
As indicated earlier, there were three periods of sustained gold point violations by peripheral
countries: the Boer War, starting in 1899; the crisis of 1907; and the Balkan wars of 1912/13. We
briefly explain each episode and then analyse the discount rate behaviour of core and peripheral
countries during these crises. Subsequently, we will support our analysis of the data by a study of
the internal protocols and the Annual Reports of the Austro-Hungarian bank.
(a) The Boer War began in October 1899. Early successes of the Boers culminated in the so-
called “Black Week” (10th – 15th December 1899). As the British Empire grew increasingly
determined to win the war, major reinforcements were sent; by January 1900 it became clear
that England would, at least, not lose the war (even though hostilities continued for a long
time and peace was only achieved in May 1902). For the purpose of our study it is important
to keep in mind that South-Africa at the time was the world’s largest supplier of gold for a
rapidly growing world economy connected to the gold standard. The chronology of military
events is mirrored by three discount rate increases of the Bank of England from 3.5 percent
to 6 percent (3.10., 5.10. and 30.11.) before it fell to 5 percent on 11th January 1900. We
observe a similar pattern for the Reichsbank which raised its discount rate by 2 percent to 7
percent (3.10. and 15.11.) before reducing it to 6 percent on 12th January 1900.
(b) The crisis of 1907 is often erroneously reduced to the American Banking Crisis of the same
year but in fact it was a much wider phenomenon. It followed the upswing of the first years
after the turn of the century in which many countries had participated. Bubbles burst in
different places at different times. European discount rate data suggests two waves. The first
one began in September 1906 and ran until January 1907 when the first central banks start
lowering their discount rates. This was then followed by a second wave in late 1907. The

25
failure of the Knickerbocker Trust Company in New York on 22nd October 1907 soon led to
a general suspension of cash payments by the entire American banking system. A week
later, Germany (29th October) and England (31st October) started raising their discount rate
from 5.5 percent and 4.5 percent, respectively, to 7.5 percent and 7 percent. These were the
highest values for both countries during the Classical Gold Standard era which underlines
the severity of the crisis. On 2nd January 1908 the Bank of England became the first major
central bank to decrease its discount rate again.
(c) The third episode relates to the Balkan Wars of 1912/13. Great power rivalries had
manifested itself on the Balkans since the congress of Berlin (1878), which explains why
every new crisis led to increased anxiety worldwide. In the event, the so-called Balkan
League was established as an alliance between Greece, Serbia, Bulgaria, and Montenegro
with the aim of conquering the European lands of the Ottoman Empire. Established in early
1912, the outbreak of war was likely as soon as summer 1912 (even though it broke out only
on 8th October 1912). The Bank of England was the first central bank to raise its discount
rate, increasing it by 2 percent to 5 percent (29.8. and 17.10.) before decreasing it on the 17th
April. Germany also increased its discount rate by 1.5 percent to 6 percent (24.10. and
14.11.).
Table 8 compares the discount rate policy of England and Germany with peripheral countries. The
time window is defined by two days in advance of the first central bank raising the discount rate and
ends the day prior to the first central bank lowering it again. Table 8 shows by which margin
discount rate changes were made and to which level they were raised. We also report the discount
rate differentials to England and Germany (represented by the arithmetic average of their respective
discount rates) during the time window as opposed to the normal discount rate spread.
England and Germany engaged in competitive discount rate increases early on but
peripheral countries reacted late and increased their discount rates by substantially lower margins.

26
Consequently, the discount rate differential between core and periphery actually declined during
crises. The peripheral economies had an average discount rate spread of 83 basis points. The spread
declined during all four crises episodes and even turned negative during the crisis of 1907. We are
hence confronted with a paradox: in crisis situations with prolonged violations of the gold export
point, peripheral countries decreased rather than increased their discount rate spread to the core
countries.
This paradox might be explained as follows: as the general discount rate level was higher for
peripheral countries, there was limited room for manoeuvre during periods of global financial
strain. Moreover, a signalling problem might have prevented peripheral economies from raising the
discount rate by a wide margin. Sizeable discount rate increases could be interpreted as signs of
weakness and hence deter rather than encourage the inflow of much-needed short-term capital. Last
but not least, the discount rate increases could have been a less effective tool in peripheral countries.
In order to provide some qualitative evidence, we studied the annual reports of the Austro-
Hungarian bank and the protocols of the general council. The Annual Reports were mainly meant
for the shareholders of the Austro-Hungarian Bank, whereas the protocols of the general council
were internal documents. The internal discussions in particular provide an answer as to why
peripheral countries used the discount rate tool so sparingly during crises. First, there was a general
sense that discount rate increases would be unpopular and to the detriment of domestic business, an
argument particularly often advanced by government representatives on the general council.47 The
Austro-Hungarian bank could be very explicit about this; when describing discount rate policy
during the Boer War (i.e., our first crisis episode), for instance, they write that “... we should not
forget that the bank’s duties do not only consist of defending mint parity. It is of no less importance
to protect and promote all the other interests of our national economy which is beset with so many
difficulties…”48.
47 General council meeting #523, held 27th June 1907, pp. 5-6. The Austro-Hungarian bank had two governmentrepresentatives, one for Austria and one for Hungary.
48 Report to the 22nd General Meeting of the Austro-Hungarian Bank (1900), p. 11. A very similar statement can befound in the Report to the 32nd General Meeting of the Austro-Hungarian Bank (1910).
27
Second, members of the governing council doubted the effectiveness of discount rate
increases. From a general council meeting held at the height of the American Banking crisis (28th
November 1907), we learn that Austria-Hungary did contemplate increasing the discount rate
further (at this point it was 100 basis points below England and 150 basis points below Germany),
but failed to do so because “even a higher interest rate would not have made a difference”49 (i.e., the
exchange-rate would have remained substantially depreciated).
If raising the discount rate was difficult and, in times of global financial strain, potentially not even
effective, what was the alternative? The annual reports and protocols give several hints which help
explain the different discount rate policies established in the second chapter. First, accumulating
large reserves in “good times” and returning them slowly to the market when necessary was seen as
a good way of keeping interest rates low and stable: „The enormous increase of our metallic
holdings … and, more importantly, the vast stock of foreign bills of exchange and foreign deposits
has proven beneficial to the domestic economy. As a result, we could offer relatively low interest
rates throughout the year despite adverse interest rates abroad… “50 The concept that a policy of
infrequent discount rate changes required high reserve levels can be found elsewhere51 and provides
qualitative evidence in support of our econometric findings.
Second, not introducing specie convertibility provided important “breathing space” during
periods of prolonged exchange-rate depreciations. As indicated earlier, one of the key institutional
differences between core and peripheral countries was that the latter only “shadowed” the gold
standard, i.e., they were not constrained by the rather narrow gold points implied by specie
convertibility. Austria-Hungary was a case in point, where, despite a long and intense discussion,
specie convertibility remained suspended.52 It is therefore interesting to note that during the 1907
49 General council meeting #528, held 28th November 1907, p. 4.50 Report to the 29th General Meeting of the Austro-Hungarian Bank (1907), pp. 10-11.51 Report to the 30th General Meeting of the Austro-Hungarian Bank (1908).52 Hemetsberger-Koller, "Die suspendierte Goldkonvertibilität. Barzahlungskrise in Österreich-Ungarn zu Beginn des
20. Jahrhunderts," in Auf Heller und Cent. Beiträge zur Finanz- und Währungsgeschichte, ed. Bachinger and Stiefel(Frankfurt, Vienna: Überreuter, 2001).

28
crisis, one of the council members states how helpful it proved in the current financial crisis that
Austria-Hungary had not introduced specie convertibility, thus giving more flexibility to the
monetary authority.53
Third, “moral suasion” on behalf of the central bank probably played a much bigger role in
peripheral money markets. The London money market, due to its size and anonymity54, was to
react to the price of money; in the much smaller and less developed money markets of the periphery
(where, probably for the lack of it, we could not even find data for open market discount rates for
most countries, cf. above), by contrast, it was potentially feasible to reduce, if only temporarily,
demand for foreign currency by other means. By the informal nature of “moral suasion”, it is
difficult to provide an abundance of hard evidence to support this claim, but from the sources
available to us it seems that the Austro-Hungarian bank did make use of it.55
In conclusion, the qualitative evidence is supportive of our statistical analysis. Peripheral countries
adapted the “English” gold standard in two crucial aspects to suit their needs: first, they did not
introduce specie convertibility, thus widening the exchange-rate bands and hence providing more
flexibility; second, peripheral countries came to rely on high reserve levels and oriented their
discount rate policy towards maintaining the reserve level rather than targeting more narrowly the
exchange-rate.
53 General council meeting #527, held 9th November 1907, p. 9.54 A factor emphasized by Capie in the functioning of the London money market. Capie, "Banking in Europe in the
Nineteenth and Twentieth Centuries: The Role of the Central Bank," in The State, the Financial System andEconomic Modernization, ed. Sylla, Tilly, and Tortella (Cambridge: Cambridge University Press, 1999).
55 We thank Clemens Jobst for this insight and sharing the following newspaper entry with us: “Budapest, 29.September (Der Devisen und Geldmarkt.) Heute war eine ruhige Strömung auf dem Devisenmarkte vorhanden. DemWunsche der Oesterreichisch-Ungarischen Bank Rechnung tragend, haben einzelne Wiener Institute die bei ihnenvom Auslande einlaufenden Orders auf Beschaffung von Gold und Devisen zur Ausführung nicht mehrangenommen. Englische und französische Zahlmittel blieben zwar begehrt, doch waren die Transaktionen nicht soumfangreich wie in den letzten Tagen. Deutsche Zahlmittel haben eine mäßige Abschwächung erfahren.“ (PesterLloyd, 30th September 1911, p. 11)
29
CHAPTER FOUR CONCLUSION
In this paper we provided the first systematic comparison of discount rate policy under the Classical
Gold Standard based on the concept of a central bank reaction function. Drawing on a new data set
of monthly observations for 12 European countries, we analysed the determinants of discount rate
policy; in particular, we asked whether core and peripheral countries followed different patterns and
why this was the case.
Two key findings emerged: first, core and periphery differ in the importance they attach to
cover ratio and exchange-rate deviations. Core countries use their discount rate changes to target
specifically the exchange-rate; and they do so with great success, as evidenced by the superior
exchange-rate performance compared with peripheral countries. In turn, they pay little attention to
the cover ratio which was allowed to fall close to the minimum level required by the bank act.
Peripheral countries pursue the opposite strategy: paying little attention to exchange-rate deviations
(hence their poor performance on this account), they target the cover ratio and successfully manage
to keep it at levels approximately twice as high as required by the bank act.
Second, an element of interest rate followership vis-à-vis England and Germany was
common to core and periphery, though not as strong as one would expect under fixed exchange-
rates and capital mobility. Core countries followed more strongly the bank rate set in London,
whereas countries on the European periphery were more influenced by the Reichsbank. Thus, our
findings suggest that the European branch of the Classical Gold Standard was less London-centered
than hitherto assumed.
We then turned to explaining the differences between core and peripheral countries. The key
difference was the effectiveness of the discount rate tool: In the case of core countries, a discount
rate increase quickly led to short-term capital inflows and hence an improvement of the exchange-
rate. This mechanism did not operate as smoothly for peripheral countries, resulting in more

30
frequent violations of the gold export point. This core-periphery dichotomy was particularly
pronounced in periods of global financial strain, when peripheral countries had to live with
prolonged periods of unfavourable exchange-rates. As a result, peripheral countries adapted the
gold standard in two crucial aspects to suit their needs. First, they did, for the most part, not
introduce specie convertibility, thus widening the exchange-rate bands and hence providing more
flexibility; second, peripheral countries came to rely on high reserve levels and they oriented their
discount rate policy towards maintaining the reserve level rather than targeting more narrowly the
exchange-rate.
If peripheral countries modified the “English” gold standard to suit their needs, this probably
entails a wider lesson for the functioning of the Classical Gold Standard: there was not only one
gold standard but a variety of gold standards; peripheral countries apparently followed a version
different from the one pioneered by England. Perhaps it is precisely this institutional flexibility
which explains why the Classical Gold Standard remains to this day the longest-ever system of
fixed exchange-rates.
DATA APPENDIX
Austria-Hungary, Bulgaria, Romania and Serbia
All data except for private discount rates (cf. below) from Monetary Time Series of South-Eastern
Europe from the 1870s to 1914.
Belgium
- Exchange rates: Neal-Weidenmier-Gold Standard data base (England),
Schneider&Schwarzer&Zellfelder 1991, Europäische und nordamerikanische Devisenkurse
1777-1914, vol. 2, pp. 239-240 & vol. 3, pp. 354-356 (France, Germany)
- Bank rate: Kauch, La Banque Nationale de Belgique, pp. 148-152
- Reserves and monetary base: “Assemblée Générale des Actionnaires de la Banque
Nationale. Rapport fait par le Gouverneur au nom du Conseil d’Administration”, section
“Extrait des situations publiées au moniteur belge en …”, Brussels 1878 – 1914

31
England
- Exchange rates: Neal-Weidenmier-Gold Standard data base (Germany), NBER
Macrohistory database #14107 (France)
- Bank rate: Hawtrey, A Century of Bank Rate, pp. 281-296
- Reserves and monetary base: Capie&Webber, A Monetary History of the United Kingdom,
pp. 408-431.
France
- Exchange rates: Neal-Weidenmier-Gold Standard data base (England),
Schneider&Schwarzer&Zellfelder 1991, Europäische und nordamerikanische Devisenkurse
1777-1914, vol. 2, pp. 351-352 (Germany)
- Bank rate: Hawtrey, A Century of Bank Rate, pp. 302
- Reserves and monetary base: “Compte rendu des operations de la Banque de France et de
ses succursales pendant l’année 1889” etc., Paris 1890-1914, section “Situation
hebdomadaire des principaux comptes de la Banque”
Germany
- Exchange rates: Neal-Weidenmier-Gold Standard data base (England), NBER Macrohistory
database #14071 (France)
- Bank rate: Reichsbank, Vergleichende Notenbankstatistik, pp. 186-189.
- Reserves and monetary base: “Verwaltungs-Bericht der Reichsbank fuer das Jahr 1876” etc.,
Berlin 1876-1914, section “Zusammenstellung der … veroeffentlichten Wochen-
Uebersichten”
Italy
- Exchange rates: Spinelli, Per la storia monetaria dell'Italia, vol. 2, pp. 45-94 (England),
Schneider&Schwarzer&Zellfelder 1991, Europäische und nordamerikanische Devisenkurse
1777-1914, vol. 3, pp. 22-23 & pp. 69-71 (France, Germany)
- Bank rate: kindly communicated by Alfredo Gigliobianco, Historical Archive of the Bank of
Italy
- Reserves and monetary base: de Mattia, I bilanci degli istituti di emissione italiani dal 1845
al 1936, vol. 2, pp. 619-753 and pp. 446-454
Netherlands

32
- Exchange rates: Neal-Weidenmier-Gold Standard data base (England),
Schneider&Schwarzer&Zellfelder 1991, Europäische und nordamerikanische Devisenkurse
1777-1914, vol. 2, pp. 122-123, 126-127, 188-189 (France, Germany)
- Bank rate: de Jong, Geschiedenis van de Nederlandsche Bank, vol. 3, pp. 537-543
- Reserves and monetary base: “Verkorte Balans der Nederlandsche Bank”, 1875-1913
(Nationaal Archief, The Hague)
Norway
- Bank rate: Annual Report of Norges Bank 1979, p. E10
- All other data: downloaded from www.norges-bank.no
Sweden
- Exchange rates: Schneider&Schwarzer&Schnelzer 1993, Statistik der Gold- und
Wechselkurse in Deutschland und im Ostseeraum, 18. und 19. Jahrhundert, pp. 299-300,
337-338, 318-320, 348 (England, France, Germany)
- Bank rate: Sveriges Riksbank, Sveriges Riksbank 1668-1924-1931, pp. 136-138.
- Reserves and monetary base: “Sammandrag af Bankernas Uppgifter”, Stockholm 1878-1912
and “Sveriges Riksbank Årsbook”, Stockholm 1913-1915
Private discount rates for Austria-Hungary, Belgium, England, France, Germany, the Netherlands
Reichsbank, Vergleichende Notenbankstatistik, pp. 212-231
FIGURE 1CENTRAL BANK BALANCE SHEET
Assets Liabilities
International assets Liquid liabilitiesGold (bullion and specie) Bank notes in circulationSilver (bullion and specie) Bank depositsForeign exchange and otherinternational assets
Other liabilities payable on demand
Domestic assetsBills of exchangeCash advances
Other assets (real estate etc.) Other liabilities

33
TABLE 1
EXCHANGE RATE PERFORMANCE (MEASURED AGAINST MINT PARITY) WITH RESPECT TOENGLAND, FRANCE AND GERMANY
England France Germany NetherlandsXR w.r.t. France Germany England Germany England France England France Germany
Maximum deviation 1.0051 1.0059 1.0043 1.0037 1.0063 1.0062 1.0041 1.0068 1.0023Standard deviation 0.0026 0.0024 0.0022 0.0050 0.0024 0.0032 0.0023 0.0039 0.0024
Max. dev. 1.0059 1.0043 1.0063 1.0068Avg. max. dev. 1.0055 1.0040 1.0062 1.0044Avg. st. dev. 0.0025 0.0036 0.0028 0.0029
Frequency (entireperiod, in %) ofgold point violation 2.7 3.7 1.4 0.0 4.7 6.6 0.0 n.a. n.a.xr > 1.0060 0.0 0.0 0.0 0.0 0.3 0.5 0.0 0.3 0.0xr > 1.0100 0.0 0.0 0.0 0.0 0.0 0.0 0.0 0.0 0.0
Frequency (reducedperiod, in %) ofgold point violation 0.0 0.0 0.0 0.0 1.7 2.9 0.0 n.a. n.a.xr > 1.0060 0.0 0.0 0.0 0.0 0.0 0.3 0.0 0.3 0.0xr > 1.0100 0.0 0.0 0.0 0.0 0.0 0.0 0.0 0.0 0.0
Time span ofxr availability
1877m101914m6
1877m101914m6
1880m11913m12
1877m101914m6
1880m11913m12
1876m11914m6
1880m11913m12
1875m11914m7
1875m11914m7
Belgium Sweden NorwayXR w.r.t. England France Germany England France Germany England France Germany
Maximum deviation 1.0098 1.0057 1.0119 1.0116 1.0111 1.0057 1.0116 1.0125 1.0069Standard deviation 0.0029 0.0016 0.0031 0.0024 0.0029 0.0012 0.0025 0.0034 0.0014
Max. dev. 1.0119 1.0116 1.0125Avg. max. dev. 1.0091 1.0095 1.0103Avg. st. dev. 0.0025 0.0022 0.0024
Frequency (entireperiod, in %) ofgold point violation n.a. n.a. n.a. n.a. n.a. n.a. n.a. n.a. n.a.xr > 1.0060 10.3 0.0 11.8 4.2 4.2 0.0 5.1 11.4 0.3xr > 1.0100 7.1 0.0 12.1 0.5 0.5 0.0 0.5 0.8 0.0
Frequency (reducedperiod, in %) ofgold point violation n.a. n.a. n.a. n.a. n.a. n.a. n.a. n.a. n.a.xr > 1.0060 0.0 0.0 0.3 0.3 1.1 0.0 0.9 3.7 0.0xr > 1.0100 0.0 0.0 0.3 0.0 0.0 0.0 0.0 0.0 0.0
Time span ofxr availability
1880m11913m12
1877m11913m12
1877m11913m12
1875m11914m6
1875m11914m6
1873m31914m6
1873m11914m6
1881m11914m6
1877m11914m6

34
Austria-Hungary Italy RomaniaXR w.r.t. England France German. England France German. England France German.
Maximum deviation 1.0110 1.0136 1.0085 1.0277 1.0283 1.0283 1.0527 1.0512 1.0490Standard deviation 0.0035 0.0033 0.0028 0.0071 0.0064 0.0074 0.0066 0.0069 0.0063
Max. dev. 1.0136 1.0283 1.0527Avg. max. dev. 1.0110 1.0281 1.0509Avg. st. dev. 0.0032 0.0070 0.0066
Frequency (entireperiod, in %) ofgold point violation 7.0 n.a. n.a. n.a. n.a. n.a. n.a. n.a. n.a.xr > 1.0060 8.4 8.4 2.8 31.7 28.3. 21.7 28.4 33.4 30.0xr > 1.0100 1.4 3.7 0.0 12.5 14.2 10.8 14.5 16.3 13.1
Frequency (reducedperiod, in %) ofgold point violation 0.0 n.a. n.a. n.a. n.a. n.a. n.a. n.a. n.a.xr > 1.0060 0.0 0.7 0.0 30.7 24.0 14.7 17.7 23.1 22.2xr > 1.0100 0.0 0.0 0.0 5.3 8.0 0.0 5.0 6.8 7.2
Time span ofxr availability
1896m31914m6
1896m31914m6
1896m31914m6
1904m11913m12
1904m11913m12
1904m11913m12
1882m71913m12
1882m71913m12
1882m71913m12
Bulgaria SerbiaXR w.r.t. England France German. France
Maximum deviation 1.0115 1.0128 1.0102 1.0390Standard deviation 0.0042 0.0036 0.0044 0.0094
Max. dev. 1.0128Avg. max. dev. 1.0115Avg. st. dev. 0.0040
Frequency (entireperiod, in %) ofgold point violation n.a. n.a. n.a. n.a.xr > 1.0060 12.3 12.3 4.9 40.0xr > 1.0100 2.5 2.5 1.2 23.8
Frequency (reducedperiod, in %) ofgold point violation n.a. n.a. n.a. n.a.xr > 1.0060 17.7 13.7 7.8 40.0xr > 1.0100 3.9 3.9 2.0 14.0
Time span ofxr availability
1906m11912m9
1906m11912m9
1906m11912m9
1905m71912m9
Note: Calculations relate to the estimation period in chapter 2 or, in the case of Bulgaria and Serbia, to the period ofgold standard adherence (1/1906-9/1912 and 7/1905-9/1912, respectively). The reduced period excludes October 1899 –July 1901 (Boer war), October 1906 – February 1909 (crisis of 1907) and September 1912 – December 1913 (Balkanwars). The crisis of 1907 is often reduced to the American Banking crisis of late 1907 and early 1908, even though ithad begun the year before and its reverberations were felt until early 1909 (Kindleberger, pp. 119-120).
Sources: Gold export point estimates: England/France/Germany: Morgenstern, Oskar. International FinancialTransactions and Business Cycles. Princeton: Princeton University Press, 1959, pp. 178-81; England/Netherlands andEngland/Austria-Hungary: Easton, H. T. Tate's Modern Cambist. London: Effingham Wilson, 1912, pp. 358-63. Forexchange-rate data cf. appendix.

35
TABLE 2
DISCOUNT RATE STATISTICSDiscount rate1883 - 1913
Discount rate1896 - 1913
Discount rate1904 - 1913
Discount rate changes
Official Private Official Private Official Private Total Per annumCore countries
England 3.36 2.71 3.58 3.09 3.73 3.27 194 5.7France 2.92 2.46 2.98 2.58 3.20 2.65 19 0.8Germany 4.15 3.17 4.50 3.60 4.75 3.78 115 3.4Netherlands 3.21 2.82 3.53 3.15 3.76 3.29 67 2.0Belgium 3.40 2.83 3.66 3.04 3.93 3.37 98 2.7
Average 3.41 2.80 3.65 3.09 3.88 3.27 2.9
Peripheral countriesSweden 4.69 5.02 5.07 62 1.7Norway 4.75 5.07 5.01 60 1.8Austria-Hungary 4.25 3.85 4.30 3.93 4.44 4.08 25 1.4Italy 4.75 4.39 4.46 43 4.3Romania 5.47 5.55 5.21 26 0.8Bulgaria 7.61 7.35 6.95 2 0.3Serbia 6.87 6.71 6.08 4 0.6
Average periphery on gold 4.97 4.99 4.84 1.6Average periphery 5.48 5.48 5.32
Note: The number of discount rate changes relates to the estimation period in chapter 3 or, in the case of Bulgaria andSerbia, to the period of gold standard adherence (1/1906-9/1912 and 7/1905-9/1912, respectively). Entries in italicsrefer to countries that were not on gold during the entire period.
Sources: Cf. data appendix.
TABLE 3
COVER RATIOSCover ratio
Average (%) Minimum (%) Maximum (%) St. deviationCore countries
England 46.7 28.0 71.2 0.073France 74.1 58.4 86.1 0.051Germany 56.5 30.1 75.4 0.097Netherlands 62.9 45.8 80.4 0.073Belgium 39.7 29.9 49.5 0.036
Average 56.0 38.4 72.5 0.066
Peripheral countriesSweden 74.6 50.0 137.7 0.145Norway 69.4 51.4 87.1 0.072Austria-Hungary 79.2 54.5 98.0 0.098Italy 75.0 66.1 84.3 0.041Romania 51.8 38.3 76.7 0.077Bulgaria 68.8 45.0 99.7 0.149Serbia 68.4 50.0 88.4 0.093
Average periphery 69.6 50.8 96.0 0.096
Note: Calculations relate to the estimation period in chapter 3 or, in the case of Bulgaria and Serbia, to the period ofgold standard adherence (1/1906-9/1912 and 7/1905-9/1912, respectively).
Source: Cf. data appendix.

36
TABLE 4
DETERMINANTS OF ACTUAL DISCOUNT RATE CHANGES
England France Germany Netherlands Belgium
α0 Intercept 1.82 *** 2.54 ***
α1 Cover ratio: level in m-1 -2.92 *** -3.52 ***
α2 Cover ratio: change m-2 to m-1 -7.85 **
ß1 xr deviation in m-1 vis-à-vis England 70.15 *** 69.70 ***
ß2 xr deviation in m-1 vis-à-vis France 57.17 *** 77.35 *
ß3 xr deviation in m-1 vis-à-vis Germany 44.79 *** 65.78 ***
γ1 English bank rate: change d-31 to d-1 0.31 *** 0.56 ***
γ2 French bank rate: change d-31 to d-1 0.71 ***
γ3 German bank rate: change d-31 to d-1 0.54 *** 0.30 ***
R2 0.34 0.77 0.42 0.57 0.20N 194 16 115 65 98
Sweden NorwayAustria-Hungary
Italy Romania
α0 Intercept 1.00 3.19 *
α1 Cover ratio: level in m-1 -0.20 ** -1.74 * -4.28 *
α2 Cover ratio: change m-2 to m-1 -10.84 *** -11.89 *** -4.30 ** -11.27 ***
ß1 xr deviation in m-1 vis-à-vis England 42.8 **
ß2 xr deviation in m-1 vis-à-vis Franceß3 xr deviation in m-1 vis-à-vis Germany 88.78 ***
γ1 English bank rate: change d-31 to d-1 0.27 *** 0.63 ***
γ2 French bank rate: change d-31 to d-1 0.29 *
γ3 German bank rate: change d-31 to d-1 0.24 *** 0.37 *** 0.33 ***
R2 0.48 0.47 0.42 0.49 0.54N 62 60 25 43 26Notes: We report Newey-West heteroskedasticity and autocorrelation consistent standard errors.* = Significant at the 10 percent level.** = Significant at the 5 percent level.*** = Significant at the 1 percent level.Sources: Own calculations based on sources as described in the appendix.

37
TABLE 5
DETERMINANTS OF MONTHLY DISCOUNT RATE BEHAVIOURMARGINAL EFFECTS1
England France Germany Netherlands Belgium
δ1 Cover ratio: level in m-1 -0.46 **
δ2 Cover ratio: change m-2 to m-1 -0.60 * -0.56 *** -0.34 ** -0.52 *
ε1 xr deviation in m-1 vis-à-vis England 8.55 * 9.84 ***
ε2 xr deviation in m-1 vis-à-vis France 14.37 ** 9.90 *
ε3 xr deviation in m-1 vis-à-vis Germany 12.21 ** 9.40 ***
ζ1 English bank rate: change m-2 to m-1 0.01 ** 0.09 *** 0.04 *
ζ2 French bank rate: change m-2 to m-1
ζ3 German bank rate: change m-2 to m-1 0.12 *** 0.05 ** 0.04
Pseudo-R2 0.05 0.10 0.04 0.16 0.03DW2 1.92 2.44 1.96 1.98 2.18N 406 298 406 398 440
Sweden NorwayAustria-Hungary
Italy Romania
δ1 Cover ratio: level in m-1 -0.11 **
δ2 Cover ratio: change m-2 to m-1 -1.88 *** -1.99 *** -3.42 *** -0.45 ***
ε1 xr deviation in m-1 vis-à-vis Englandε2 xr deviation in m-1 vis-à-vis Franceε3 xr deviation in m-1 vis-à-vis Germany
ζ1 English bank rate: change m-2 to m-1 0.06 *** 0.07 ***
ζ2 French bank rate: change m-2 to m-1
ζ3 German bank rate: change m-2 to m-1 0.08 *** 0.10 *** 0.12 *** 0.22 **
Pseudo-R2 0.09 0.12 0.13 0.12 0.11DW2 2.15 2.18 1.91 1.98 2.18N 430 394 214 120 3751 Differential effects (to +1%) for the bank rate as a discontinuous variable.2 Values taken from the corresponding OLS regression.
Notes: We report Huber-White quasi-maximum likelihood (QML) standard errors.* = Significant at the 10 percent level.** = Significant at the 5 percent level.*** = Significant at the 1 percent level.
Sources: Own calculations based on sources as described in the appendix.

38
TABLE 6
DETERMINANTS OF ACTUAL DISCOUNT RATE CHANGES (POOLED)
Estimation 3A: core countries pooled (country fixed-effects, N = 482)
Method(weights)
Pooled Least Squares(no weights)
Pooled EGLS(cross-section weights)
Coefficientcovariances
Std. Cross-section
SUR
PeriodXXSURXX
Std. XX
α0 Intercept 0.11 0.12α1 Cover ratio: level in m-1 -0.20 -0.22α2 Cover ratio: change m-2 to m-1 -2.40 *** *** *** -2.58 ***
β xr dev. in m-1 vis-à-vis England,France and Germany (pca-series)
58.14 *** *** *** 59.21 ***
γ1 English bank rate: change d-31 to d-1 0.34 *** *** *** 0.34 ***
γ2 French bank rate: change d-31 to d-1 0.10 0.09γ3 German bank rate: change d-31 to d-1 0.27 *** *** * 0.20 ***
R2 0.34 0.38
Estimation 3B: peripheral countries pooled (country fixed-effects, N = 214)
Method(weights)
Pooled Least Squares(no weights)
Pooled EGLS(cross-section weights)
Coefficientcovariances
Std. Cross-section
SUR
PeriodXXSURXX
Std. XX
α0 Intercept 0.58 * * *** 0.58 **
α1 Cover ratio: level in m-1 -0.86 * * *** -0.86 **
α2 Cover ratio: change m-2 to m-1 -2.58 ** ** -2.88 *
β xr dev. in m-1 vis-à-vis England,France and Germany (pca-series)
-0.33 3.36
γ1 English bank rate: change d-31 to d-1 0.09 1 2X 0.09 3XXXXXXX
γ2 French bank rate: change d-31 to d-1 0.07 0.00γ3 German bank rate: change d-31 to d-1 0.37 *** *** *** 0.37 ***
R2 0.36 0.391 p-value: 15.0%; 2 p-value: 12.3%; 3 p-value: 13.1%.
Estimation 3C: all countries pooled (country fixed-effects, N = 696)
Method(weights)
Pooled Least Squares(no weights)
Pooled EGLS(cross-section weights)
Coefficientcovariances
Std. Cross-section
SUR
PeriodXXSURXX
Std. XX
α0 Intercept 0.23 2 0.25 3
α1 Cover ratio: level in m-1
Group-specific regressor core -0.19 -0.24Group-specific regressor periphery -0.74 1 * ** -0.76 *
α2 Cover ratio: change m-2 to m-1 -2.51 *** *** *** -2.64 ***
β xr dev. in m-1 vis-à-vis England,France and Germany (pca-series)
Group-specific regressor core 58.64 *** *** *** 60.03 ***
Group-specific regressor periphery 1.88 5.12
γ1 English bank rate: change d-31 to d-1 0.26 *** *** *** 0.25 ***
γ2 French bank rate: change d-31 to d-1 0.08 0.04γ3 German bank rate: change d-31 to d-1 0.27 *** *** ** 0.24 ***
R2 0.33 0.371 p-value: 14.9%; 2 p-value: 19.5%; 3 p-value: 17.7%.

39
TABLE 7
DETERMINANTS OF MONTHLY DISCOUNT RATE BEHAVIOUR (POOLED)
Estimation 4A: core countries pooled (country fixed-effects, N = 1941)
Method(weights)
Pooled Least Squares(no weights)
Pooled EGLS(cross-section weights)
Coefficientcovariances
Std. Cross-section
SUR
PeriodXXSURXX
Std. XX
δ0 Intercept -0.05 -0.04δ1 Cover ratio: level in m-1 0.09 0.08δ2 Cover ratio: change m-2 to m-1 -0.99 *** *** *** -1.06 ***
ε xr dev. in m-1 vis-à-vis England,France and Germany (pca-series)
17.86 *** *** *** 9.64 ***
ζ1 English bank rate: change m-2 to m-1 0.06 *** *** ** 0.05 ***
ζ2 French bank rate: change m-2 to m-1 -0.05 -0.03ζ3 German bank rate: change m-2 to m-1 0.04 1 2 3 0.00
R2 0.04 0.04DW 1.91 1.99
1 p-value: 11.6%; 2 p-value: 18.9%; 3 p-value: 19.9%.
Estimation 4B: peripheral countries pooled (country fixed-effects, N = 1518)
Method(weights)
Pooled Least Squares(no weights)
Pooled EGLS(cross-section weights)
Coefficientcovariances
Std. Cross-section
SUR
PeriodXXSURXX
Std. XX
δ0 Intercept 0.09 * ** ** 0.09 **
δ1 Cover ratio: level in m-1 -0.12 * ** * -0.12 **
δ2 Cover ratio: change m-2 to m-1 -0.71 *** *** * -0.60 ***
ε xr dev. in m-1 vis-à-vis England,France and Germany (pca-series)
-0.52 -0.46
ζ1 English bank rate: change m-2 to m-1 0.04 *** *** ** 0.03 ***
ζ2 French bank rate: change m-2 to m-1 0.01 0.01ζ3 German bank rate: change m-2 to m-1 0.07 *** *** ** 0.07 ***
R2 0.05 0.05DW 1.92 1.95
Estimation 4C: all countries pooled (country fixed-effects, N = 3459)
Method(weights)
Pooled Least Squares(no weights)
Pooled EGLS(cross-section weights)
Coefficientcovariances
Std. Cross-section
SUR
PeriodXXSURXX
Std. XX
δ0 Intercept 0.02 0.02δ1 Cover ratio: level in m-1
Group-specific regressor core 0.07 0.04Group-specific regressor periphery -0.11 1 * 2 -0.11 *
δ2 Cover ratio: change m-2 to m-1 -0.90 *** *** *** -0.79 ***
ε xr dev. in m-1 vis-à-vis England,France and Germany (pca-series)
Group-specific regressor core 17.92 *** *** *** 9.36 ***
Group-specific regressor periphery -0.48 -0.62
ζ1 English bank rate: change m-2 to m-1 0.05 *** *** *** 0.04 ***
ζ2 French bank rate: change m-2 to m-1 -0.02 0.00ζ3 German bank rate: change m-2 to m-1 0.05 *** ** *** 0.04 ***
R2 0.04 0.04DW 1.92 1.97
1 p-value: 22.3%; 2 p-value: 21.7%.
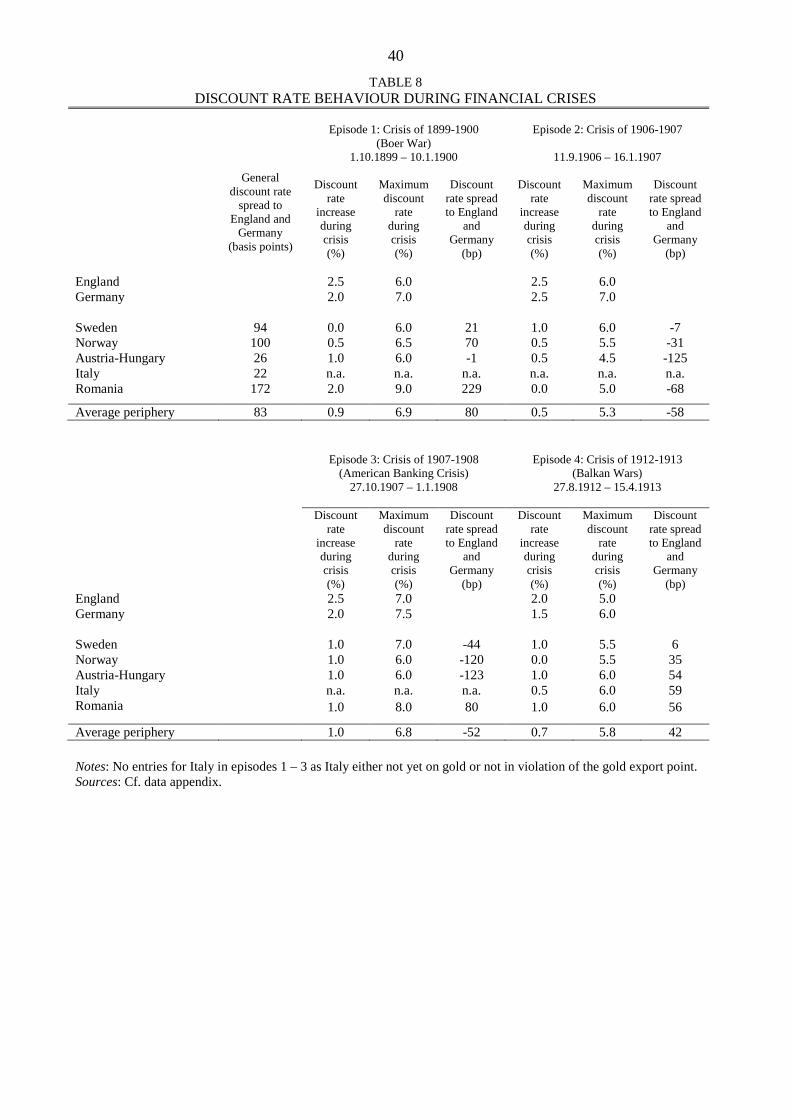
40
TABLE 8
DISCOUNT RATE BEHAVIOUR DURING FINANCIAL CRISES
Generaldiscount rate
spread toEngland and
Germany(basis points)
Episode 1: Crisis of 1899-1900(Boer War)
1.10.1899 – 10.1.1900
Episode 2: Crisis of 1906-1907
11.9.1906 – 16.1.1907
Discountrate
increaseduringcrisis(%)
Maximumdiscount
rateduringcrisis(%)
Discountrate spreadto England
andGermany
(bp)
Discountrate
increaseduringcrisis(%)
Maximumdiscount
rateduringcrisis(%)
Discountrate spreadto England
andGermany
(bp)
England 2.5 6.0 2.5 6.0Germany 2.0 7.0 2.5 7.0
Sweden 94 0.0 6.0 21 1.0 6.0 -7Norway 100 0.5 6.5 70 0.5 5.5 -31Austria-Hungary 26 1.0 6.0 -1 0.5 4.5 -125Italy 22 n.a. n.a. n.a. n.a. n.a. n.a.Romania 172 2.0 9.0 229 0.0 5.0 -68
Average periphery 83 0.9 6.9 80 0.5 5.3 -58
Episode 3: Crisis of 1907-1908(American Banking Crisis)
27.10.1907 – 1.1.1908
Episode 4: Crisis of 1912-1913(Balkan Wars)
27.8.1912 – 15.4.1913
Discountrate
increaseduringcrisis(%)
Maximumdiscount
rateduringcrisis(%)
Discountrate spreadto England
andGermany
(bp)
Discountrate
increaseduringcrisis(%)
Maximumdiscount
rateduringcrisis(%)
Discountrate spreadto England
andGermany
(bp)England 2.5 7.0 2.0 5.0Germany 2.0 7.5 1.5 6.0
Sweden 1.0 7.0 -44 1.0 5.5 6Norway 1.0 6.0 -120 0.0 5.5 35Austria-Hungary 1.0 6.0 -123 1.0 6.0 54Italy n.a. n.a. n.a. 0.5 6.0 59Romania 1.0 8.0 80 1.0 6.0 56
Average periphery 1.0 6.8 -52 0.7 5.8 42
Notes: No entries for Italy in episodes 1 – 3 as Italy either not yet on gold or not in violation of the gold export point.Sources: Cf. data appendix.
42
Bagehot, W. Lombard Street. A Description of the Money Market. 6th ed. London: Kegan Paul,1878.
Bloomfield, A.I. Monetary Policy under the International Gold Standard, 1880-1914. New York:Federal Reserve Bank of New York, 1959.
Bordo, M.D., and M. Flandreau. "Core, periphery, exchange rate regimes, and globalization." InGlobalization in historical perspective, edited by M.D. Bordo, Taylor, A.M. andWilliamson, J.G., 417-72. Chicago: University of Chicago Press, 2003.
Bordo, M.D., and R. MacDonald. "Interest Rate Interactions in the Classical Gold Standard, 1880-1914: Was there any Monetary Independence?" Journal of Monetary Economics 52 (2005):307-27.
Bordo, M.D., and H. Rockoff. "The Gold Standard as a 'Good Housekeeping Seal of Approval'."Journal of Economic History 56 (1996): 389-428.
Canjels, E., G. Prakash-Canjels, and A.M. Taylor. "Measuring market integration: foreignexchange-arbitrage and the gold standard, 1879-1913." Review of Economics and Statistics86 (2004): 868-82.
Capie, F. "Banking in Europe in the Nineteenth and Twentieth Centuries: The Role of the CentralBank." In The State, the Financial System and Economic Modernization, edited by R. Sylla,Tilly, R. and Tortella, G., 118-33. Cambridge: Cambridge University Press, 1999.
Capie, F.H., and A. Webber. A Monetary History of the United Kingdom. 1870-1982. Volume 1.Data, sources, and methods. London, New York: Routledge, 1995.
Contamin, R. "Interdépendences financières et dilemma de politique monétaire: la Banque deFrance entre 1880 et 1913." Revue Economique 54 (2003): 157-80.
Contamin, R., and C. Denise. "Quelle autonomie pour les politiques monétaires sous l'étalon-or,1880-1913?" Economie Internationale. La Revue di CEPII 78 (1999): 59-84.
Davutyan, N., and W. Parke. "The Operations of the Bank of England, 1890-1908: A DynamicProbit Approach." Journal of Money, Credit and Banking 27 (1995): 1099-112.
de Cecco, M. Money and Empire: The International Gold Standard, 1890-1914. Oxford: Blackwell,1974.
de Jong, A.M. Geschiedenes van de Nederlandsche Bank. 2nd ed. Haarlem 1967.de Mattia, R. I bilanci degli istituti di emissione italiani dal 1845 al 1936, altre serie storiche di
interesse monetario e fonti. Vol. 2, Banca d'Italia: Studi e ricerche sulla moneta. Rome1967.
Denzel, M.A. "The European Bill of Exchange. Its Development from the Middle Ages to 1914." InCashless Payments and Transactions from the Antiquity to 1914, edited by S. Chaudhuri andDenzel, M.A., 153-94. Stuttgart: Franz Steiner Verlag, 2008.
Dutton, J. "The Bank of England and the Rules of the Game under the International Gold Standard:New Evidence." In A Retrospective on the Classical Gold Standard, 1821-1931, edited byM.D. Bordo and Schwartz, A.J., 173-202. Chicago: Chicago University Press, 1984.
Eichengreen, B. "Central bank cooperation and exchange rate commitments: the classical andinterwar gold standards compared." Financial History Review 2 (1995): 99-117.
———. "Conducting the International Orchestra: Bank of England Leadership under the ClassicalGold Standard." Journal of International Money and Finance 6 (1987): 5-29.
Eichengreen, B., M. Watson, and R.S. Grossman. "Bank Rate Policy under the Interwar GoldStandard: A Dynamic Probit Model." Economic Journal 95 (1985): 725-45.
Esteves, R., and D. Khoudour-Castéras. "A Fantastic Rain of Gold: European Migrants'Remittances and Balance of Payments Adjustment During the Gold Standard Period."Journal of Economic History 69 (2009): 951-85.

43
Esteves, R., J. Reis, and F. Ferramosca. "Market Integration in the Golden Periphery: TheLisbon/London Exchange, 1854-1891." Explorations in Economic History 46 (2009): 324-45.
Flandreau, M. "Central Bank Cooperation in Historical Perspective: A Sceptical View." EconomicHistory Review 50 (1998).
Flandreau, M., and C. Jobst. "The ties that divide: a network analysis of the international monetarysystem, 1890-1910." Journal of Economic History 65 (2005): 977-1007.
Ford, A.G. Britain and Argentina. Oxford: Clarendon Press, 1962.Fratianni, M., and F. Spinelli. Storia Monetaria d'Italia. Lira e politica monetaria dall'Unità
all'Unione Europea. 2nd ed. Milan: Mondadori, 2001.Giovannini, A. "'Rules of the Game' during the International Gold Standard: England and
Germany." Journal of International Money and Finance 5 (1986): 467-83.Goodhart, C.A.E. The Business of Banking, 1891-1914. London 1972.Hallwood, C.P., R. MacDonald, and I.W. Marsh. "Credibility and fundamentals: Were the Classical
and Interwar Gold Standards Well-Behaved Target Zones?" In Modern Perspectives on theGold Standard, edited by T. Bayoumi, Eichengreen, B. and Taylor, M.P., 129-61.Cambridge: Cambridge University Press, 1996.
Hawtrey, R.G. A Century of Bank Rate. 2nd ed. London: Longmans Green & Co., 1962.Hemetsberger-Koller, H. "Die suspendierte Goldkonvertibilität. Barzahlungskrise in Österreich-
Ungarn zu Beginn des 20. Jahrhunderts." In Auf Heller und Cent. Beiträge zur Finanz- undWährungsgeschichte, edited by K. Bachinger and Stiefel, D., 185-219. Frankfurt, Vienna:Überreuter, 2001.
Jobst, C. "Market Leader: The Austro-Hungarian Bank and the Making of Foreign ExchangeIntervention, 1896-1913." European Review of Economic History 13 (2009): 287-318.
Kauch, P. La Banque Nationale de Belgique. 1850-1918. Brussels: Banque Nationale de Belgique,1950.
Khoudour-Castéras, D. International Adjustment During the Classical Gold Standard: TheMigration Nexus, Working Paper Chaire Finances Internationales, Science Po. Paris 2005.
Lindert, P.H. Key Currencies and Gold. 1900-1913, Princeton Studies in International Finance 24.Princeton 1969.
Lόpez-Cόrdova, J.E., and C.M. Meissner. "Exchange-Rate Regimes and International Trade: Evidence from the Classical Gold Standard Era." American Economic Review 93 (2003):344-53.
Martín Aceña, P., and J. Reis, eds. Monetary Standards in the Periphery: Paper, Silver, and Gold.1854-1933. London, New York: MacMillan Press, St. Martin's Press, 2000.
Monetary Time Series of Southeastern Europe from the 1870s to 1914. Bank of Greece WorkingPaper Nr. 94. Athens 2009.
Morys, M. "The Classical Gold Standard in the European Periphery: A Case Study of Austria-Hungary and Italy, 1870-1913." PhD Diss., London School of Economics, 2006.
Neal, L., and M.D. Weidenmier. "Crises in the Global Economy from Tulips to Today: Contagionand Consequences." In Globalization in Historical Perspective, edited by M.D. Bordo,Taylor, A.M. and Williamson, J.G., 473-514, 2003.
Obstfeld, M., J.C. Shambaugh, and A.M. Taylor. "The Trilemma in History: Tradeoffs amongExchange Rates, Monetary Policies, and Capital Mobility." Review of Economics andStatistics 87 (2005): 423-38.
Ögren, A., and L.F. Oksendal, eds. The gold standard peripheries: monetary policy, adjustment andflexibility in a global setting. London: Palgrava Macmillan, 2012.
Pippenger, J. "Bank of England Operations, 1893-1913." In A Retrospective on the Classical GoldStandard, 1821-1931, edited by M.D. Bordo and Schwartz, A.J., 203-32. Chicago: ChicagoUniversity Press, 1984.
Reichsbank. Vergleichende Notenbank-Statistik. Organisation und Geschäftsverkehr wichtigereuropäischer Notenbanken 1876-1913 statistisch dargestellt. Berlin: Reichsdruckerei, 1925.

44
Reis, J. "An "Art" and not a "Science"? Central Bank Management in Portugal under the GoldStandard, 1863-1887." Economic History Review 60 (2007): 712-41.
Reti, S.P. Silver and Gold: The Political Economy of International Monetary Conferences. 1867-1892. Westport (CT), London: Greenwood, 1998.
Schneider, J., O. Schwarzer, and P. Schelzer. Statistik der Gold- und Wechselkurse in Deutschlandund im Ostseeraum, 18. und 19. Jahrhundert. Vol. 12, Quellen und Forschungen zurhistorischen Statistik von Deutschland. St. Katharinen 1993.
Schneider, J., O. Schwarzer, and F. Zellfelder. Europäische und nordamerikanische Devisenkurse1777-1914. 3 vols. Stuttgart: Steiner, 1991.
Spinelli, F. Per la storia monetaria dell'Italia. Vol. 2. Turin 1990.Tattara, G. "Paper money but a gold debt: Italy on the gold standard." Explorations in Economic
History 40 (2003): 122-42.———. "Was Italy Ever on Gold?" In Monetary Standards in the Periphery: Paper, Silver, and
Gold, 1854-1933, edited by P. Martín Acena and Reis, J., 18-68. London, New York:MacMillan Press, St. Martin's Press, 2000.
Tullio, G., and J. Walters. "Was London the Conductor of the International Orchestra, the SecondViolinist or the Triangle Player? A Survey of the Literature on Asymmetries in Balance ofPayments Adjustment during the Classical Gold Standard." Scottish Journal of PoliticalEconomy 43 (1996): 419-43.
Tullio, G., and J. Wolters. "Monetary policy in Austria-Hungary, 1876-1913: an econometricanalysis of the determinants of the central bank's discount rate and the liquidity ratio." OpenEconomy Review 18 (2007): 521-37.
———. The Objectives of British Monetary Policy during the Classical Gold Standard, 1876-1913:an econometric analysis of domestic and foreign determinants of bank rate,Diskussionsbeiträge des Fachbereichs Wirtschaftswissenschaft der Freien Universität Berlin,Nr. 13 2003.
———. The Objectives of French Monetary Policy during the Classical Gold Standard, 1876-1913: an econometric analysis of the determinants of the Banque de France's officialdiscount rate, Diskussionsbeiträge des Fachbereichs Wirtschaftswissenschaft der FreienUniversität Berlin, Nr. 12 2003.
———. The Objectives of German Monetary Policy during the Classical Gold Standard, 1876-1913: an econometric analysis of the determinants of the Reichsbank's discount rate,Diskussionsbeiträge des Fachbereichs Wirtschaftswissenschaft der Freien Universität Berlin,Nr. 14 2003.